Article

Accurate Output Forecasting Method for Various Photovoltaic Modules Considering Incident Angle and Spectral Change Owing to Atmospheric Parameters and Cloud Conditions

1
Faculty of Engineering, University of Miyazaki, Miyazaki 889-2192, Japan
2
Organization for Promotion of Tenure Track, University of Miyazaki, Miyazaki 889-2192, Japan
3
Toyota Technological Institute, Nagoya 468-8511, Japan
4
Sharp Corporation, Yamatokoriyama, Nara 639-1186, Japan
*
Author to whom correspondence should be addressed.
Appl. Sci. 2020, 10(2), 703; https://doi.org/10.3390/app10020703
Submission received: 11 December 2019 / Revised: 16 January 2020 / Accepted: 16 January 2020 / Published: 19 January 2020
(This article belongs to the Special Issue Solar Radiation: Measurements and Modelling, Effects and Applications)

Abstract

:
Because semiconductors absorb wavelengths dependent on the light absorption coefficient, photovoltaic (PV) energy output is affected by the solar spectrum. Therefore, it is necessary to consider the solar spectrum for highly accurate PV output estimation. Bird’s model has been used as a general spectral model. However, atmospheric parameters such as aerosol optical depth and precipitable water have a constant value in the model that only applies to clear days. In this study, atmospheric parameters were extracted using the Bird’s spectrum model from the measured global spectrum and the seasonal fluctuation of atmospheric parameters was examined. We propose an overcast spectrum model and calculate the all-weather solar spectrum from clear to overcast sky through linear combination. Three types of PV modules (fixed Si, two-axis tracking Si, and fixed InGaP/GaAs/InGaAs triple-junction solar cells) were installed at the University of Miyazaki. The estimated performance ratio (PR), which takes into account incident angle and spectral variations, was consistent with the measured PR. Finally, the energy yield of various PVs installed across Japan was successfully estimated.

1. Introduction

The theoretical efficiency of 29.43% in silicon-type solar cells is due to the relationship between the bandgap of the semiconductor material and the solar spectrum [1]. Currently, the world record for efficiency of a general silicon PV cell is 26.7% [2]. To further improve efficiency, it is necessary to utilize a wider range of the solar spectrum to reduce spectral mismatch. As a solution to this problem, there is a multijunction solar cell formed by laminating single-junction solar cell layers made of different materials. For example, in three-junction cells of InGaP/GaAs/InGaAs fabricated by SHARP, light of a wide wavelength range can be absorbed, leading to a high efficiency of 44.4% under concentration and 37.9% under nonconcentration [3,4].
The required energy is determined by the demands of the user side. To stabilize the supply of electric power, it is necessary to constantly match the required energy and supplied energy. Because PV is greatly affected by weather conditions such as water content, and turbidity, it is difficult to balance supply and demand with using PV. To solve these problems, it is necessary to estimate power with high accuracy.
Recently, various PV output forecasting models have been suggested. One well-known model is the power temperature coefficient model as described in [5], which assumes that the maximum power output is linear with irradiance at a given temperature and that the power temperature coefficient is a constant [6,7,8]. Among them, an output forecasting using an artificial neural network was proposed [9,10,11,12,13,14]. However, scattering and absorption of the solar spectrum by atmospheric conditions is not considered in these models. The outdoor performance of multijunction solar cells reflects the influence of this spectrum mismatch in the literature [15,16,17,18,19,20]. This is because the solar spectrum in the real environment is different from the standard reference spectrum. Each sub-cell in multijunction solar cells absorbs different wavelength of the solar spectrum, and the photocurrent changes with spectral variation. The output current in multijunction solar cells is limited by the smallest sub-cell, because the sub-cells are electrically connected in series; this phenomenon is called spectrum-mismatch.
In this paper, we propose a new PV output forecasting method including the extraction of atmospheric parameters and the calculation of the solar spectrum based on Bird’s spectral model [21], named the “Miyazaki Spectrum-to-Energy method” (MS2E). Bird’s spectral model has been adopted as the reference solar spectrum and has gained high trust. However, there are two problems with this spectral model. One is that atmospheric parameters are constants. Under standard test conditions (STC), for example, the aerosol optical depth (AOD) in a vertical path at 500 nm wavelength is 0.084, and the precipitable water amounts to 1.416 cm [22]. However, atmospheric parameter fluctuation greatly depends on place and season. Bird’s spectrum model is also adapted only for clear skies without clouds [21]. Spectrum scattering differs between sunny and cloudy conditions, so it is preferable to calculate the solar spectrum in consideration of the cloud conditions such as overcast skies and the possibility of rain.
To improve forecast accuracy, the fluctuation of atmospheric parameters and an overcast spectral model that assumed full cloud cover were applied to the method. The all-weather spectrum, including seasonal variability, was calculated by the linear combination of the clear spectrum and the overcast spectrum. After that, the short-circuit current (Isc), open-circuit voltage (Voc), and fill factor (FF) of various PVs were calculated, and the maximum power (Pout) was estimated. The accuracy of our PV output forecasting method was verified by comparing it with the measured value at the University of Miyazaki. Three types of PV modules (fixed silicon, two-axis tracking silicon, and fixed triple-junction) were assessed. We also considered the cross effect between spectrum and incident angle.

2. Methods

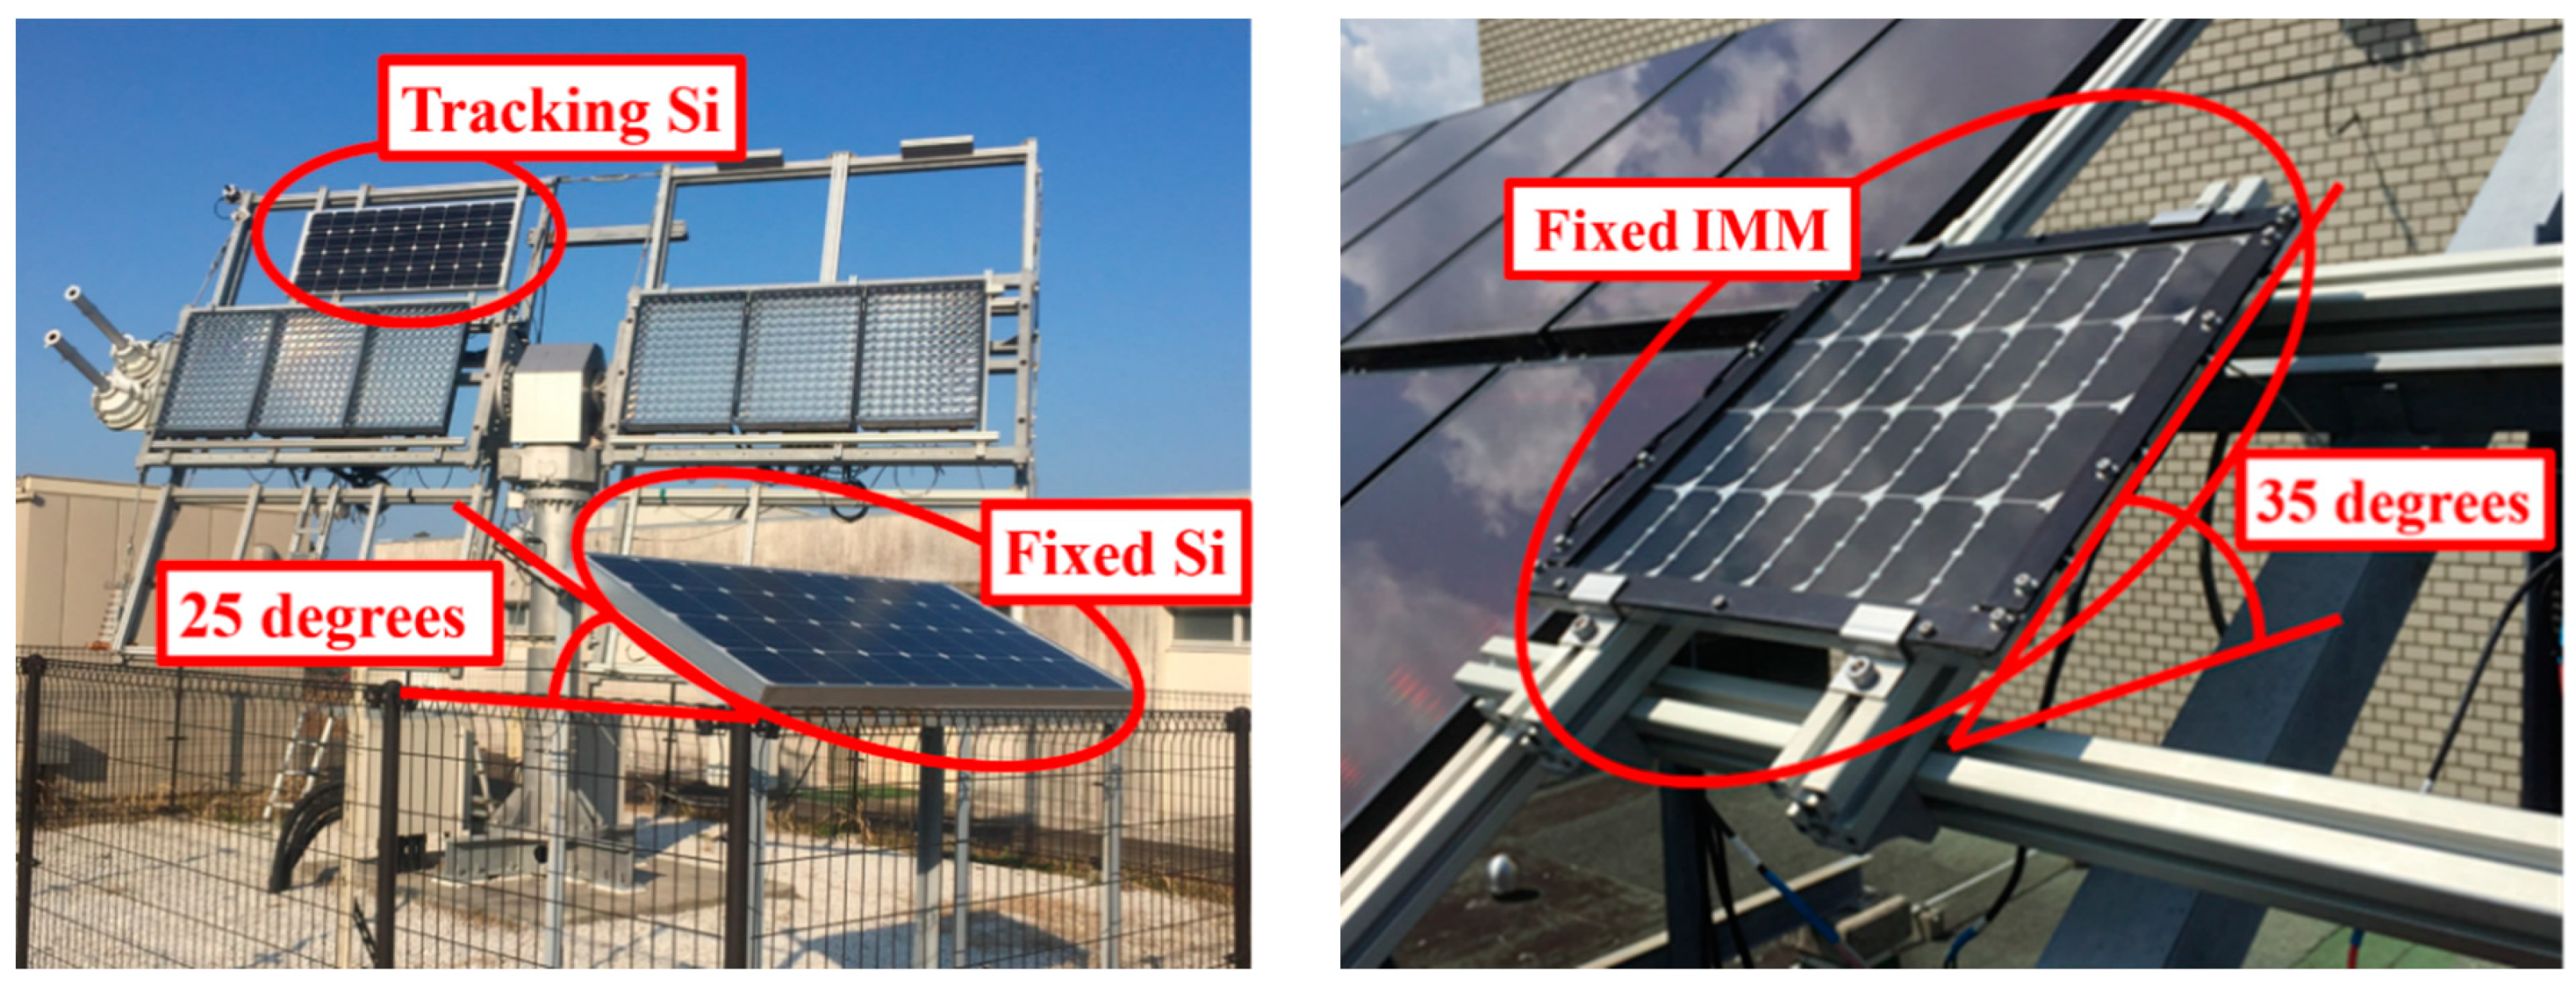
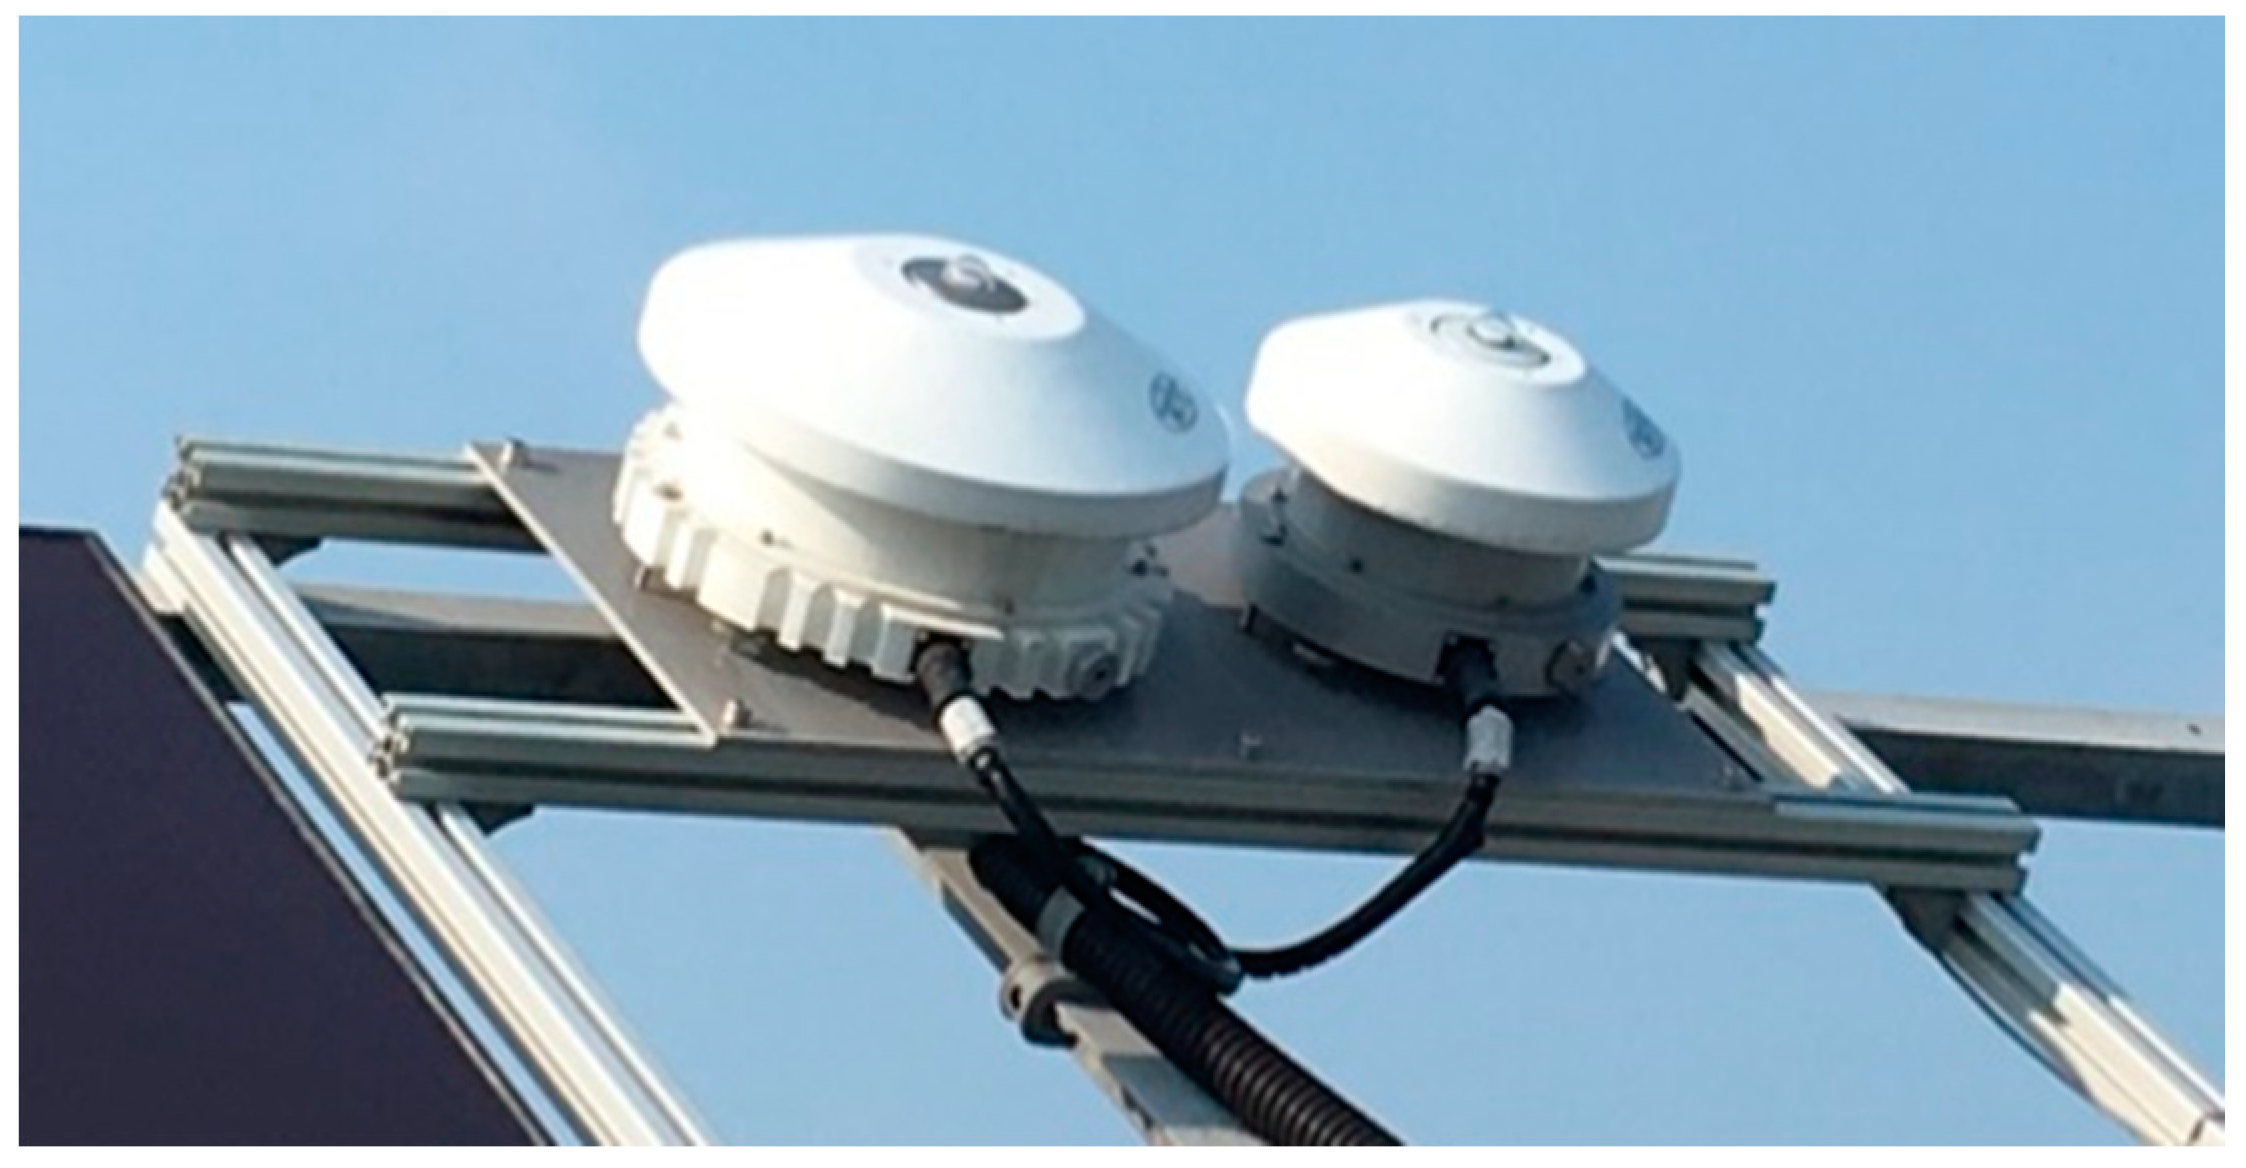
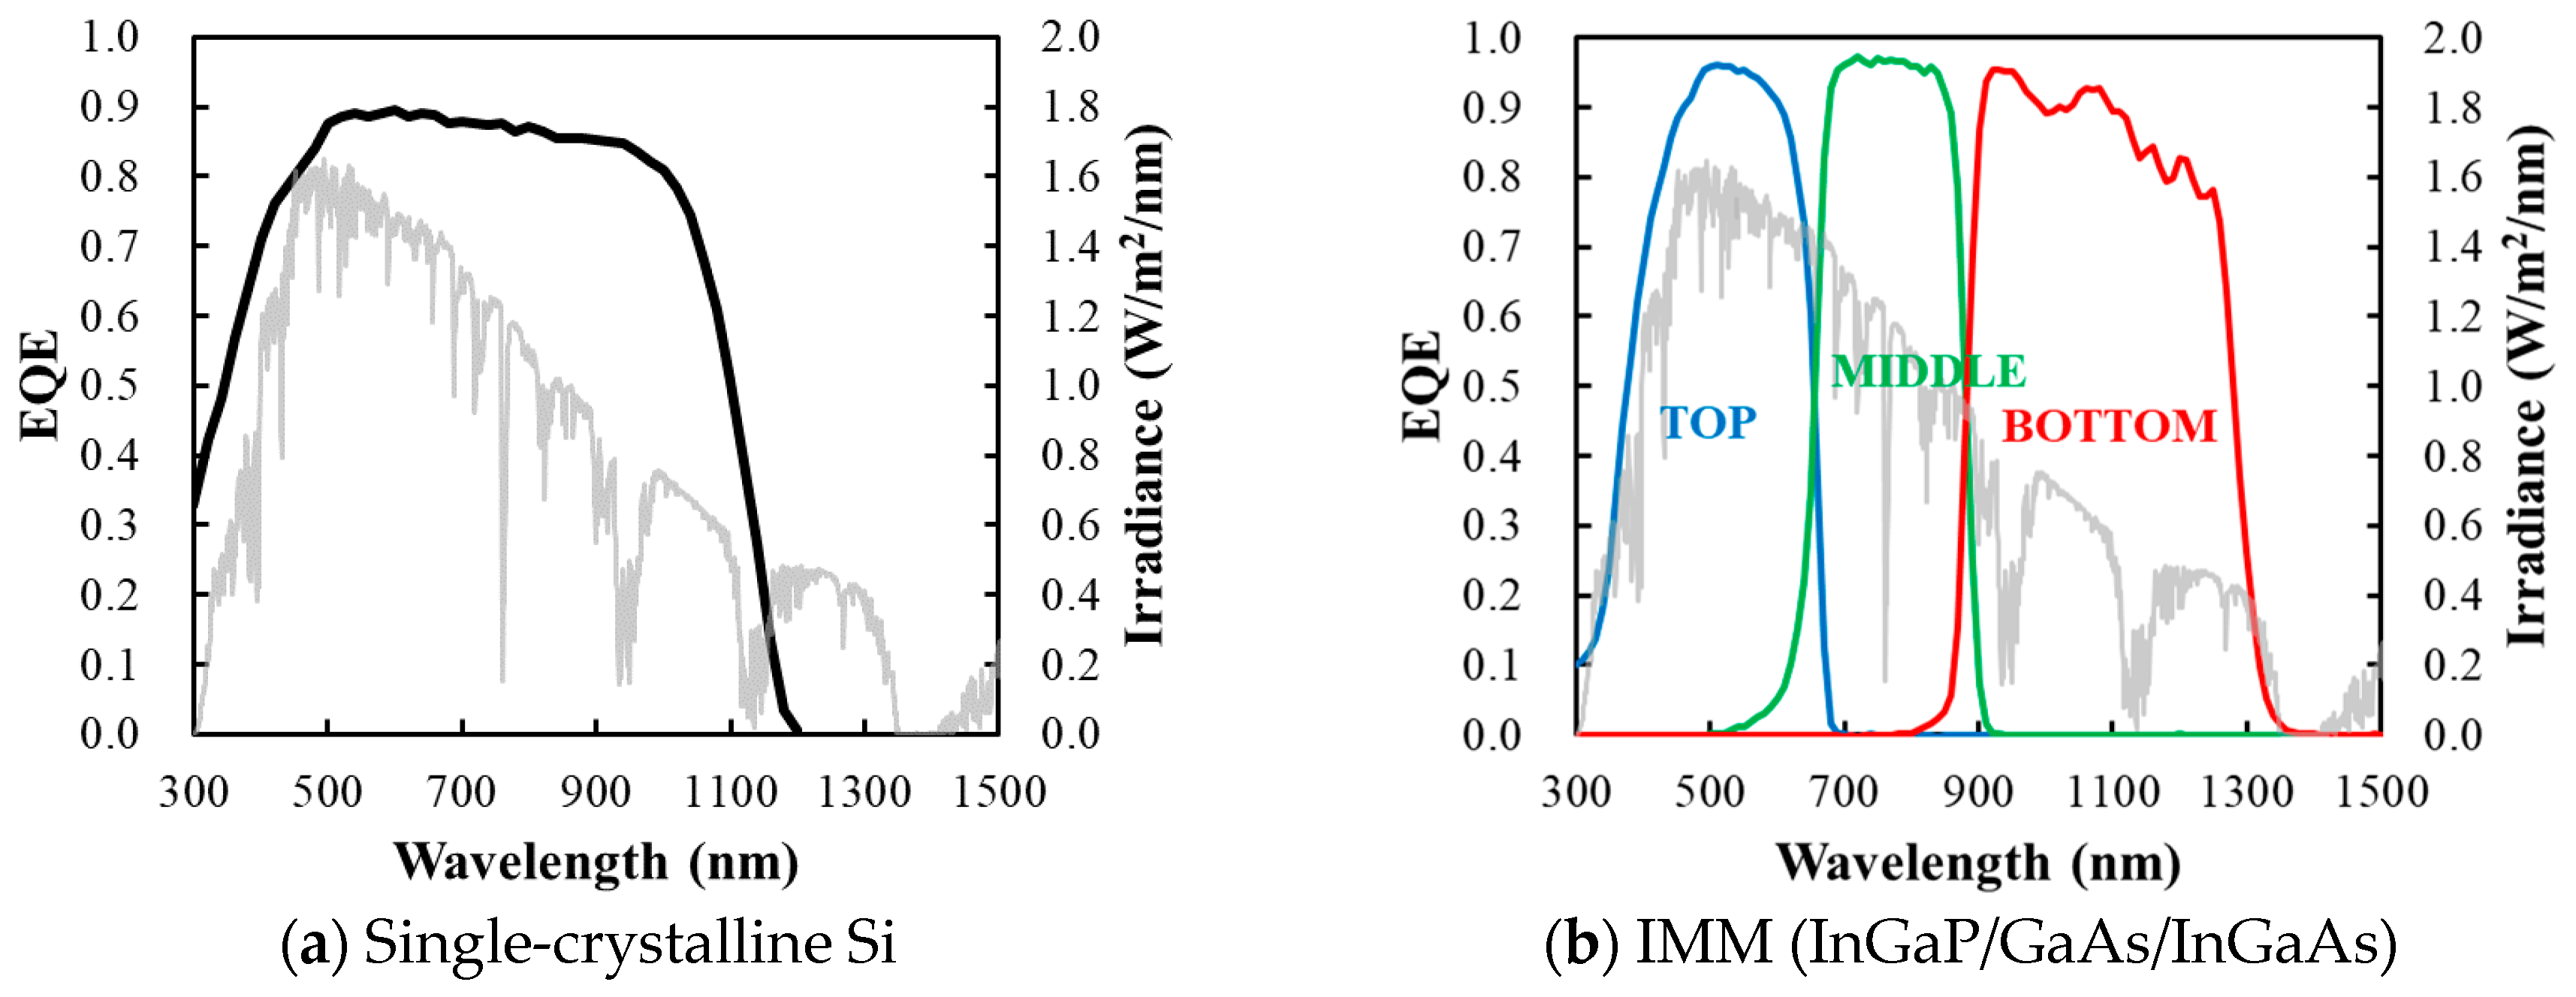
2.1. Measurement Data

The sub-module with InGaP/GaAs/InGaAs inverted metamorphic (IMM) triple-junction solar cell was fabricated by SHARP [23] and installed at the University of Miyazaki along with fixed and tracking silicon-PV modules (Si module, KIS AS-140), as shown in Figure 1. Output characteristics of these PV modules were measured using an I-V curve tracer. Pyranometers were installed on 25° (EKO MS-602) and 35° (EKO MS-411) inclined platforms to measure global irradiance. A pyranometer was also installed on a two-axis sun-tracking (EKO MS-602) to measure global normal irradiance. Measurements were carried out every 3 min from 5:30 a.m. to 6:30 p.m. for two years from 1 August 2016 to 31 July 2018. The solar spectrum was measured using spectro-radiometers (EKO MS-711, MS-712), as shown in Figure 2. They were installed on 35° inclined platforms. Measurements were made every 10 min from 5:00 a.m. to 8:00 p.m. for a year from 1 January 2017 to 31 December 2017.

2.2. Databases for Irradiance and Solar Spectrum

Meteorological test data for photovoltaic systems (METPV-11), which are part of a database including a summary of data from 837 sites in Japan for the past 20 years, are published by the New Energy and Industrial Technology Development Organization (NEDO) [24]. Each year is classified into three types: average irradiance year, little irradiance year, and much irradiance year. We used direct horizontal irradiance (DHI), scatter irradiance (SI), global horizontal irradiance (GHI), and ambient temperature (Tamb) from the METPV-11. Global tilted irradiance (GTI) and direct normal irradiance (DNI) were calculated by Hay’s model [25].
A solar spectrum database consisting of a summary of data from five sites in Japan for five years from 2011 to 2015 was also published by NEDO [26]. The spectro-radiometers were installed in Naganuma, Tosu, Tsukuba, Gifu, and Okinoerabu. Measurements were carried out every 10 min from 4:00 a.m. to 8:00 p.m.

2.3. How to Calculate the PV Output by MS2E Method

2.3.1. Extraction of Atmospheric Parameters

Sunlight undergoes various losses before reaching the ground surface. Among them, AOD mainly causes scattering and absorption of the short-wavelength range of the solar spectrum and precipitable water causes absorption of the long-wavelength range of the solar spectrum. The atmospheric transmittances for aerosol scattering and absorption and water vapor absorption were calculated using Equations (1) and (2),
T a λ =   exp ( β · λ α n · M ) ,
T w λ =   exp ( 0.2385 · a w λ · W · M ( 1 + 20.07 · a w λ · W · M ) 0.45 ) ,
where β, W, a, and M represent the AODs at 500 nm wavelength, the precipitable water in the vertical path, water absorption coefficient as a function of wavelength, and air mass, respectively. When a single value of αn is used to represent the rural aerosol model, the value should be αn = 1.140 [21], which is used as the reference spectrum [22]. From Bird’s spectral model, the direct spectrum (I) was obtained by Equation (3),
I d λ = H 0 λ · D · T a λ · T w λ · T r λ · T o λ · T m λ ,
where H is the extraterrestrial solar spectrum and D is the correction factor for the earth–sun distance. T, T, T, T, and T are the transmittance functions of the atmosphere at wavelength λ for Rayleigh scattering, aerosol scattering, water vapor absorption, ozone absorption, and mixed gas absorption, respectively. The global tilted spectrum was obtained by Equation (4),
I g λ   clear = I d λ · cos θ + I a λ · 1 + cos ( t ) 2 + I r λ · 1 + cos ( t ) 2 + I g λ · 1 cos ( t ) 2 ,
where I, I, and I are the spectrum on a horizontal surface at wavelength λ for aerosol scattering, Rayleigh scattering, and reflection at the ground, respectively. θ is the incident angle, and t is the tilt angle.
In our study, the AOD and precipitable water were extracted using a model that minimizes the deviation of the global spectrum between the experimental values measured and the values estimated using Bird’s spectrum model, as shown in Equation (4). The estimated global spectrum is a function of the variables AOD and precipitable water. The deviation based on the expressions of R2 was used.

2.3.2. Calculation of All-Weather Solar Spectrum

Equation (4) is based on Bird’s spectrum model. This model is applied only during clear sky without clouds. The all-weather solar spectrum model was calculated by the linear combination of the clear spectrum and the overcast spectrum. By considering only loss due to absorption (water, ozone, and mixed gas), a spectral model adapted for overcast weather was calculated by Equation (5),
I g λ   overcast = H 0 λ · D · T a λ · T w λ · T r λ · T o λ · T m λ · 1 + cos ( t ) 2 ,
where T and T were set to 1 in the case of overcast weather condition. fw was defined as a weather correction factor to determine the condition of cloudy weather in Equation (6),
f w = DNI I d λ · d λ ,
where this value was obtained by dividing the measured DNI by the integrated amount of the direct spectrum calculated using the Bird’s spectrum model. Finally, the global spectrum with cloud conditions was obtained by Equation (7),
I g λ   all = I g λ   clear · f w + I g λ   overcast · ( 1 f w ) .

2.3.3. Calculation of Power Output

For the behavior of multijunction solar cells, Equation (7) was used as a simple and ideal model. The photocurrent density in each sub-cell was calculated from the global spectrum, Igλ all, recombined by the Equation (8),
J photo = I g λ   all · e h c · λ · EQE λ · d λ · TSI I g λ   all · d λ · η opt ,
J sc   without   LC = m i n ( J photo   Top , J photo   Middle , J photo   Bottom ) ,
where ηopt is the optical efficiency of the incident angle modifier obtained from measurement data. Figure 3 shows the relationship between the incident angle and the optical efficiency of Si and IMM (InGaP/GaAs/InGaAs). A low-reflection textured surface was applied to Si, which reduced the surface reflectivity due to multiple reflections at the surface and improved the optical efficiency. The optical efficiency of IMM was worse than Si because the textured surface was not applied.
In addition to absorbing light from the outside, a solar cell absorbs light emitted from the internally generated carriers. In the case of a multijunction solar cell, since different kinds of semiconductors are connected in a layer structure, light emission from the middle cell affects the bottom cell [27,28,29,30]. This phenomenon is called luminescence coupling. In consideration of the luminescence coupling, the short-circuit current can be obtained by Equation (10),
J sc   with   LC = m i n ( J photo   Top   ,   J photo   Middle ,   J photo   Bottom + RCC · ( J photo   Middle J sc   without   LC ) ) ,
where RCC is radiative coupling coefficient, which means the proportion of luminescence coupling of the middle cell (GaAs). It was reported to be about 15% of the function of the current level using a GaAs/GaInNAsSb dual-junction cell under nonconcentration operation [31]. Finally, the short circuit current density was calculated by Equation (11),
J sc = J sc   with   LC · J sc   rate J sc   Std ,
where Jsc rate is measured short-circuit current density under the STC. Jsc Std is calculated short-circuit current density using the standard solar spectrum (ASTM G173 AM 1.5G).
The open-circuit voltage (Voc) in Equation (12) was calculated by a model considering temperature and irradiance characteristics [32],
V oc = V oc   rate N series · { 1 β th · ( T cell 25 ) } + N junction · V t · ln TSI 1000 W / m 2 ,
where βth is the temperature coefficient of the Voc, Njunction is the number of junctions, Nseries is the number of cells in series, and Vt is the thermal voltage (0.026V). Here, the cell temperature (Tcell) was calculated by Equation (13),
T cell = T amb + ( NOCT 20 ) · TSI 800 W / m 2 ,
where Tamb is ambient temperature and NOCT is the nominal operation cell temperature. Equation (13) is widely used to estimate in a simple way cell temperature along year [33,34].
The current mismatching in multijunction solar cells improves the fill factor (FF) [35]. The current matching ratio (CMR) is obtained by Equation (14),
CMR = m i n ( J photo   Top ,   J photo   Middle ,   J photo   Bottom ) m e a n ( J photo   Top ,   J photo   Middle ,   J photo   Bottom ) ,
where min and mean are the arithmetic minimum function and mean function. The FF was modeled by simple parabolic approximation from the degree of current mismatch between the sub-cells [36], shown in Equation (15),
Δ F F = α + β · ( CMR CMR Std ) + γ · ( CMR CMR Std ) 2 ,
where CMRstd is the calculated current matching ratio using the standard solar spectrum (ASTM G173 AM 1.5G) and the values of α, β, γ are 0.904, 0.163, −0.717, respectively. The internal resistance in the cell was ignored. Finally, the FF was calculated by Equation (16),
F F = F F rate + Δ F F .
The maximum operation output (Pmax) was calculated as
P max = J sc · V oc · F F · A mod · η sys ,
where Amod is the area of the module and ηsys is the system efficiency.

3. Results

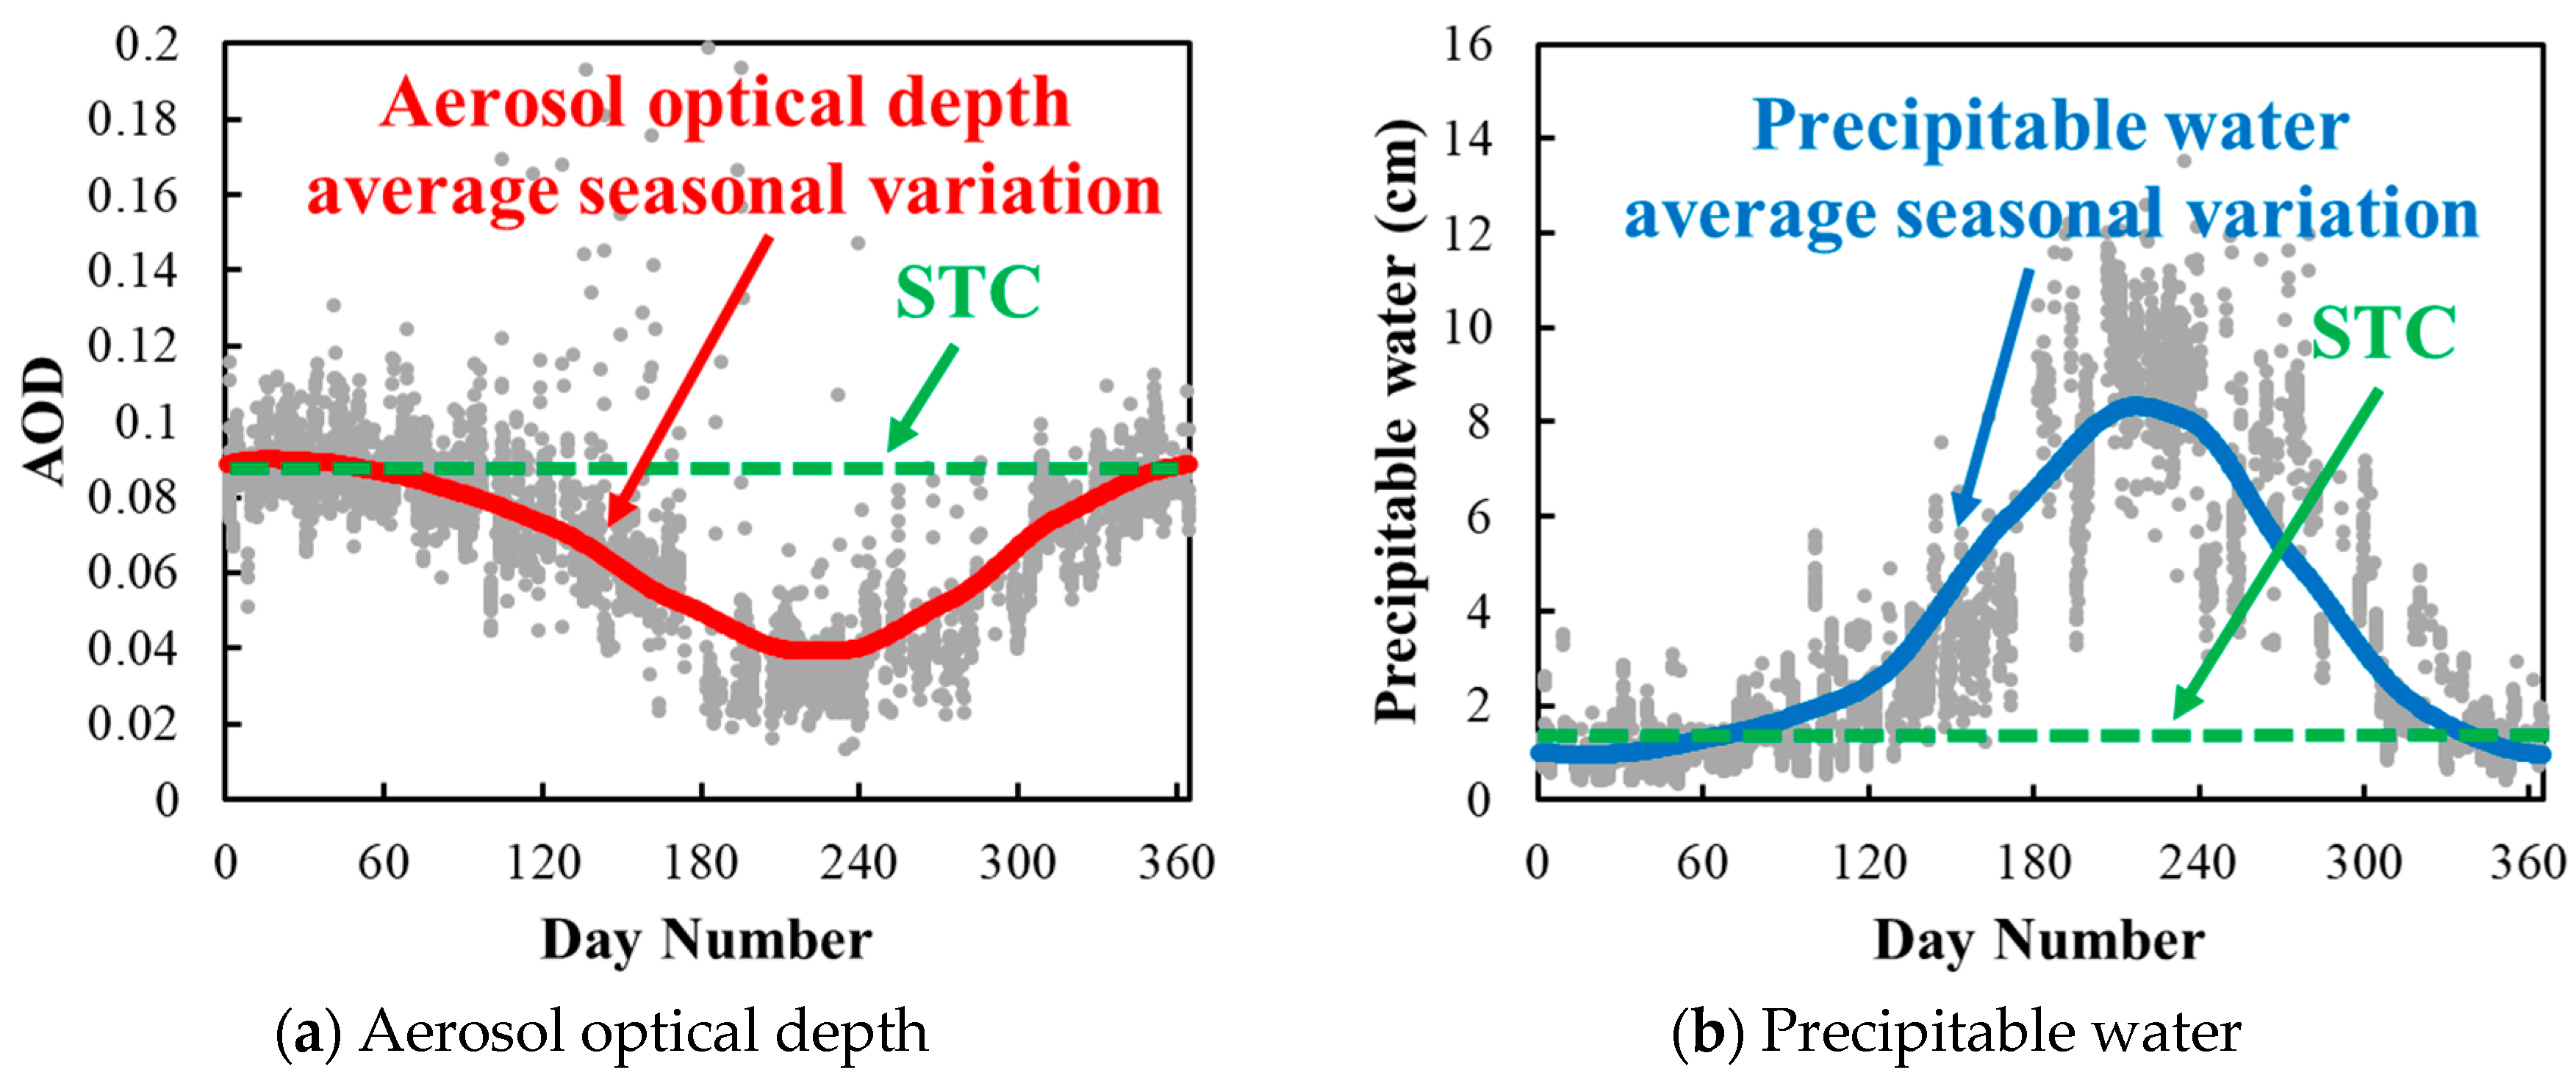
3.1. Variation of Atmospheric Parameters

Figure 4 shows the seasonal change and the daily variation of the atmospheric parameters in Miyazaki. Fitting and smoothing were conducted by the local least squares method in order to examine seasonal fluctuation. Day number indicates 0 for 1 January and 364 for 31 December. The red line represents the average seasonal variation of the AOD, and the blue line represents that of the precipitable water. During the summer in Japan, precipitable water increases as the surrounding temperature and humidity rise. AOD tends to conflict with precipitable water. The AOD is 0.084, and the precipitable water is 1.416 cm under STC. Since the atmospheric parameters under the real environment are different from STC values, they are essential parameters for PV output forecasting.

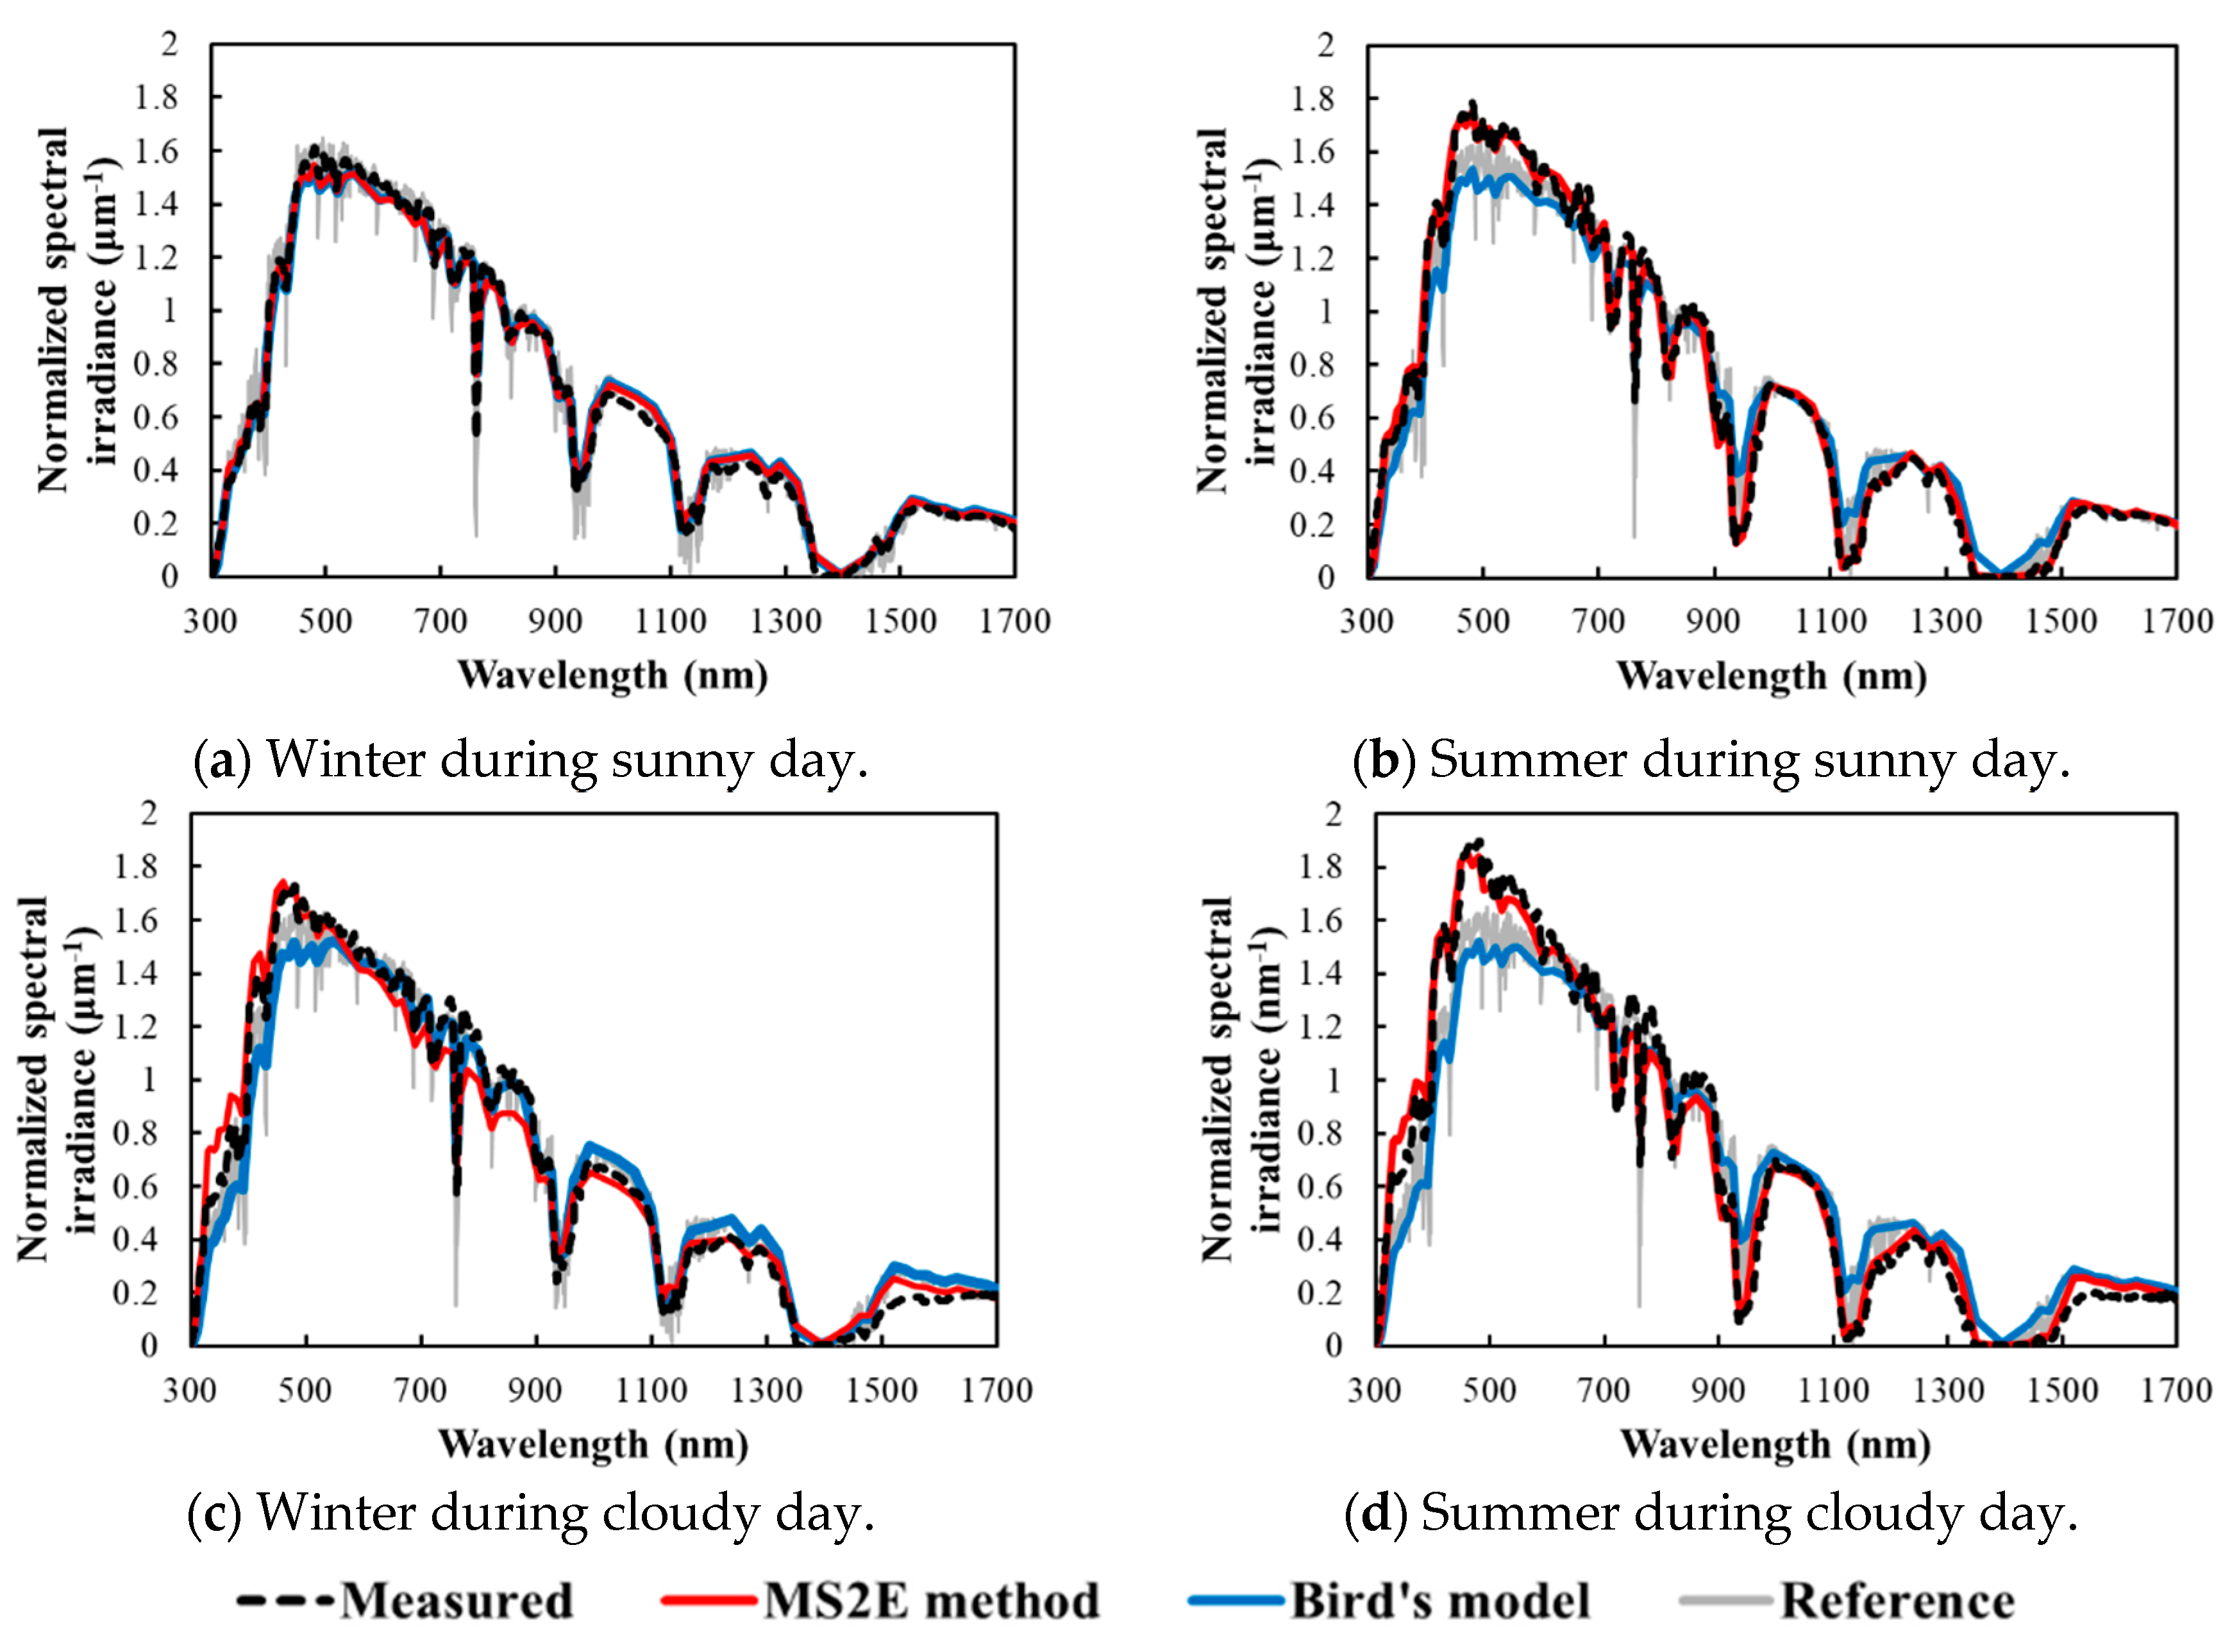
3.2. Verification of Solar Spectrum Reproducibility for MS2E Method

In this study, Bird’s spectrum model was improved by considering atmospheric parameter variability and cloud conditions. Figure 5 shows the global solar spectrum tilted at 35° in winter and summer. The vertical axis was normalized by integrated spectral irradiance in order to evaluate the shape of the solar spectrum. The black line indicates the global solar spectrum measured at the University of Miyazaki. The gray line indicates the reference spectrum in AM 1.5G. The red line and blue line indicate the estimated global solar spectrum using the MS2E method and Bird’s model considering only air mass, respectively. In winter, atmospheric parameters are close to those under STC, so the calculated solar spectrum is close to the reference spectrum. In summer, the AOD is smaller than the STC value, and the precipitable water is larger. As a result, the short-wavelength region of the solar spectrum increases and the long-wavelength region decreases. During cloudy days, the influence of cloud conditions results in an increase of the short-wavelength regions of the solar spectrum and a decrease of the long-wavelength regions of the solar spectrum.

3.3. Verification of Output Energy Reproducibility for MS2E Method

Figure 6 shows the performance ratio (PR) measured at the University of Miyazaki and estimated by the MS2E method. The PR can be calculated as the ratio of the integrated energy yield of one day, which is the collected global irradiance adapted for each installation condition, to the reference yield. The closer the PR is to 100%, the more efficient the system is in operation. Gray circle indicates the estimation result, and other circle colors indicate the measurement result. To examine the seasonal PR fluctuation, we performed fitting and smoothed by segmented polynomials using the local least square error method as shown by the black line. The IMM module was greatly affected by atmospheric parameter variation. In the case of the atmospheric parameters close to STC value, the PR was the highest value. However, PR decreased significantly in summer due to limit of the short-circuit current by bottom subcell photocurrent because of increasing precipitable water, which absorbed the long-wavelength range of the solar spectrum [37]. The PRs estimated by the MS2E method are quite close to the measurement value. Therefore, the reliability of the MS2E method could be verified by various PV modules with different structures.

3.4. Application of MS2E Method

With the reliability of the MS2E method, which can estimate PV output, verified, we can apply this method more broadly. One of the applications of the PV output forecasting model is to be able to determine the optimum installation locations for PV modules. The database METPV-11 has PV measurement data for 837 locations in Japan. Using these data and our PV output forecasting model, we estimated the average annual energy yields all around Japan and examined the optimum installation locations for PV modules.

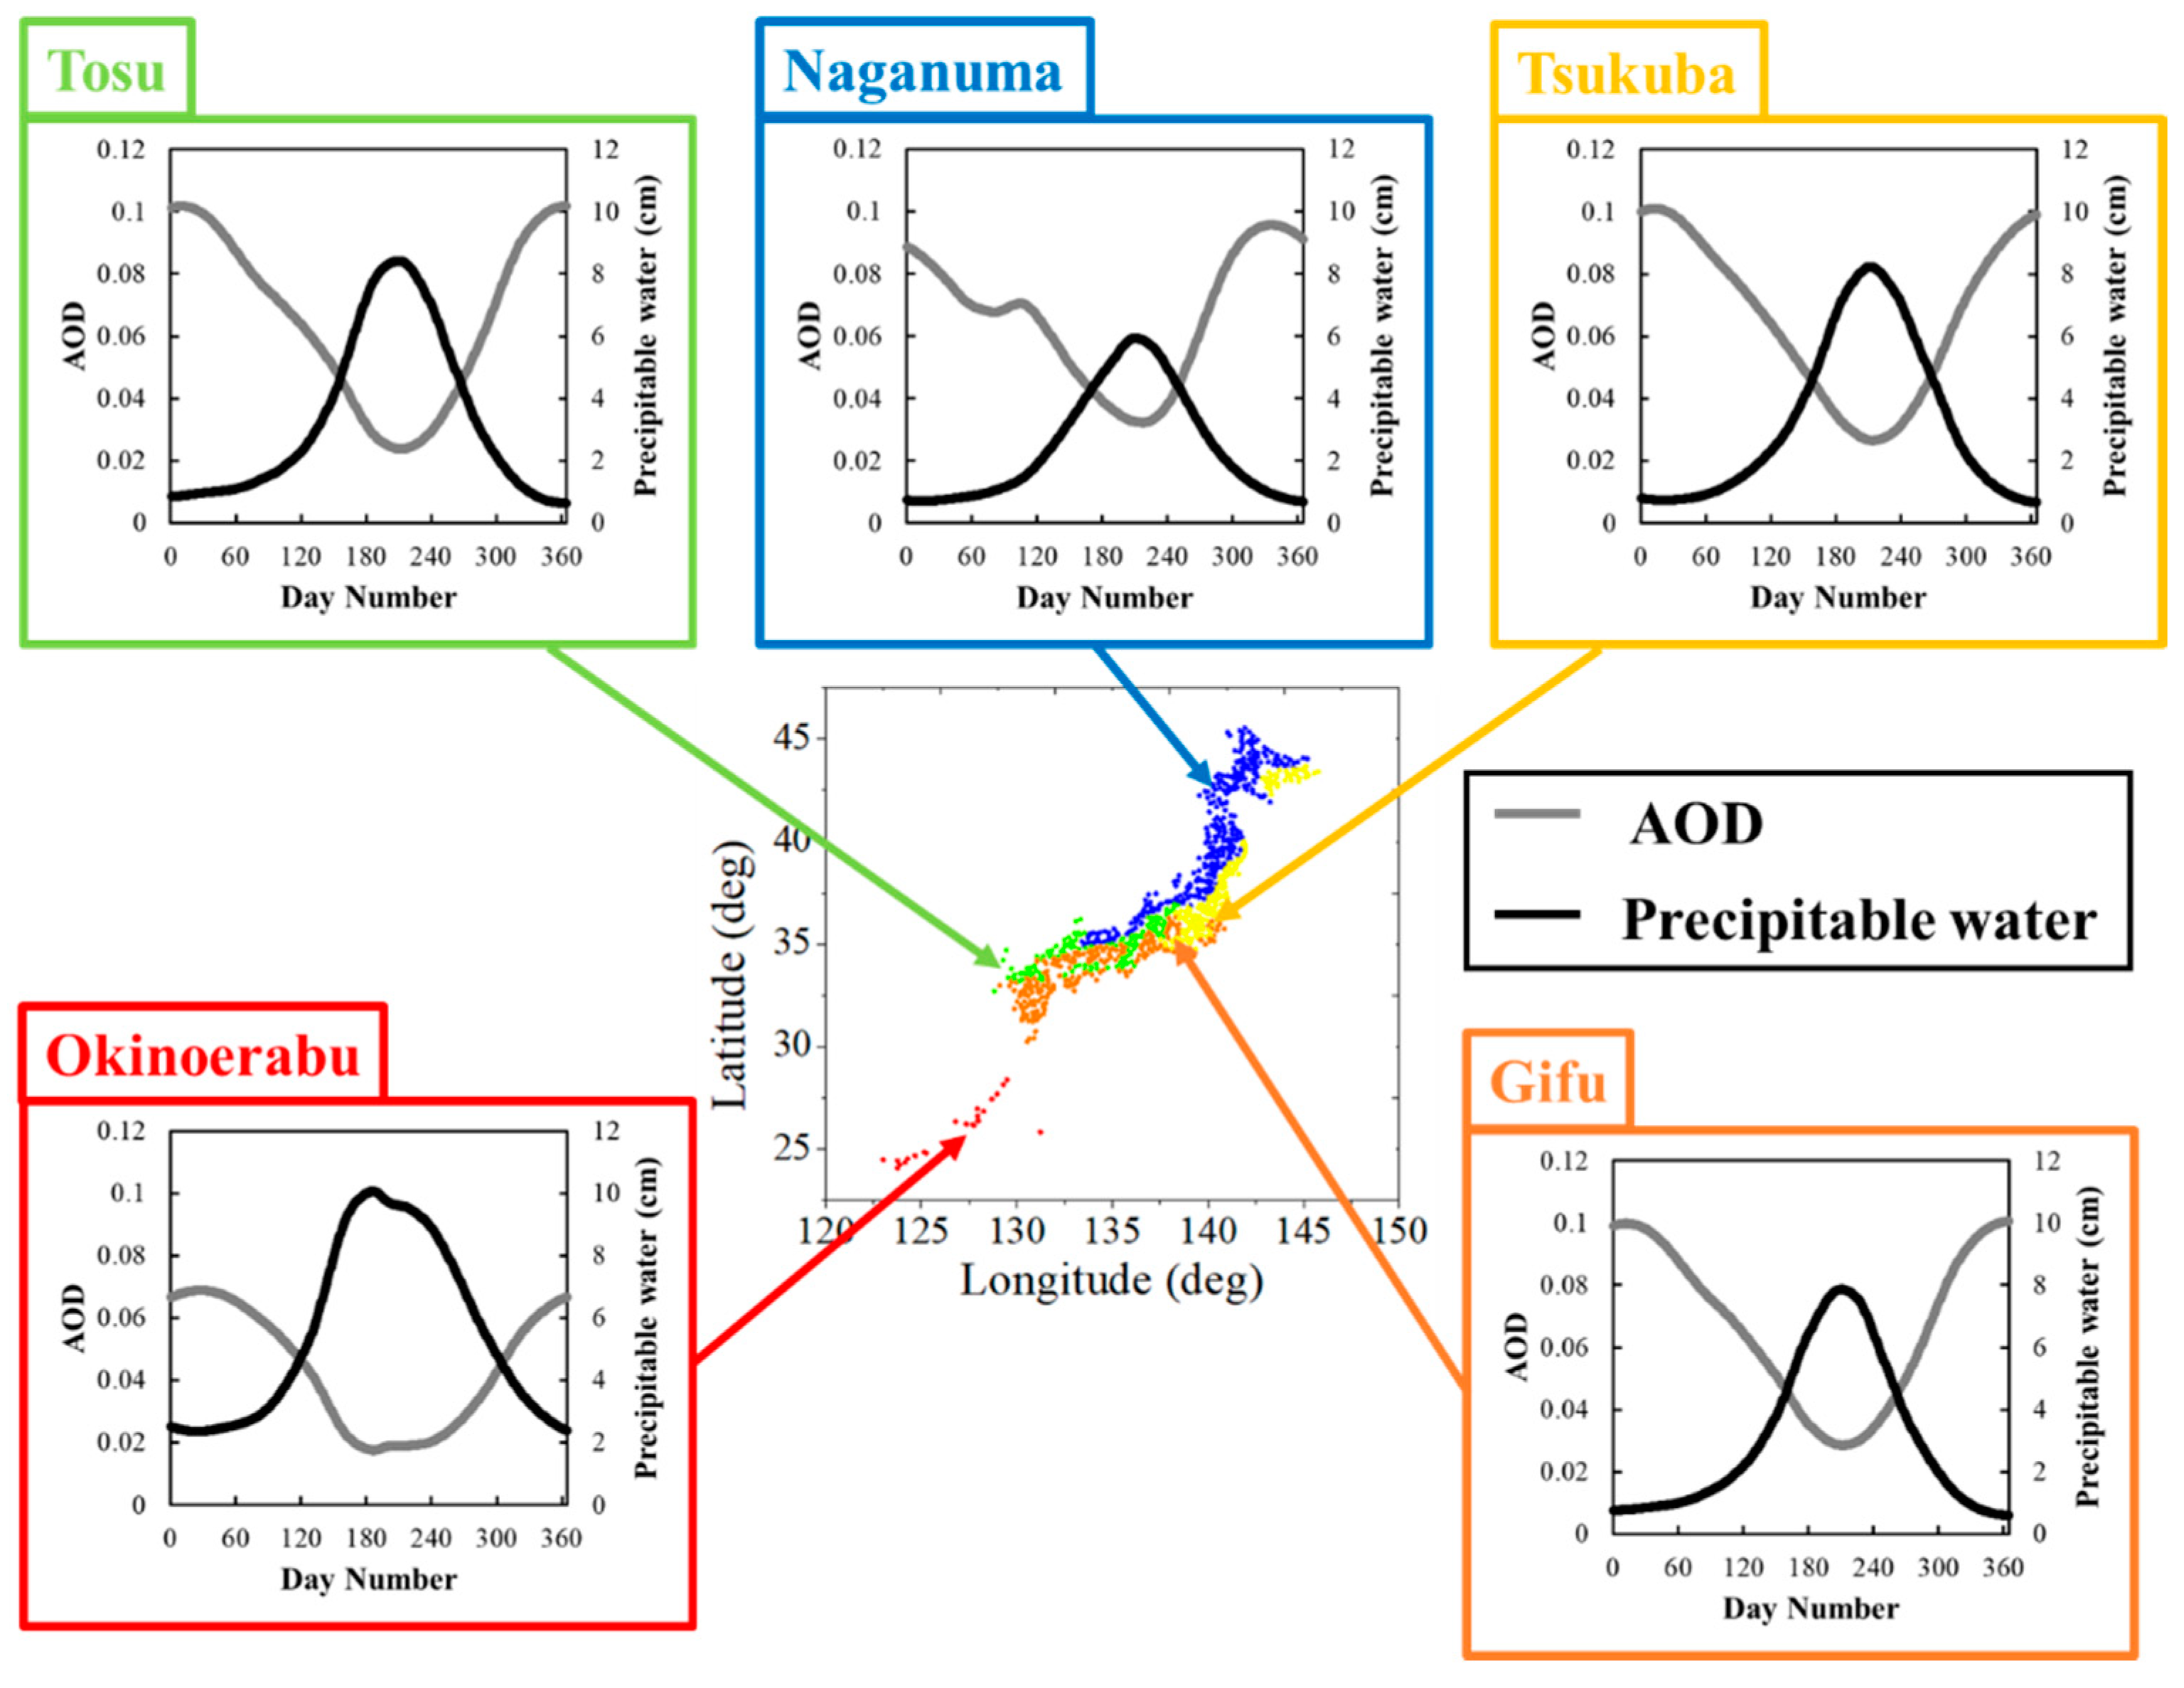
3.4.1. Atmospheric Parameter Fluctuation in Five Solar Radiation Climate Zone

To determine the atmospheric parameters, measurement data of the solar spectrum are required. However, spectro-radiometers are very expensive, and it is difficult to install them across an entire nation like Japan. Therefore, NEDO classified Japan into five solar radiation climate zones to clarify regional differences in solar radiation conditions. The solar spectrum was measured at five points: Naganuma (blue), Tosu (green), Tsukuba (yellow), Gifu (Orange), and Okinoerabu (red). Extracted AOD and precipitable water in each solar radiation climate zone (as shown in Section 2.3.1) were utilized as atmospheric parameters, as shown in Figure 7.

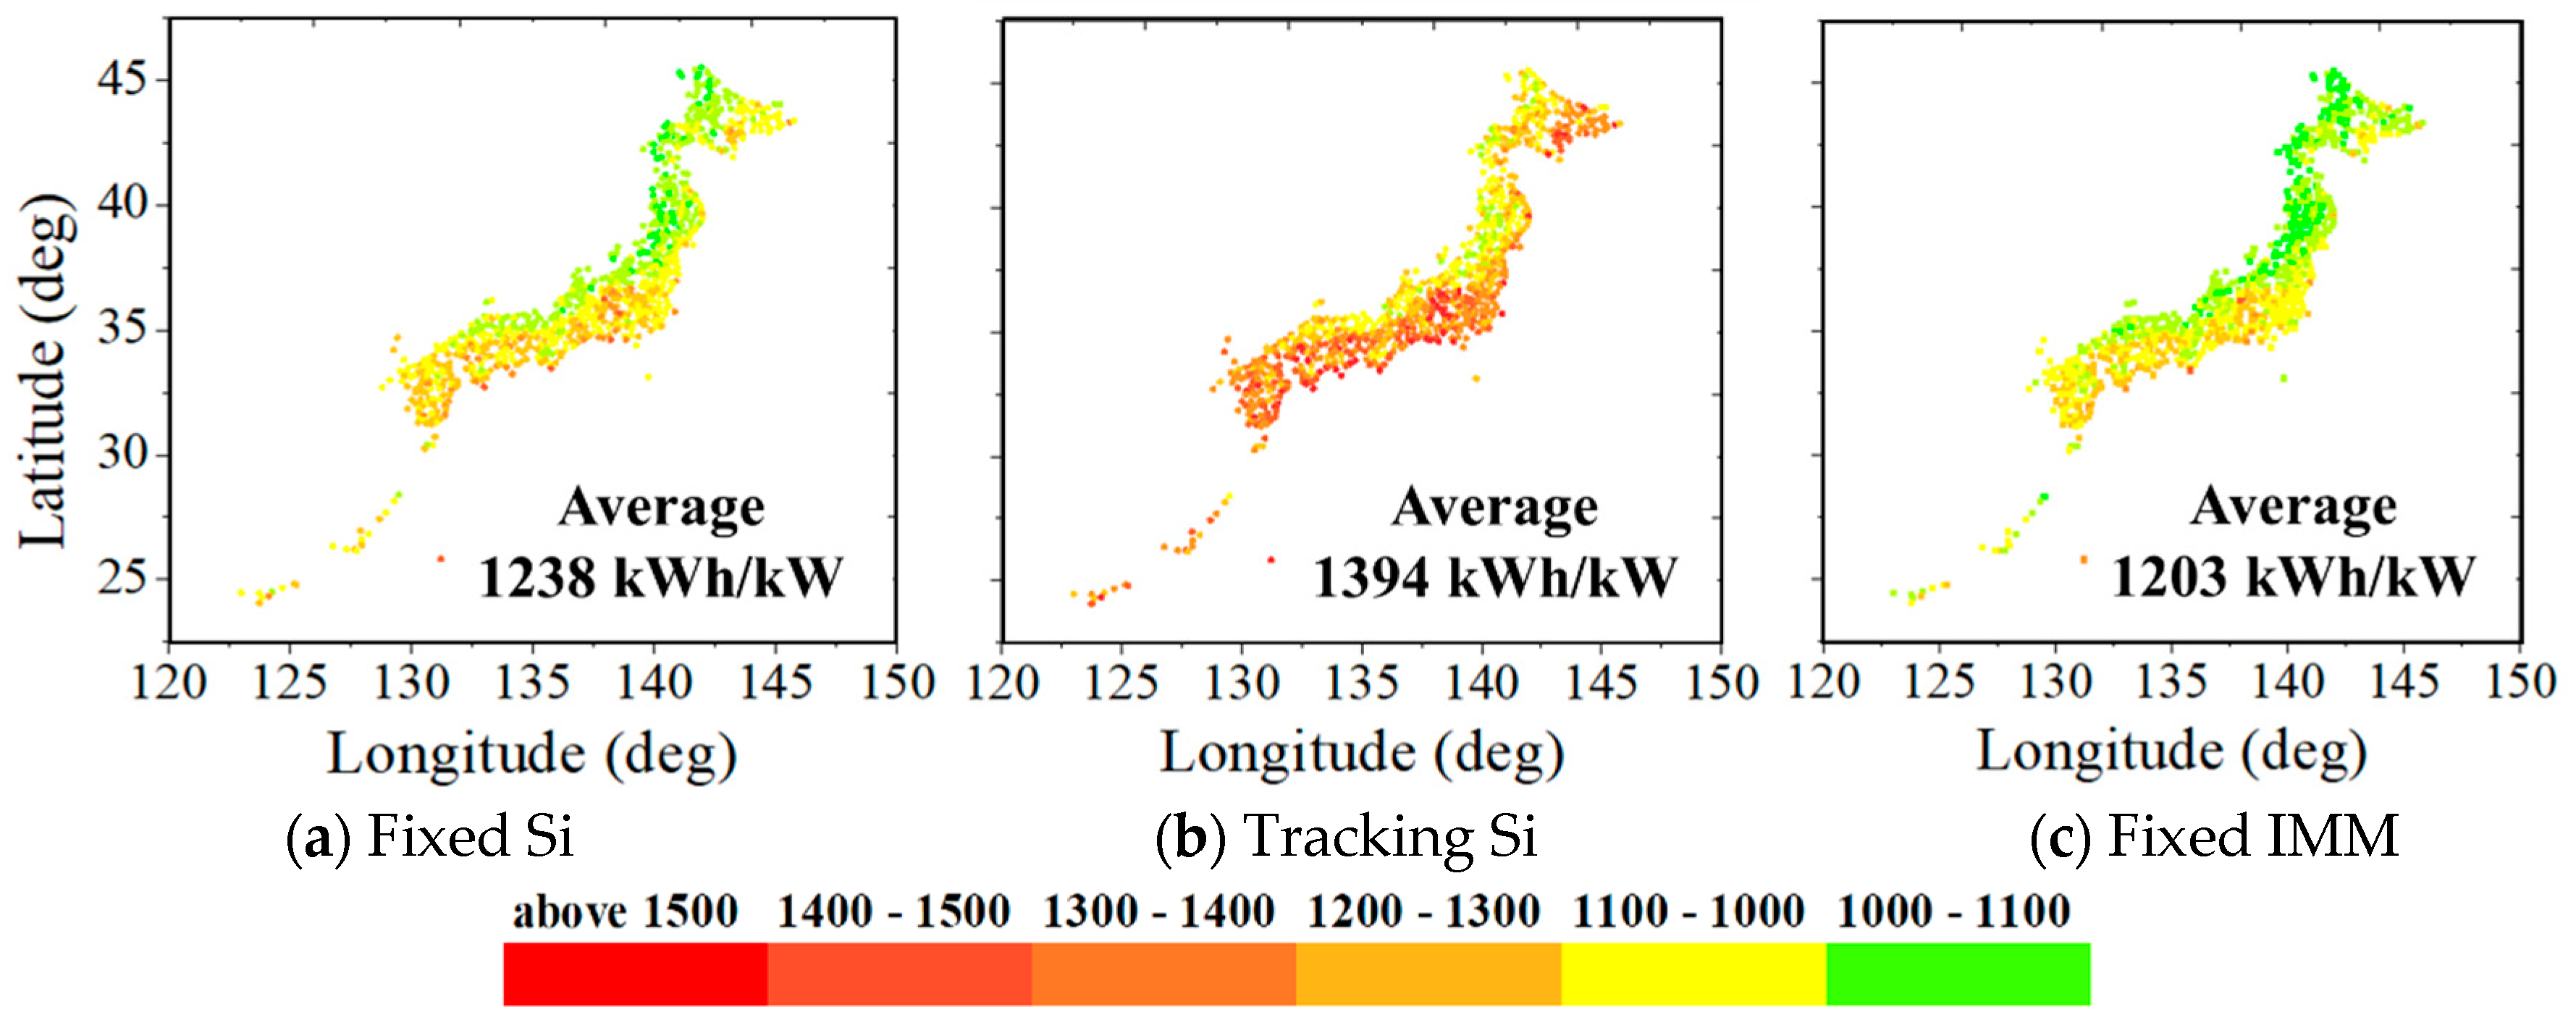
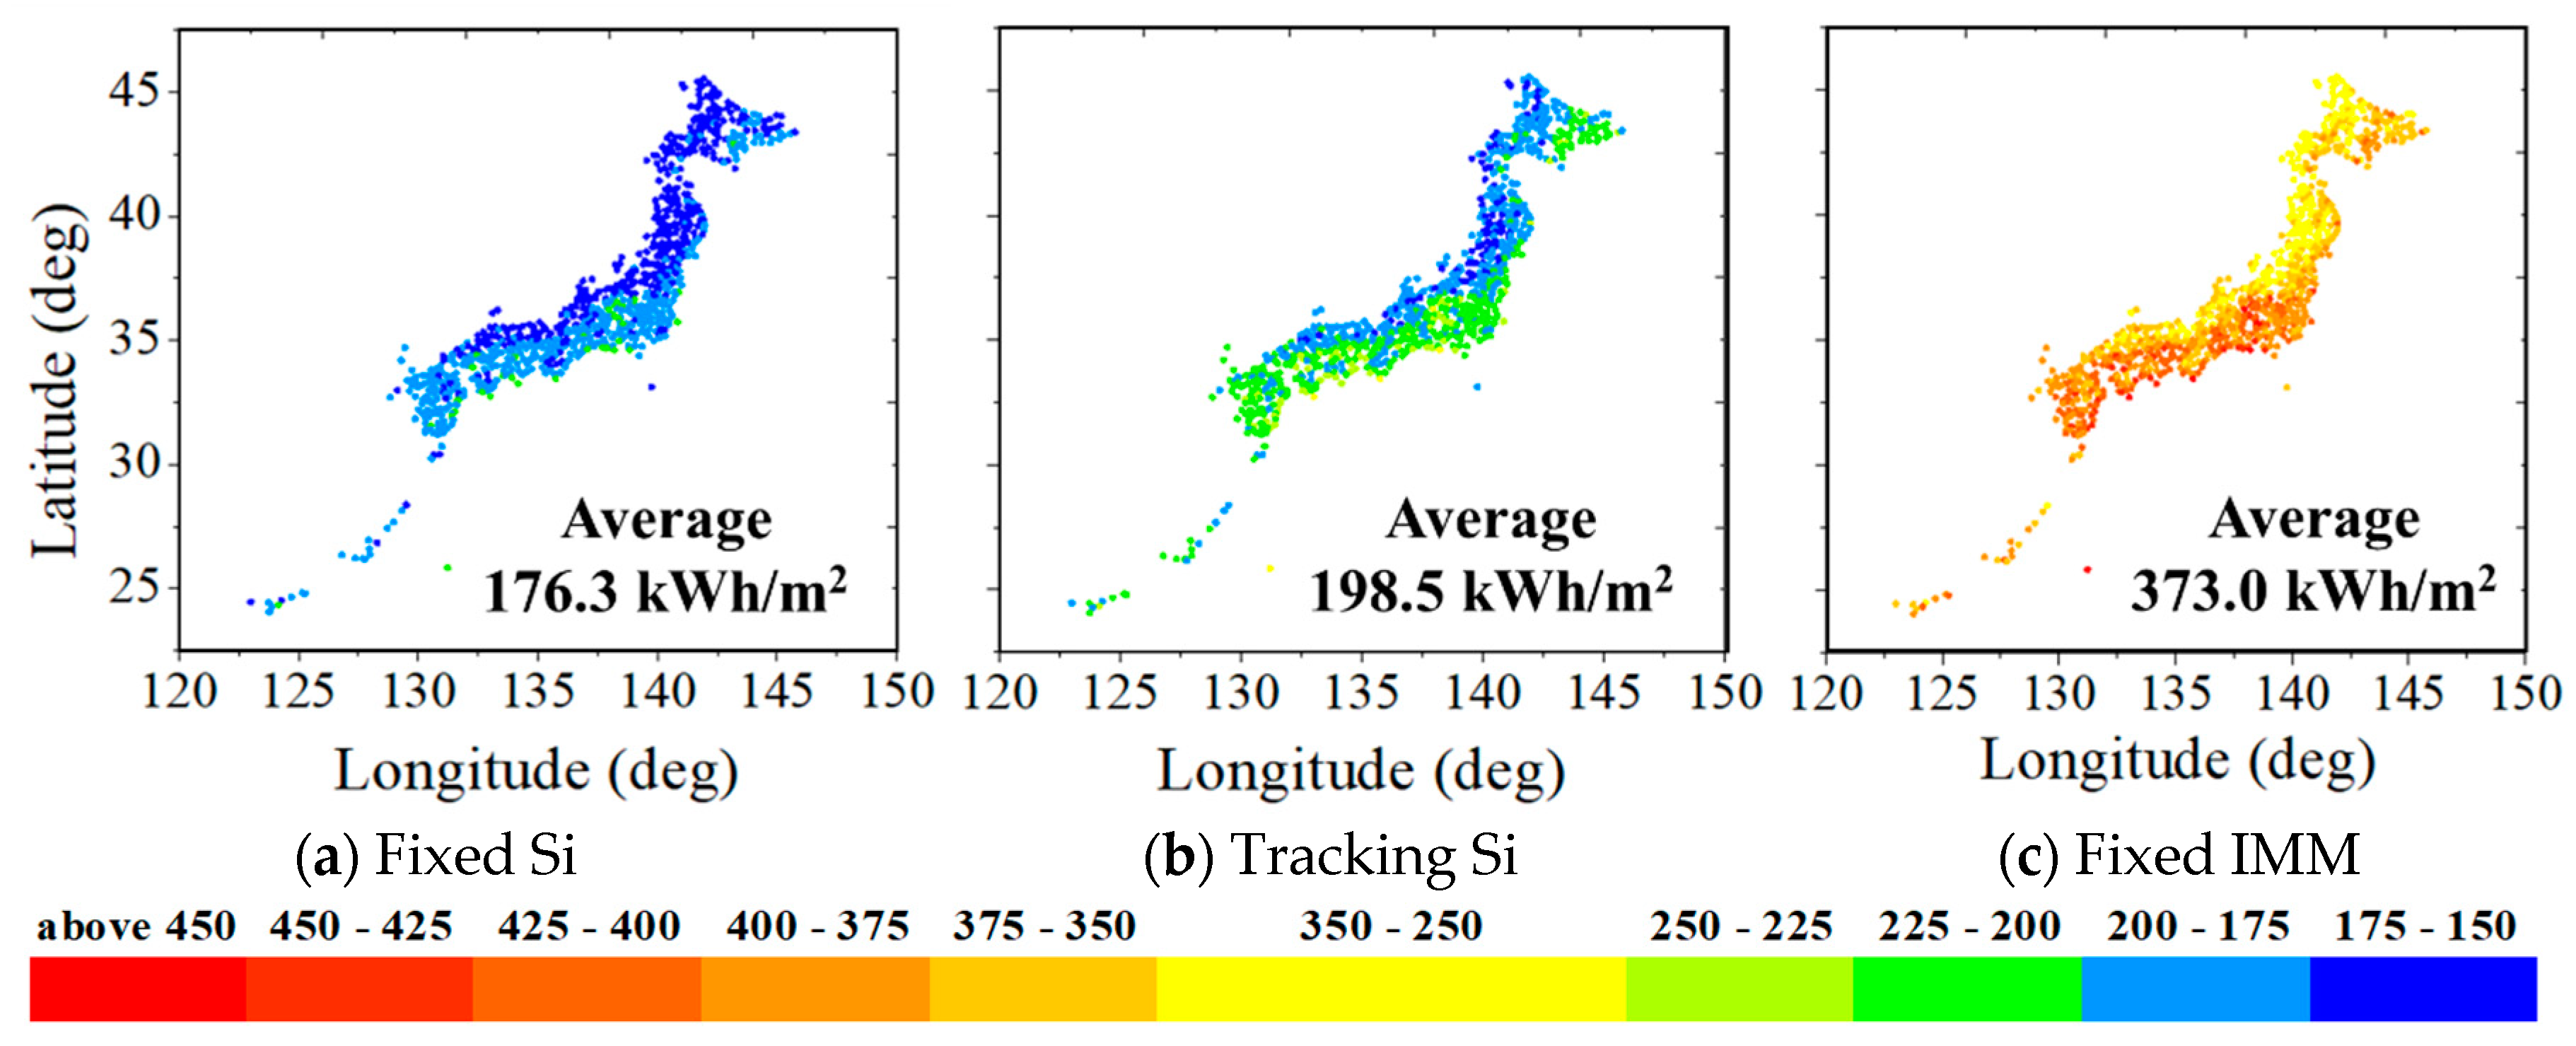
3.4.2. The Optimum Installation Location of Various PV Modules in Japan

We estimated the annual energy yields at the 837 METPV-11 sites using our MS2E method. Figure 8 shows the annual output power forecasting results (annual output energy per rated power) for these sites. In the northwest, solar radiation is low because clouds occurred frequently, which results in decreasing the annual energy yields. The IMM module affected by the solar spectrum showed the lowest value. It means that the output performance of IMM module under STC conditions cannot be operated more than other PV modules. The two-axis tracking Si that can use much irradiance about 200 kWh/m2 for a year compared to the fixed-PV showed the highest value. Therefore, tracking technology leads to more advanced utilization of solar energy.
Figure 9 shows the annual output power forecasting results (annual output energy per module area) at the 837 sites. The IMM module with high conversion efficiency showed the highest value. There is room for improving multijunction PV through the development of the optimum bandgap considering real solar spectrum variation.

4. Discussion

We have shown that the MS2E method is able to estimate PV output with high accuracy. In this section, we discuss the effect of atmospheric parameters, cloud conditions, air mass, and incident angle modifier on PV output. Figure 10 shows the seasonal PR fluctuation estimated by each PV output forecasting model as shown in Table 1. The air mass variations were considered in all models. The residual errors, defined as the difference between actual PR and predicted PR, were calculated using a statistical analysis. The purpose of our statistical analysis is to ensure that the error in MS2E does not contain bias and skew, and that the residual error distribution is accidentally random, i.e., the normal distribution is centered on zero. Figure 11 shows the comparison of each prediction model to the normal distribution of residual errors. For the IMM module, apparently, both Case-3 and Case-4 showed highly skewed and highly biased error distributions. This situation was significantly improved upon the introduction of atmospheric parameters (Case-2) and further improved using the MS2E (Case-1). Figure 12 shows the external quantum efficiency (EQE) of Si and IMM solar cells over the reference solar spectrum in AM 1.5G. It can be seen that the bottom cell in IMM mainly absorbs the wavelength spectrum that gets absorbed by precipitable water. On the other hand, the normal distribution of the residual error of the Si module showed the same tendency in all cases, because of the broader EQE of the Si solar cell, as shown in Figure 12a. Therefore, the Si modules were almost unaffected by spectral changes, due to the parameters that were set. It is not important to estimate the output considering the spectral changes. However, for solar cells with a narrow EQE, such as double-junction amorphous Si and organic cells, the effect of the spectral change on the characteristics of the output could be observed using our MS2E method [38].

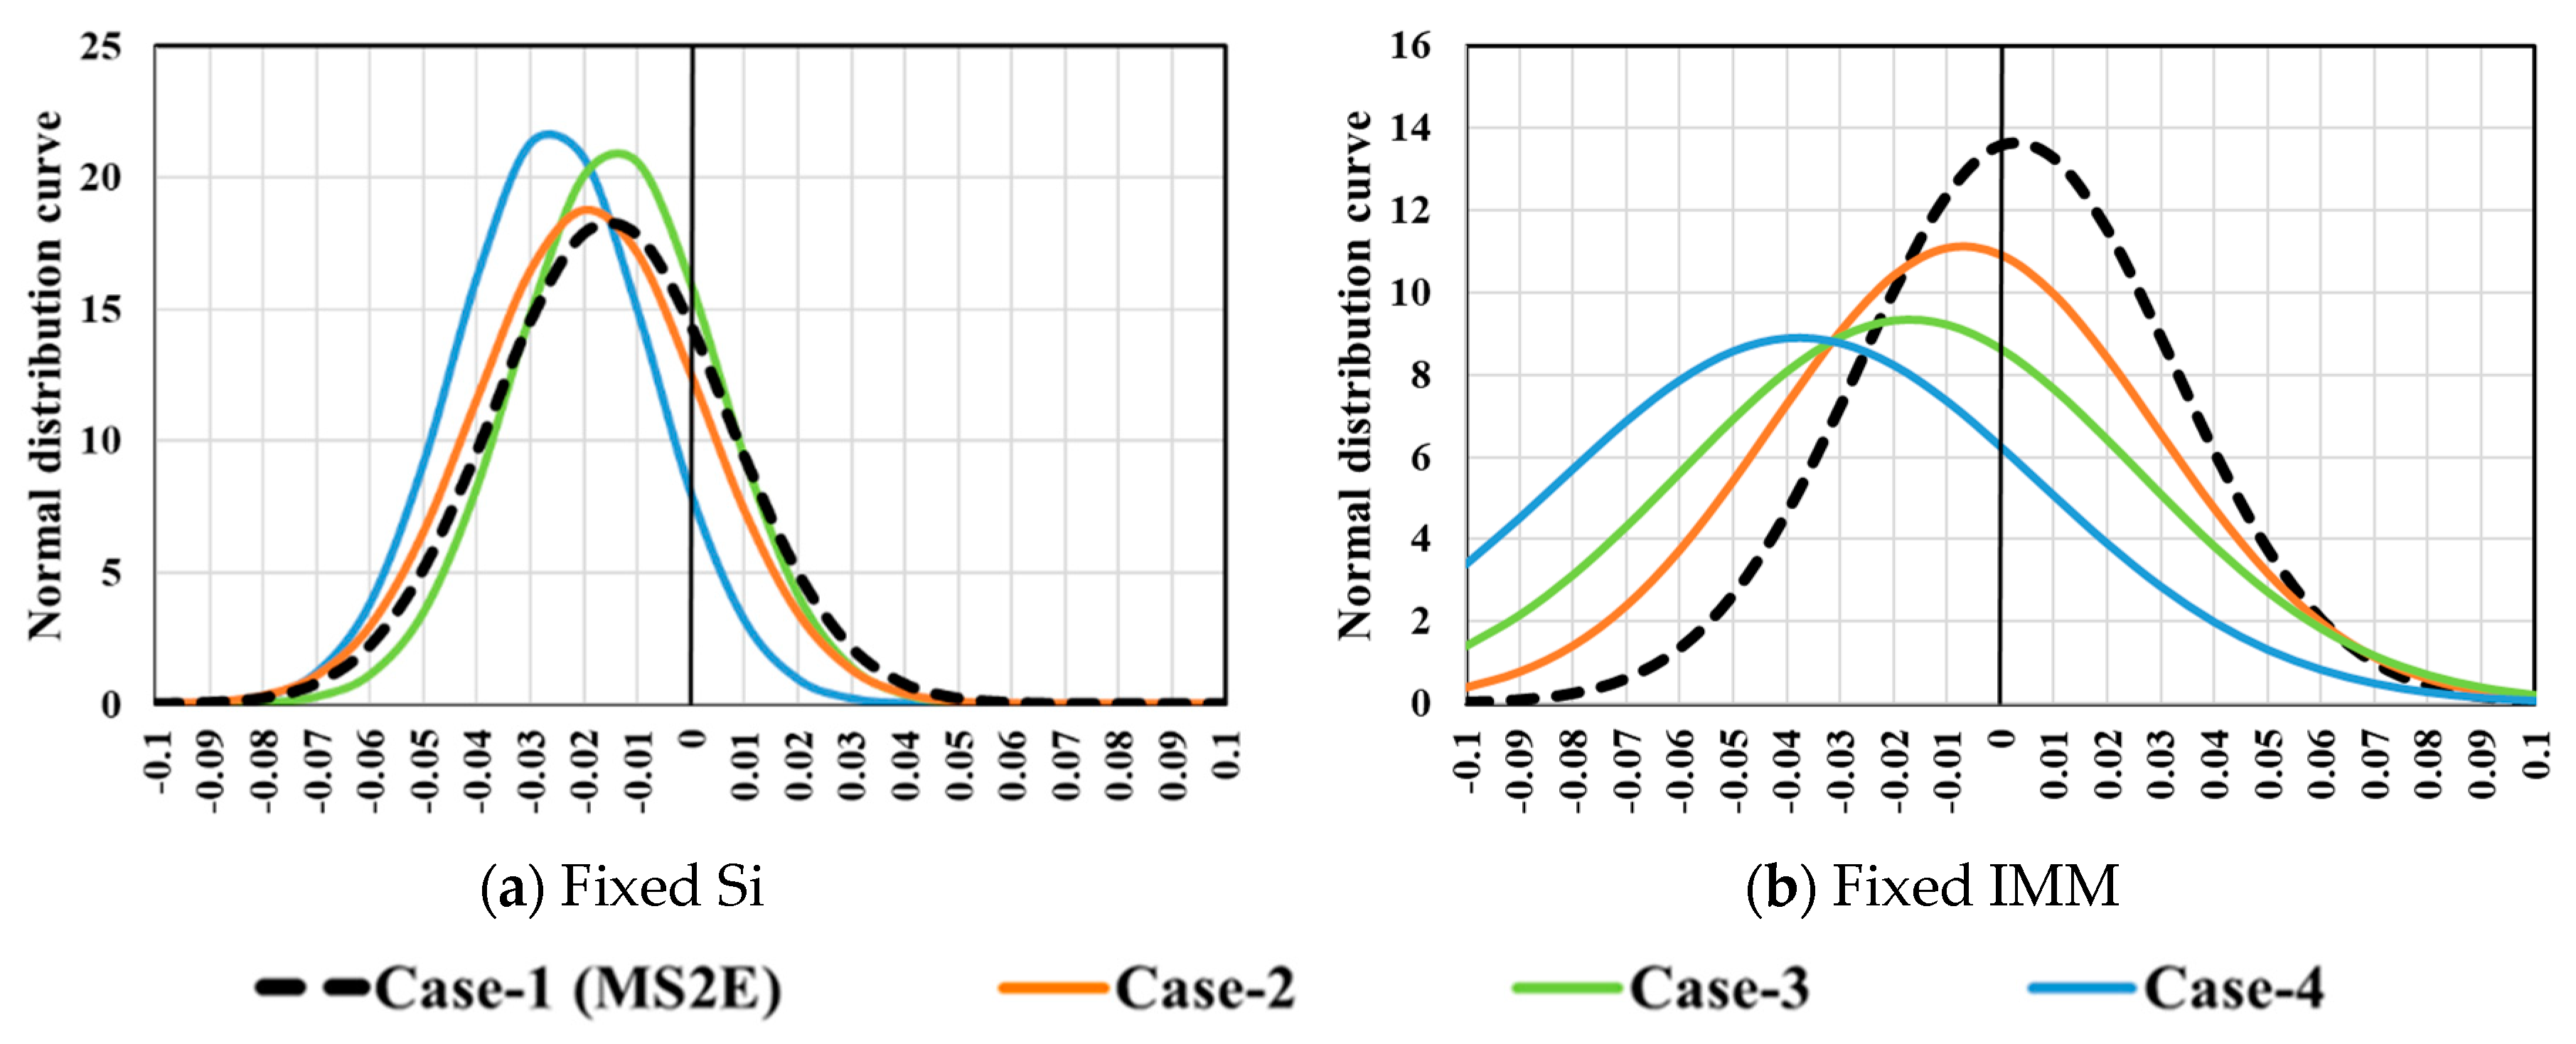
4.1. The Necessity of Spectral Changes Owing to Atmospheric Parameters and Cloud Conditions

Since summer in Japan has a long sunshine time and strong irradiance, the surface air is warmed, and ascending currents occur frequently. The IMM module is affected by cloud conditions, whichresults in decreasing PR in the summer. This is caused by the overcast conditions decreasing the long-wavelength region of the solar spectrum, which is absorbed by the bottom cell. The IMM module was also greatly affected by atmospheric parameter variation, and the PR markedly decreased in summer because of increasing precipitable water, which absorbed the long-wavelength range of the solar spectrum. As shown in Figure 11b, the absorption of the bottom cell is the water absorption wavelength region. By considering spectral changes owing to atmospheric parameters and cloud conditions, we can reproduce the solar spectrum more accurately and estimate the drop in the photocurrent of the bottom cell. This allows estimating IMM PV output with high accuracy.

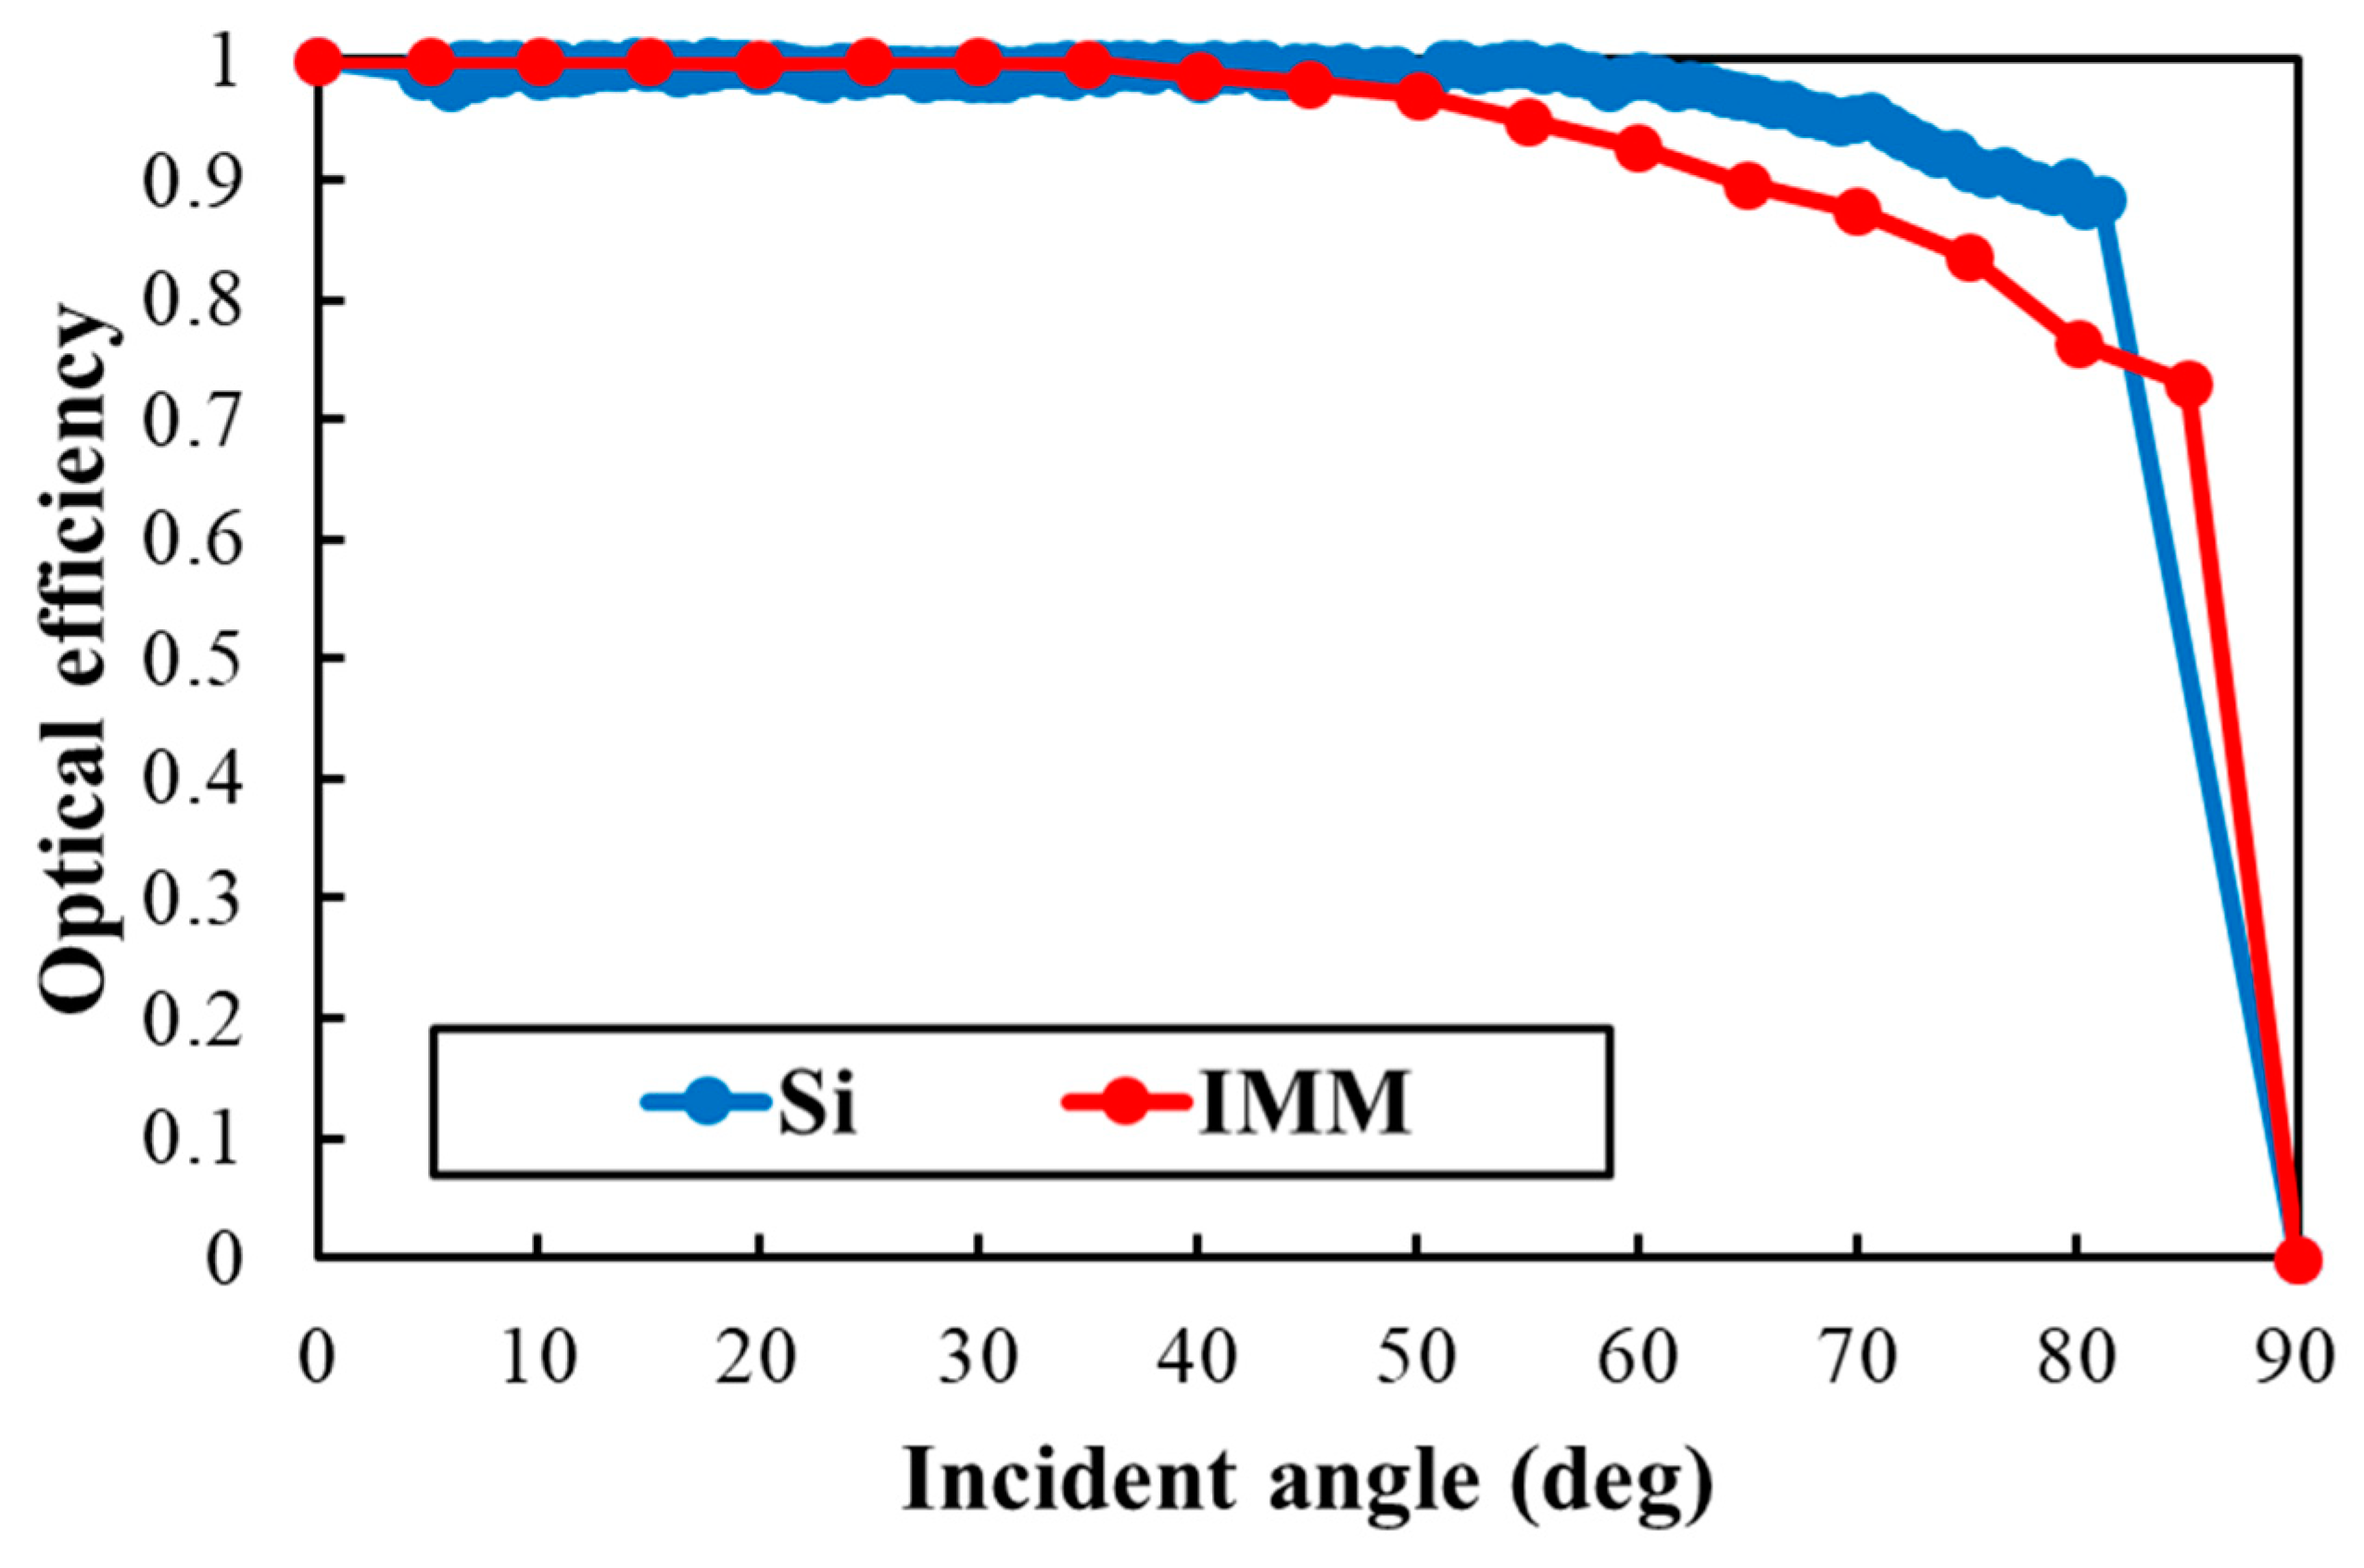
4.2. The Necessity of Incident Angle Modifier

The solar radiation incident on the PV module is more likely to be reflected off the surface as the incident angle increases. PR decreased by considering the incident angle modifier regardless of the season. Table 2 shows the annual irradiance incident on each PV module and the effective insolation rate. The two-axis tracking Si module was slightly affected by the incident angle modifier, and the effective solar radiation rate was 99.69%. Next, it was 98.75% with fixed Si and 98.19% with the IMM module. Since the PV module on the two-axis tracking system can always track the sun, there is no direct irradiance loss. On the other hand, when installing the PV tilted, the direct irradiance loss is tremendous. The incident angle modifier of the IMM was worse than Si. Therefore, the effective insolation rate was, from highest to lowest, the tracking silicon, fixed silicon, and fixed IMM. Without considering the incident angle modifier, overestimating PV output may occur.

5. Conclusions

We propose a PV output forecasting model, MS2E, considering the incident angle and spectral changes owing to atmospheric parameters and cloud conditions. Simulation results were close to the measurement value when considering these three factors.
The Si module was almost unaffected by the solar spectral changes. On the other hand, the IMM module was greatly affected by the solar spectral changes. The solar spectrum was greatly affected by atmospheric parameters and cloud conditions, which result in estimation error. Without the atmospheric parameters and cloud conditions, the decreasing in the photocurrent of the bottom cell cannot be explained in summer. Above all, it is necessary to consider the solar spectrum change in highly accurate PV output forecasting. Regardless of the season, PR was decreased when considering incident angle dependence. The annual effective insolation rates were 99.69% for tracking Si module, 98.75% for fixed Si module, and 98.19% for the fixed IMM module. Without considering the incident angle modifier, there is a risk of overestimating PV output.
Using the PV output forecasting model developed in this study, it is possible to simulate PV output potential with various structures at any location when considering the solar spectrum in the local environment.

Author Contributions

Conceptualization: Y.O., and K.A.; methodology: H.T., H.S., Y.O., and K.A.; validation: H.T., H.S., T.T., Y.O., and K.A.; formal analysis: H.T., H.S., and Y.O.; data curation, H.T., H.S., and Y.O.; writing—original draft preparation, H.T and Y.O.; writing—review and editing: H.T., Y.O., and K.A.; supervision: K.N. All authors have read and agreed to the published version of the manuscript.

Funding

This research was funded by the New Energy and Industrial Technology Development Organization (NEDO), and a grant for Scientific Research on Priority Areas from the University of Miyazaki.

Acknowledgments

This work was supported in part by New Energy and Industrial Technology Development Organization (NEDO).

Conflicts of Interest

The authors declare that there are no conflicts of interest.

Nomenclature

βThe aerosol optical depth in a vertical path at 500 nm wavelength
WThe precipitable water in the vertical path (cm)
TThe atmospheric transmittances for aerosol scattering at wavelength
TThe atmospheric transmittances for water vapor absorption at wavelength
TThe atmospheric transmittances for Rayleigh scattering at wavelength
TThe atmospheric transmittances for ozone absorption at wavelength
TThe atmospheric transmittances for mixed gas absorption at wavelength
αnThe angstrom turbidity exponent
aThe water absorption coefficient as a function of wavelength at wavelength (cm−1)
MThe air mass
IThe direct spectral irradiance at wavelength (W/m2/nm)
IThe spectral irradiance on a horizontal surface for aerosol scattering at wavelength (W/m2/nm)
IThe spectral irradiance on a horizontal surface for Rayleigh scattering at wavelength (W/m2/nm)
IThe spectral irradiance on a horizontal surface for reflection at the ground at wavelength (W/m2/nm)
Igλ clearThe global spectral irradiance calculated using Bird’s spectrum model at wavelength (W/m2/nm)
Igλ overcastThe global spectral irradiance calculated using a new spectrum model assuming full cloud cover at wavelength (W/m2/nm)
Igλ allThe global spectral irradiance using MS2E model considering all-weather at wavelength (W/m2/nm)
θThe incident angle (°)
tThe tilt angle (°)
fwThe weather correction factor
TSIThe total solar irradiance (W/m2)
DNIThe direct normal irradiance (W/m2)
JphotoThe photocurrent density (A/m2)
JscThe short-circuit current density (A/m2)
JSC without LCThe short-circuit density without luminescence coupling (A/m2)
JSC with LCThe short-circuit density with luminescence coupling (A/m2)
JSC StdThe calculated short-circuit current density using the standard solar spectrum (A/m2)
JSC rateThe short-circuit current density under the standard test condition (A/m2)
EQEλThe external quantum efficiency at wavelength
RCCThe radiative coupling coefficient
VOCThe open-circuit voltage (V)
VOC rateThe open-circuit voltage under the standard test condition (V)
VtThe thermal voltage (V)
βthThe temperature coefficient of the open-circuit voltage (%/°C)
NseriesThe number of cells in series
NjunctionThe number of junctions
TcellThe cell temperature (°C)
TambThe ambient temperature (°C)
NOCTThe nominal operation cell temperature (°C)
FFThe fill factor
FFrateThe fill factor under the standard test condition
PmaxThe maximum operation output (W)
AmodThe area of the module (m2)
ηoptThe optical efficiency of the incident angle modifier
ηsysThe system efficiency

References

  1. Richter, A.; Hermle, M.; Glunz, S.W. Reassessment of the limiting efficiency for crystalline silicon solar cells. IEEE J. Photovolt. 2013, 3, 1184–1191. [Google Scholar] [CrossRef]
  2. Cai, Y.; Wang, W.W.; Liu, C.W.; Ding, W.T.; Liu, D.; Zhao, F.Y. Performance evaluation of a thermoelectric ventilation system driven by the concentrated photovoltaic thermoelectric generators for green building operations. Renew. Energy 2020, 147, 1565–1583. [Google Scholar] [CrossRef]
  3. Green, M.A.; Dunlop, E.D.; Levi, D.H.; Hohl-Ebinger, J.; Yoshita, M.; Ho-Baillie, A.W.Y. Solar cell efficiency tables (version 54). Prog. Photovolt. Res. Appl. 2019, 27, 565–575. [Google Scholar] [CrossRef]
  4. Green, M.A.; Hishikawa, Y.; Dunlop, E.D.; Levi, D.H.; Hohl-Ebinger, J.; Ho-Baillie, A.W.Y. Solar cell efficiency tables (version 51). Prog. Photovolt. Res. Appl. 2018, 26, 3–12. [Google Scholar] [CrossRef] [Green Version]
  5. Marion, B. Comparison of Predictive Models for Photovoltaic Module Performance. In Proceedings of the 2008 33rd IEEE Photovoltaic Specialists Conference, San Diego, CA, USA, 11–16 May 2008; pp. 1–6. [Google Scholar]
  6. De Soto, W.; Klein, S.A.; Beckman, W.A. Improvement and validation of a model for photovoltaic array performance. Sol. Energy 2006, 80, 78–88. [Google Scholar] [CrossRef]
  7. Marion, B.; Rummel, S.; Anderberg, A. Current—Voltage curve translation by bilinear interpolation. Prog. Photovolt. Res. Appl. 2004, 12, 593–607. [Google Scholar] [CrossRef]
  8. Mazzer, M.; Rampino, S.; Spaggiari, G.; Annoni, F.; Bersani, D.; Bissoli, F.; Bronzoni, M.; Calicchio, M.; Gombia, E.; Kingma, A.; et al. Bifacial cigs solar cells grown by low temperature pulsed electron deposition. Sol. Energy Mater. Sol. Cells 2017, 166, 247–253. [Google Scholar] [CrossRef]
  9. Bahgat, A.B.G.; Helwa, N.H.; Ahmad, G.; El Shenawy, E. Maximum power point traking controller for pv systems using neural networks. Renew. Energy 2005, 30, 1257–1268. [Google Scholar] [CrossRef]
  10. Bahgat, A.B.G.; Helwa, N.H.; Ahamd, G.E.; El Shenawy, E.T. Estimation of the maximum power and normal operating power of a photovoltaic module by neural networks. Renew. Energy 2004, 29, 443–457. [Google Scholar] [CrossRef]
  11. Almonacid, F.; Rus, C.; Pérez, P.J.; Hontoria, L. Estimation of the energy of a pv generator using artificial neural network. Renew. Energy 2009, 34, 2743–2750. [Google Scholar] [CrossRef]
  12. Almonacid, F.; Rus, C.; Hontoria, L.; Fuentes, M.; Nofuentes, G. Characterisation of si-crystalline pv modules by artificial neural networks. Renew. Energy 2009, 34, 941–949. [Google Scholar] [CrossRef]
  13. Al-Amoudi, A.; Zhang, L. Application of radial basis function networks for solar-array modelling and maximum power-point prediction. IEE Proc. Gener. Transm. Distrib. 2000, 147, 310–316. [Google Scholar] [CrossRef]
  14. Veerachary, M.; Yadaiah, N. Ann based peak power tracking for pv supplied dc motors. Sol. Energy 2000, 69, 343–350. [Google Scholar] [CrossRef]
  15. Ishii, T.; Otani, K.; Takashima, T.; Xue, Y. Solar spectral influence on the performance of photovoltaic (pv) modules under fine weather and cloudy weather conditions. Prog. Photovolt. Res. Appl. 2013, 21, 481–489. [Google Scholar] [CrossRef]
  16. Araki, K.; Yamaguchi, M. Influences of spectrum change to 3-junction concentrator cells. Sol. Energy Mater. Sol. Cells 2003, 75, 707–714. [Google Scholar] [CrossRef]
  17. Faine, P.; Kurtz, S.R.; Riordan, C.; Olson, J.M. The influence of spectral solar irradiance variations on the performance of selected single-junction and multijunction solar cells. Sol. Cells 1991, 31, 259–278. [Google Scholar] [CrossRef]
  18. Kirn, B.; Topic, M. Diffuse and direct light solar spectra modeling in pv module performance rating. Sol. Energy 2017, 150, 310–316. [Google Scholar] [CrossRef] [Green Version]
  19. Nofuentes, G.; García-Domingo, B.; Muñoz, J.V.; Chenlo, F. Analysis of the dependence of the spectral factor of some pv technologies on the solar spectrum distribution. Appl. Energy 2014, 113, 302–309. [Google Scholar] [CrossRef]
  20. Alonso-Abella, M.; Chenlo, F.; Nofuentes, G.; Torres-Ramírez, M. Analysis of spectral effects on the energy yield of different pv (photovoltaic) technologies: The case of four specific sites. Energy 2014, 67, 435–443. [Google Scholar] [CrossRef]
  21. Bird, R.E.; Riordan, C. Simple solar spectral model for direct and diffuse irradiance on horizontal and tilted planes at the earth’s surface for cloudless atmospheres. J. Clim. Appl. Meteorol. 1986, 25, 87–97. [Google Scholar] [CrossRef] [Green Version]
  22. Gueymard, C.A.; Myers, D.; Emery, K. Proposed reference irradiance spectra for solar energy systems testing. Sol. Energy 2002, 73, 443–467. [Google Scholar] [CrossRef]
  23. Takamoto, T.; Washio, H.; Juso, H. Application of ingap/gaas/ingaas triple junction solar cells to space use and concentrator photovoltaic. In Proceedings of the 2014 IEEE 40th Photovoltaic Specialist Conference (PVSC), Denver, CO, USA, 8–13 June 2014; pp. 1–5. [Google Scholar]
  24. Itagaki, A.; Okamura, H.; Yamada, M. Preparation of meteorological data set throughout japan for suitable design of pv systems. In Proceedings of the 3rd World Conference on Photovoltaic Energy Conversion, Osaka, Japan, 11–18 May 2003; pp. 2074–2077. [Google Scholar]
  25. Hay, J.E. Calculation of monthly mean solar radiation for horizontal and inclined surfaces. Sol. Energy 1979, 23, 301–307. [Google Scholar] [CrossRef]
  26. New Energy and Industrial Technology Development Organization, Spectrum Database. Available online: http://app0_2.infoc.nedo.go.jp/ (accessed on 6 December 2019).
  27. Brown, A.; Green, M. Radiative coupling as a means to reduce spectral mismatch in monolithic tandem solar cell stacks-theoretical considerations. In Proceedings of the Twenty-Ninth IEEE Photovoltaic Specialists Conference, New Orleans, LA, USA, 19–24 May 2002; pp. 868–871. [Google Scholar]
  28. Araki, K.; Lee, K.H.; Yamaguchi, M. Opportunities for breaking an energy generation limit of photovoltaic using multijunction and super-multijunction cells. In Proceedings of the 2018 18th International Workshop on Junction Technology (IWJT), Shanghai, China, 8–9 March 2018; pp. 1–4. [Google Scholar]
  29. Geisz, J.F.; Steiner, M.A.; Garcia, I.; France, R.M.; McMahon, W.E.; Osterwald, C.R.; Friedman, D.J. Generalized optoelectronic model of series-connected multijunction solar cells. IEEE J. Photovolt. 2015, 5, 1827–1839. [Google Scholar] [CrossRef] [Green Version]
  30. Sogabe, T.; Ogura, A.; Hung, C.Y.; Evstropov, V.; Mintairov, M.; Shvarts, M.; Okada, Y. Experimental characterization and self-consistent modeling of luminescence coupling effect in iii-v multijunction solar cells. Appl. Phys. Lett. 2013, 103, 263907. [Google Scholar] [CrossRef]
  31. Derkacs, D.; Bilir, D.T.; Sabnis, V.A. Luminescent coupling in gaas/gainnassb multijunction solar cells. IEEE J. Photovolt. 2013, 3, 520–527. [Google Scholar] [CrossRef]
  32. Nishioka, K.; Sakitani, N.; Kurobe, K.I.; Yamamoto, Y.; Ishikawa, Y.; Uraoka, Y.; Fuyuki, T. Analysis of the temperature characteristics in polycrystalline si solar cells using modified equivalent circuit model. Jpn. J. of Appl. Phys. Part 1 Regul. Pap. Short Notes Rev. Pap. 2003, 42, 7175–7179. [Google Scholar] [CrossRef]
  33. Alonso García, M.C.; Balenzategui, J.L. Estimation of photovoltaic module yearly temperature and performance based on nominal operation cell temperature calculations. Renew. Energy 2004, 29, 1997–2010. [Google Scholar] [CrossRef]
  34. Jakhrani, A.Q.; Othman, A.K.; Rigitand, A.R.H.; Samo, S.R. Comparison of solar photovoltaic module temperature models. World Appl. Sci. J. 2011, 14, 1–8. [Google Scholar]
  35. Araki, K.; Lee, K.H.; Yamaguchi, M. Bandgaps of multi-junction solar cells potentially determined at the sun height of the culmination on the winter solstice. Sol. Energy 2017, 153, 445–453. [Google Scholar] [CrossRef]
  36. Araki, K.; Ota, Y.; Saiki, H.; Tawa, H.; Nishioka, K.; Yamaguchi, M. Super-multi-junction solar cells—Device configuration with the potential for more than 50% annual energy conversion efficiency (Non-Concentration). Appl. Sci. 2019, 9, 4598. [Google Scholar] [CrossRef] [Green Version]
  37. Ota, Y.; Ueda, K.; Takamoto, T.; Nishioka, K. Output evaluation of a world’s highest efficiency flat sub module with InGaP/GaAs/InGaAs inverted triple-junction solar cell under outdoor operation. Jpn. J. Appl. Phys. 2018, 57, 08RD08. [Google Scholar] [CrossRef]
  38. Reise, C.; Müller, B.; Moser, D.; Belluardo, G.; Ingenhoven, P. Uncertainties in PV System Yield Predictions and Assessments; IEA-PVPS T13-12: St. Ursen, Switzerland, 2018. [Google Scholar]
  39. Green, M.A.; Emery, K.; Hishikawa, Y.; Warta, W.; Dunlop, E.D. Solar cell efficiency tables (version 39). Prog. Photovolt. 2012, 20, 12–20. [Google Scholar] [CrossRef]
  40. Green, M.A.; Emery, K.; Hishikawa, Y.; Warta, W.; Dunlop, E.D. Solar cell efficiency tables (version 48). Prog. Photovolt. 2016, 24, 905–913. [Google Scholar] [CrossRef] [Green Version]
Figure 1. Three types of photovoltaic (PV) modules installed at University of Miyazaki.
Applsci 10 00703 g001
Figure 2. Spectro-radiometers installed at the University of Miyazaki.
Applsci 10 00703 g002
Figure 3. Relationship between the incident angle and optical efficiency of Si and inverted metamorphic (IMM).
Applsci 10 00703 g003
Figure 4. Seasonal trend of atmospheric parameters in Miyazaki.
Applsci 10 00703 g004
Figure 5. Comparison with measured and estimated values of global irradiances tilted at 35°.
Applsci 10 00703 g005
Figure 6. Comparison with measured and estimated values of performance ratio (PR). Three types of PV modules were measured from 1 August in 2016 to 31 July in 2018.
Applsci 10 00703 g006
Figure 7. Classification of solar radiation climate zone at 837 points throughout Japan.
Applsci 10 00703 g007
Figure 8. Results of the annual forecasting PV energy yield per rated power (kWh/kW) in Japan.
Applsci 10 00703 g008
Figure 9. Results of the annual forecasting PV energy yield per module area (kWh/m2) in Japan.
Applsci 10 00703 g009
Figure 10. Comparison with PR estimated by each PV output forecasting model.
Applsci 10 00703 g010
Figure 11. Comparison of each prediction model to the normal distribution of residual errors.
Applsci 10 00703 g011
Figure 12. External quantum efficiency EQE of single-crystalline Si [39] and IMM solar cells [40] and reference solar spectrum.
Applsci 10 00703 g012
Table 1. Parameter-set of the PV output forecasting model.
Cloud ConditionsAtmospheric ParametersIncident Angle ModifierAir Mass
Case-1 (MS2E)
Case-2
Case-3
Case-4
Table 2. Influence of the incident angle modifier on annual total solar irradiance.
Annual Irradiance without Incident Angle Modifier (kWh/m2)Annual Irradiance with Incident Angle Modifier (kWh/m2)Effective Insolation Rate
Fixed Si1606158698.75%
Tracking Si1923191799.69%
Fixed IMM1606157798.19%

