Curcumin Mitigates AFB1-Induced Hepatic Toxicity by Triggering Cattle Antioxidant and Anti-inflammatory Pathways: A Whole Transcriptomic In Vitro Study

 ,
,  , and
, and 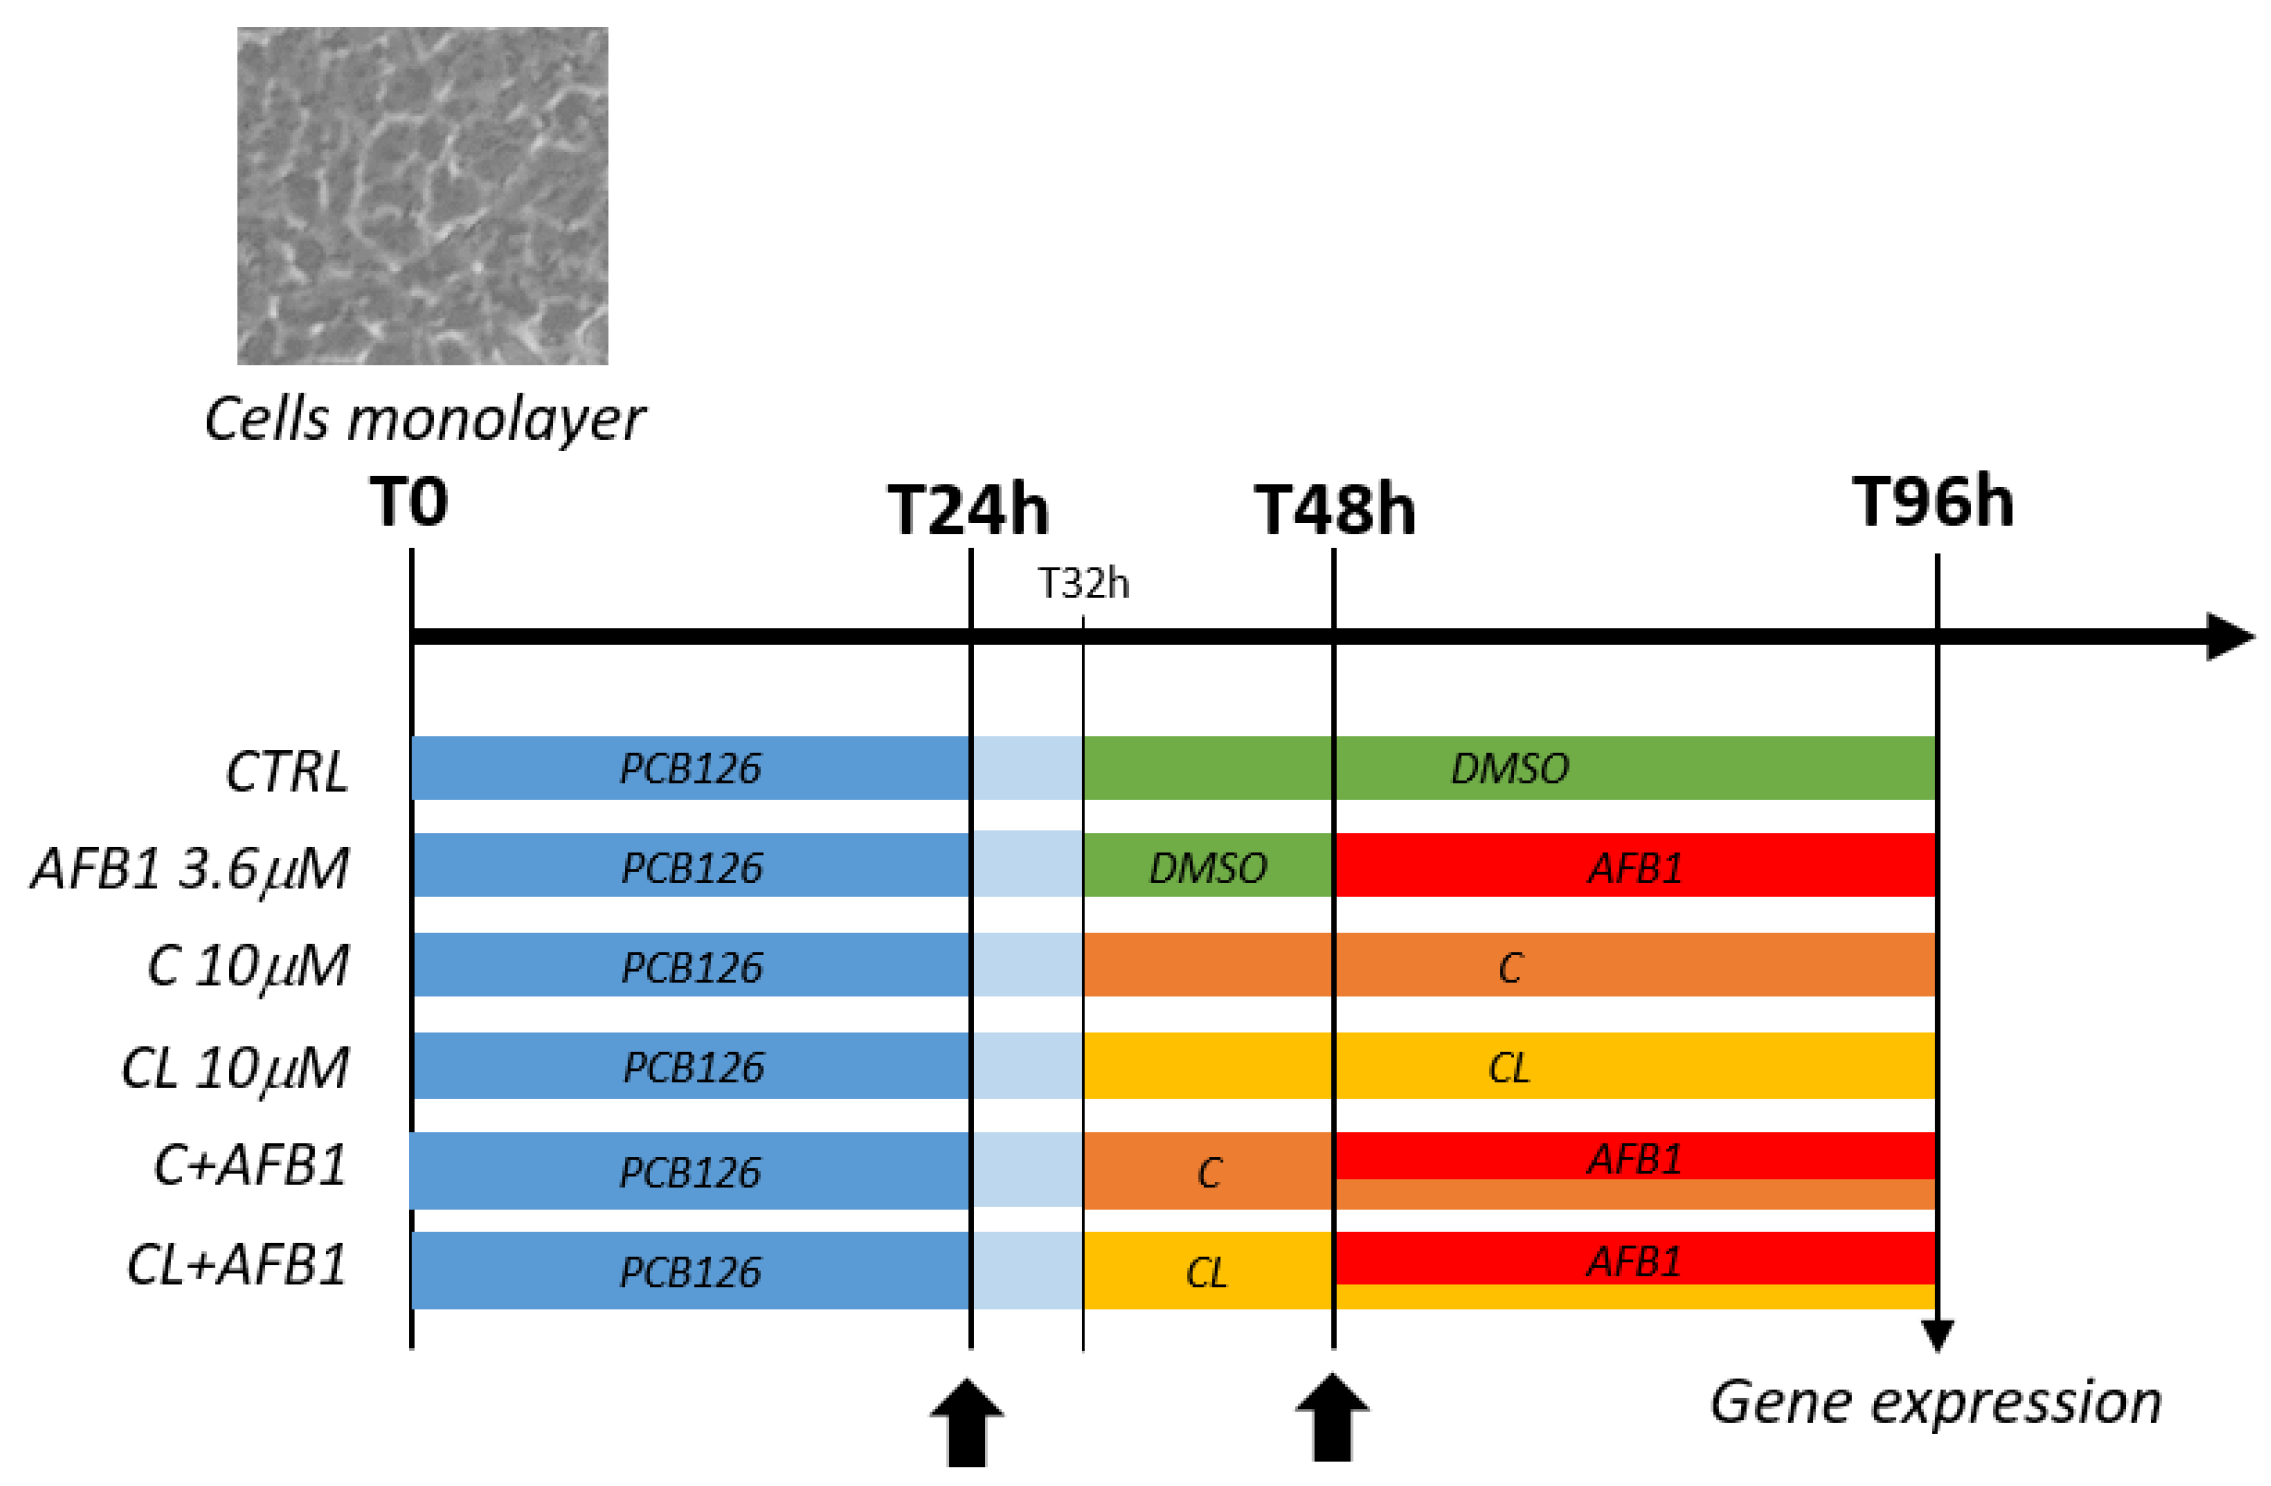
Abstract
:1. Introduction
2. Materials and Methods
2.1. Materials
2.2. Cell Culture
2.3. Curcuminoids Cytotoxicity
2.4. Cells Incubation for Gene Expression Analysis
2.5. Quantitative Real-Time PCR (qPCR)
2.6. RNA-Seq Library Preparation and Sequencing
2.7. Differential Expression Analysis
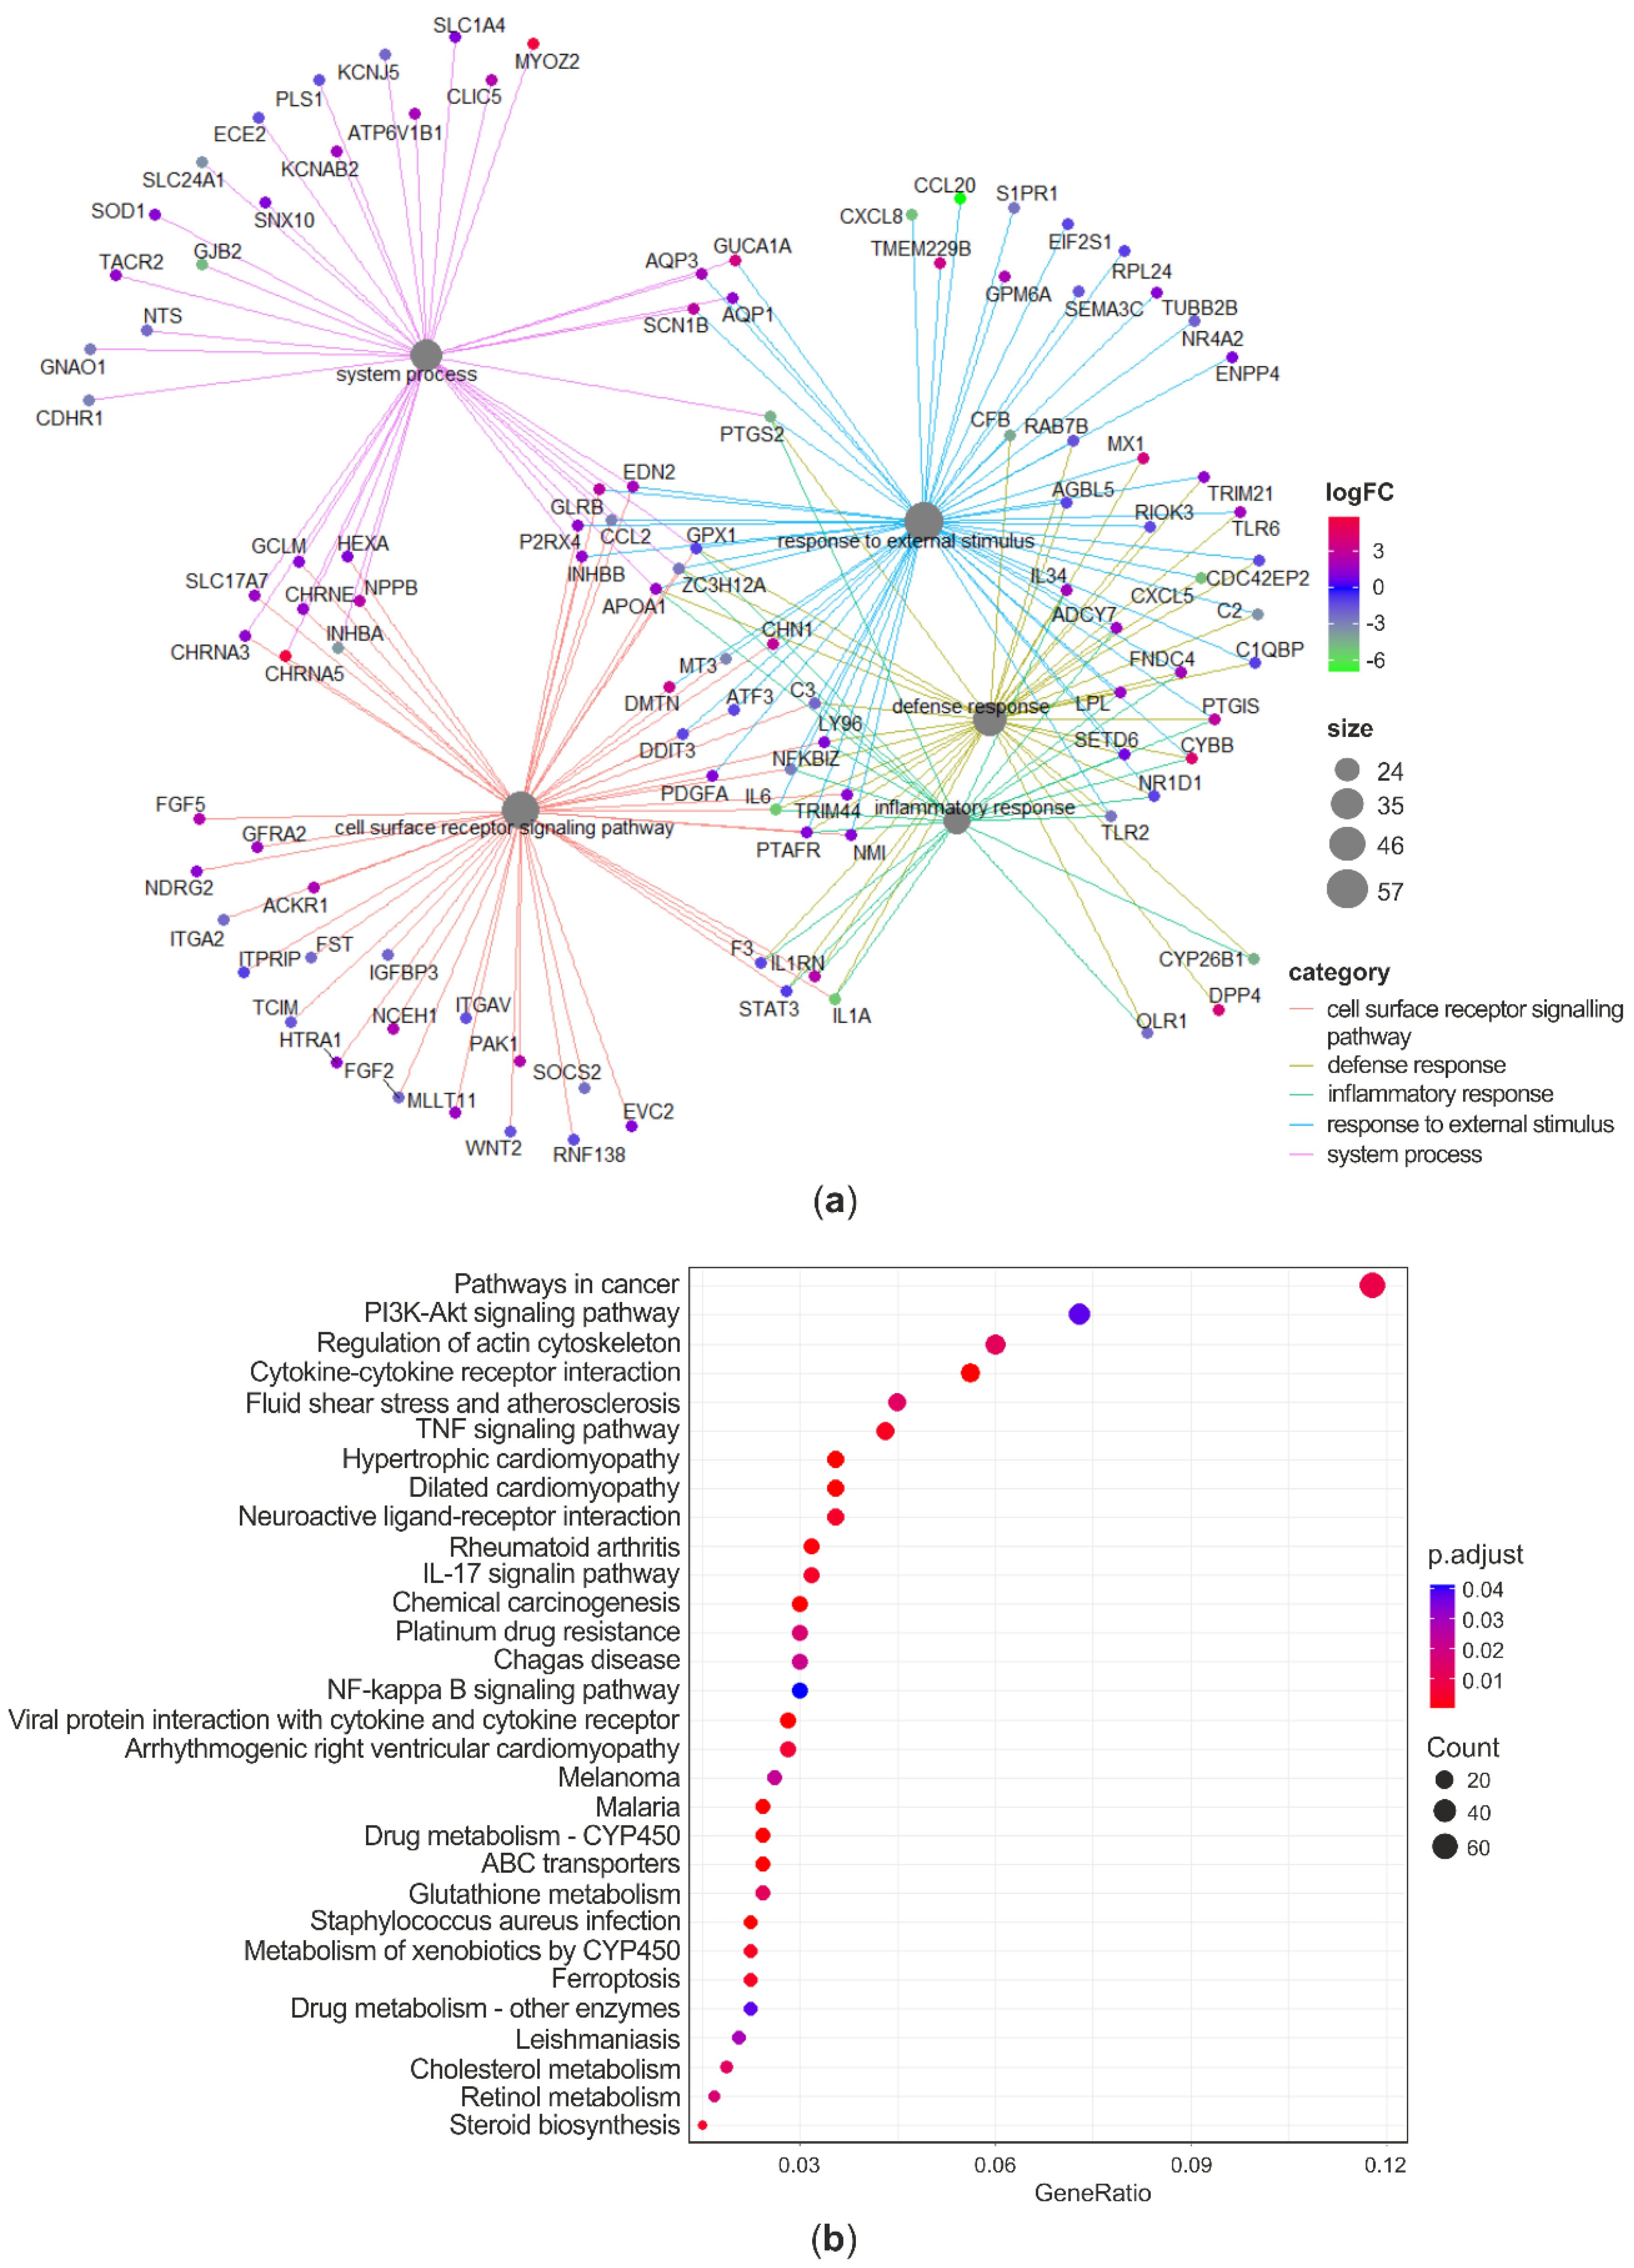
2.8. Functional Enrichment Analysis
2.9. Analytical Investigations
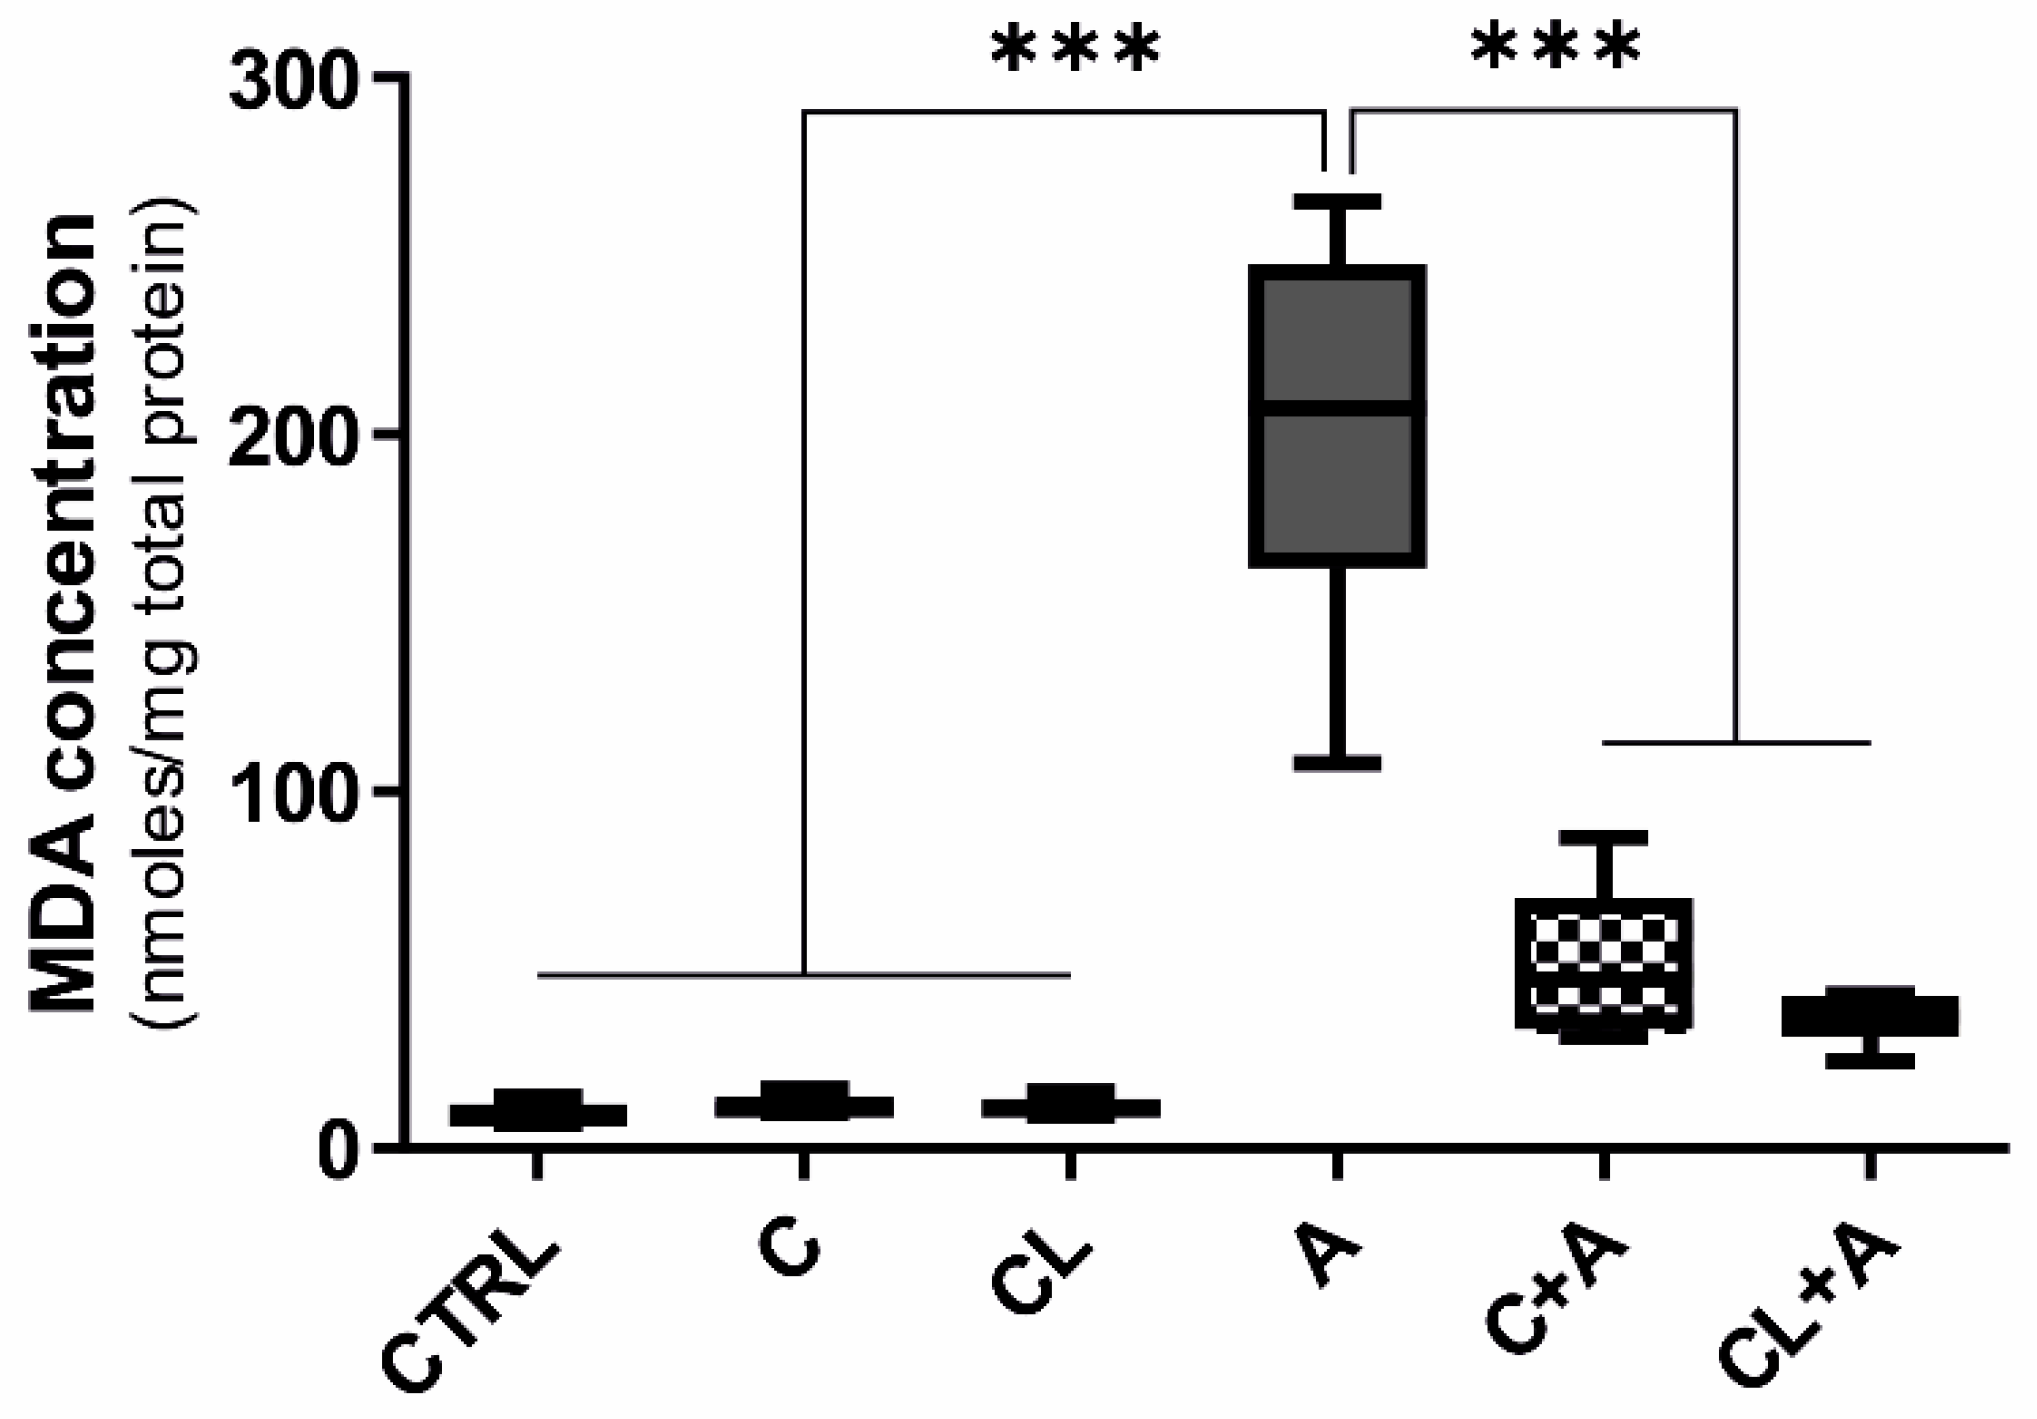
2.10. Oxidative Stress
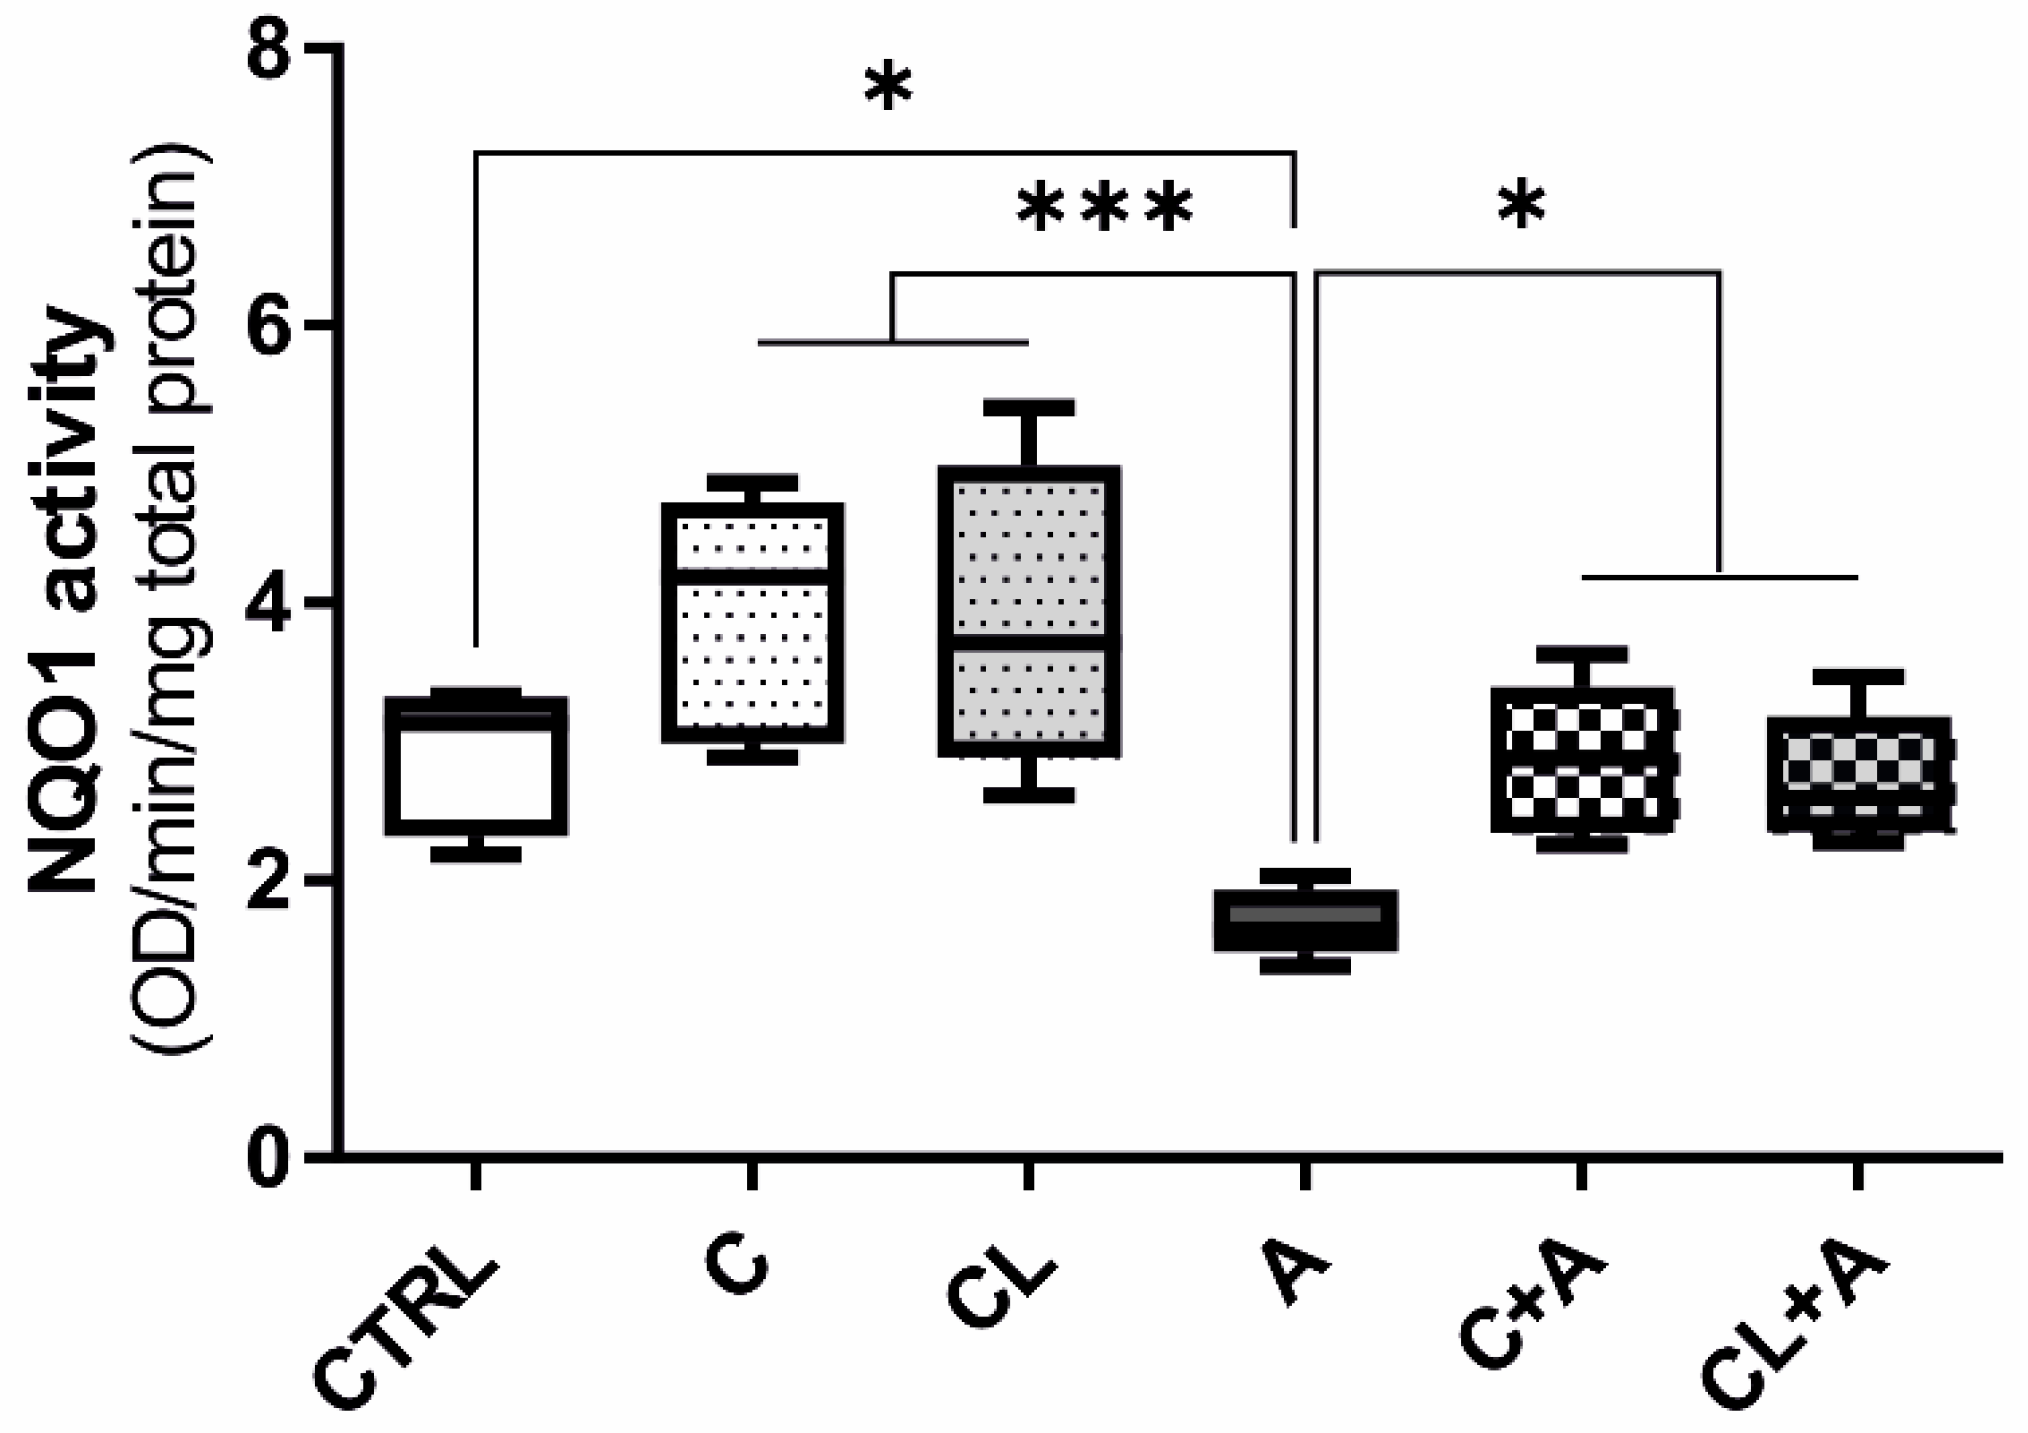
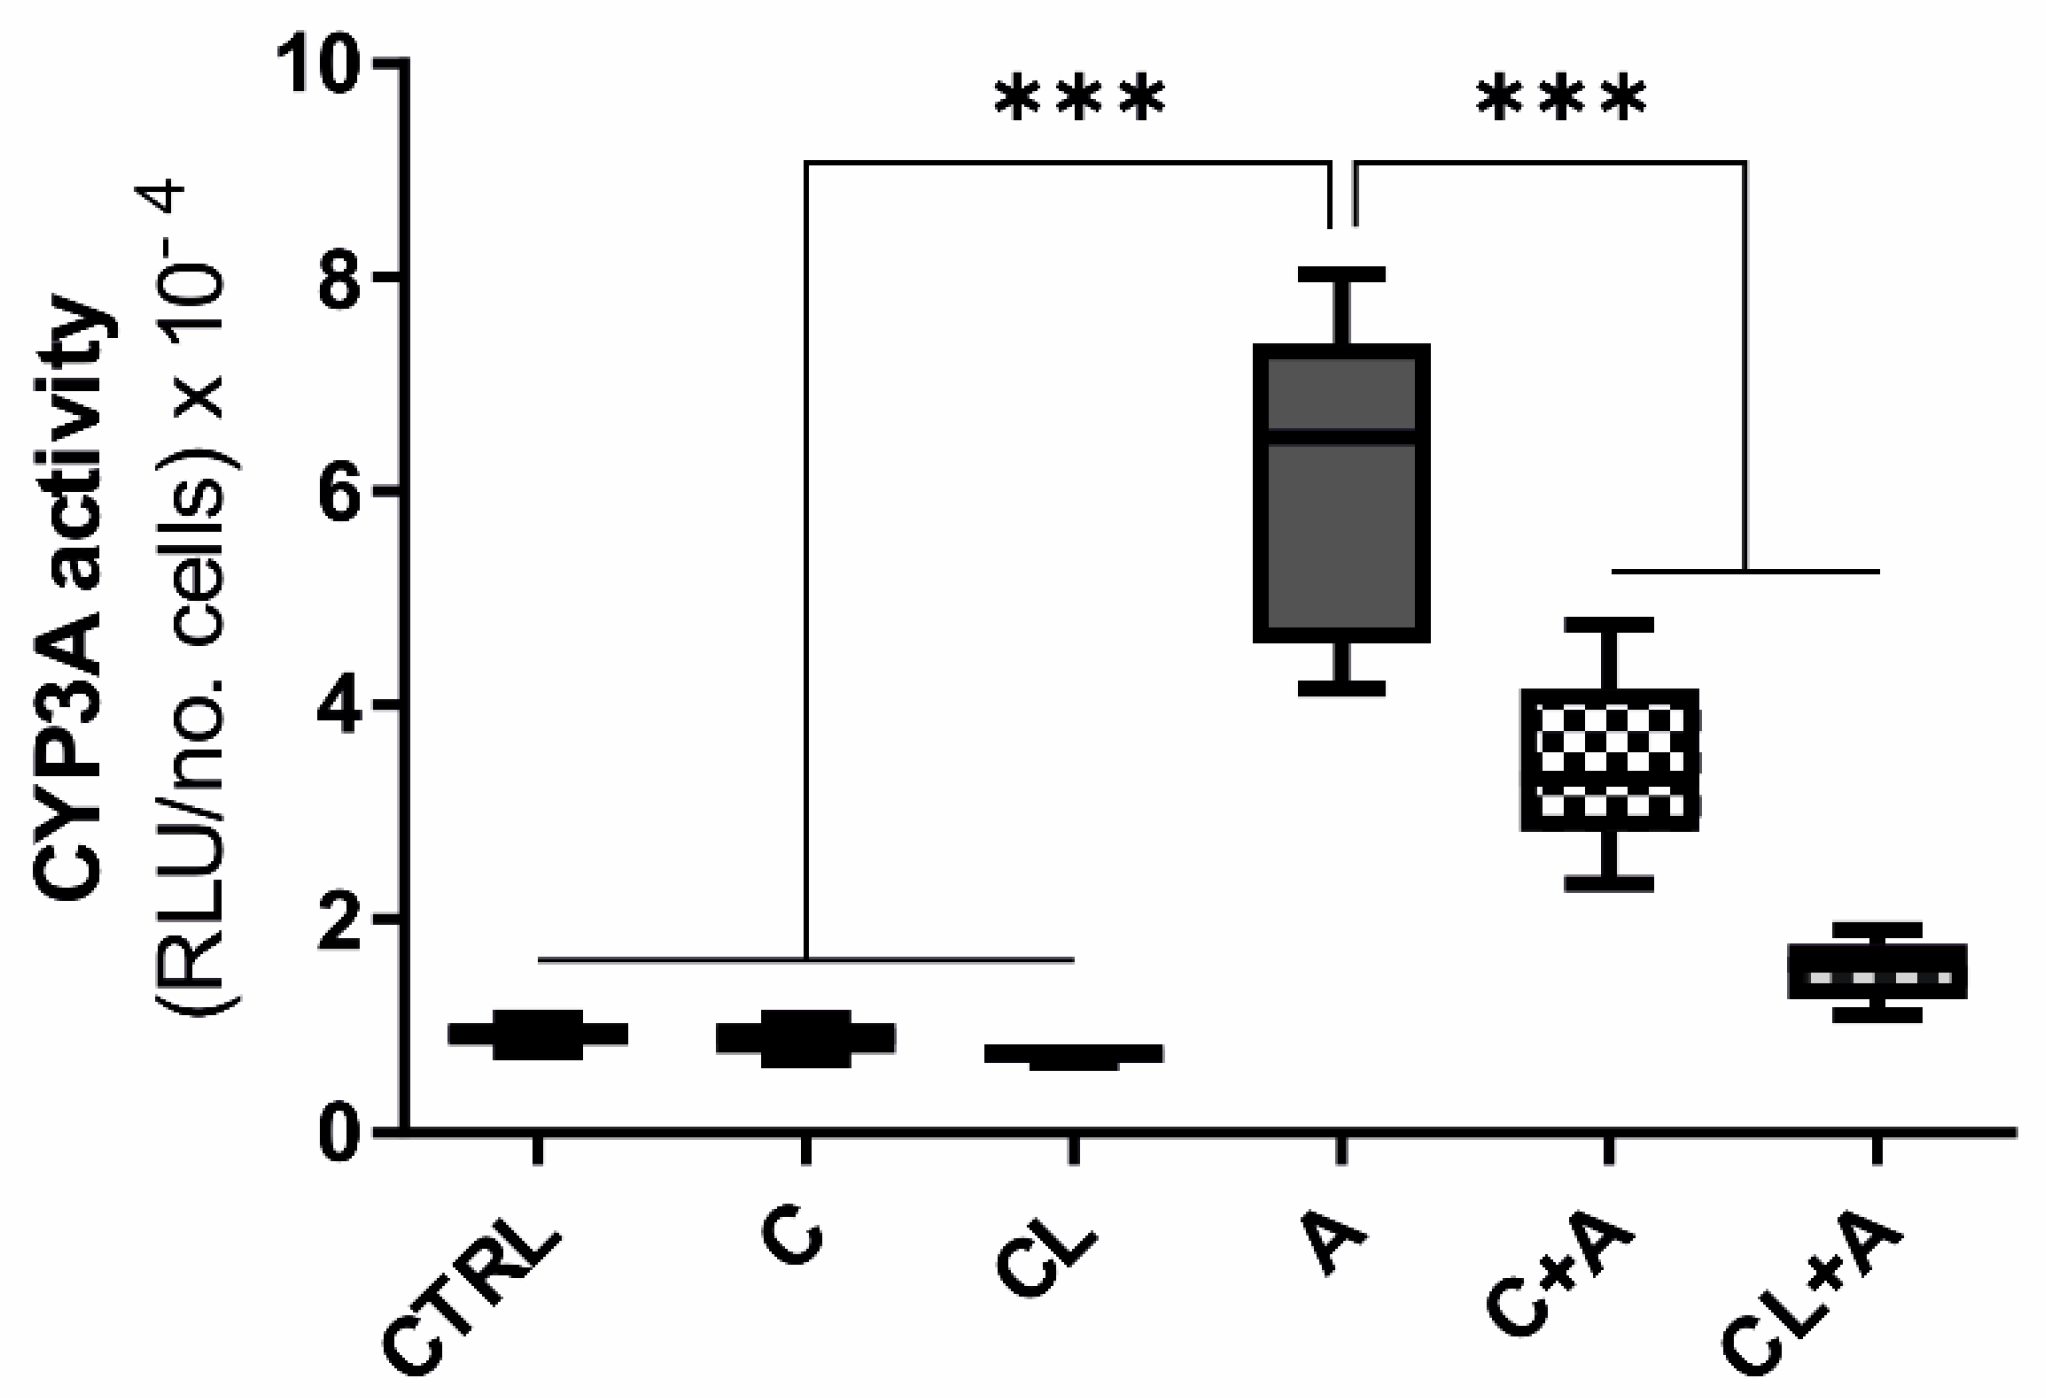
2.11. NQO1 and CYP3A Enzymatic Activity
2.12. Statistical Analysis
3. Results
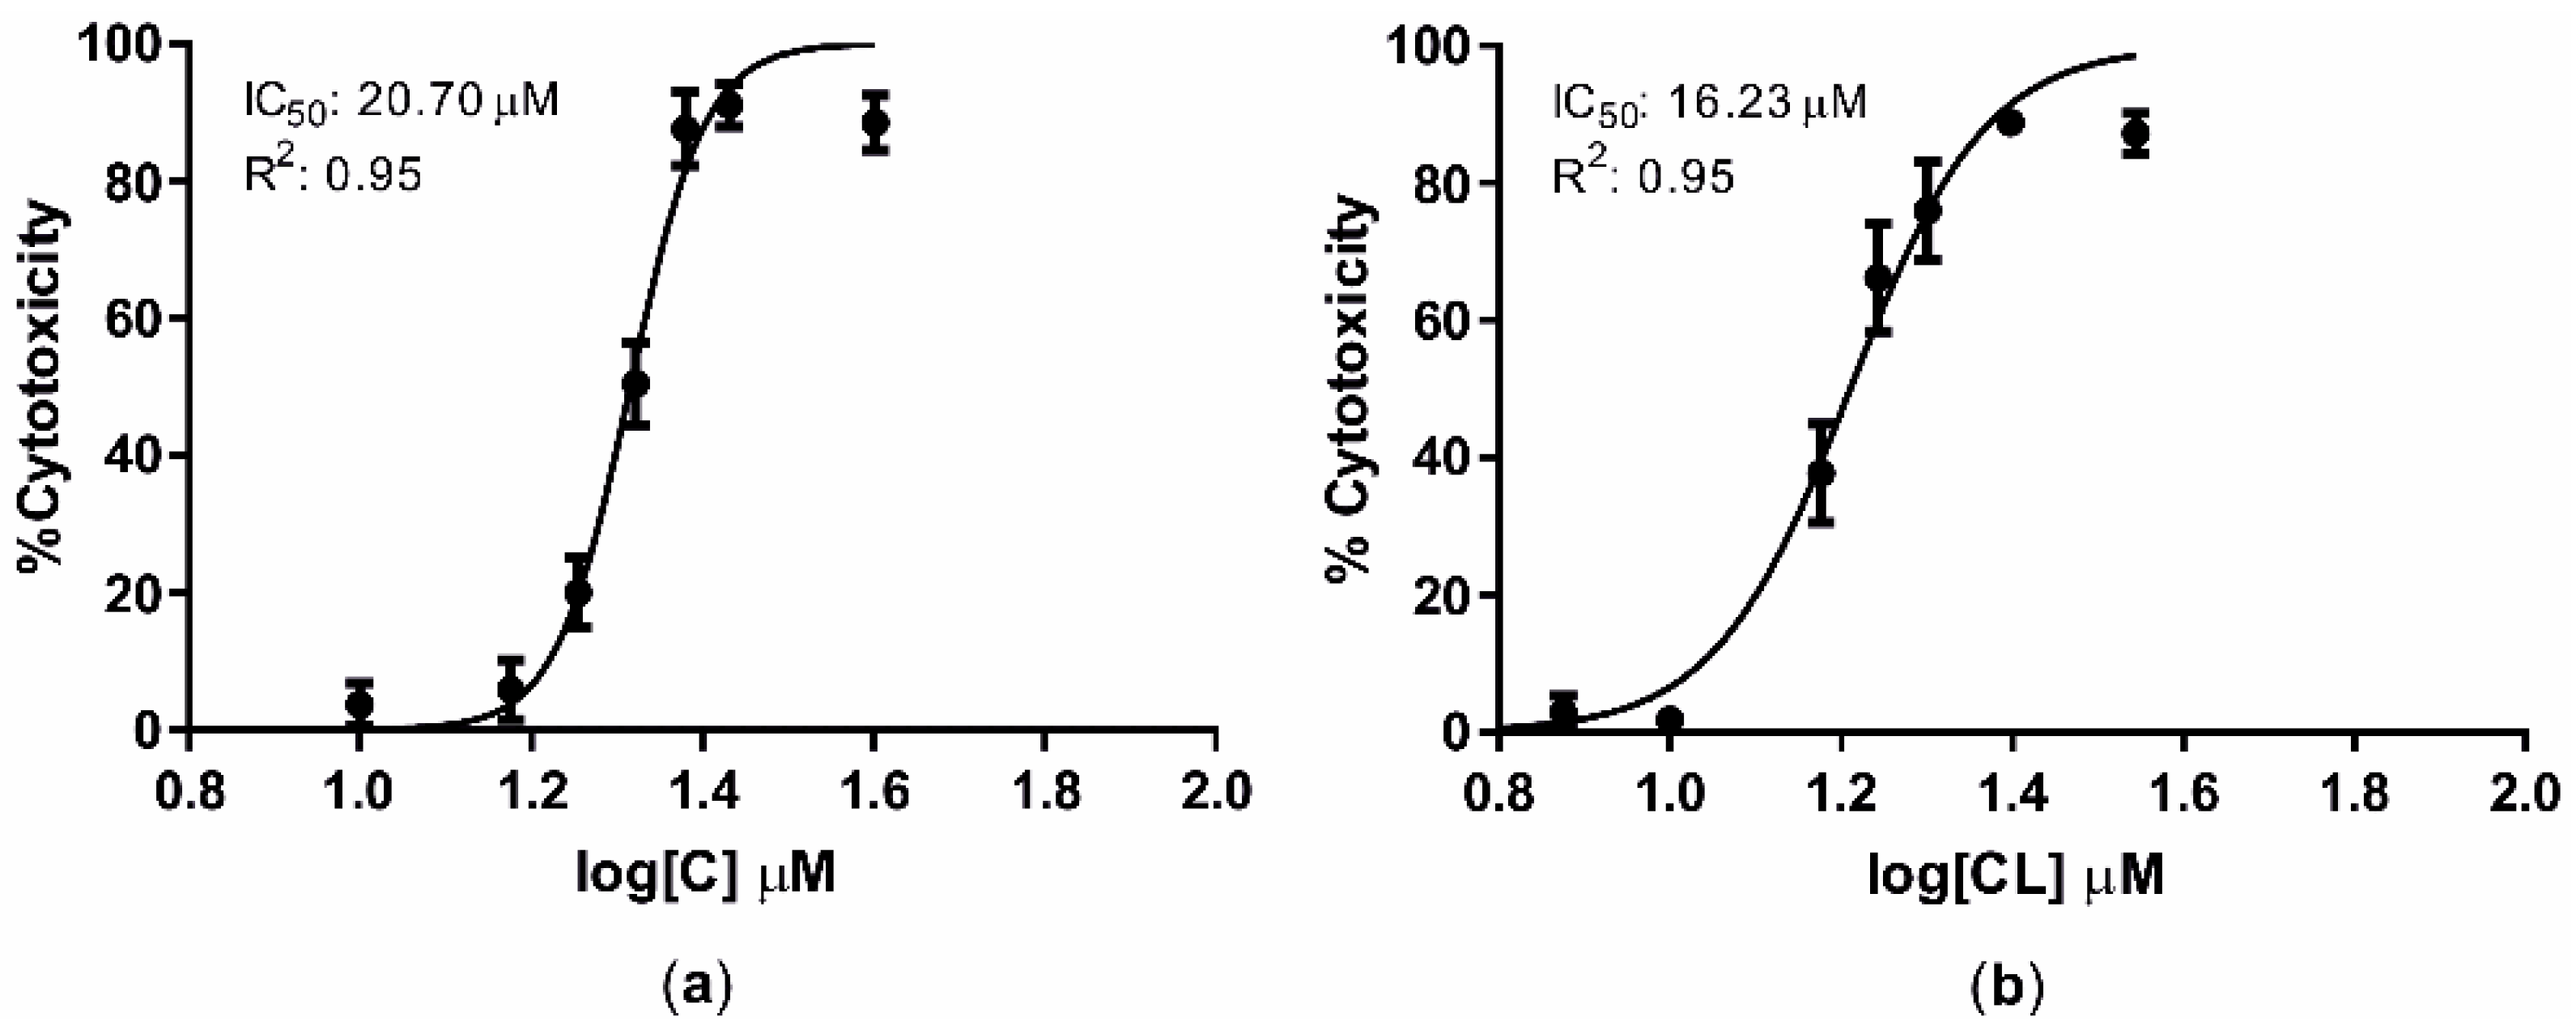
3.1. Curcuminoids Cytotoxicity
3.2. Aflatoxin B1 Biotransformation in BFH12 Cells
3.3. Target Gene Expression Analysis
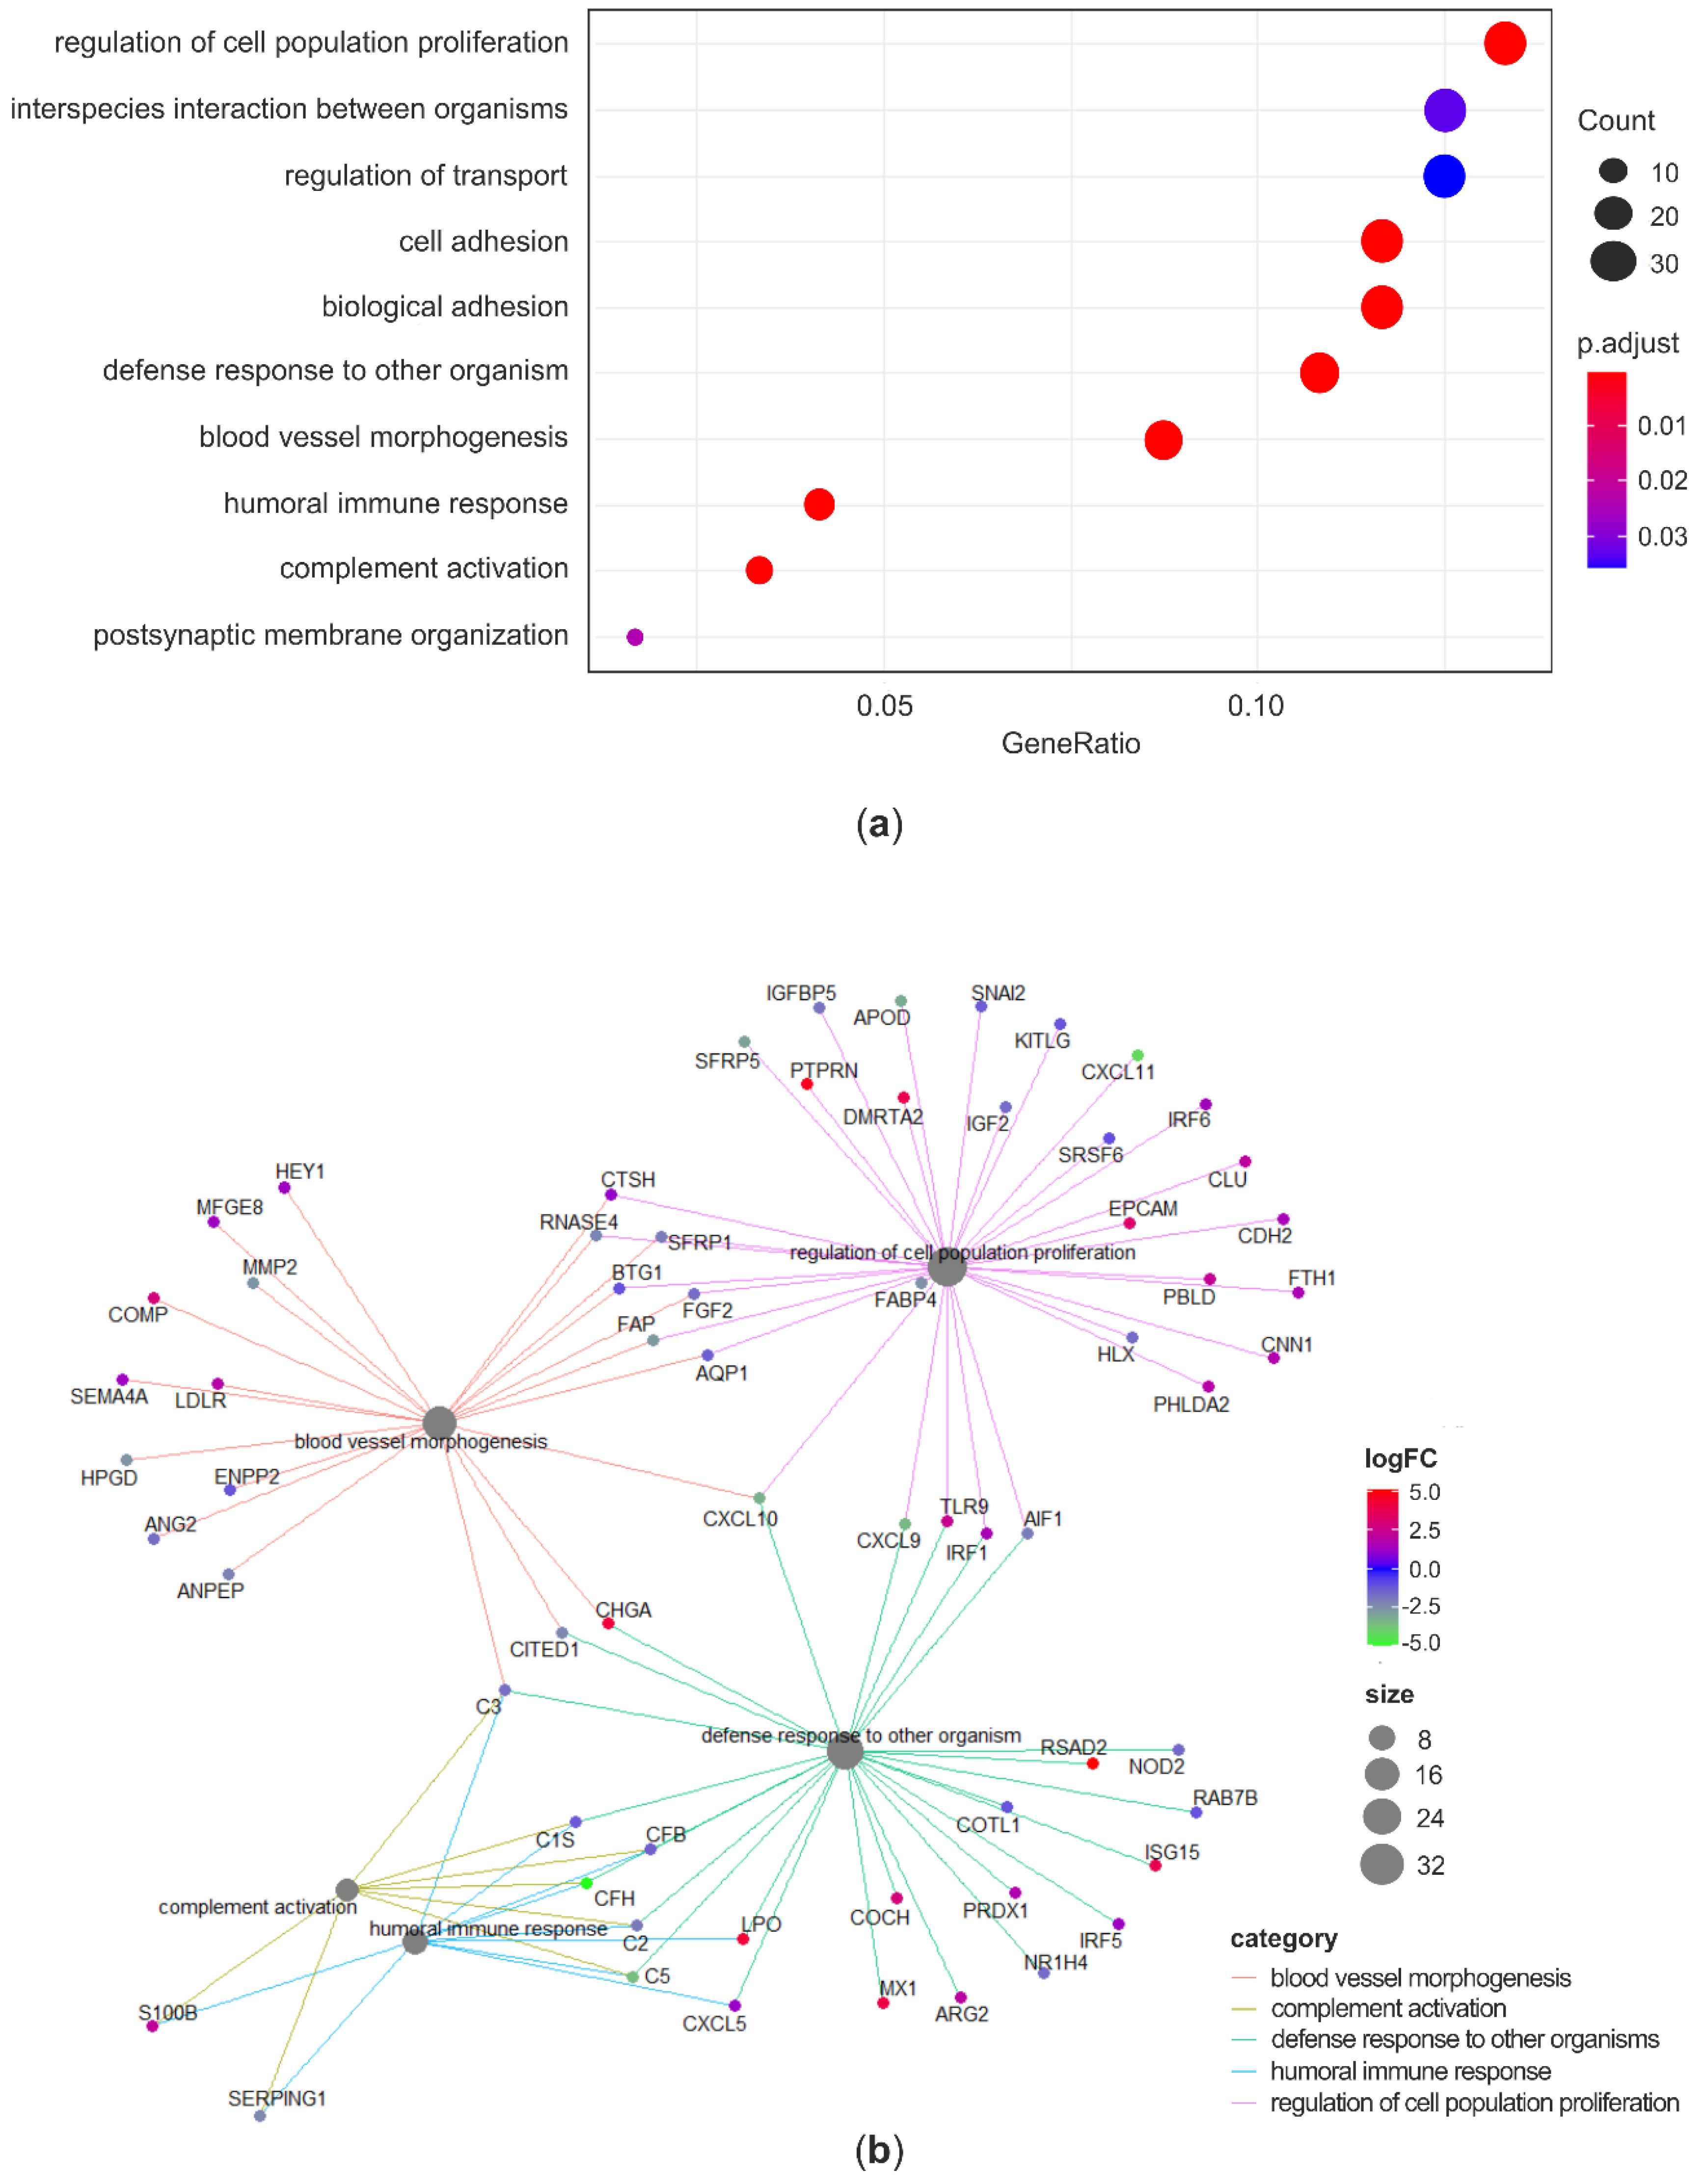
3.4. Whole-Transcriptome Differential Expression Analysis
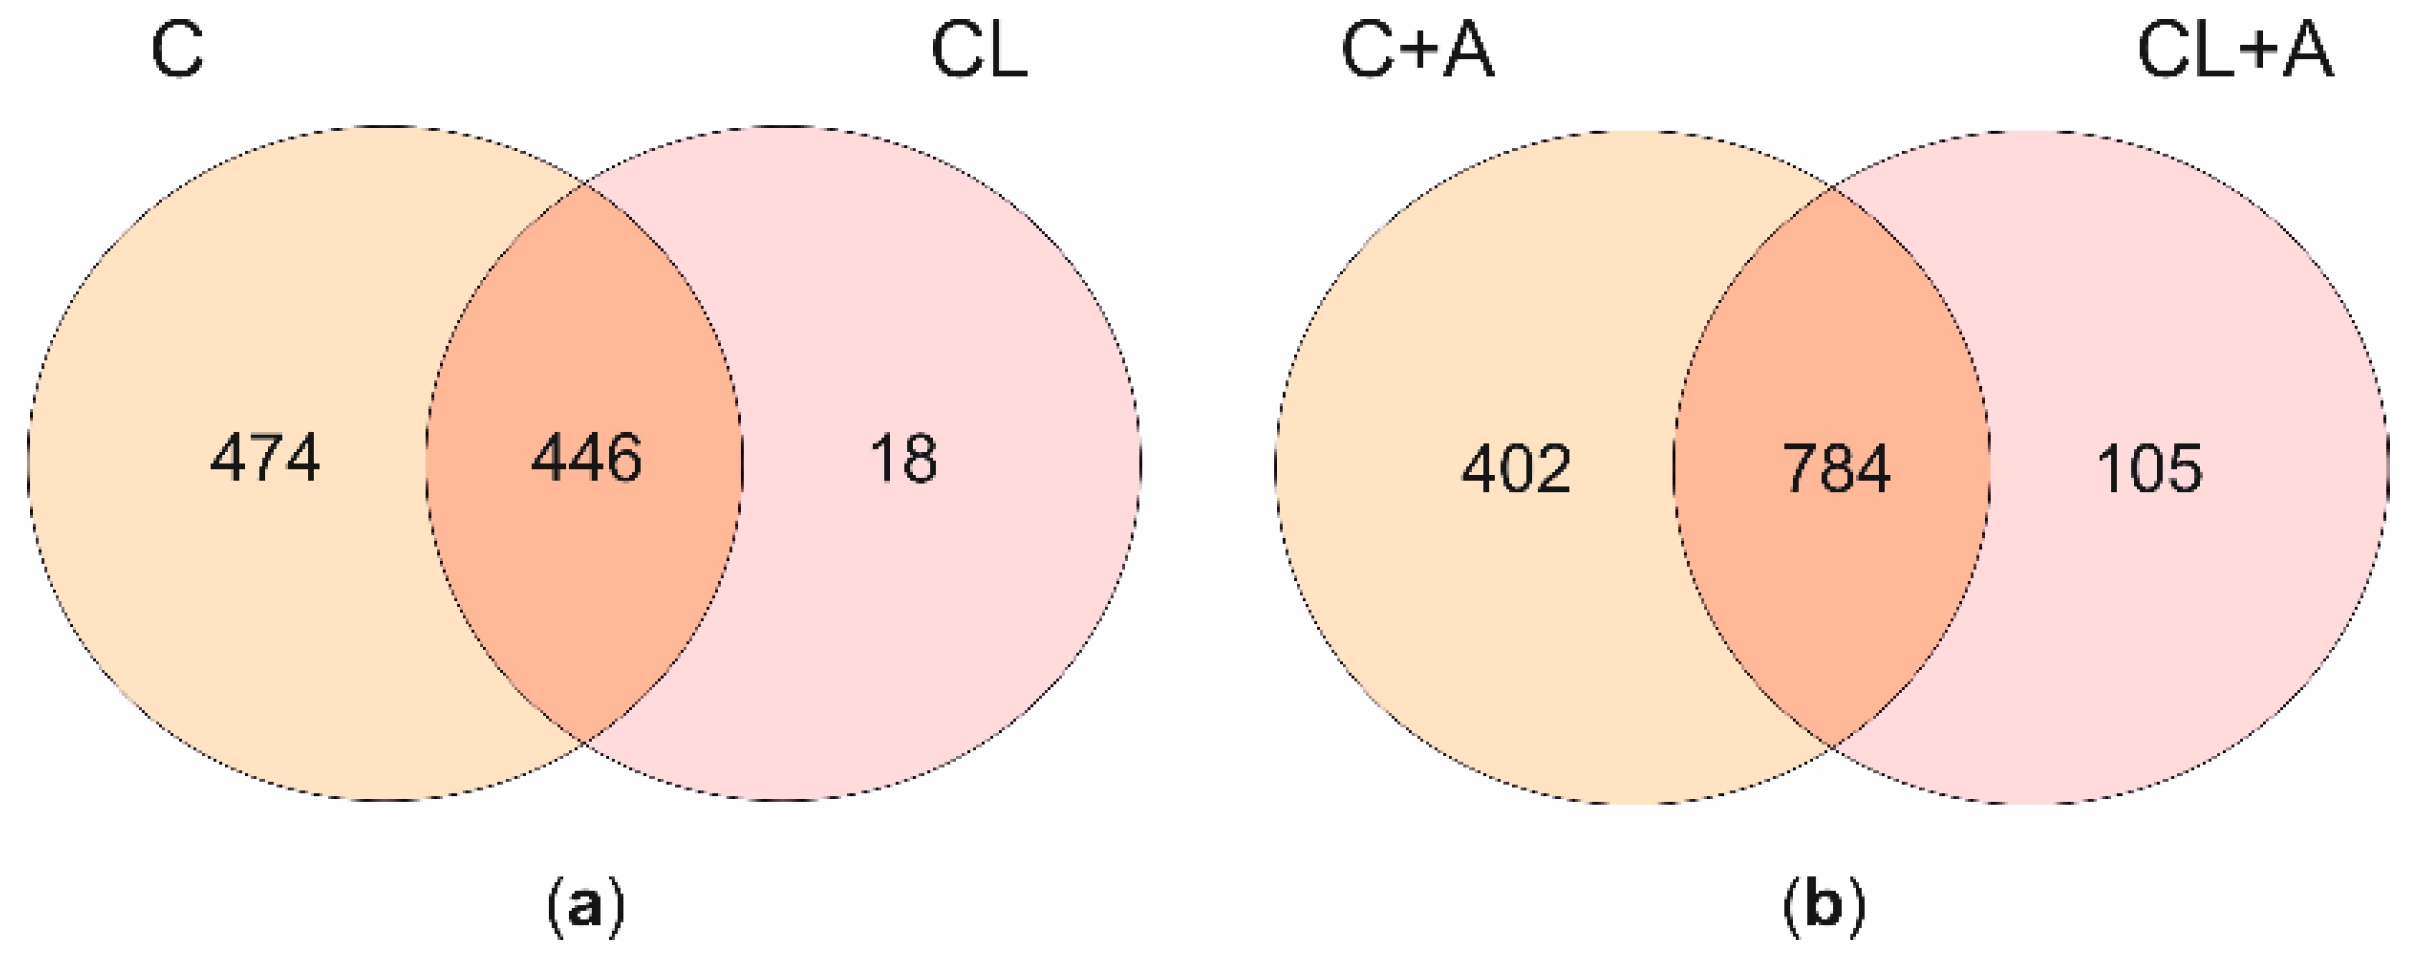
3.4.1. Transcriptional Effects of Curcuminoids
3.4.2. Effects of Curcuminoids on AFB1-Induced Transcriptional Changes
3.5. Oxidative Stress
3.6. NQO1 Enzymatic Activity
3.7. CYP3A Enzymatic Activity
4. Discussion
4.1. Curcuminoids Cytotoxicity
4.2. Aflatoxin B1 Biotransformation
4.3. RNA-Seq Analysis of Curcuminoids-Exposed Cells
4.4. RNA-Seq Analysis of Cells Coexposed to C and AFB1
4.4.1. Antioxidant Response
4.4.2. Defense Response and Inflammation
4.4.3. Cancer
4.4.4. Drug Metabolism and Drug Transporters
5. Conclusions
Supplementary Materials
Author Contributions
Funding
Acknowledgments
Conflicts of Interest
References
- Koehler, P.E.; Hanlin, R.T.; Beraha, L. Production of Aflatoxins B1 and G1 by Aspergillus flavus and Aspergillus parasiticus Isolated from Market Pecans. Appl. Microbiol. 1975, 30, 581–583. [Google Scholar] [CrossRef] [PubMed] [Green Version]
- IARC. IARC monographs on the evaluation of carcinogenic risks to humans. IARC Monogr. Eval. Carcinog. Risks Hum. 2010, 93, 9–38. [Google Scholar] [CrossRef] [Green Version]
- Guchi, E. Aflatoxin Contamination in Groundnut (Arachis hypogaea L.) Caused by Aspergillus Species in Ethiopia. J. Appl. Environ. Microbiol. 2015. [Google Scholar] [CrossRef]
- Mehdi, Y.; Dufrasne, I. Selenium in cattle: A review. Molecules 2016, 21, 545. [Google Scholar] [CrossRef] [Green Version]
- Hussein, H.S.; Brasel, J.M. Toxicity, metabolism, and impact of mycotoxins on humans and animals. Toxicology 2001, 167, 101–134. [Google Scholar] [CrossRef]
- Monson, M.S.; Settlage, R.E.; McMahon, K.W.; Mendoza, K.M.; Rawal, S.; El-Nezami, H.S.; Coulombe, R.A.; Reed, K.M. Response of the hepatic transcriptome to aflatoxin b1in domestic turkey (Meleagris gallopavo). PLoS ONE 2014. [Google Scholar] [CrossRef] [Green Version]
- Rustemeyer, S.M.; Lamberson, W.R.; Ledoux, D.R.; Wells, K.; Austin, K.J.; Cammack, K.M. Effects of dietary aflatoxin on the hepatic expression of apoptosis genes in growing barrows. J. Anim. Sci. 2011, 89, 916–925. [Google Scholar] [CrossRef] [Green Version]
- Shi, F.; Seng, X.; Tang, H.; Zhao, S.; Deng, Y.; Jin, R.; Li, Y. Effect of low levels of aflatoxin B1 on performance, serum biochemistry, hepatocyte apoptosis and liver histopathological changes of cherry valley ducks. J. Anim. Vet. Adv. 2013, 12, 1126–1130. [Google Scholar] [CrossRef]
- Rawal, S.; Kim, J.E.; Coulombe, R. Aflatoxin B1 in poultry: Toxicology, metabolism and prevention. Res. Vet. Sci. 2010, 89, 325–331. [Google Scholar] [CrossRef]
- Wu, F.; Guclu, H. Aflatoxin Regulations in a Network of Global Maize Trade. PLoS ONE 2012. [Google Scholar] [CrossRef] [Green Version]
- Deng, J.; Zhao, L.; Zhang, N.Y.; Karrow, N.A.; Krumm, C.S.; Qi, D.S.; Sun, L.H. Aflatoxin B 1 metabolism: Regulation by phase I and II metabolizing enzymes and chemoprotective agents. Mutat. Res. Rev. Mutat. Res. 2018, 778, 79–89. [Google Scholar] [CrossRef] [PubMed]
- Dohnal, V.; Wu, Q.; Kuča, K. Metabolism of aflatoxins: Key enzymes and interindividual as well as interspecies differences. Arch. Toxicol. 2014, 88, 1635–1644. [Google Scholar] [CrossRef]
- Fink-Gremmels, J. Mycotoxins in cattle feeds and carry-over to dairy milk: A review. Food Addit. Contam. Part A Chem. Anal. Control. Expo. Risk Assess. 2008, 25, 172–180. [Google Scholar] [CrossRef] [PubMed] [Green Version]
- Gallo, A.; Giuberti, G.; Frisvad, J.C.; Bertuzzi, T.; Nielsen, K.F. Review on mycotoxin issues in ruminants: Occurrence in forages, effects of mycotoxin ingestion on health status and animal performance and practical strategies to counteract their negative effects. Toxins 2015, 7, 3057–3111. [Google Scholar] [CrossRef]
- Prandini, A.; Tansini, G.; Sigolo, S.; Filippi, L.; Laporta, M.; Piva, G. On the occurrence of aflatoxin M1 in milk and dairy products. Food Chem. Toxicol. 2009, 47, 984–991. [Google Scholar] [CrossRef]
- Limaye, A.; Yu, R.C.; Chou, C.C.; Liu, J.R.; Cheng, K.C. Protective and detoxifying effects conferred by dietary selenium and curcumin against AFB1-mediated toxicity in livestock: A review. Toxins 2018, 10, 25. [Google Scholar] [CrossRef] [PubMed] [Green Version]
- Salem, R.; El-Habashi, N.; Fadl, S.E.; Sakr, O.A.; Elbialy, Z.I. Effect of probiotic supplement on aflatoxicosis and gene expression in the liver of broiler chicken. Environ. Toxicol. Pharmacol. 2018, 60, 118–127. [Google Scholar] [CrossRef]
- Fan, Y.; Liu, L.; Zhao, L.; Wang, X.; Wang, D.; Huang, C.; Zhang, J.; Ji, C.; Ma, Q. Influence of Bacillus subtilis ANSB060 on growth, digestive enzyme and aflatoxin residue in Yellow River carp fed diets contaminated with aflatoxin B1. Food Chem. Toxicol. 2018, 113, 108–114. [Google Scholar] [CrossRef]
- Thieu, N.Q.; Ogle, B.; Pettersson, H. Efficacy of bentonite clay in ameliorating aflatoxicosis in piglets fed aflatoxin contaminated diets. Trop. Anim. Health Prod. 2008, 40, 649–656. [Google Scholar] [CrossRef]
- Ghadiri, S.; Spalenza, V.; Dellafiora, L.; Badino, P.; Barbarossa, A.; Dall’Asta, C.; Nebbia, C.; Girolami, F. Modulation of aflatoxin B1 cytotoxicity and aflatoxin M1 synthesis by natural antioxidants in a bovine mammary epithelial cell line. Toxicol. Vitr. 2019, 57, 174–183. [Google Scholar] [CrossRef]
- Taranu, I.; Marin, D.E.; Palade, M.; Pistol, G.C.; Chedea, V.S.; Gras, M.A.; Rotar, C. Assessment of the efficacy of a grape seed waste in counteracting the changes induced by aflatoxin B1 contaminated diet on performance, plasma, liver and intestinal tissues of pigs after weaning. Toxicon 2019, 162, 24–31. [Google Scholar] [CrossRef] [PubMed]
- Mohajeri, M.; Behnam, B.; Cicero, A.F.G.; Sahebkar, A. Protective effects of curcumin against aflatoxicosis: A comprehensive review. J. Cell. Physiol. 2018, 233, 3552–3577. [Google Scholar] [CrossRef] [PubMed]
- Sharma, R.A.; Steward, W.P.; Gescher, A.J. Pharmacokinetics and pharmacodynamics of curcumin. Adv. Exp. Med. Biol. 2007, 595, 453–470. [Google Scholar] [CrossRef] [Green Version]
- Nelson, K.M.; Dahlin, J.L.; Bisson, J.; Graham, J.; Pauli, G.F.; Walters, M.A. The Essential Medicinal Chemistry of Curcumin. J. Med. Chem. 2017, 60, 1620–1637. [Google Scholar] [CrossRef]
- Hussain, Z.; Thu, H.E.; Amjad, M.W.; Hussain, F.; Ahmed, T.A.; Khan, S. Exploring recent developments to improve antioxidant, anti-inflammatory and antimicrobial efficacy of curcumin: A review of new trends and future perspectives. Mater. Sci. Eng. C 2017, 77, 1316–1326. [Google Scholar] [CrossRef]
- Mahmud, M.; Piwoni, A.; Filiczak, N.; Janicka, M.; Gubernator, J. Long-circulating curcumin-loaded liposome formulations with high incorporation efficiency, stability and anticancer activity towards pancreatic adenocarcinoma cell lines in vitro. PLoS ONE 2016, 11, e0167787. [Google Scholar] [CrossRef] [Green Version]
- Dhillon, N.; Aggarwal, B.B.; Newman, R.A.; Wolff, R.A.; Kunnumakkara, A.B.; Abbruzzese, J.L.; Ng, C.S.; Badmaev, V.; Kurzrock, R. Phase II trial of curcumin in patients with advanced pancreatic cancer. Clin. Cancer Res. 2008, 14, 4491–4499. [Google Scholar] [CrossRef] [Green Version]
- Dasiram, J.D.; Ganesan, R.; Kannan, J.; Kotteeswaran, V.; Sivalingam, N. Curcumin inhibits growth potential by G1 cell cycle arrest and induces apoptosis in p53-mutated COLO 320DM human colon adenocarcinoma cells. Biomed. Pharmacother. 2017, 86, 373–380. [Google Scholar] [CrossRef]
- Allegra, A.; Innao, V.; Russo, S.; Gerace, D.; Alonci, A.; Musolino, C. Anticancer Activity of Curcumin and Its Analogues: Preclinical and Clinical Studies. Cancer Invest. 2017, 35, 1–22. [Google Scholar] [CrossRef]
- El-Agamy, D.S. Comparative effects of curcumin and resveratrol on aflatoxin B1-induced liver injury in rats. Arch. Toxicol. 2010, 84, 389–396. [Google Scholar] [CrossRef]
- El-Bahr, S.M. Effect of curcumin on hepatic antioxidant enzymes activities and gene expressions in rats intoxicated with aflatoxin B1. Phyther. Res. 2015, 29, 134–140. [Google Scholar] [CrossRef] [PubMed]
- El-Barbary, M.I. Detoxification and antioxidant effects of garlic and curcumin in Oreochromis niloticus injected with aflatoxin B1 with reference to gene expression of glutathione peroxidase (GPx) by RT-PCR. Fish Physiol. Biochem. 2016, 42, 617–629. [Google Scholar] [CrossRef] [PubMed]
- Yarru, L.P.; Settivari, R.S.; Gowda, N.K.S.; Antoniou, E.; Ledoux, D.R.; Rottinghaus, G.E. Effects of turmeric (curcuma longa) on the expression of hepatic genes associated with biotransformation, antioxidant, and immune systems in broiler chicks fed aflatoxin. Poult. Sci. 2009, 88, 2620–2627. [Google Scholar] [CrossRef] [PubMed]
- Lee, S.E.; Campbell, B.C.; Molyneux, R.J.; Hasegawa, S.; Lee, H.S. Inhibitory effects of naturally occurring compounds on aflatoxin B1 biotransformation. J. Agric. Food Chem. 2001, 49, 5171–5177. [Google Scholar] [CrossRef]
- Zhang, N.Y.; Qi, M.; Gao, X.; Zhao, L.; Liu, J.; Gu, C.Q.; Song, W.J.; Krumm, C.S.; Sun, L.H.; Qi, D.S. Response of the hepatic transcriptome to aflatoxin B1 in ducklings. Toxicon 2016, 111, 69–76. [Google Scholar] [CrossRef]
- Muhammad, I.; Sun, X.; Wang, H.; Li, W.; Wang, X.; Cheng, P.; Li, S.; Zhang, X.; Hamid, S. Curcumin successfully inhibited the computationally identified CYP2A6 enzyme-mediated bioactivation of aflatoxin B1 in arbor acres broiler. Front. Pharmacol. 2017, 8, 143. [Google Scholar] [CrossRef] [Green Version]
- Muhammad, I.; Wang, H.; Sun, X.; Wang, X.; Han, M.; Lu, Z.; Cheng, P.; Hussain, M.A.; Zhang, X. Dual role of dietary curcumin through attenuating AFB1-induced oxidative stress and liver injury via modulating liver phase-I and phase-II enzymes involved in AFB1 bioactivation and detoxification. Front. Pharmacol. 2018, 9, 554. [Google Scholar] [CrossRef] [Green Version]
- Mahfouz, M.E. Ameliorative effect of curcumin on aflatoxin B1-induced changes in liver gene expression of Oreochromis niloticus. Mol. Biol. 2015, 49, 313–324. [Google Scholar] [CrossRef]
- Wang, H.; Muhammad, I.; Li, W.; Sun, X.; Cheng, P.; Zhang, X. Sensitivity of Arbor Acres broilers and chemoprevention of aflatoxin B1-induced liver injury by curcumin, a natural potent inducer of phase-II enzymes and Nrf2. Environ. Toxicol. Pharmacol. 2018, 59, 94–104. [Google Scholar] [CrossRef]
- Zhang, N.Y.; Qi, M.; Zhao, L.; Zhu, M.K.; Guo, J.; Liu, J.; Gu, C.Q.; Rajput, S.A.; Krumm, C.S.; Qi, D.S.; et al. Curcumin prevents aflatoxin B1 hepatoxicity by inhibition of cytochrome P450 isozymes in chick liver. Toxins 2016, 8, 327. [Google Scholar] [CrossRef] [Green Version]
- Muhammad, I.; Wang, X.; Li, S.; Li, R.; Zhang, X. Curcumin confers hepatoprotection against AFB1—induced toxicity via activating autophagy and ameliorating inflammation involving Nrf2/HO-1 signaling pathway. Mol. Biol. Rep. 2018, 45, 1775–1785. [Google Scholar] [CrossRef] [PubMed]
- Gowda, N.K.S.; Ledoux, D.R.; Rottinghaus, G.E.; Bermudez, A.J.; Chen, Y.C. Efficacy of turmeric (Curcuma longa), containing a known level of curcumin, and a hydrated sodium calcium aluminosilicate to ameliorate the adverse effects of aflatoxin in broiler chicks. Poult. Sci. 2008, 87, 1125–1130. [Google Scholar] [CrossRef] [PubMed]
- Pauletto, M.; Tolosi, R.; Giantin, M.; Guerra, G.; Barbarossa, A.; Zaghini, A.; Dacasto, M. Insights into Aflatoxin B1 Toxicity in Cattle: An in vitro whole-transcriptomic approach. Toxins 2020, 12, 429. [Google Scholar] [CrossRef] [PubMed]
- Gleich, A.; Kaiser, B.; Schumann, J.; Fuhrmann, H. Establishment and characterisation of a novel bovine SV40 large T-antigen-transduced foetal hepatocyte-derived cell line. Vitr. Cell. Dev. Biol. Anim. 2016, 52, 662–672. [Google Scholar] [CrossRef] [PubMed]
- Gleich, A.; Kaiser, B.; Honscha, W.; Fuhrmann, H.; Schoeniger, A. Evaluation of the hepatocyte-derived cell line BFH12 as an in vitro model for bovine biotransformation. Cytotechnology 2019, 71, 231–244. [Google Scholar] [CrossRef] [PubMed]
- Caruso, M.; Mariotti, A.; Zizzadoro, C.; Zaghini, A.; Ormas, P.; Altafini, A.; Belloli, C. A clonal cell line (BME-UV1) as a possible model to study bovine mammary epithelial metabolism: Metabolism and cytotoxicity of aflatoxin B1. Toxicon 2009, 53, 400–408. [Google Scholar] [CrossRef]
- Ramyaa, P.; Padma, V.V. Ochratoxin-induced toxicity, oxidative stress and apoptosis ameliorated by quercetin—Modulation by Nrf2. Food Chem. Toxicol. 2013, 62, 205–216. [Google Scholar] [CrossRef]
- Qin, X.; Cao, M.; Lai, F.; Yang, F.; Ge, W.; Zhang, X.; Cheng, S.; Sun, X.; Qin, G.; Shen, W.; et al. Oxidative stress induced by Zearalenone in porcine granulosa cells and Its rescue by curcumin in vitro. PLoS ONE 2015, 10, e0127551. [Google Scholar] [CrossRef] [Green Version]
- Olugbami, J.O.; Damoiseaux, R.; Odunola, O.A.; Gimzewski, J.K. Mitigation of aflatoxin B1- and sodium arsenite-induced cytotoxicities in HUC-PC urinary bladder cells by curcumin and Khaya senegalensis. J. Basic Clin. Physiol. Pharmacol. 2020. [Google Scholar] [CrossRef]
- Livak, K.J.; Schmittgen, T.D. Analysis of relative gene expression data using real-time quantitative PCR and the 2-ΔΔCT method. Methods 2001, 25, 402–408. [Google Scholar] [CrossRef]
- Robinson, M.D.; McCarthy, D.J.; Smyth, G.K. edgeR: A Bioconductor package for differential expression analysis of digital gene expression data. Bioinformatics 2010, 26, 139–140. [Google Scholar] [CrossRef] [PubMed] [Green Version]
- Yu, G.; Wang, L.G.; Han, Y.; He, Q.Y. ClusterProfiler: An R package for comparing biological themes among gene clusters. Omics J. Integr. Biol. 2012, 16, 284–287. [Google Scholar] [CrossRef] [PubMed]
- Subramanian, A.; Tamayo, P.; Mootha, V.K.; Mukherjee, S.; Ebert, B.L.; Gillette, M.A.; Paulovich, A.; Pomeroy, S.L.; Golub, T.R.; Lander, E.S.; et al. Gene set enrichment analysis: A knowledge-based approach for interpreting genome-wide expression profiles. Proc. Natl. Acad. Sci. USA 2005, 102, 15545–15550. [Google Scholar] [CrossRef] [PubMed] [Green Version]
- Zancanella, V.; Giantin, M.; Dacasto, M. Absolute quantification and modulation of cytochrome P450 3A isoforms in cattle liver. Vet. J. 2014, 202, 106–111. [Google Scholar] [CrossRef] [PubMed]
- Ross, D.; Siegel, D. Functions of NQO1 in cellular protection and CoQ10 metabolism and its potential role as a redox sensitive molecular switch. Front. Physiol. 2017, 8, 595. [Google Scholar] [CrossRef] [PubMed]
- Jayaprakasha, G.K.; Jaganmohan Rao, L.; Sakariah, K.K. Antioxidant activities of curcumin, demethoxycurcumin and bisdemethoxycurcumin. Food Chem. 2006, 98, 720–724. [Google Scholar] [CrossRef]
- Koohpar, Z.K.; Entezari, M.; Movafagh, A.; Hashemi, M. Anticancer activity of curcumin on human breast adenocarcinoma: Role of Mcl-1 gene. Int. J. Cancer Manag. 2015, 8, e2331. [Google Scholar] [CrossRef] [Green Version]
- Amin, A.R.M.R.; Haque, A.; Rahman, M.A.; Chen, Z.G.; Khuri, F.R.; Shin, D.M. Curcumin induces apoptosis of upper aerodigestive tract cancer cells by targeting multiple pathways. PLoS ONE 2015, 10, e0124218. [Google Scholar] [CrossRef]
- Jiang, J.; Jin, H.; Liu, L.; Pi, J.; Yang, F.; Cai, J. Curcumin disturbed cell-cycle distribution of HepG2 cells via cytoskeletal arrangement. Scanning 2013, 35, 253–260. [Google Scholar] [CrossRef]
- Fan, H.; Tian, W.; Ma, X. Curcumin induces apoptosis of HepG2 cells via inhibiting fatty acid synthase. Target. Oncol. 2014, 9, 279–286. [Google Scholar] [CrossRef]
- Kuttan, G.; Hari Kumar, K.B.; Guruvayoorappan, C.; Kuttan, R. Antitumor, anti-invasion, and antimetastatic effects of curcumin. Adv. Exp. Med. Biol. 2007, 595, 173–184. [Google Scholar] [CrossRef]
- El Khoury, A.; Atoui, A.; Yaghi, J. Analysis of aflatoxin M1 in milk and yogurt and AFM1 reduction by lactic acid bacteria used in Lebanese industry. Food Control 2011, 10, 1695–1699. [Google Scholar] [CrossRef]
- Mughal, M.J.; Peng, X.; Zhou, Y.; Fang, J. Aflatoxin B1 invokes apoptosis via death receptor pathway in hepatocytes. Oncotarget 2017, 8, 8239–8249. [Google Scholar] [CrossRef] [PubMed]
- Kuilman, M.E.M.; Maas, R.F.M.; Fink-Gremmels, J. Cytochrome P450-mediated metabolism and cytotoxicity of aflatoxin B1 in bovine hepatocytes. Toxicol. Vitr. 2000, 14, 321–327. [Google Scholar] [CrossRef]
- Kim, S.-B.; Cho, S.-S.; Cho, H.-J.; Yoon, I.-S. Modulation of hepatic cytochrome p450 enzymes by curcumin and its pharmacokinetic consequences in sprague-dawley rats. Pharmacogn. Mag. 2015, 11, S580–S584. [Google Scholar] [CrossRef]
- Volak, L.P.; Ghirmai, S.; Cashman, J.R.; Court, M.H. Curcuminoids inhibit multiple human cytochromes P450, UDP- glucuronosyltransferase, and sulfotransferase enzymes, whereas piperine is a relatively selective CYP3A4 inhibitor. Drug Metab. Dispos. 2008, 36, 1594–1605. [Google Scholar] [CrossRef] [PubMed] [Green Version]
- Hou, X.L.; Takahashi, K.; Kinoshita, N.; Qiu, F.; Tanaka, K.; Komatsu, K.; Takahashi, K.; Azuma, J. Possible inhibitory mechanism of Curcuma drugs on CYP3A4 in 1α,25 dihydroxyvitamin D3 treated Caco-2 cells. Int. J. Pharm. 2007, 337, 169–177. [Google Scholar] [CrossRef] [PubMed]
- Kulkarni, A.P.; Ghebremariam, Y.T.; Kotwal, G.J. Curcumin inhibits the classical and the alternate pathways of complement activation. Ann. N. Y. Acad. Sci. 2005, 1056, 100–112. [Google Scholar] [CrossRef] [PubMed]
- Jacob, A.; Chaves, L.; Eadon, M.T.; Chang, A.; Quigg, R.J.; Alexander, J.J. Curcumin alleviates immune-complex-mediated glomerulonephritis in factor-H-deficient mice. Immunology 2013, 139, 328–337. [Google Scholar] [CrossRef] [PubMed]
- Huang, S.; Zhao, L.; Kim, K.; Dong, S.L.; Hwang, D.H. Inhibition of Nod2 signaling and target gene expression by curcumin. Mol. Pharmacol. 2008, 74, 274–281. [Google Scholar] [CrossRef] [Green Version]
- Tian, B.; Zhao, Y.; Liang, T.; Ye, X.; Li, Z.; Yan, D.; Fu, Q.; Li, Y. Curcumin inhibits urothelial tumor development by suppressing IGF2 and IGF2-mediated PI3K/AKT/mTOR signaling pathway. J. Drug Target. 2017, 25, 626–636. [Google Scholar] [CrossRef] [PubMed]
- Mhillaj, E.; Tarozzi, A.; Pruccoli, L.; Cuomo, V.; Trabace, L.; Mancuso, C. Curcumin and heme oxygenase: Neuroprotection and beyond. Int. J. Mol. Sci. 2019, 20, 2419. [Google Scholar] [CrossRef] [PubMed] [Green Version]
- Hsu, H.Y.; Chu, L.C.; Hua, K.F.; Chao, L.K. Heme oxygenase-1 mediates the anti-inflammatory effect of curcumin within LPS-stimulated human monocytes. J. Cell. Physiol. 2008, 215, 603–612. [Google Scholar] [CrossRef]
- Zhong, Y.; Liu, T.; Lai, W.; Tan, Y.; Tian, D.; Guo, Z. Heme oxygenase-1-mediated reactive oxygen species reduction is involved in the inhibitory effect of curcumin on lipopolysaccharide-induced monocyte chemoattractant protein-1 production in RAW264.7 macrophages. Mol. Med. Rep. 2013, 7, 242–246. [Google Scholar] [CrossRef]
- Yang, X.; Jiang, H.; Shi, Y. Upregulation of heme oxygenase-1 expression by curcumin conferring protection from hydrogen peroxide-induced apoptosis in H9c2 cardiomyoblasts. Cell Biosci. 2017, 7, 20. [Google Scholar] [CrossRef] [PubMed] [Green Version]
- Bao, W.; Li, K.; Rong, S.; Yao, P.; Hao, L.; Ying, C.; Zhang, X.; Nussler, A.; Liu, L. Curcumin alleviates ethanol-induced hepatocytes oxidative damage involving heme oxygenase-1 induction. J. Ethnopharmacol. 2010, 128, 549–553. [Google Scholar] [CrossRef] [PubMed]
- Moustapha, A.; Pérétout, P.; Rainey, N.; Sureau, F.; Geze, M.; Petit, J.M.; Dewailly, E.; Slomianny, C.; Petit, P. Curcumin induces crosstalk between autophagy and apoptosis mediated by calcium release from the endoplasmic reticulum, lysosomal destabilization and mitochondrial events. Cell Death Discov. 2015, 1, 15017. [Google Scholar] [CrossRef]
- Li, L.; Zhang, Z.; Huang, Y. Integrative transcriptome analysis and discovery of signaling pathways involved in the protective effects of curcumin against oxidative stress in tilapia hepatocytes. Aquat. Toxicol. 2020, 224, 105516. [Google Scholar] [CrossRef]
- Sharma, R.A.; Hill, K.A.; Williams, M.L.; Steward, W.P.; Ireson, C.R.; Verschoyle, R.D.; Leuratti, C.; Manson, M.M.; Gescher, A.; Marnett, L.J. Effects of dietary curcumin on glutathione S-transferase and malondialdehyde-DNA adducts in rat liver and colon mucosa: Relationship with drug levels. Clin. Cancer Res. 2001, 7, 1452–1458. [Google Scholar]
- Marin, D.E.; Taranu, I. Overview on aflatoxins and oxidative stress. Toxin Rev. 2012, 31, 32–43. [Google Scholar] [CrossRef]
- Wu, J.; Ibtisham, F.; Niu, Y.F.; Wang, Z.; Li, G.H.; Zhao, Y.; Nawab, A.; Xiao, M.; An, L. Curcumin inhibits heat-induced oxidative stress by activating the MAPK-Nrf2 / ARE signaling pathway in chicken fibroblasts cells. J. Therm. Biol. 2019, 79, 112–119. [Google Scholar] [CrossRef] [PubMed]
- Kadasa, N.M.; Abdallah, H.; Afifi, M.; Gowayed, S. Hepatoprotective effects of curcumin against Diethyl nitrosamine induced hepatotoxicity in albino rats. Asian Pacific J. Cancer Prev. 2015, 16, 103–108. [Google Scholar] [CrossRef] [PubMed] [Green Version]
- Subudhi, U.; Chainy, G.B.N. Curcumin and vitamin E modulate hepatic antioxidant gene expression in PTU-induced hypothyroid rats. Mol. Biol. Rep. 2012, 39, 9849–9861. [Google Scholar] [CrossRef]
- Ma, Q. Role of Nrf2 in Oxidative Stress and Toxicity. Annu. Rev. Pharmacol. Toxicol. 2013, 53, 401–426. [Google Scholar] [CrossRef] [Green Version]
- Zhou, Y.; Jin, Y.; Yu, H.; Shan, A.; Shen, J.; Zhou, C.; Zhao, Y.; Fang, H.; Wang, X.; Wang, J.; et al. Resveratrol inhibits aflatoxin B1-induced oxidative stress and apoptosis in bovine mammary epithelial cells and is involved the Nrf2 signaling pathway. Toxicon 2019, 164, 10–15. [Google Scholar] [CrossRef] [PubMed]
- Xie, Y.L.; Chu, J.G.; Jian, X.M.; Dong, J.Z.; Wang, L.P.; Li, G.X.; Yang, N. Bin Curcumin attenuates lipopolysaccharide/D-galactosamine-induced acute liver injury by activating Nrf2 nuclear translocation and inhibiting NF-kB activation. Biomed. Pharmacother. 2017, 91, 70–77. [Google Scholar] [CrossRef] [PubMed]
- Xiong, Z.E.; Dong, W.G.; Wang, B.Y.; Tong, Q.Y.; Li, Z.Y. Curcumin attenuates chronic ethanol-induced liver injury by inhibition of oxidative stress via mitogen-activated protein kinase/nuclear factor E2-related factor 2 pathway in mice. Pharmacogn. Mag. 2015, 11, 705–715. [Google Scholar] [CrossRef] [Green Version]
- Ross, D.; Siegel, D. NQO1 in protection against oxidative stress. Curr. Opin. Toxicol. 2018, 7, 67–72. [Google Scholar] [CrossRef]
- Jia, R.; Li, Y.; Cao, L.; Du, J.; Zheng, T.; Qian, H.; Gu, Z.; Jeney, G.; Xu, P.; Yin, G. Antioxidative, anti-inflammatory and hepatoprotective effects of resveratrol on oxidative stress-induced liver damage in tilapia (Oreochromis niloticus). Comp. Biochem. Physiol. Part C Toxicol. Pharmacol. 2019, 215, 56–66. [Google Scholar] [CrossRef]
- Wang, X.; Chang, X.; Zhan, H.; Zhang, Q.; Li, C.; Gao, Q.; Yang, M.; Luo, Z.; Li, S.; Sun, Y. Curcumin and Baicalin ameliorate ethanol-induced liver oxidative damage via the Nrf2/HO-1 pathway. J. Food Biochem. 2020, e13425. [Google Scholar] [CrossRef]
- Zhang, L.; Zhang, J.; Yan, E.; He, J.; Zhong, X.; Zhang, L.; Wang, C.; Wang, T. Dietary supplemented curcumin improves meat quality and antioxidant status of intrauterine growth retardation growing pigs via Nrf2 signal pathway. Animals 2020, 10, 539. [Google Scholar] [CrossRef] [PubMed] [Green Version]
- Yan, E.; Zhang, J.; Han, H.; Wu, J.; Gan, Z.; Wei, C.; Zhang, L.; Wang, C.; Wang, T. Curcumin alleviates IUGR jejunum damage by increasing antioxidant capacity through nrf2/keap1 pathway in growing pigs. Animals 2020, 10, 41. [Google Scholar] [CrossRef] [Green Version]
- Tsvetkov, P.; Asher, G.; Reiss, V.; Shaul, Y.; Sachs, L.; Lotem, J. Inhibition of NAD(P)H:quinone oxidoreductase 1 activity and induction of p53 degradation by the natural phenolic compound curcumin. Proc. Natl. Acad. Sci. USA 2005, 102, 5535–5540. [Google Scholar] [CrossRef] [PubMed] [Green Version]
- Scapagnini, G.; Butterfield, D.A.; Colombrita, C.; Sultana, R.; Pascale, A.; Calabrese, V. Ethyl ferulate, a lipophilic polyphenol, induces HO-1 and protects rat neurons against oxidative stress. Antioxid. Redox Signal. 2004, 6, 811–818. [Google Scholar] [CrossRef] [PubMed]
- Gozzelino, R.; Jeney, V.; Soares, M.P. Mechanisms of Cell Protection by Heme Oxygenase-1. Annu. Rev. Pharmacol. Toxicol. 2010, 50, 323–354. [Google Scholar] [CrossRef] [PubMed] [Green Version]
- Cremers, N.A.J.; Lundvig, D.M.S.; van Dalen, S.C.M.; Schelbergen, R.F.; van Lent, P.L.E.M.; Szarek, W.A.; Regan, R.F.; Carels, C.E.; Wagener, F.A.D.T.G. Curcumin-induced heme oxygenase-1 expression prevents H2O2-induced cell death in wild type and heme oxygenase-2 knockout adipose-derived mesenchymal stem cells. Int. J. Mol. Sci. 2014, 15, 17974–17999. [Google Scholar] [CrossRef] [Green Version]
- Chorley, B.N.; Campbell, M.R.; Wang, X.; Karaca, M.; Sambandan, D.; Bangura, F.; Xue, P.; Pi, J.; Kleeberger, S.R.; Bell, D.A. Identification of novel NRF2-regulated genes by ChiP-Seq: Influence on retinoid X receptor alpha. Nucleic Acids Res. 2012, 40, 7416–7429. [Google Scholar] [CrossRef] [Green Version]
- Soares, M.P.; Usheva, A.; Brouard, S.; Berberat, P.O.; Gunther, L.; Tobiasch, E.; Bach, F.H. Modulation of endothelial cell apoptosis by heme oxygenase-1-derived carbon monoxide. Antioxid. Redox Signal. 2002, 4, 321–329. [Google Scholar] [CrossRef]
- Tsai, C.L.; Lin, Y.C.; Wang, H.M.; Chou, T.C. Baicalein, an active component of Scutellaria baicalensis, protects against lipopolysaccharide-induced acute lung injury in rats. J. Ethnopharmacol. 2014, 153, 197–206. [Google Scholar] [CrossRef]
- Tonelli, C.; Chio, I.I.C.; Tuveson, D.A. Transcriptional Regulation by Nrf2. Antioxid. Redox Signal. 2018, 9, 1727–1745. [Google Scholar] [CrossRef] [Green Version]
- Hayes, J.D.; Dinkova-Kostova, A.T. The Nrf2 regulatory network provides an interface between redox and intermediary metabolism. Trends Biochem. Sci. 2014, 39, 199–218. [Google Scholar] [CrossRef]
- Gugliandolo, E.; Peritore, A.F.; D’amico, R.; Licata, P.; Crupi, R. Evaluation of neuroprotective effects of quercetin against aflatoxin b1-intoxicated mice. Animals 2020, 10, 898. [Google Scholar] [CrossRef] [PubMed]
- Dugyala, R.R.; Sharma, R.P. The effect of aflatoxin B1 on cytokine mRNA and corresponding protein levels in peritoneal macrophages and splenic lymphocytes. Int. J. Immunopharmacol. 1996, 18, 599–608. [Google Scholar] [CrossRef]
- Mehrzad, J.; Malvandi, A.M.; Alipour, M.; Hosseinkhani, S. Environmentally relevant level of aflatoxin B1 elicits toxic pro-inflammatory response in murine CNS-derived cells. Toxicol. Lett. 2017, 279, 96–106. [Google Scholar] [CrossRef]
- Qin, H.; Li, H.; Zhou, X.; Peng, C.; Tan, H.; Wang, M. Effect of superoxide and inflammatory factor on aflatoxin B1 triggered hepatocellular carcinoma. Am. J. Transl. Res. 2016, 8, 4003–4008. [Google Scholar]
- Iqbal, B.; Ghildiyal, A.; Singh, S.; Siddiqui, S.; Kumari, P.; Arshad, M.; Mahdi, A.A. Combinatorial effect of curcumin and tumor necrosis factor-α-related apoptosis-inducing ligand (TRAIL) in induction of apoptosis via inhibition of nuclear factor kappa activity and enhancement of caspase-3 activity in chronic myeloid cells: An In-vitro st. J. Cancer Res. Ther. 2018, 14, S1193–S1200. [Google Scholar] [CrossRef] [PubMed]
- Ghasemi, F.; Shafiee, M.; Banikazemi, Z.; Pourhanifeh, M.H.; Khanbabaei, H.; Shamshirian, A.; Amiri Moghadam, S.; ArefNezhad, R.; Sahebkar, A.; Avan, A.; et al. Curcumin inhibits NF-kB and Wnt/β-catenin pathways in cervical cancer cells. Pathol. Res. Pract. 2019, 215, 152556. [Google Scholar] [CrossRef] [PubMed]
- Rajput, S.A.; Sun, L.; Zhang, N.Y.; Khalil, M.M.; Ling, Z.; Chong, L.; Wang, S.; Rajput, I.R.; Bloch, D.M.; Khan, F.A.; et al. Grape seed proanthocyanidin extract alleviates aflatoxinb 1 -induced immunotoxicity and oxidative stress via modulation of nf-κb and nrf2 signaling pathways in broilers. Toxins 2019, 11, 23. [Google Scholar] [CrossRef] [Green Version]
- Koeberle, A.; Northoff, H.; Werz, O. Curcumin blocks prostaglandin E2 biosynthesis through direct inhibition of the microsomal prostaglandin E2 synthase-1. Mol. Cancer Ther. 2009, 8, 2348–2355. [Google Scholar] [CrossRef] [Green Version]
- Lee, S.Y.; Cho, S.S.; Li, Y.C.; Bae, C.S.; Park, K.M.; Park, D.H. Anti-inflammatory Effect of Curcuma longa and Allium hookeri Co-treatment via NF-κB and COX-2 Pathways. Sci. Rep. 2020, 10, 5718. [Google Scholar] [CrossRef]
- Plummer, S.M.; Holloway, K.A.; Manson, M.M.; Munks, R.J.L.; Kaptein, A.; Farrow, S.; Howells, L. Inhibition of cyclo-oxygenase 2 expression in colon cells by the chemopreventive agent curcumin involves inhibition of NF-κB activation via the NIK/IKK signalling complex. Oncogene 1999, 18, 6013–6020. [Google Scholar] [CrossRef] [PubMed] [Green Version]
- Konduru, A.S.; Lee, B.C.; Li, J.D. Curcumin suppresses NTHi-induced CXCL5 expression via inhibition of positive IKKβ pathway and up-regulation of negative MKP-1 pathway. Sci. Rep. 2016, 6, 31695. [Google Scholar] [CrossRef] [PubMed] [Green Version]
- Bosma, M.; Gerling, M.; Pasto, J.; Georgiadi, A.; Graham, E.; Shilkova, O.; Iwata, Y.; Almer, S.; Söderman, J.; Toftgård, R.; et al. FNDC4 acts as an anti-inflammatory factor on macrophages and improves colitis in mice. Nat. Commun. 2016, 7, 11314. [Google Scholar] [CrossRef]
- Panda, S.K.; Wigerblad, G.; Jiang, L.; Jiménez-Andrade, Y.; Iyer, V.S.; Shen, Y.; Boddul, S.V.; Guerreiro-Cacais, A.O.; Raposo, B.; Kasza, Z.; et al. IL-4 controls activated neutrophil FcγR2b expression and migration into inflamed joints. Proc. Natl. Acad. Sci. USA 2020, 117, 3103–3113. [Google Scholar] [CrossRef] [PubMed] [Green Version]
- Yu, H.; Pardoll, D.; Jove, R. STATs in cancer inflammation and immunity: A leading role for STAT3. Nat. Rev. Cancer 2009, 9, 798–809. [Google Scholar] [CrossRef] [PubMed]
- Fetoni, A.R.; Paciello, F.; Mezzogori, D.; Rolesi, R.; Eramo, S.L.M.; Paludetti, G.; Troiani, D. Molecular targets for anticancer redox chemotherapy and cisplatin-induced ototoxicity: The role of curcumin on pSTAT3 and Nrf-2 signalling. Br. J. Cancer 2015, 113, 1434–1444. [Google Scholar] [CrossRef] [Green Version]
- Giantin, M.; Küblbeck, J.; Zancanella, V.; Prantner, V.; Sansonetti, F.; Schoeniger, A.; Tolosi, R.; Guerra, G.; Da Ros, S.; Dacasto, M.; et al. DNA elements for constitutive androstane receptor- and pregnane X receptor-mediated regulation of bovine CYP3A28 gene. PLoS ONE 2019, 14, e0214338. [Google Scholar] [CrossRef]
- Rosenkrans, C.F.; Ezell, N.S. Relationships among ergot alkaloids, cytochrome P450 activity, and beef steer growth. Front. Chem. 2015, 3, 16. [Google Scholar] [CrossRef]
- Cho, Y.A.; Lee, W.; Choi, J.S. Effects of curcumin on the pharmacokinetics of tamoxifen and its active metabolite, 4-hydroxytamoxifen, in rats: Possible role of CYP3A4 and P-glycoprotein inhibition by curcumin. Pharmazie 2012, 67, 124–130. [Google Scholar] [CrossRef]
- Code, E.L.; Crespi, C.L.; Penman, B.W.; Gonzalez, F.J.; Chang, T.K.H.; Waxman, D.J. Human cytochrome P4502B6: Interindividual hepatic expression, substrate specificity, and role in procarcinogen activation. Drug Metab. Dispos. 1997, 25, 985–993. [Google Scholar]
- Choi, H.; Chun, Y.S.; Shin, Y.J.; Ye, S.K.; Kim, M.S.; Park, J.W. Curcumin attenuates cytochrome P450 induction in response to 2,3,7,8-tetrachlorodibenzo-p-dioxin by ROS-dependently degrading AhR and ARNT. Cancer Sci. 2008, 99, 2518–2524. [Google Scholar] [CrossRef] [PubMed]
- Nakai, R.; Fukuda, S.; Kawase, M.; Yamashita, Y.; Ashida, H. Curcumin and its derivatives inhibit 2,3,7,8,-tetrachloro-dibenzo-p-dioxin-induced expression of drug metabolizing enzymes through aryl hydrocarbon receptor-mediated pathway. Biosci. Biotechnol. Biochem. 2018, 82, 616–628. [Google Scholar] [CrossRef] [PubMed] [Green Version]
- Mo, W.; Zhang, J.T. Human ABCG2: Structure, function, and its role in multidrug resistance. Int. J. Biochem. Mol. Biol. 2012, 3, 1–27. [Google Scholar] [PubMed]
- van Herwaarden, A.E.; Wagenaar, E.; Karnekamp, B.; Merino, G.; Jonker, J.W.; Schinkel, A.H. Breast cancer resistance protein (Bcrp1/Abcg2) reduces systemic exposure of the dietary carcinogens aflatoxin B1, IQ and Trp-P-1 but also mediates their secretion into breast milk. Carcinogenesis 2006, 27, 123–130. [Google Scholar] [CrossRef] [PubMed]
- Choudhuri, S.; Klaassen, C. Structure, function, expression, genomic organization, and single nucleotide polymorphisms of human ABCB1 (MDR1), ABCC (MRP), and ABCG2 (BCRP) efflux transporters. Int. J. Toxicol. 2006, 25, 231–259. [Google Scholar] [CrossRef] [PubMed]
- Loe, D.W.; Stewart, R.K.; Massey, T.E.; Deeley, R.G.; Cole, S.P.C. ATP-dependent transport of aflatoxin B1 and its glutathione conjugates by the product of the multidrug resistance protein (MRP) gene. Mol. Pharmacol. 1997, 51, 1034–1041. [Google Scholar] [CrossRef] [Green Version]
- Lorico, A.; Nesland, J.; Emilsen, E.; Fodstad, O.; Rappa, G. Role of the multidrug resistance protein 1 gene in the carcinogenicity of aflatoxin B1: Investigations using mrp1-null mice. Toxicology 2002, 171, 201–205. [Google Scholar] [CrossRef]


Publisher’s Note: MDPI stays neutral with regard to jurisdictional claims in published maps and institutional affiliations. |
© 2020 by the authors. Licensee MDPI, Basel, Switzerland. This article is an open access article distributed under the terms and conditions of the Creative Commons Attribution (CC BY) license (http://creativecommons.org/licenses/by/4.0/).
Share and Cite
Pauletto, M.; Giantin, M.; Tolosi, R.; Bassan, I.; Barbarossa, A.; Zaghini, A.; Dacasto, M. Curcumin Mitigates AFB1-Induced Hepatic Toxicity by Triggering Cattle Antioxidant and Anti-inflammatory Pathways: A Whole Transcriptomic In Vitro Study. Antioxidants 2020, 9, 1059. https://doi.org/10.3390/antiox9111059
Pauletto M, Giantin M, Tolosi R, Bassan I, Barbarossa A, Zaghini A, Dacasto M. Curcumin Mitigates AFB1-Induced Hepatic Toxicity by Triggering Cattle Antioxidant and Anti-inflammatory Pathways: A Whole Transcriptomic In Vitro Study. Antioxidants. 2020; 9(11):1059. https://doi.org/10.3390/antiox9111059
Chicago/Turabian StylePauletto, Marianna, Mery Giantin, Roberta Tolosi, Irene Bassan, Andrea Barbarossa, Anna Zaghini, and Mauro Dacasto. 2020. "Curcumin Mitigates AFB1-Induced Hepatic Toxicity by Triggering Cattle Antioxidant and Anti-inflammatory Pathways: A Whole Transcriptomic In Vitro Study" Antioxidants 9, no. 11: 1059. https://doi.org/10.3390/antiox9111059