Supplementation with a Carob (Ceratonia siliqua L.) Fruit Extract Attenuates the Cardiometabolic Alterations Associated with Metabolic Syndrome in Mice

 , ,
, ,
Abstract
:
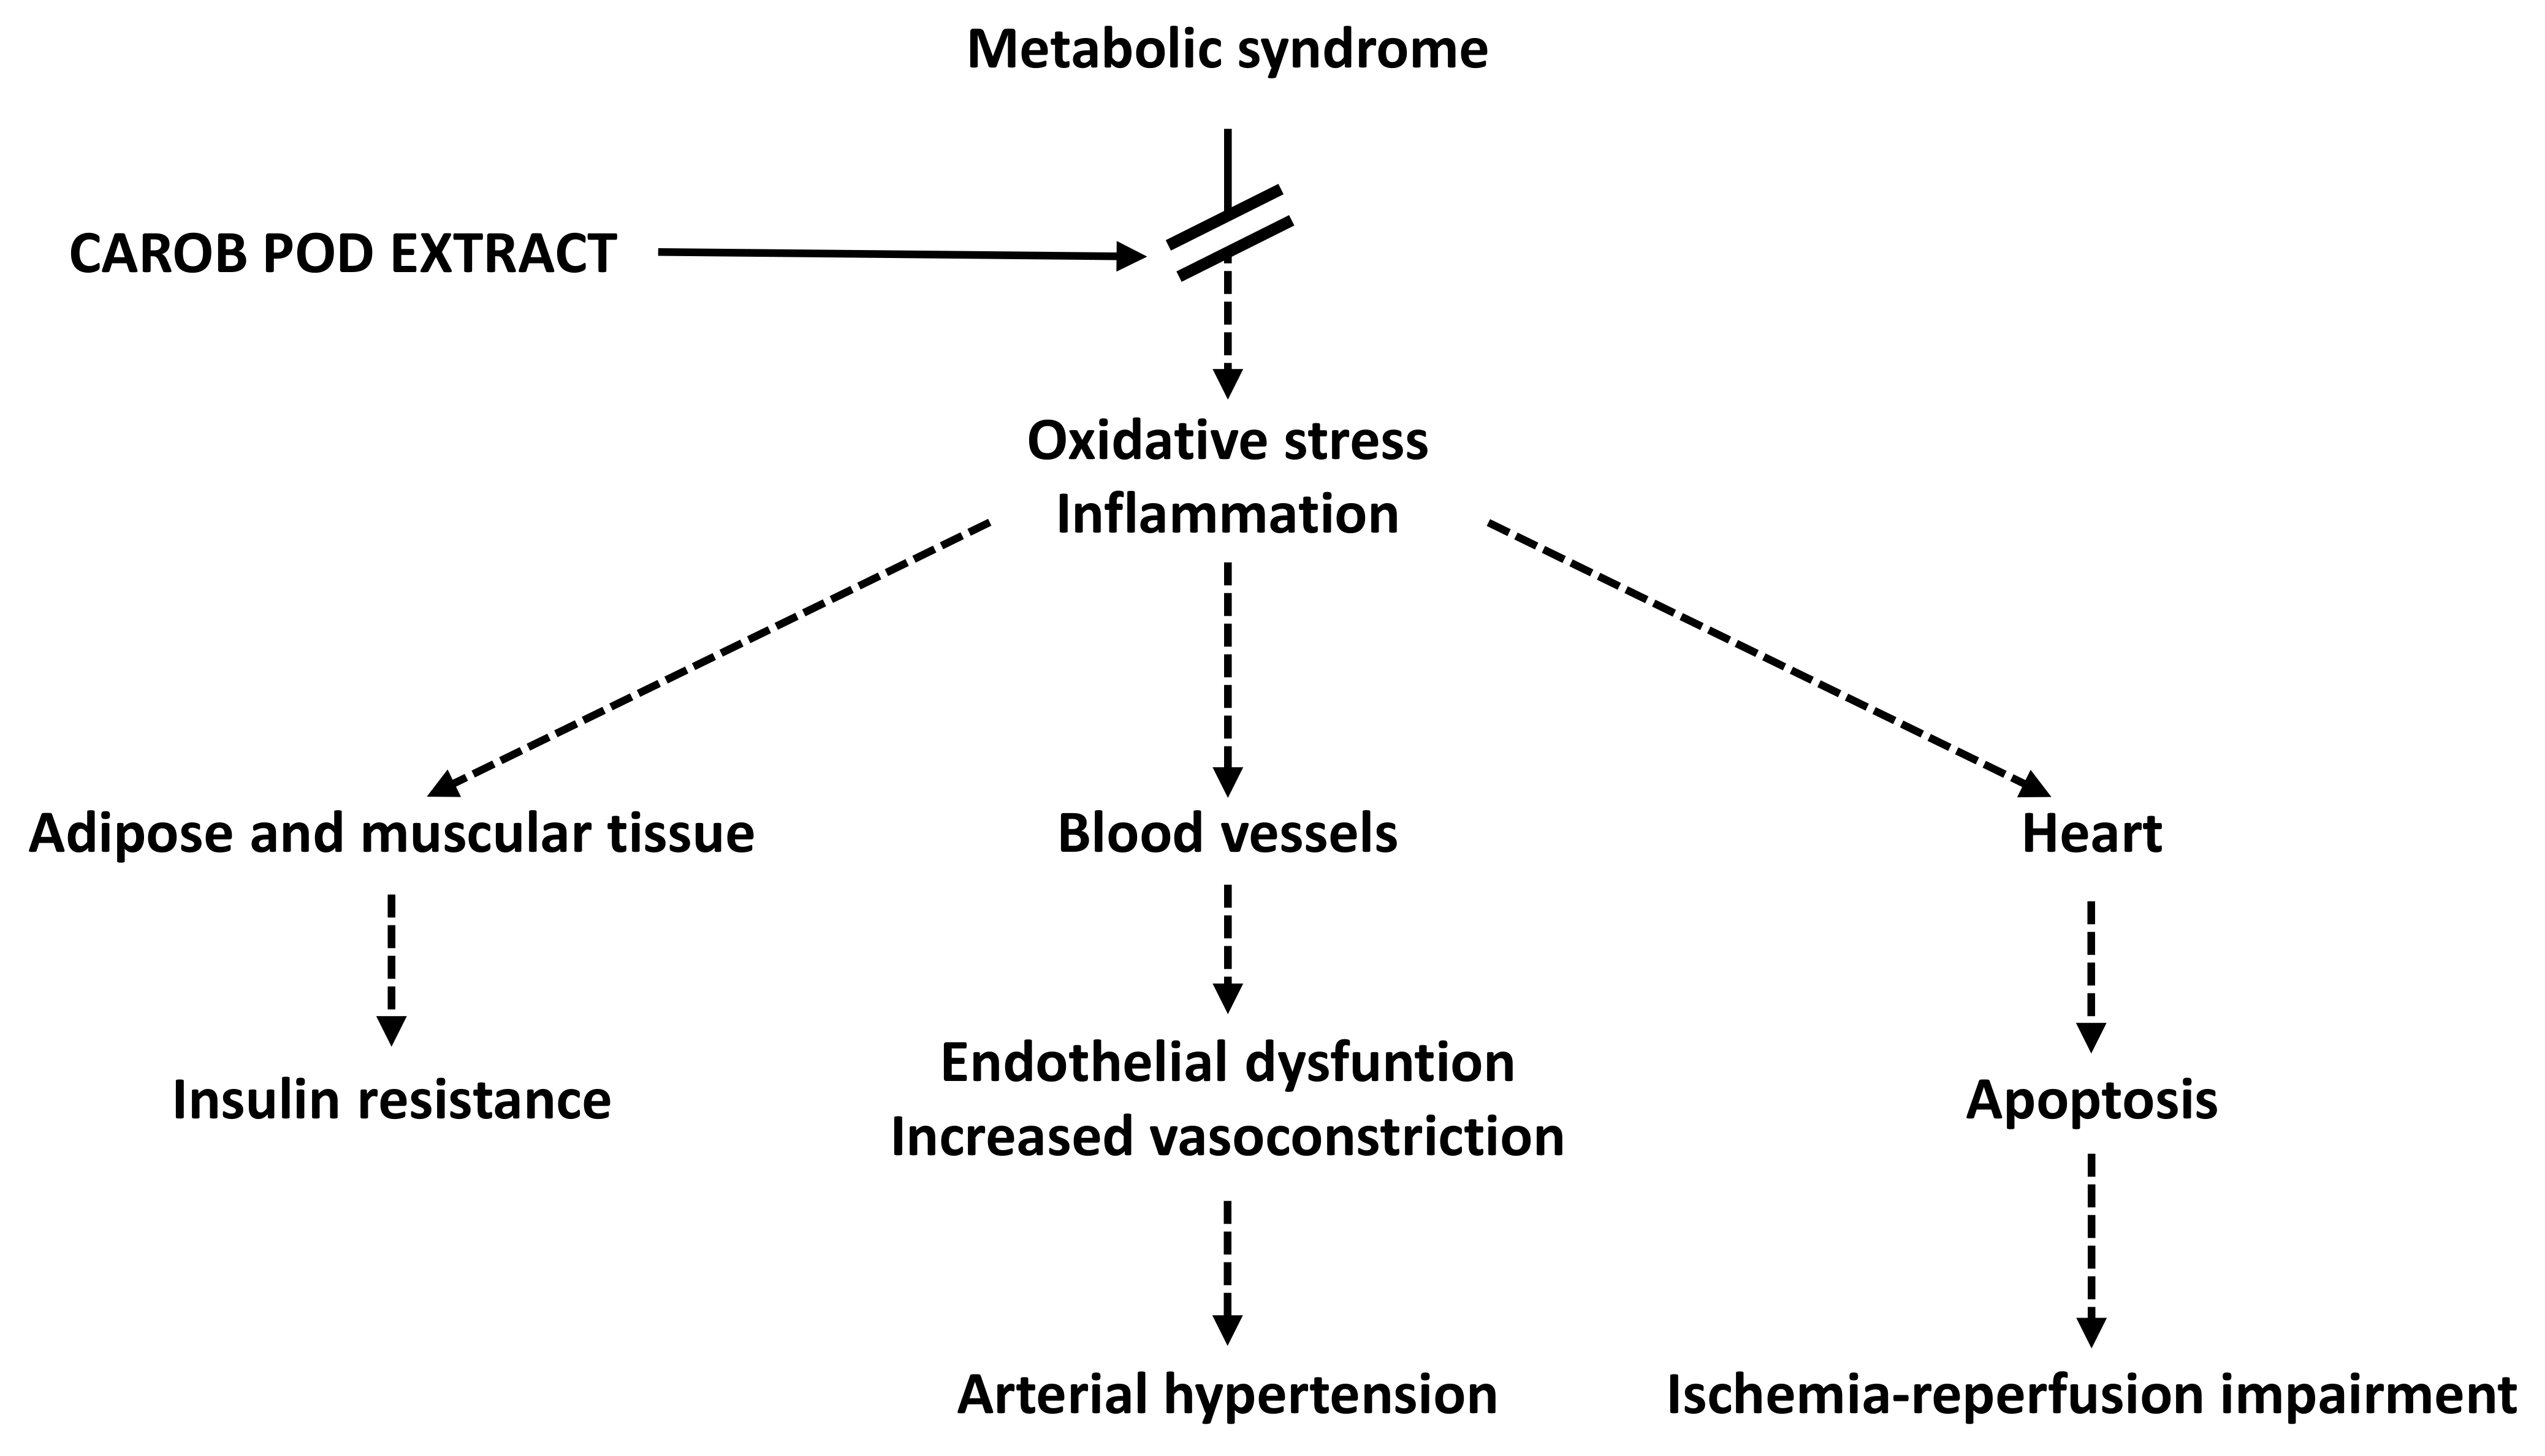
1. Introduction
2. Material and Methods
2.1. Materials
2.2. Chemical Characterization of CSAT+® Samples
2.2.1. Analysis of Phenolic Compounds by RP-HPLC-PAD/MS
2.2.2. Total Antioxidant Capacity by ABTS Decolorization Assay
2.3. In Vivo Study
2.3.1. Animals
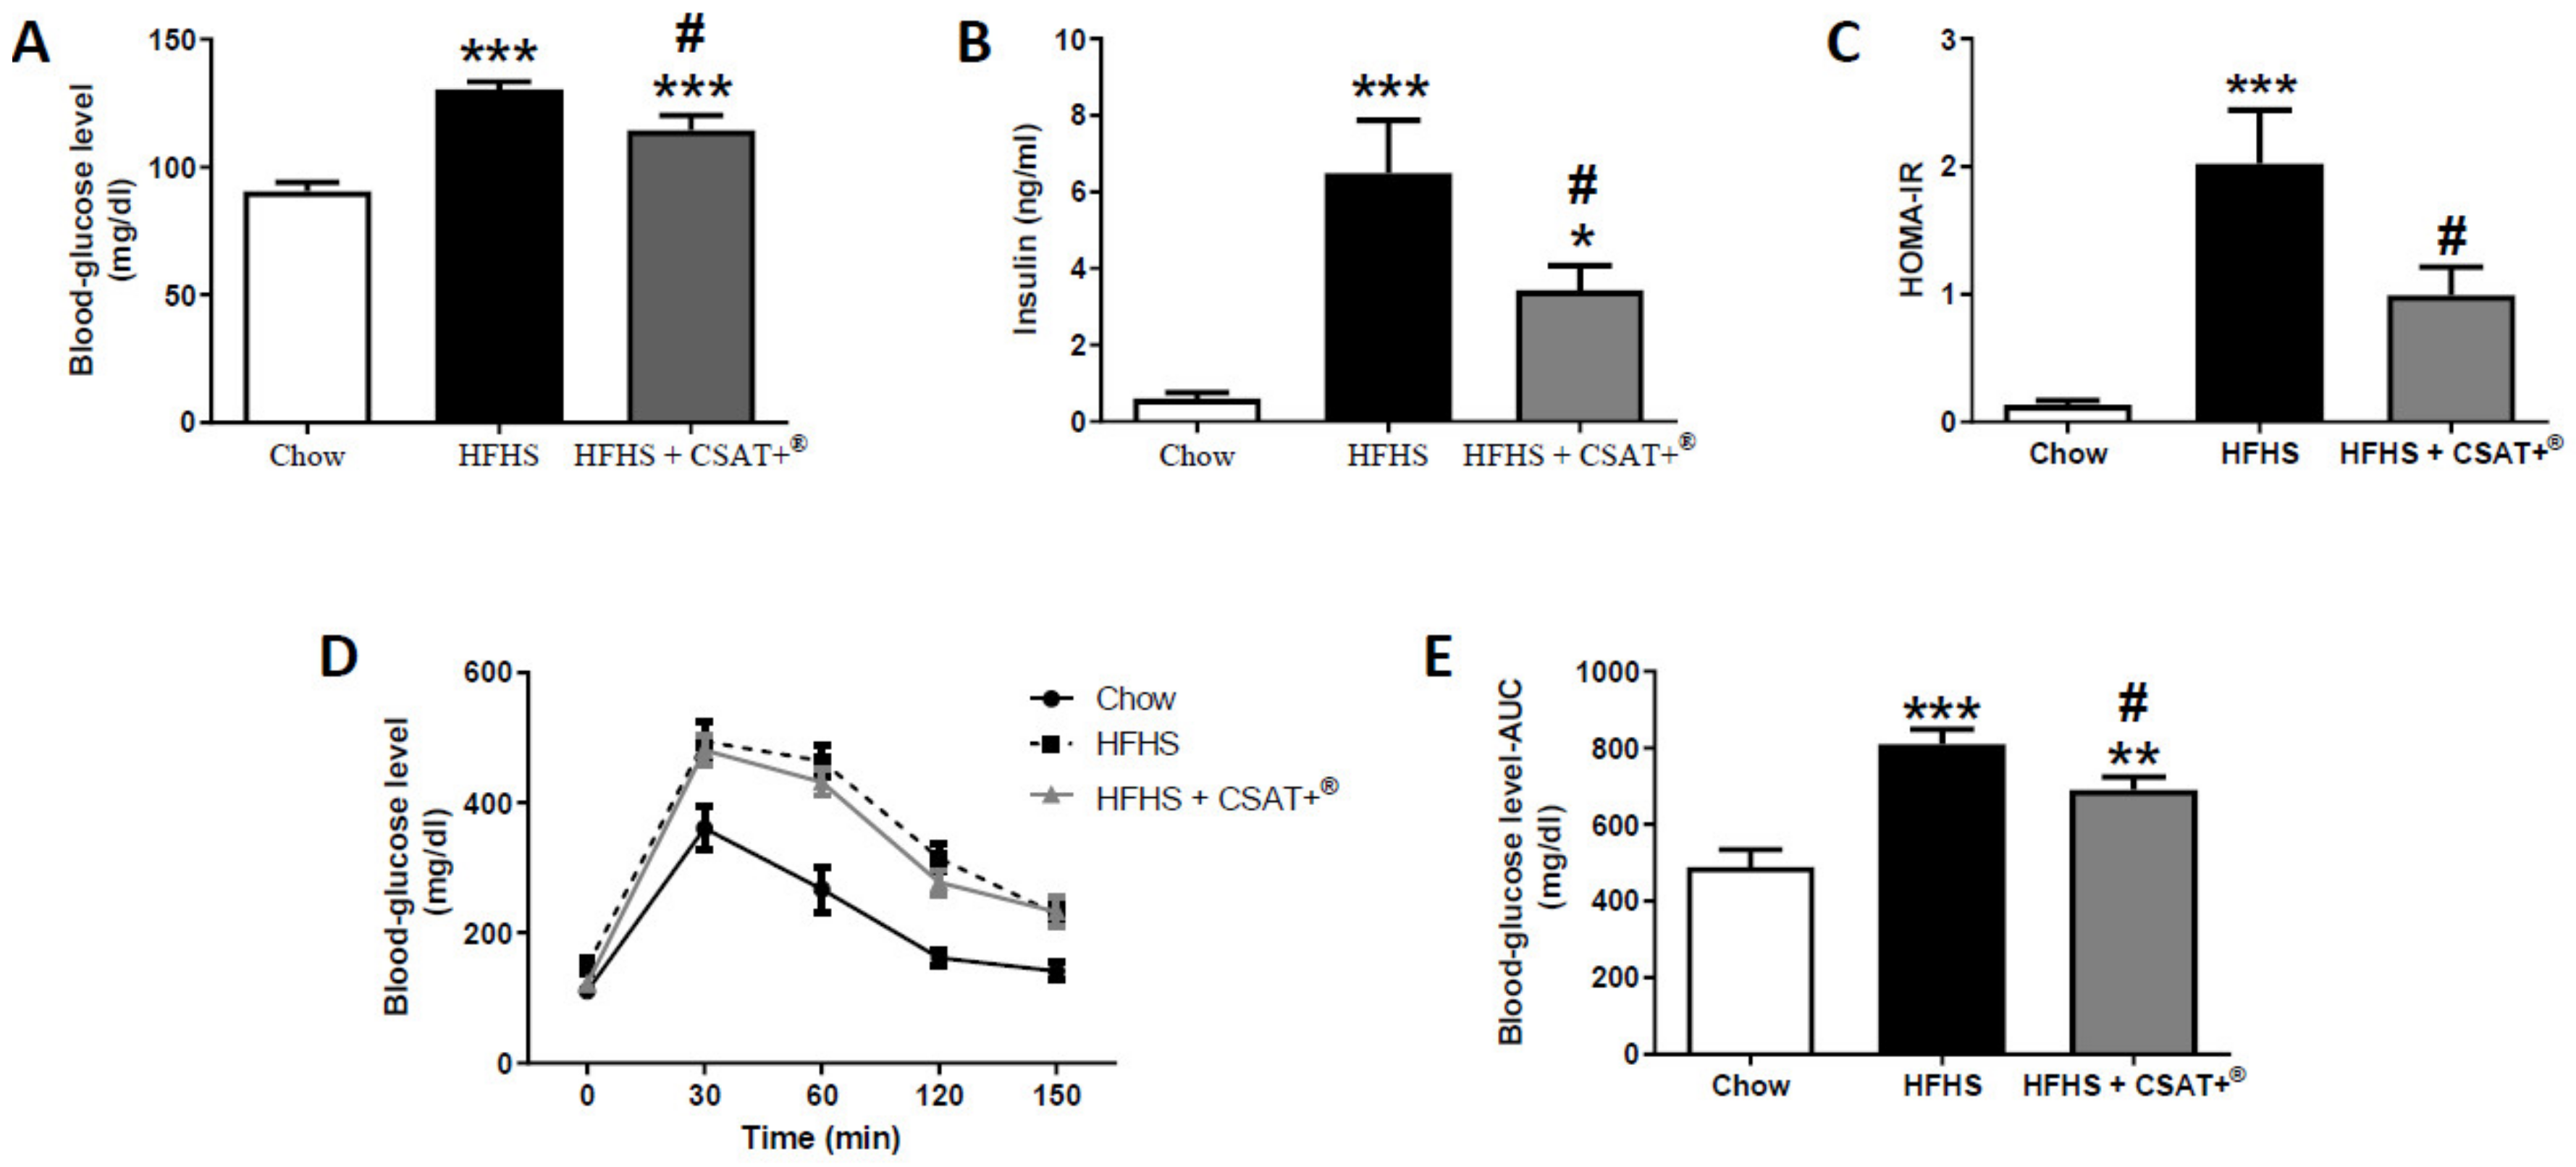
2.3.2. Glucose Tolerance Test (GTT) and Homeostatic Model Assessment of Insulin Resistance (HOMA-IR)
2.3.3. Serum Measurement
Metabolic Hormones
Lipid Profile
Pro-Inflammatory Cytokines
2.3.4. Measurement of Mean Arterial Pressure in Conscious Mice by the Tail-Cuff System
2.3.5. Reactive Hyperemia
2.3.6. Experiments of Vascular Reactivity
2.3.7. Experiments of Heart Perfusion: Langendorff
2.3.8. RNA Extraction and Quantitative Real-Time Polymerase Chain Reaction (qPCR)
2.3.9. Incubation of Aorta Segments, Retroperitoneal Adipose Tissue and Gastrocnemius Muscle Explants in Presence/Absence of Insulin (10−6 M)
2.3.10. Protein Quantification by Western Blot
2.3.11. Immunohistochemistry
2.3.12. TUNEL Assay
2.3.13. Statistical Analysis
3. Results
3.1. Chemical Characterization of CSAT+® by RP-HPLC-PAD-MS
3.2. Total Antioxidant Capacity of CSAT+®
3.3. Body Weight, Daily Food Intake, and Organ Weights
3.4. Glycaemic Status, Lipid Profile, and Plasma Concentrations of Metabolic Hormones
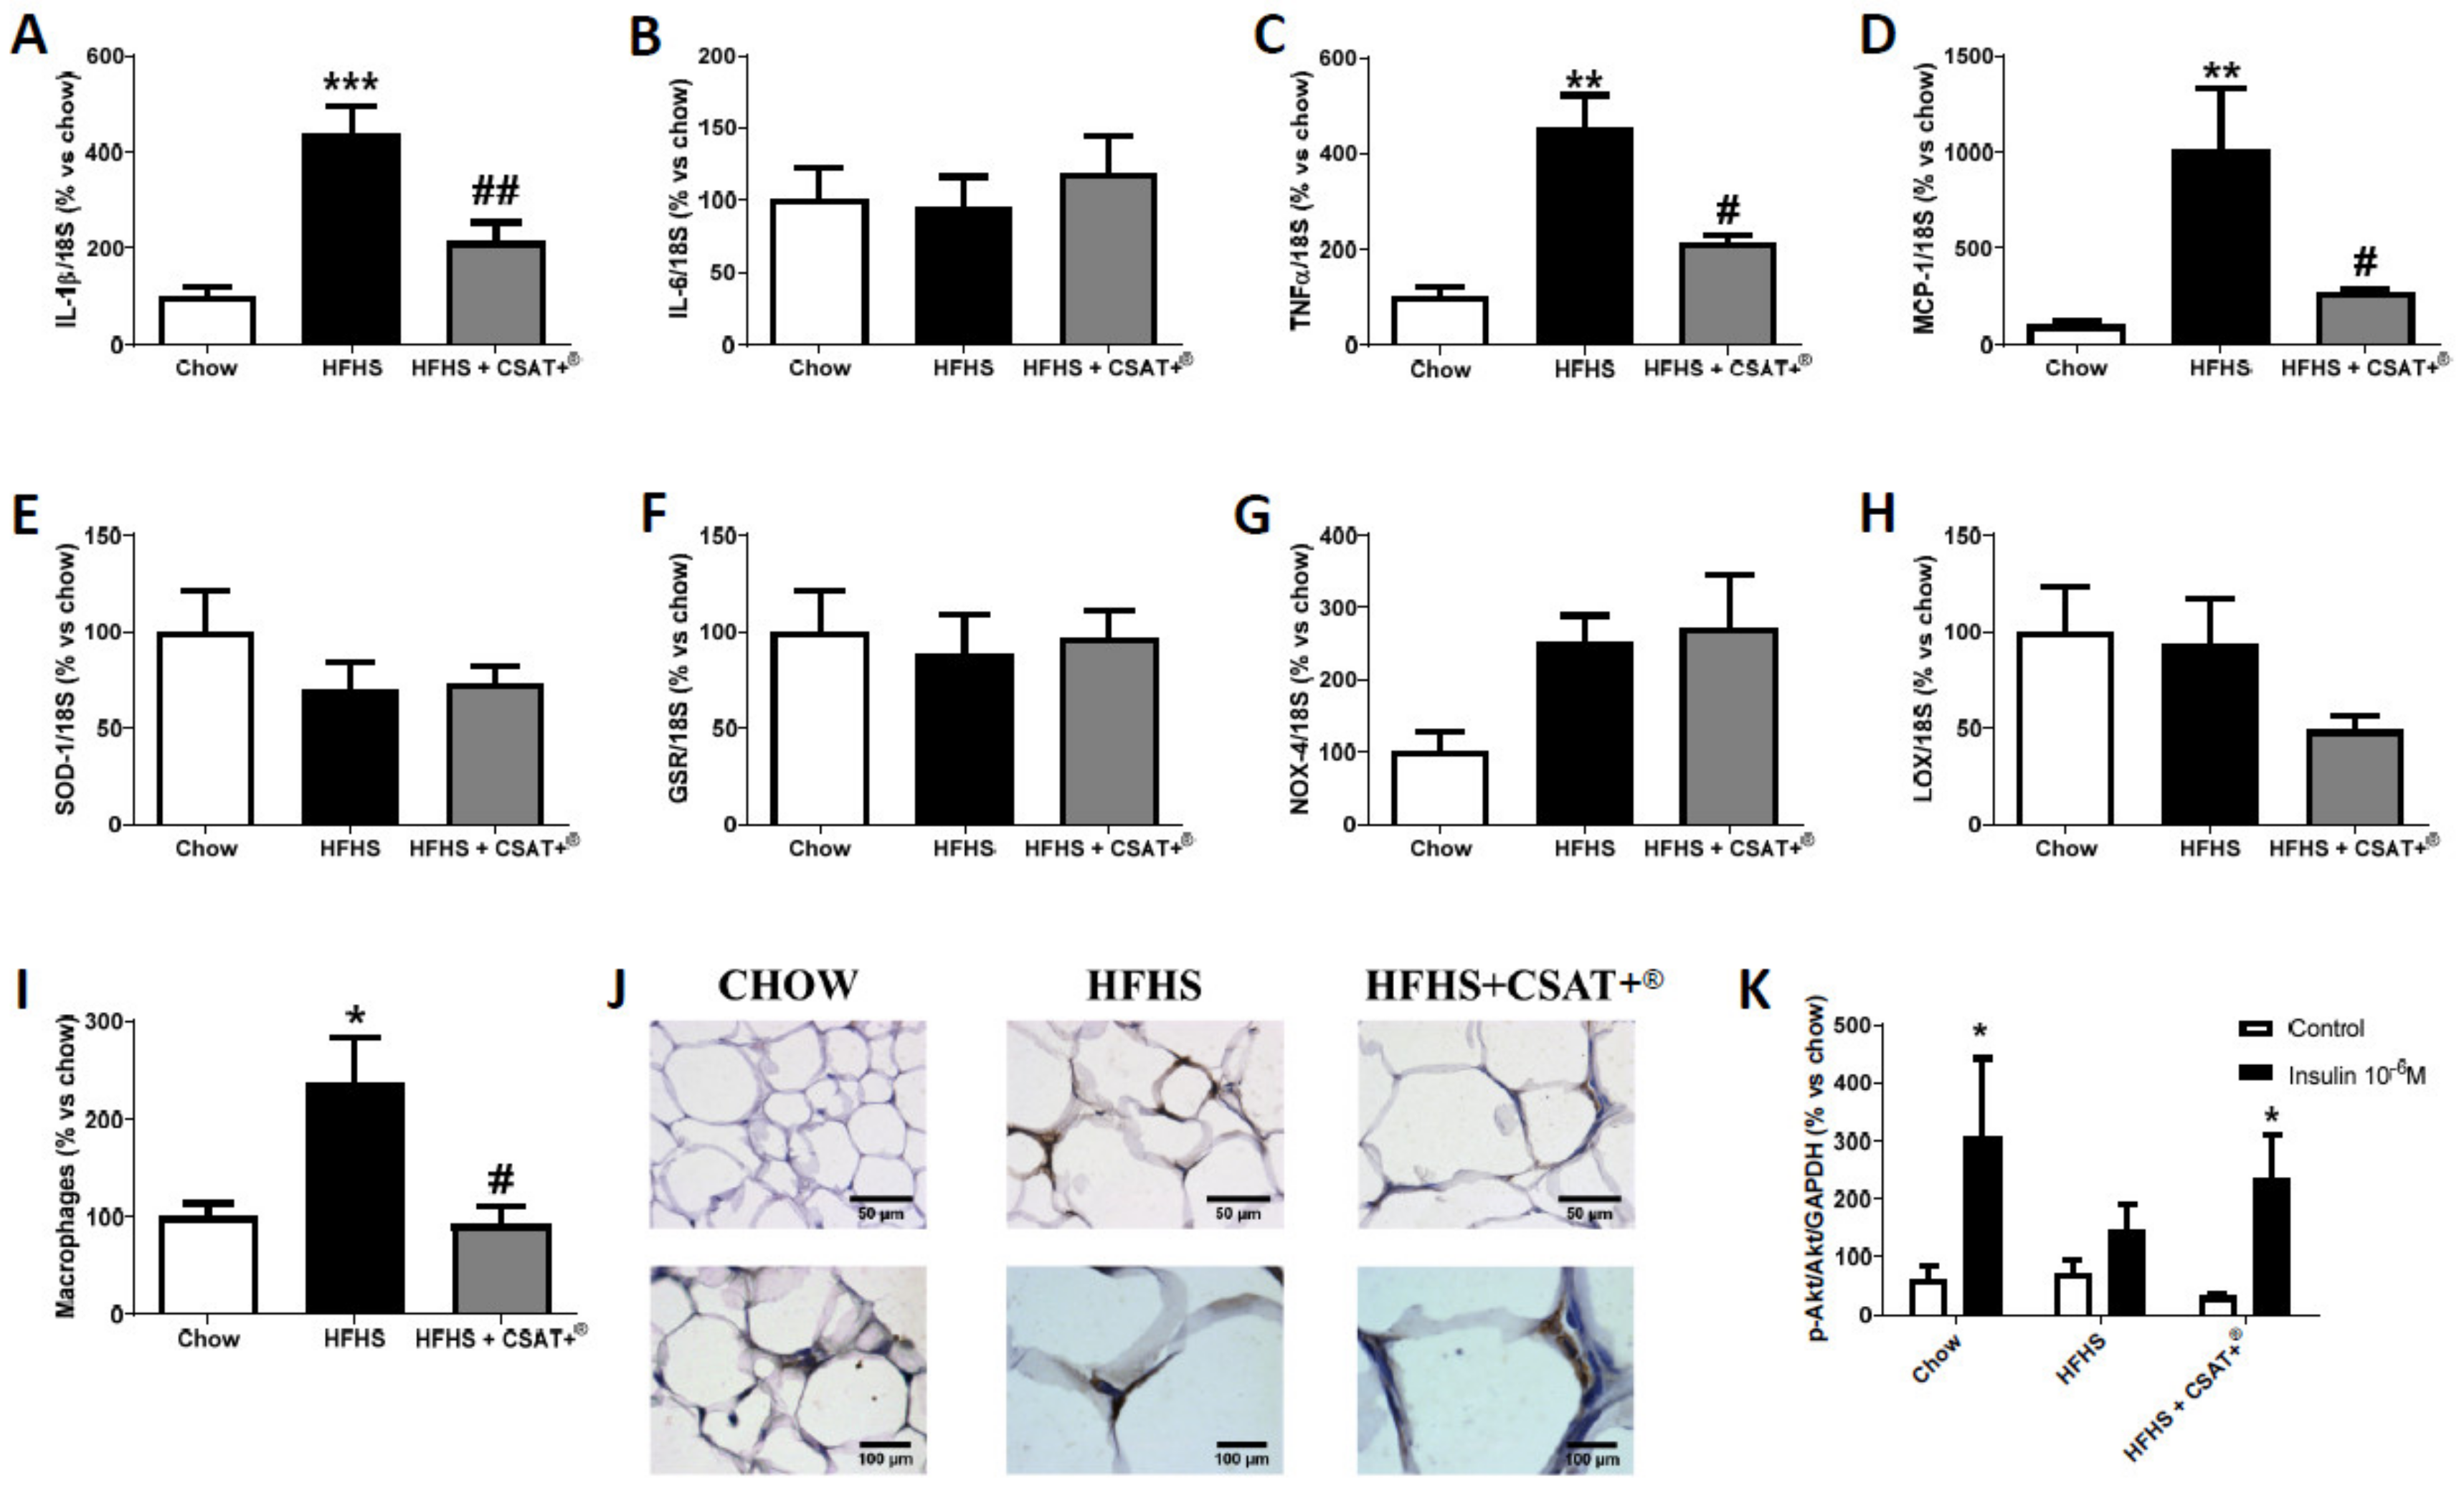
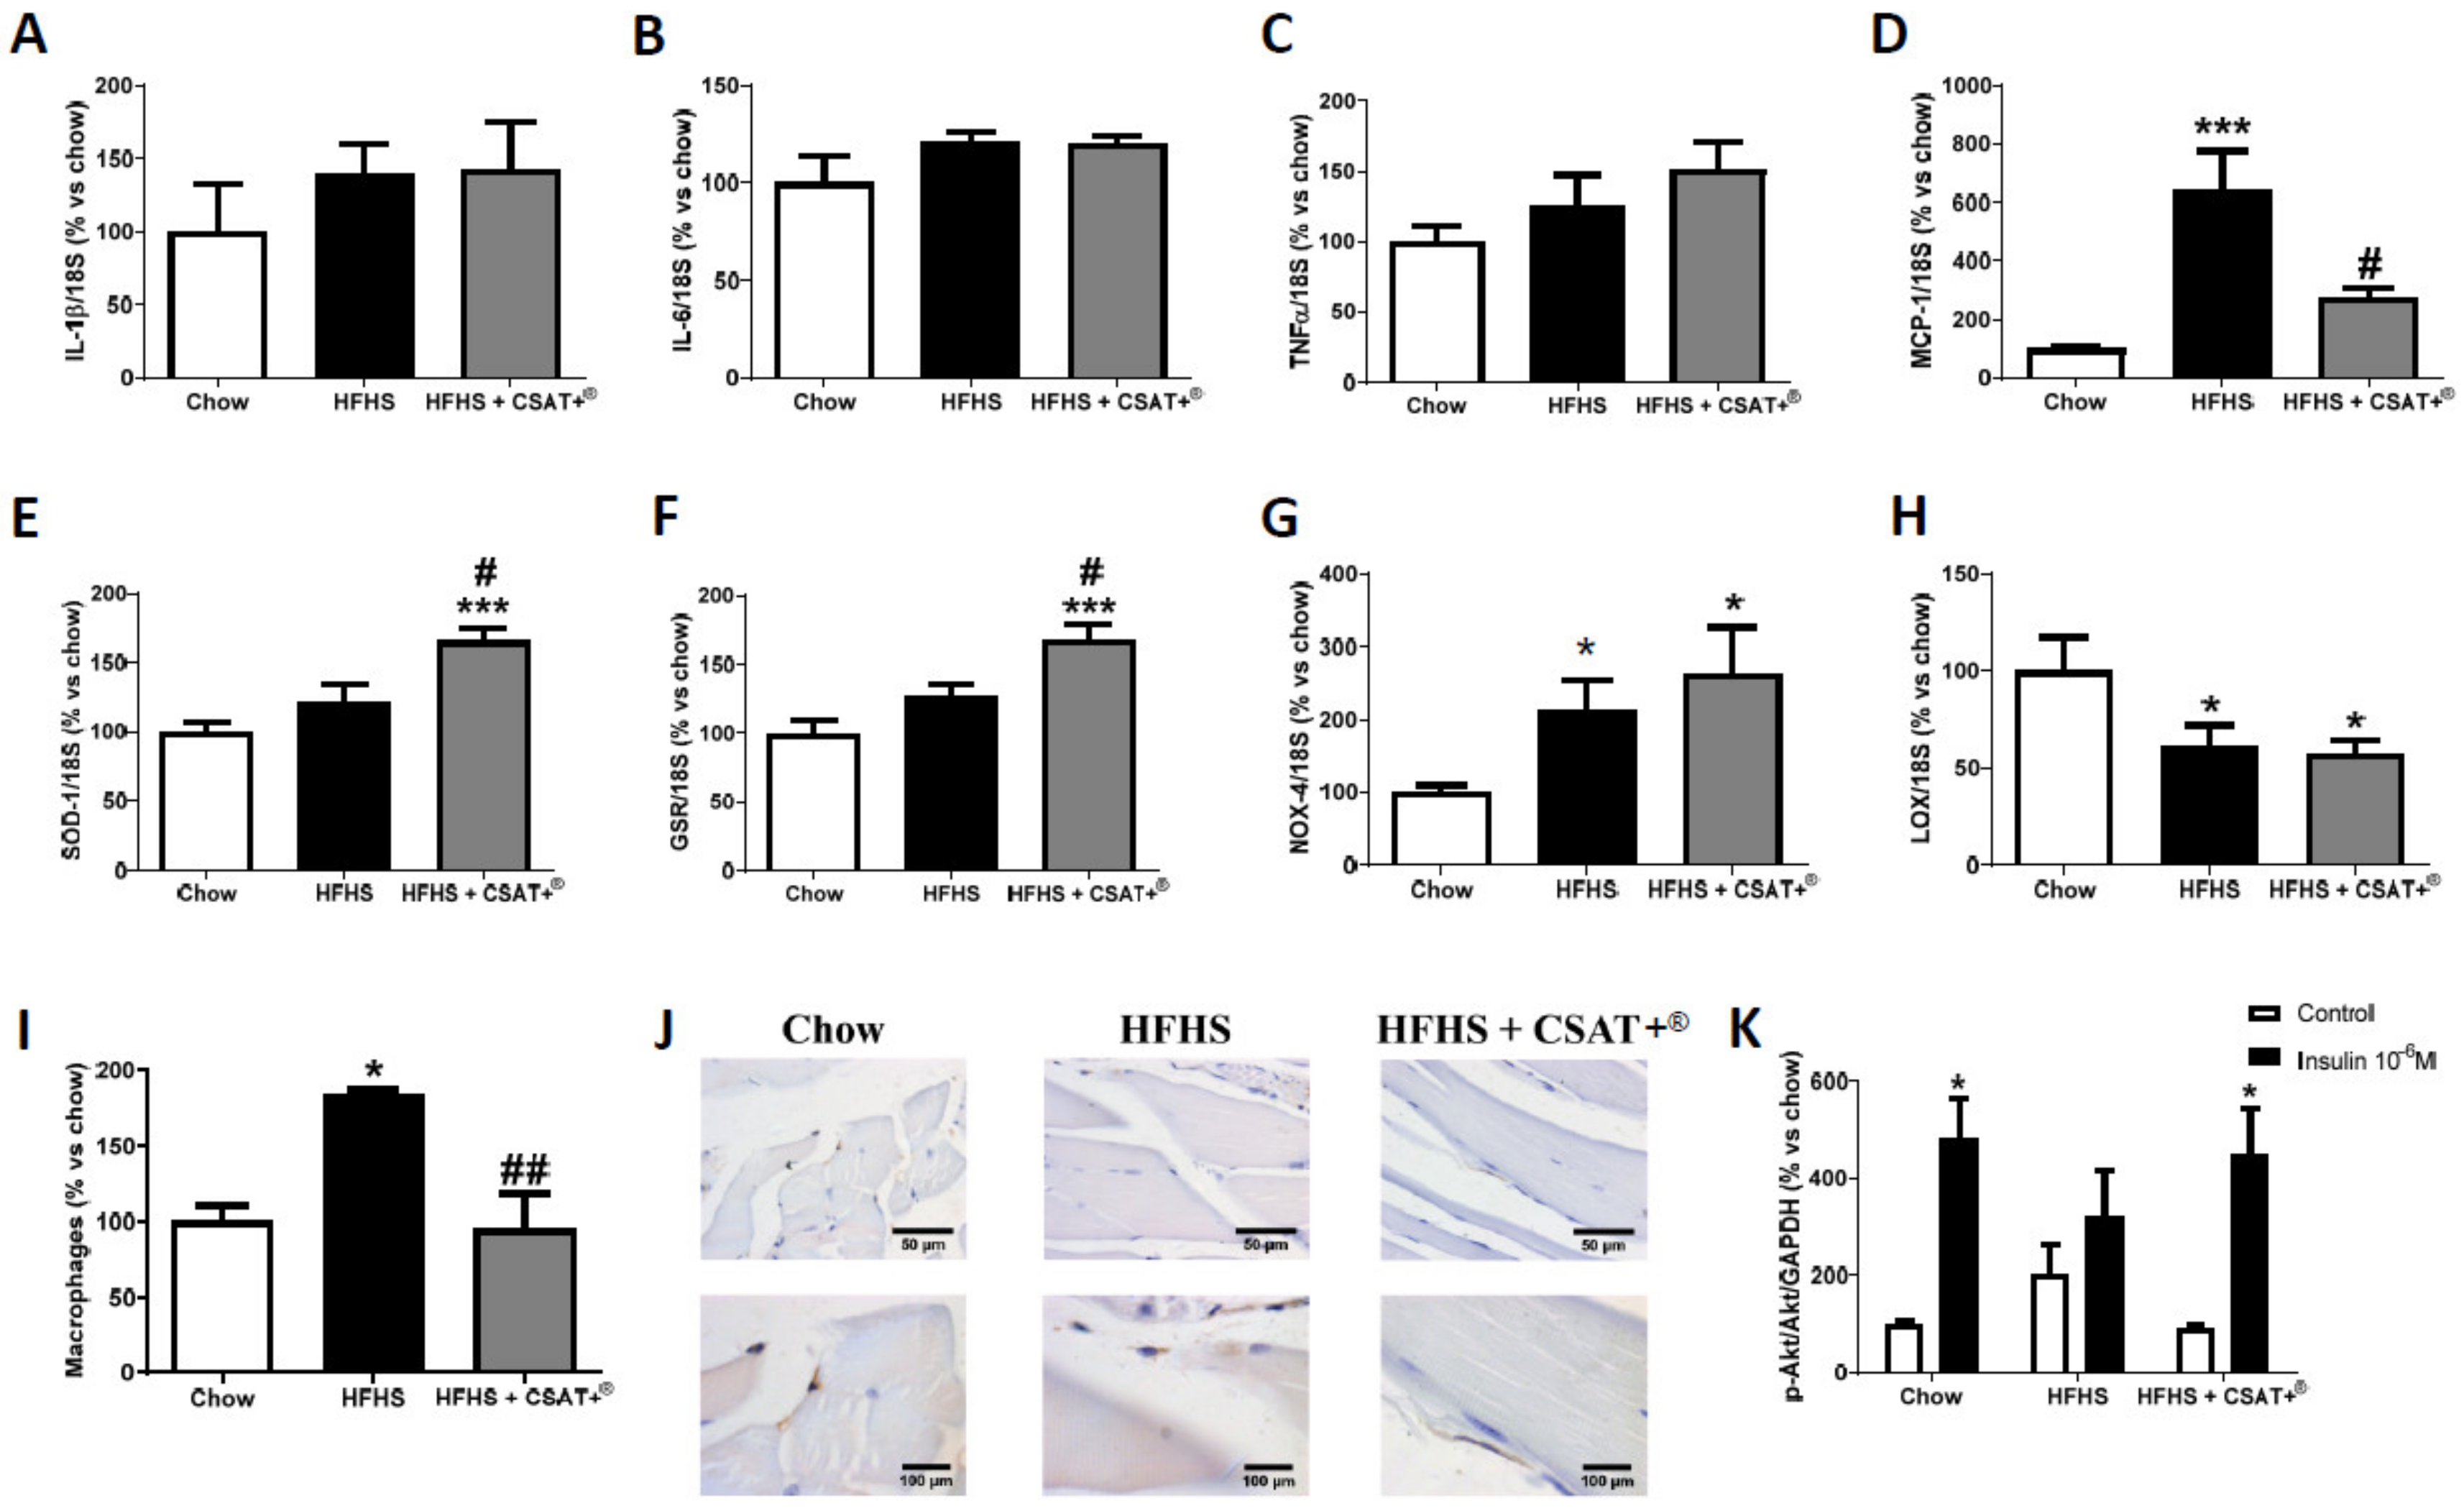
3.5. Gene Expression of Inflammatory Markers in Visceral Adipose Tissue and Skeletal Muscle
3.6. Gene Expression of Oxidative Stress-Related Markers in Visceral Adipose Tissue and Skeletal Muscle
3.7. Activation of the PI3K/Akt Pathway in Visceral Adipose Tissue and Skeletal Muscle Explants in Response to Insulin
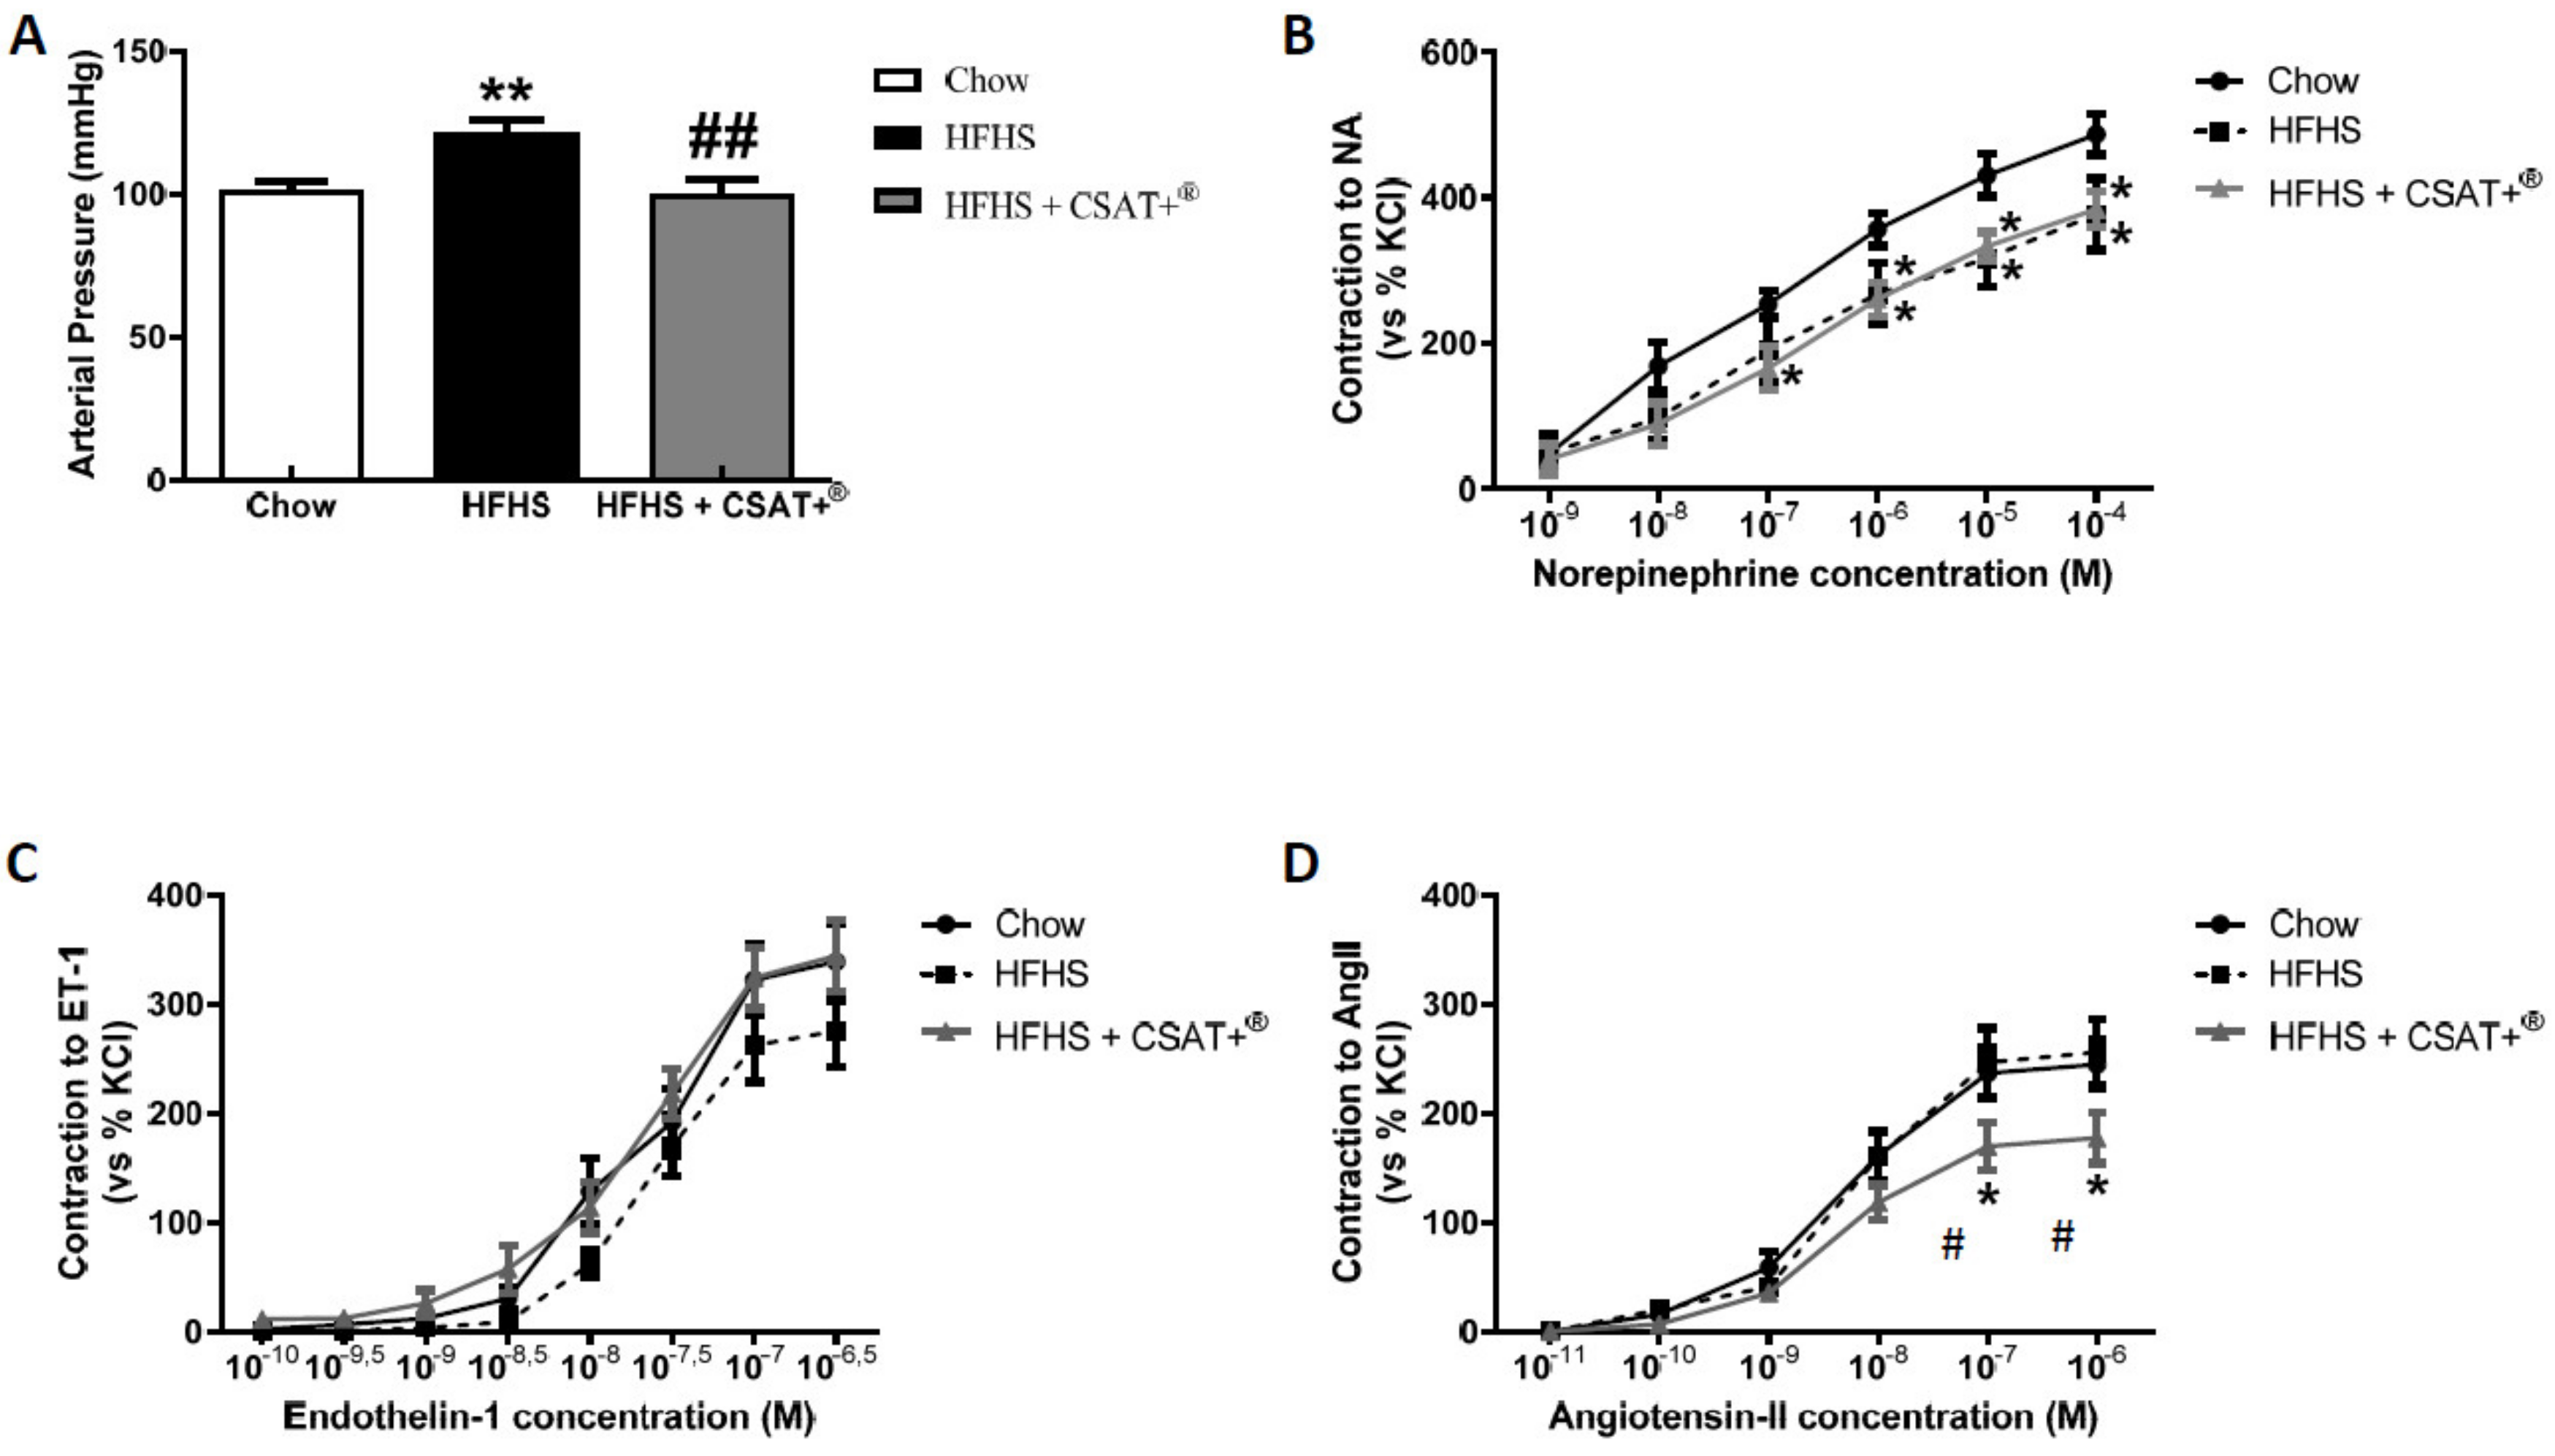
3.8. Blood Pressure and Vascular Reactivity in Response to the Vasoconstrictors Noradrenaline (NA), Endothelin-1 (ET-1), and Angiotensin II (AngII)
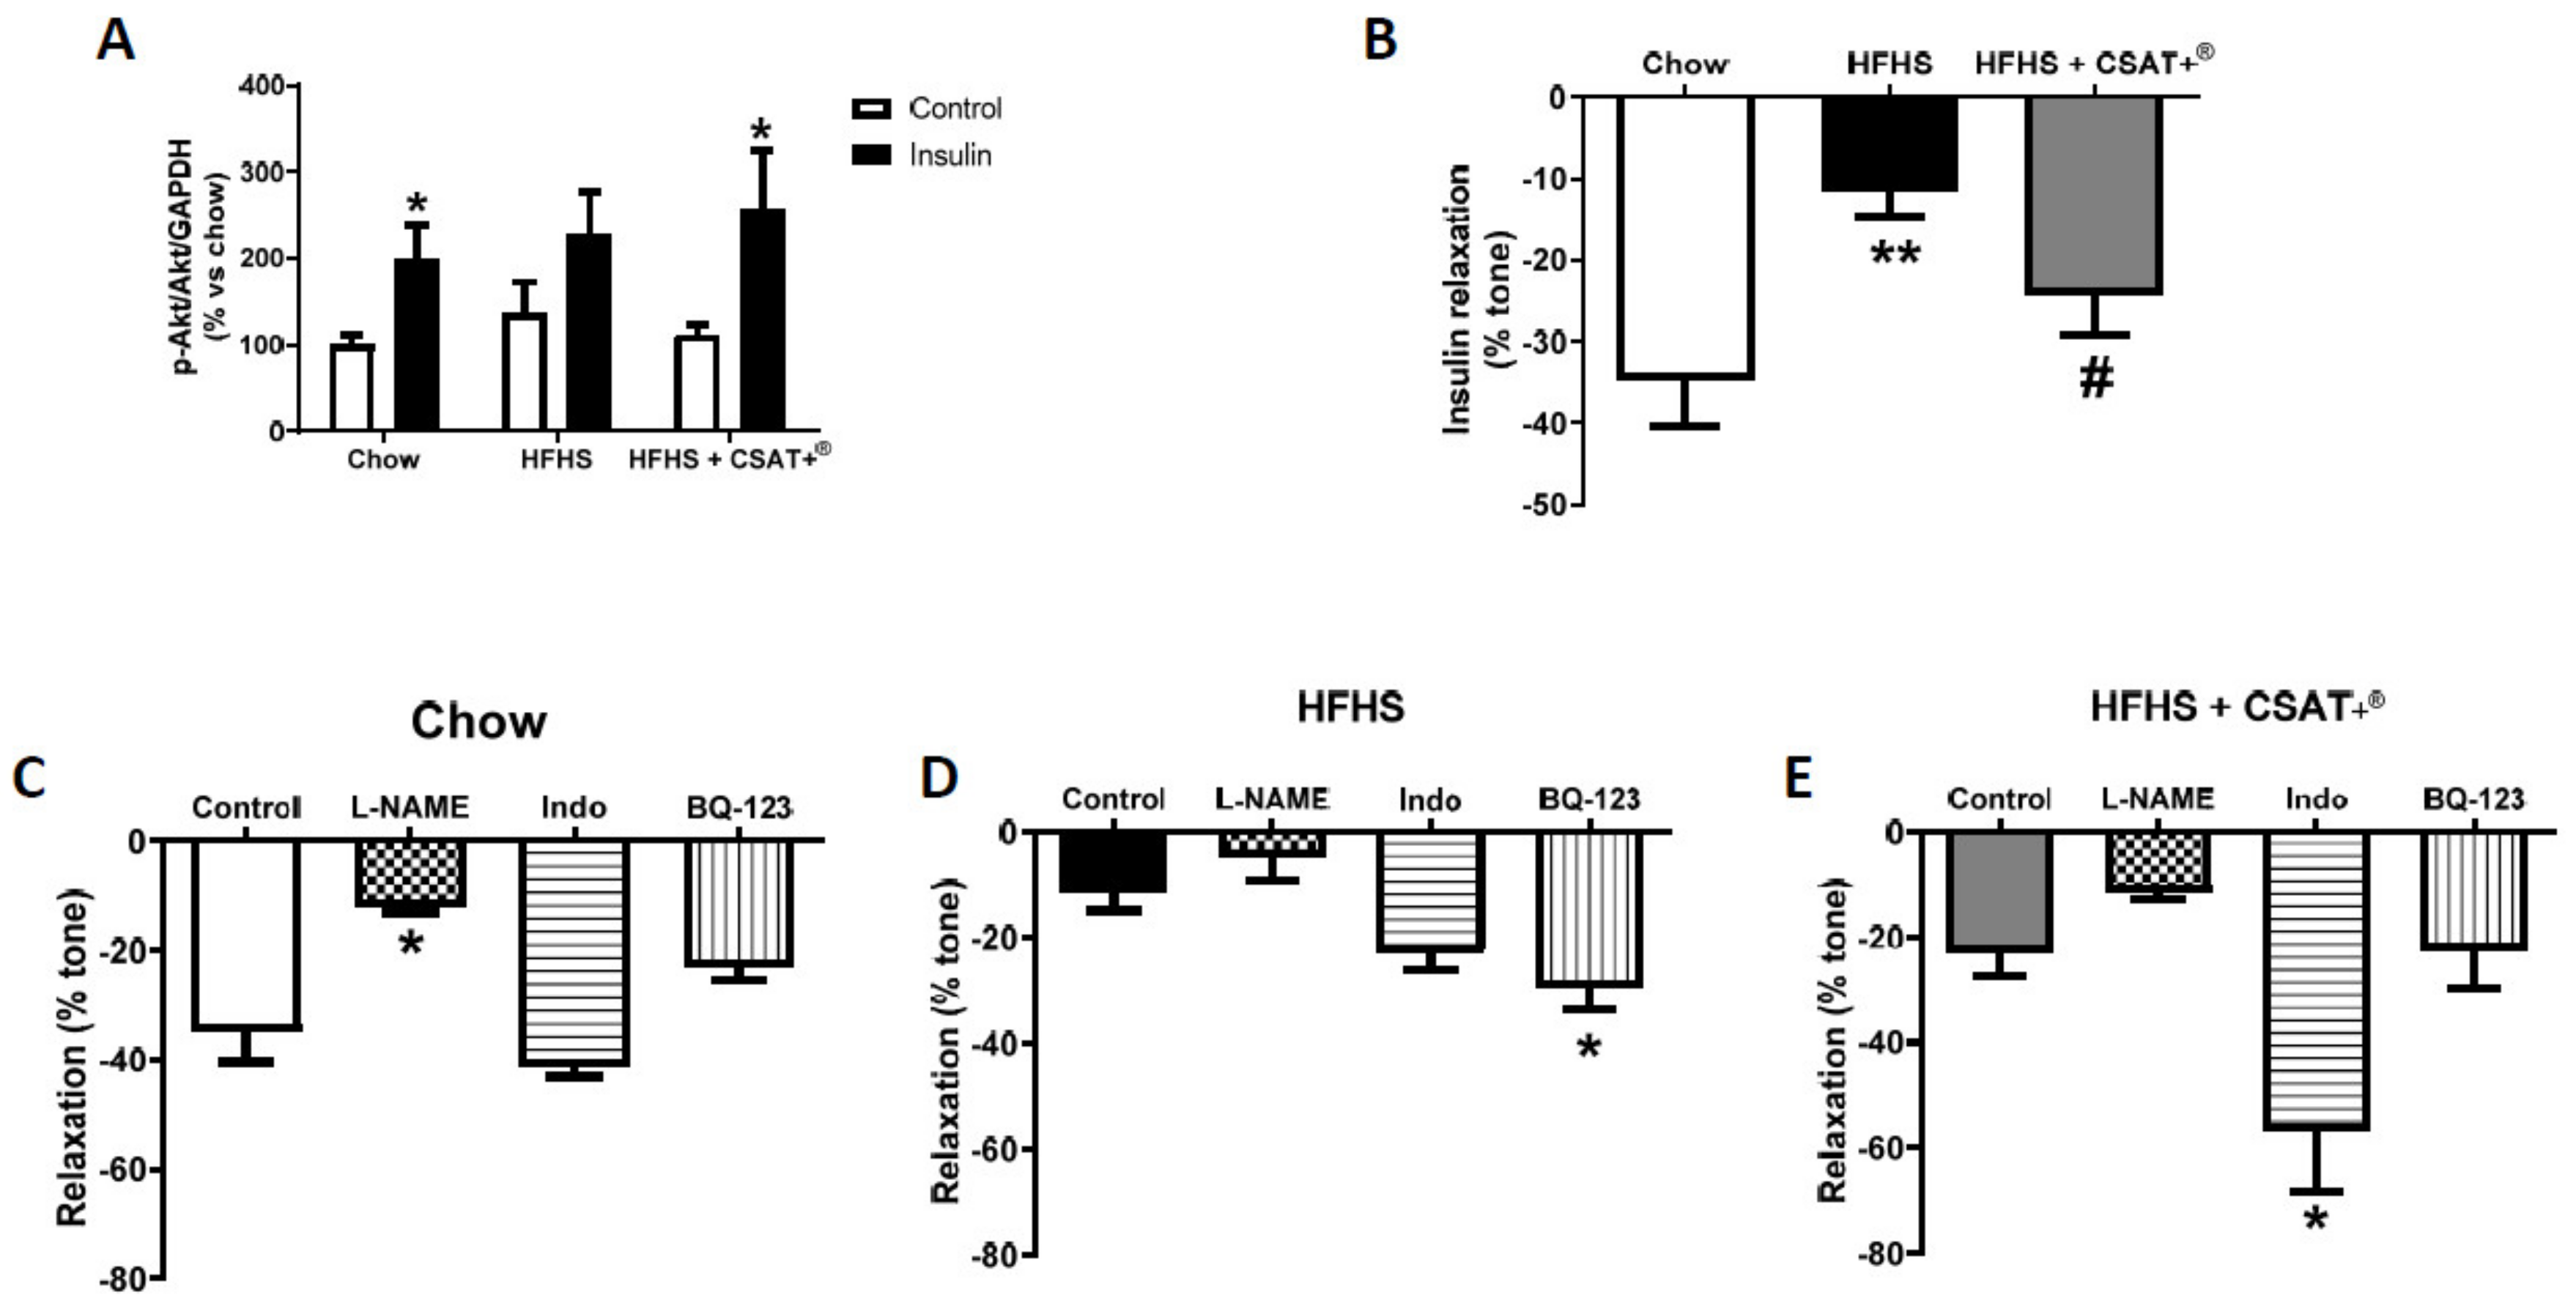
3.9. Assessment of Vascular Function In Vivo by Reactive Hyperemia and Ex Vivo by Endothelium-Dependent and Endothelium-Independent Relaxation of Aorta Segments
3.10. Vascular Reactivity and Activation of PI3K/Akt Pathway in Aorta Segments in Response to Insulin
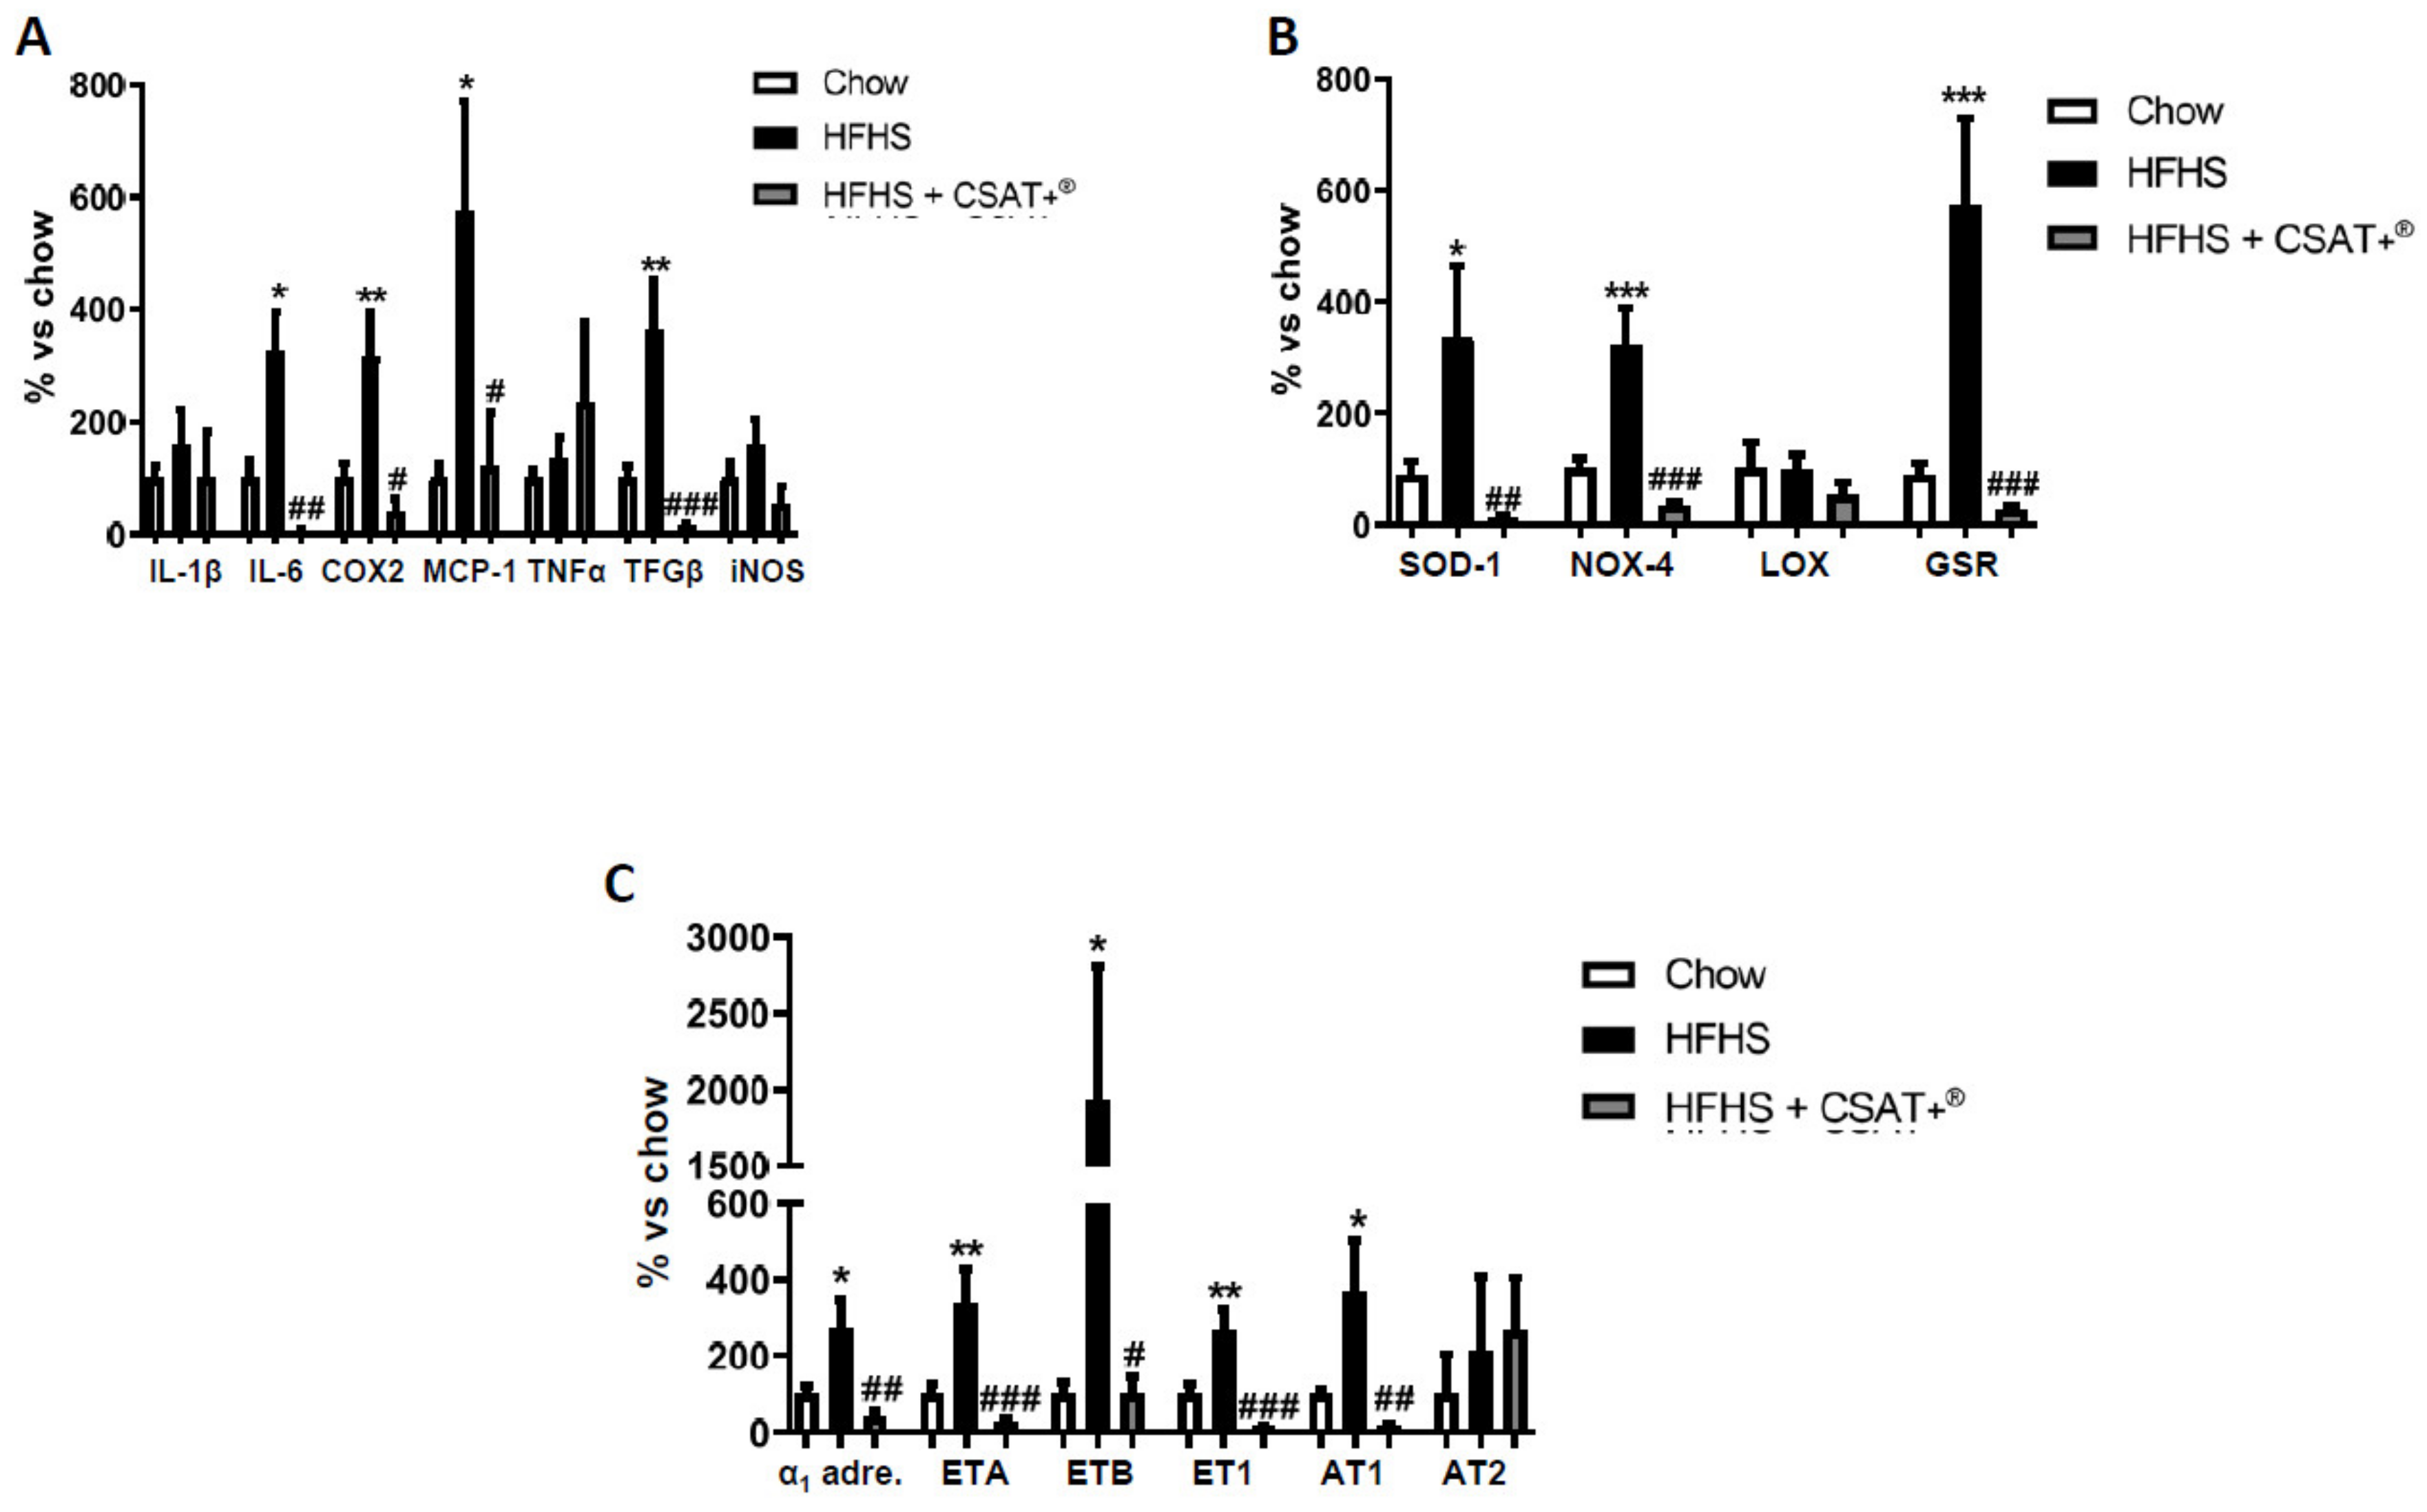
3.11. Gene Expression of Inflammatory, Oxidative-Related Markers, and Receptors of Vasoactive Substances in Arterial Tissue
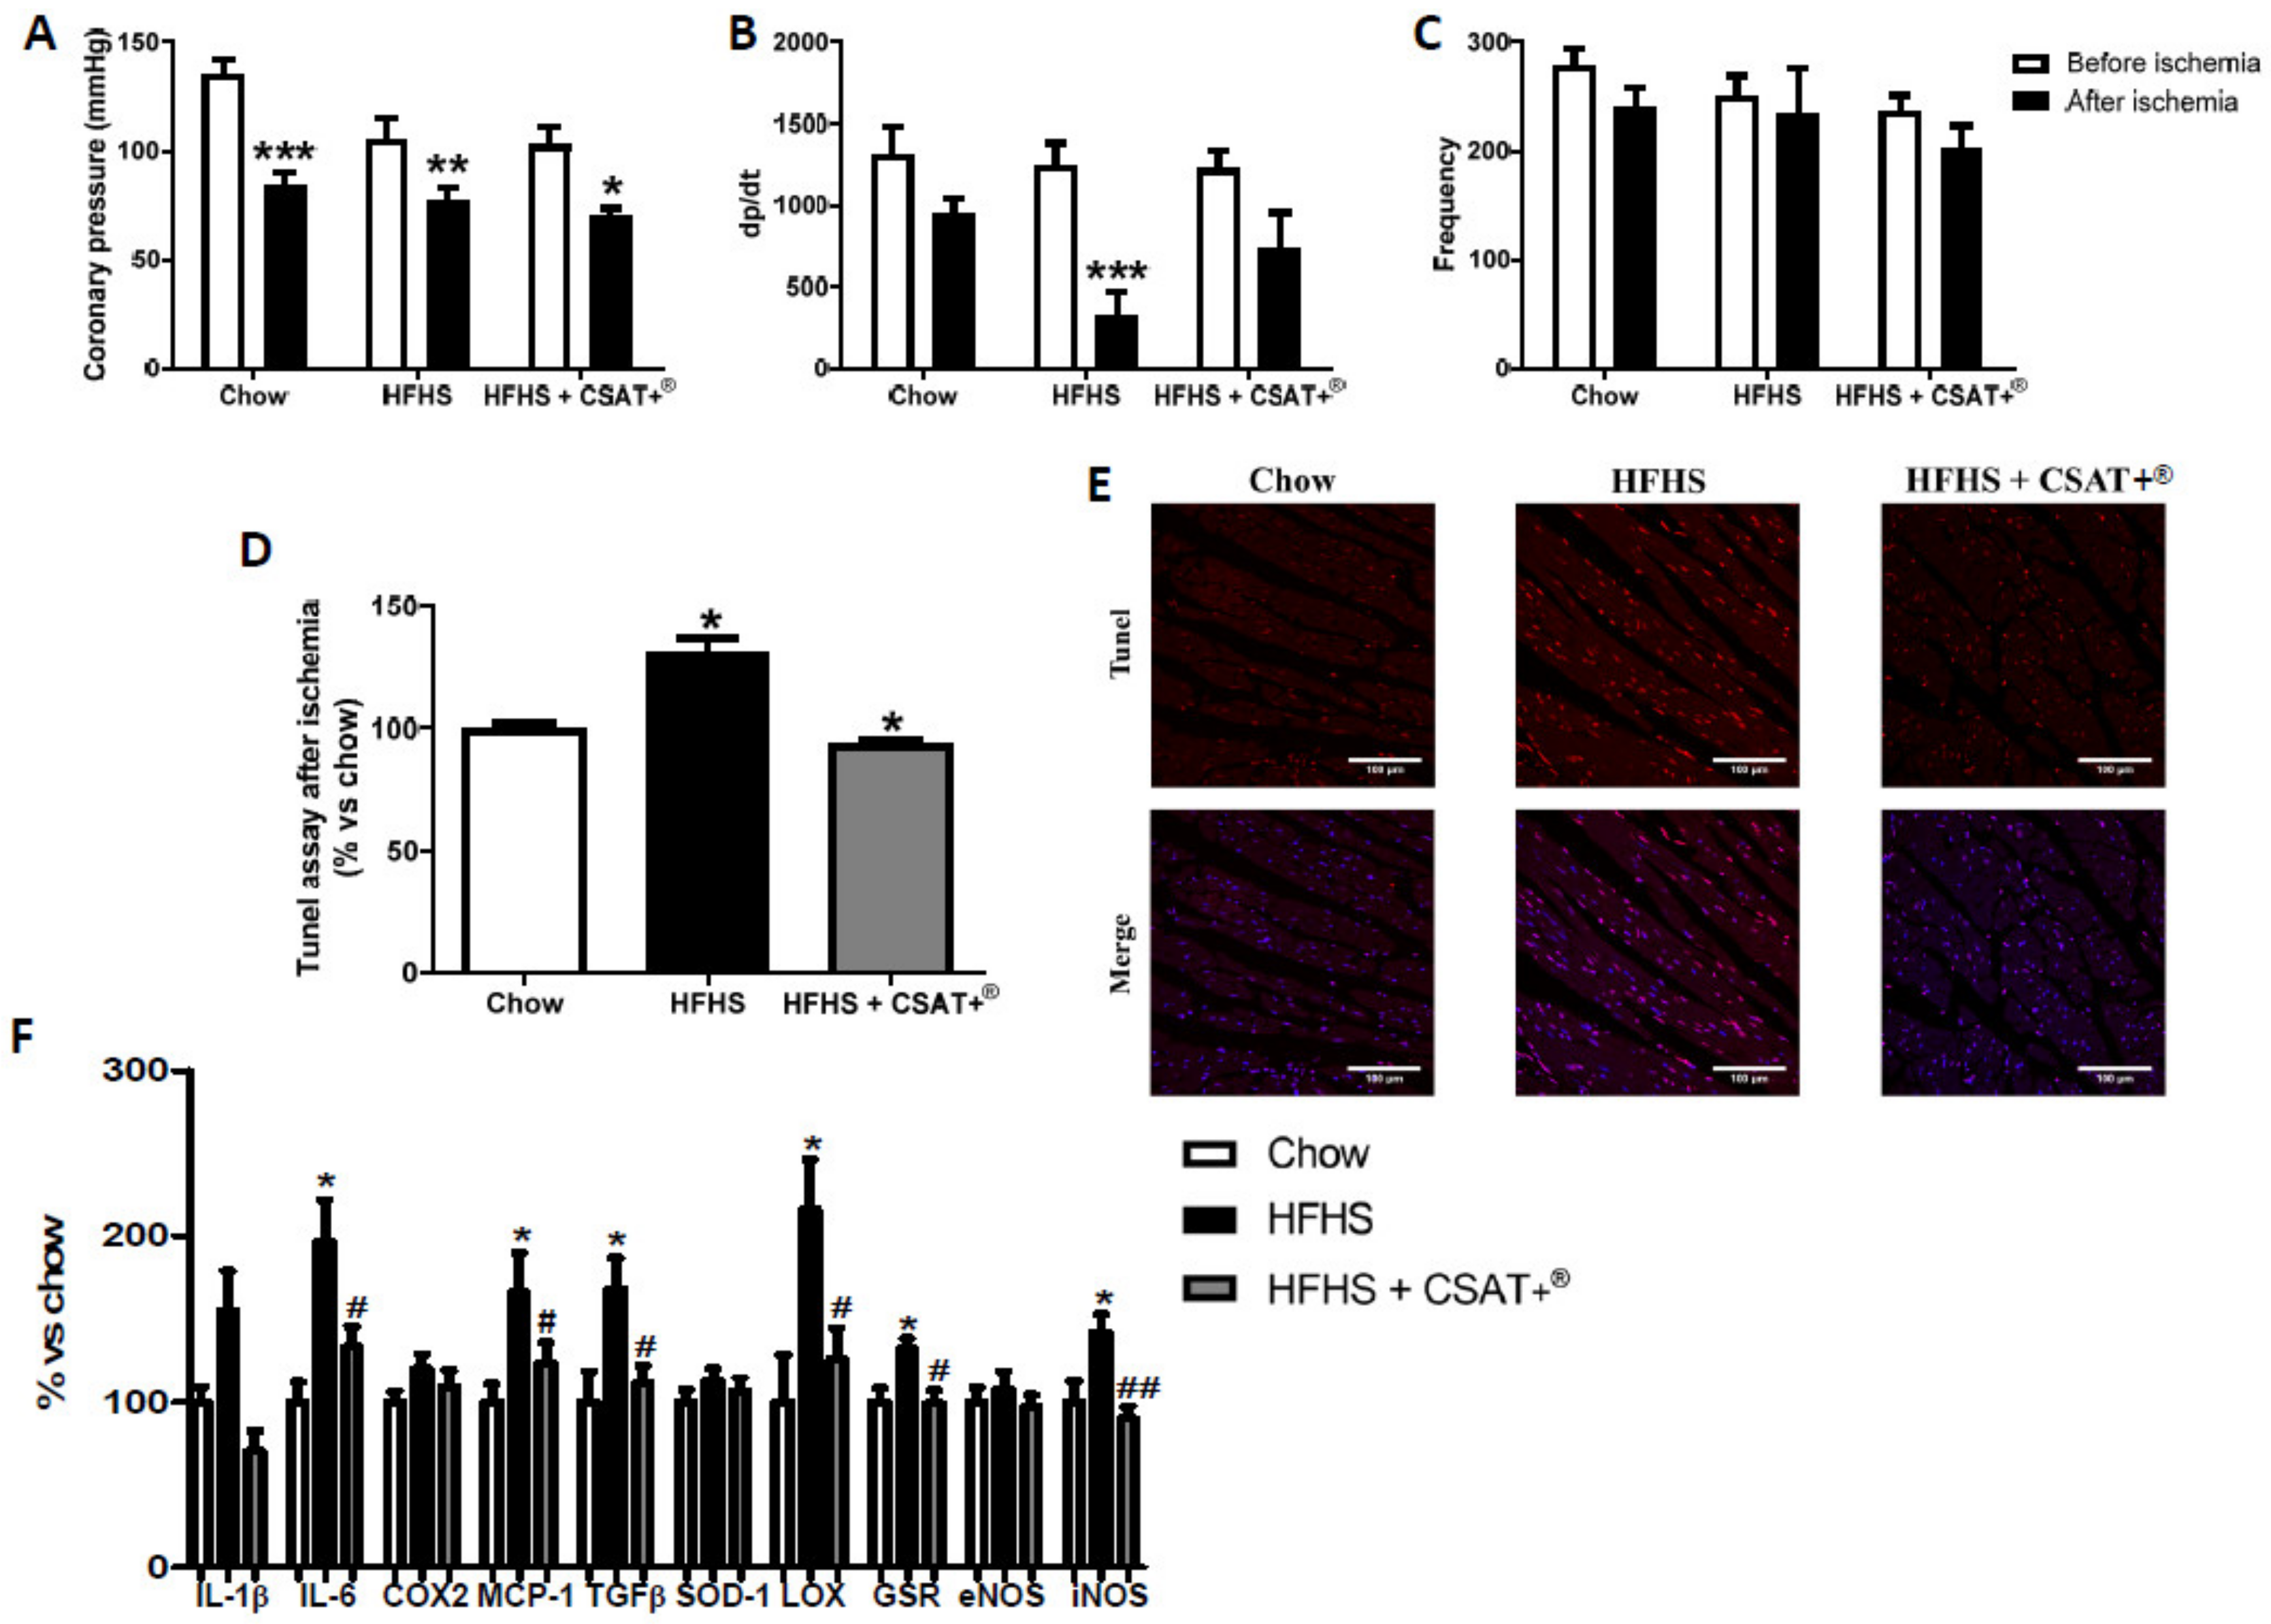
3.12. Effects of Carob Treatment on Cardiac Function after Coronary Ischemia-Reperfusion
3.13. Effects of CSAT+® Treatment on Cardiomyocyte Apoptosis and Gene Expression of Pro-Inflammatory and Oxidative Stress Related mMarkers in Myocardial Tissue
4. Discussion
Author Contributions
Funding
Acknowledgments
Conflicts of Interest
References
- O’Neill, S.; O’Driscoll, L. Metabolic syndrome: A closer look at the growing epidemic and its associated pathologies. Obes. Rev. 2015, 16, 1–12. [Google Scholar] [CrossRef] [PubMed] [Green Version]
- Saklayen, M.G. The global epidemic of the metabolic syndrome. Curr. Hypertens Rep. 2018, 20, 12. [Google Scholar] [CrossRef] [PubMed] [Green Version]
- Hosseini, Z.; Whiting, S.J.; Vatanparast, H. Current evidence on the association of the metabolic syndrome and dietary patterns in a global perspective. Nutr. Res. Rev. 2016, 29, 152–162. [Google Scholar] [CrossRef] [PubMed]
- Alberti, K.G.; Eckel, R.H.; Grundy, S.M.; Zimmet, P.Z.; Cleeman, J.I.; Donato, K.A.; Fruchart, J.C.; James, W.P.; Loria, C.M.; Smith, S.C., Jr.; et al. Harmonizing the metabolic syndrome: A joint interim statement of the International Diabetes Federation Task Force on Epidemiology and Prevention; National Heart, Lung, and Blood Institute; American Heart Association; World Heart Federation; International Atherosclerosis Society; and International Association for the Study of Obesity. Circulation 2009, 120, 1640–1645. [Google Scholar]
- Monteiro, R.; Azevedo, I. Chronic inflammation in obesity and the metabolic syndrome. Mediat. Inflamm. 2010, 2010, 289645. [Google Scholar] [CrossRef] [PubMed]
- Qatanani, M.; Lazar, M.A. Mechanisms of obesity-associated insulin resistance: Many choices on the menu. Genes Dev. 2007, 21, 1443–1455. [Google Scholar] [CrossRef] [PubMed] [Green Version]
- Tune, J.D.; Goodwill, A.G.; Sassoon, D.J.; Mather, K.J. Cardiovascular consequences of metabolic syndrome. Transl. Res. 2017, 183, 57–70. [Google Scholar] [CrossRef] [Green Version]
- Cooper, S.A.; Whaley-Connell, A.; Habibi, J.; Wei, Y.; Lastra, G.; Manrique, C.; Stas, S.; Sowers, J.R. Renin-angiotensin-aldosterone system and oxidative stress in cardiovascular insulin resistance. Am. J. Physiol. Heart Circ. Physiol. 2007, 293, H2009–H2023. [Google Scholar] [CrossRef] [PubMed] [Green Version]
- Grassi, G.; Seravalle, G.; Quarti-Trevano, F.; Scopelliti, F.; Dell’Oro, R.; Bolla, G.; Mancia, G. Excessive sympathetic activation in heart failure with obesity and metabolic syndrome: Characteristics and mechanisms. Hypertension 2007, 49, 535–541. [Google Scholar] [CrossRef] [Green Version]
- Hall, J.E.; do Carmo, J.M.; da Silva, A.A.; Wang, Z.; Hall, M.E. Obesity-induced hypertension: Interaction of neurohumoral and renal mechanisms. Circ. Res. 2015, 116, 991–1006. [Google Scholar] [CrossRef] [Green Version]
- Turkbey, E.B.; McClelland, R.L.; Kronmal, R.A.; Burke, G.L.; Bild, D.E.; Tracy, R.P.; Arai, A.E.; Lima, J.A.; Bluemke, D.A. The impact of obesity on the left ventricle: The Multi-Ethnic Study of Atherosclerosis (MESA). JACC Cardiovasc. Imaging 2010, 3, 266–274. [Google Scholar] [CrossRef] [PubMed] [Green Version]
- Mozaffari, M.S.; Schaffer, S.W. Myocardial ischemic-reperfusion injury in a rat model of metabolic syndrome. Obesity 2008, 16, 2253–2258. [Google Scholar] [CrossRef] [PubMed]
- Thakker, G.D.; Frangogiannis, N.G.; Bujak, M.; Zymek, P.; Gaubatz, J.W.; Reddy, A.K.; Taffet, G.; Michael, L.H.; Entman, M.L.; Ballantyne, C.M. Effects of diet-induced obesity on inflammation and remodeling after myocardial infarction. Am. J. Physiol. Heart Circ. Physiol. 2006, 291, H2504–H2514. [Google Scholar] [CrossRef] [Green Version]
- Borbouse, L.; Dick, G.M.; Payne, G.A.; Berwick, Z.C.; Neeb, Z.P.; Alloosh, M.; Bratz, I.N.; Sturek, M.; Tune, J.D. Metabolic syndrome reduces the contribution of K+ channels to ischemic coronary vasodilation. Am. J. Physiol. Heart Circ. Physiol. 2010, 298, H1182–H1189. [Google Scholar] [CrossRef] [PubMed] [Green Version]
- Muniyappa, R.; Montagnani, M.; Koh, K.K.; Quon, M.J. Cardiovascular actions of insulin. Endocr. Rev. 2007, 28, 463–491. [Google Scholar] [CrossRef] [PubMed]
- Muniyappa, R.; Sowers, J.R. Role of insulin resistance in endothelial dysfunction. Rev. Endocr. Metab. Disord. 2013, 14, 5–12. [Google Scholar] [CrossRef] [PubMed]
- Pucci, A.; Finer, N. New medications for treatment of obesity: Metabolic and cardiovascular effects. Can. J. Cardiol. 2015, 31, 142–152. [Google Scholar] [CrossRef] [PubMed]
- Banuls, C.; Rovira-Llopis, S.; Lopez-Domenech, S.; Veses, S.; Victor, V.M.; Rocha, M.; Hernandez-Mijares, A. Effect of consumption of a carob pod inositol-enriched beverage on insulin sensitivity and inflammation in middle-aged prediabetic subjects. Food Funct. 2016, 7, 4379–4387. [Google Scholar] [CrossRef]
- Lambert, C.; Cubedo, J.; Padro, T.; Vilahur, G.; Lopez-Bernal, S.; Rocha, M.; Hernandez-Mijares, A.; Badimon, L. Effects of a carob-pod-derived sweetener on glucose metabolism. Nutrients 2018, 10, 271. [Google Scholar] [CrossRef] [PubMed] [Green Version]
- Qasem, M.A.; Noordin, M.I.; Arya, A.; Alsalahi, A.; Jayash, S.N. Evaluation of the glycemic effect of Ceratonia siliqua pods (Carob) on a streptozotocin-nicotinamide induced diabetic rat model. PeerJ 2018, 6, e4788. [Google Scholar] [CrossRef] [Green Version]
- Rtibi, K.; Selmi, S.; Grami, D.; Saidani, K.; Sebai, H.; Amri, M.; Eto, B.; Marzouki, L. Ceratonia siliqua L. (immature carob bean) inhibits intestinal glucose absorption, improves glucose tolerance and protects against alloxan-induced diabetes in rat. J. Sci. Food Agric. 2017, 97, 2664–2670. [Google Scholar] [CrossRef]
- El Rabey, H.A.; Al-Seeni, M.N.; Al-Ghamdi, H.B. Comparison between the Hypolipidemic Activity of Parsley and Carob in Hypercholesterolemic Male Rats. BioMed Res. Int. 2017, 2017, 3098745. [Google Scholar] [CrossRef] [Green Version]
- Macho-Gonzalez, A.; Garcimartin, A.; Lopez-Oliva, M.E.; Ruiz-Roso, B.; Martin de la Torre, I.; Bastida, S.; Benedi, J.; Sanchez-Muniz, F.J. Can carob-fruit-extract-enriched meat improve the lipoprotein profile, VLDL-oxidation, and LDL receptor levels induced by an atherogenic diet in STZ-NAD-diabetic rats? Nutrients 2019, 11, 332. [Google Scholar] [CrossRef] [Green Version]
- Martinez-Rodriguez, R.; Navarro-Alarcon, M.; Rodriguez-Martinez, C.; Fonolla-Joya, J. [Effects on the lipid profile in humans of a polyphenol-rich carob (Ceratonia siliqua L.) extract in a dairy matrix like a functional food; a pilot study]. Nutr. Hosp. 2013, 28, 2107–2114. [Google Scholar] [CrossRef] [PubMed]
- Ruiz-Roso, B.; Quintela, J.C.; de la Fuente, E.; Haya, J.; Perez-Olleros, L. Insoluble carob fiber rich in polyphenols lowers total and LDL cholesterol in hypercholesterolemic sujects. Plant Foods Hum. Nutr. 2010, 65, 50–56. [Google Scholar] [CrossRef] [PubMed]
- Zunft, H.J.; Luder, W.; Harde, A.; Haber, B.; Graubaum, H.J.; Koebnick, C.; Grunwald, J. Carob pulp preparation rich in insoluble fibre lowers total and LDL cholesterol in hypercholesterolemic patients. Eur. J. Nutr. 2003, 42, 235–242. [Google Scholar] [CrossRef]
- Martinez-Villaluenga, C.; Penas, E.; Rico, D.; Martin-Diana, A.B.; Portillo, M.P.; Macarulla, M.T.; de Luis, D.A.; Miranda, J. Potential usefulness of a wakame/carob functional snack for the treatment of several aspects of metabolic syndrome: From in vitro to in vivo studies. Mar. Drugs 2018, 16, 512. [Google Scholar] [CrossRef] [Green Version]
- Valero-Munoz, M.; Martin-Fernandez, B.; Ballesteros, S.; Lahera, V.; de las Heras, N. Carob pod insoluble fiber exerts anti-atherosclerotic effects in rabbits through sirtuin-1 and peroxisome proliferator-activated receptor-gamma coactivator-1alpha. J. Nutr. 2014, 144, 1378–1384. [Google Scholar] [CrossRef] [PubMed] [Green Version]
- Goulas, V.; Stylos, E.; Chatziathanasiadou, M.V.; Mavromoustakos, T.; Tzakos, A.G. Functional components of carob fruit: Linking the chemical and biological space. Int. J. Mol. Sci. 2016, 17, 1875. [Google Scholar] [CrossRef] [PubMed]
- Zhu, B.J.; Zayed, M.Z.; Zhu, H.X.; Zhao, J.; Li, S.P. Functional polysaccharides of carob fruit: A review. Chin. Med. 2019, 14, 40. [Google Scholar] [CrossRef] [PubMed] [Green Version]
- Rico, D.; Martin-Diana, A.B.; Martinez-Villaluenga, C.; Aguirre, L.; Silvan, J.M.; Duenas, M.; De Luis, D.A.; Lasa, A. In vitro approach for evaluation of carob by-products as source bioactive ingredients with potential to attenuate metabolic syndrome (MetS). Heliyon 2019, 5, e01175. [Google Scholar] [CrossRef] [PubMed] [Green Version]
- Kammerer, D.; Claus, A.; Carle, R.; Schieber, A. Polyphenol screening of pomace from red and white grape varieties (Vitis vinifera L.) by HPLC-DAD-MS/MS. J. Agric. Food Chem. 2004, 52, 4360–4367. [Google Scholar] [CrossRef] [PubMed]
- Beelders, T.; de Beer, D.; Stander, M.A.; Joubert, E. Comprehensive phenolic profiling of Cyclopia genistoides (L.) Vent. by LC-DAD-MS and -MS/MS reveals novel xanthone and benzophenone constituents. Molecules 2014, 19, 11760–11790. [Google Scholar] [CrossRef] [PubMed]
- Lee, J.H.; Johnson, J.V.; Talcott, S.T. Identification of ellagic acid conjugates and other polyphenolics in muscadine grapes by HPLC-ESI-MS. J. Agric. Food Chem. 2005, 53, 6003–6010. [Google Scholar] [CrossRef] [PubMed]
- Oki, T.; Saki, N.; Masaru, Y.; Yoichi, N.; Ikuo, S. Contribution of β-carotene to radical scavenging capacity varies among orange-fleshed sweet potato cultivars. Food Sci. Technol. Res. 2006, 12, 156–160. [Google Scholar] [CrossRef]
- Sandhu, A.K.; Gu, L. Antioxidant capacity, phenolic content, and profiling of phenolic compounds in the seeds, skin, and pulp of Vitis rotundifolia (Muscadine Grapes) As determined by HPLC-DAD-ESI-MS(n). J. Agric. Food Chem. 2010, 58, 4681–4692. [Google Scholar] [CrossRef] [PubMed]
- Haffner, S.M.; Stern, M.P.; Hazuda, H.P.; Pugh, J.A.; Patterson, J.K. Hyperinsulinemia in a population at high risk for non-insulin-dependent diabetes mellitus. N. Engl. J. Med. 1986, 315, 220–224. [Google Scholar] [CrossRef]
- Amor, S.; Gonzalez-Hedstrom, D.; Martin-Carro, B.; Inarejos-Garcia, A.M.; Almodovar, P.; Prodanov, M.; Garcia-Villalon, A.L.; Granado, M. Beneficial effects of an aged black garlic extract in the metabolic and vascular alterations induced by a high fat/sucrose diet in male rats. Nutrients 2019, 11, 153. [Google Scholar] [CrossRef] [Green Version]
- Granado, M.; Amor, S.; Fernandez, N.; Carreno-Tarragona, G.; Iglesias-Cruz, M.C.; Martin-Carro, B.; Monge, L.; Garcia-Villalon, A.L. Effects of early overnutrition on the renal response to Ang II and expression of RAAS components in rat renal tissue. Nutr. Metab. Cardiovasc. Dis. 2017, 27, 930–937. [Google Scholar] [CrossRef]
- Gonzalez-Hedstrom, D.; Guerra-Menendez, L.; Tejera-Munoz, A.; Amor, S.; de la Fuente-Fernandez, M.; Martin-Carro, B.; Arriazu, R.; Garcia-Villalon, A.L.L.; Granado, M. Overfeeding during lactation in rats is associated with cardiovascular insulin resistance in the short-term. Nutrients 2020, 12, 549. [Google Scholar] [CrossRef] [Green Version]
- Chomczynski, P. A reagent for the single-step simultaneous isolation of RNA, DNA and proteins from cell and tissue samples. Biotechniques 1993, 15, 532–534, 536–537. [Google Scholar] [PubMed]
- Livak, K.J.; Schmittgen, T.D. Analysis of relative gene expression data using real-time quantitative PCR and the 2(-Delta Delta C(T)) Method. Methods 2001, 25, 402–408. [Google Scholar] [CrossRef]
- Kim, D.H.; Kim, M.J.; Kim, D.W.; Kim, G.Y.; Kim, J.K.; Gebru, Y.A.; Choi, H.S.; Kim, Y.H.; Kim, M.K. Changes of phytochemical components (urushiols, polyphenols, gallotannins) and antioxidant capacity during Fomitella fraxinea(-)Mediated fermentation of toxicodendron vernicifluum bark. Molecules 2019, 24, 683. [Google Scholar] [CrossRef] [Green Version]
- Limpisophon, K.; Schleining, G. Use of gallic acid to enhance the antioxidant and mechanical properties of active fish gelatin film. J. Food Sci. 2017, 82, 80–89. [Google Scholar] [CrossRef] [PubMed]
- Rico, D.; Martin-Diana, A.B.; Lasa, A.; Aguirre, L.; Milton-Laskibar, I.; de Luis, D.A.; Miranda, J. Effect of wakame and carob pod snacks on non-alcoholic fatty liver disease. Nutrients 2019, 11, 86. [Google Scholar] [CrossRef] [PubMed] [Green Version]
- Banuls, C.; Rovira-Llopis, S.; Falcon, R.; Veses, S.; Monzo, N.; Victor, V.M.; Rocha, M.; Hernandez-Mijares, A. Chronic consumption of an inositol-enriched carob extract improves postprandial glycaemia and insulin sensitivity in healthy subjects: A randomized controlled trial. Clin. Nutr. 2016, 35, 600–607. [Google Scholar] [CrossRef] [PubMed]
- Gruendel, S.; Otto, B.; Garcia, A.L.; Wagner, K.; Mueller, C.; Weickert, M.O.; Heldwein, W.; Koebnick, C. Carob pulp preparation rich in insoluble dietary fibre and polyphenols increases plasma glucose and serum insulin responses in combination with a glucose load in humans. Br. J. Nutr. 2007, 98, 101–105. [Google Scholar] [CrossRef]
- Stavrou, I.J.; Christou, A.; Kapnissi-Christodoulou, C.P. Polyphenols in carobs: A review on their composition, antioxidant capacity and cytotoxic effects, and health impact. Food Chem. 2018, 269, 355–374. [Google Scholar] [CrossRef]
- Zunft, H.J.; Luder, W.; Harde, A.; Haber, B.; Graubaum, H.J.; Gruenwald, J. Carob pulp preparation for treatment of hypercholesterolemia. Adv. Ther. 2001, 18, 230–236. [Google Scholar] [CrossRef]
- Macho-Gonzalez, A.; Garcimartin, A.; Naes, F.; Lopez-Oliva, M.E.; Amores-Arrojo, A.; Gonzalez-Munoz, M.J.; Bastida, S.; Benedi, J.; Sanchez-Muniz, F.J. Effects of fiber purified extract of carob fruit on fat digestion and postprandial lipemia in healthy rats. J. Agric. Food Chem. 2018, 66, 6734–6741. [Google Scholar] [CrossRef]
- Valero-Munoz, M.; Ballesteros, S.; Ruiz-Roso, B.; Perez-Olleros, L.; Martin-Fernandez, B.; Lahera, V.; de Las Heras, N. Supplementation with an insoluble fiber obtained from carob pod (Ceratonia siliqua L.) rich in polyphenols prevents dyslipidemia in rabbits through SIRT1/PGC-1alpha pathway. Eur. J. Nutr. 2019, 58, 357–366. [Google Scholar] [CrossRef] [PubMed]
- Gruendel, S.; Garcia, A.L.; Otto, B.; Mueller, C.; Steiniger, J.; Weickert, M.O.; Speth, M.; Katz, N.; Koebnick, C. Carob pulp preparation rich in insoluble dietary fiber and polyphenols enhances lipid oxidation and lowers postprandial acylated ghrelin in humans. J. Nutr. 2006, 136, 1533–1538. [Google Scholar] [CrossRef] [PubMed] [Green Version]
- Chinen, I.; Shimabukuro, M.; Yamakawa, K.; Higa, N.; Matsuzaki, T.; Noguchi, K.; Ueda, S.; Sakanashi, M.; Takasu, N. Vascular lipotoxicity: Endothelial dysfunction via fatty-acid-induced reactive oxygen species overproduction in obese Zucker diabetic fatty rats. Endocrinology 2007, 148, 160–165. [Google Scholar] [CrossRef] [PubMed]
- Paneni, F.; Beckman, J.A.; Creager, M.A.; Cosentino, F. Diabetes and vascular disease: Pathophysiology, clinical consequences, and medical therapy: Part I. Eur. Heart J. 2013, 34, 2436–2443. [Google Scholar] [CrossRef] [PubMed]
- Steven, S.; Dib, M.; Hausding, M.; Kashani, F.; Oelze, M.; Kroller-Schon, S.; Hanf, A.; Daub, S.; Roohani, S.; Gramlich, Y.; et al. CD40L controls obesity-associated vascular inflammation, oxidative stress, and endothelial dysfunction in high fat diet-treated and db/db mice. Cardiovasc. Res. 2018, 114, 312–323. [Google Scholar] [CrossRef] [PubMed] [Green Version]
- Miller, A.W.; Tulbert, C.; Puskar, M.; Busija, D.W. Enhanced endothelin activity prevents vasodilation to insulin in insulin resistance. Hypertension 2002, 40, 78–82. [Google Scholar] [CrossRef] [Green Version]


| TR (min) | Molecule | UV-VIS (nm) | [M–H]− (m/z) | Fragment Ions (m/z) |
|---|---|---|---|---|
| 4.2 | Gallic acid | 229/274 | 169.0 | 125.1 |
| 4.5 | Monogalloyl | 227/278 | 331.0 | 169.1 |
| hexoside | ||||
| 4.8 | Monogalloyl | 226/278 | 331.0 | 168.9 |
| hexoside | ||||
| 5.3 | Trigalloyl hexoside | 226/276 | 635.0 | 483.0, 331.0, 313.0, |
| 271.0, 211.0, 169.1 | ||||
| 8.0 | Digalloyl hexoside | 227/275 | 483.0 | 331.0, 313.0, 169.0 |
| 9.5 | Digalloyl hexoside | 226/275 | 483.0 | 443.0, 331.0, 313.0, |
| 210.9, 169.0, 124.1 | ||||
| 10.7 | Digalloyl hexoside | 226/277 | 483.0 | 331.0, 313.0, 169.0 |
| 11.5 | Digalloyl hexoside | 228/280 | 483.0 | 331.1 |
| 13.1 | Trigalloyl hexoside | 224/273 | 635.0 | 483.0, 464.7, 331.0, |
| 312.9, 271.0, 210.9, | ||||
| 168.9 | ||||
| 15.1 | Trigalloyl hexoside + | 267 | 635.0 | 483.0, 331.0, 312.9, |
| unknown | 443.0 | 270.8, 210.9, 168.9 | ||
| 15.8 | Trigalloyl hexoside | 280 | 634.8 | 482.9, 331.0, 313.0, |
| 271.0, 241.1, 211.1, | ||||
| 168.9 | ||||
| 18.2 | Trigalloyl hexoside | 224/272 | 635.0 | 483.0, 464.9, 331.0, |
| 313.0, 271.0, 241.1, | ||||
| 211.1, 168.9 | ||||
| 19.6 | Trigalloyl hexoside | 224/272 | 635.8 | 483.0, 464.9, 422.9, |
| 331.0, 313.0, 270.9, | ||||
| 241.0, 210.9, 193.1, | ||||
| 168.9 | ||||
| 21.0 | Trigalloyl hexoside | 224/272 | 635.1 | 483.0, 464.9, 422.9, |
| 331.0, 313.0, 271.0, | ||||
| 240.8, 210.9, 193.1, | ||||
| 168.9 | ||||
| 21.6 | Trigalloyl hexoside | 224/278 | 634.9 | 483.1, 465.0, 421.0, |
| 331.0, 313.0, 271.0 | ||||
| 22.3 | Tetragalloyl | 223/272 | 786.9 | 635.0, 483.0, 330.8, |
| hexoside | 313.0, 271.0, 211.0, | |||
| 168.9 | ||||
| 23.8 | Trigalloyl hexoside | 223/272 | 634.5 | 483.1, 465.0, 443.0, |
| 313.0, 168.9 | ||||
| 24.9 | Tetragalloyl | 225/275 | 787.1 | 635.0, 483.1, 465.8, |
| hexoside | 443.0, 423.0, 313.0, | |||
| 271.1, 168.9, 151.1 | ||||
| 27.0 | Tetragalloyl | 224/278 | 786.9 | 635.0, 483.0, 465.8, |
| hexoside | 449.0, 313.0, 271.0, | |||
| 210.7, 168.9, 121.1 | ||||
| 28.2 | Trigalloyl hexoside | 226/285 | 635.0 | 483.1, 465.8, 449.0, |
| 401.1, 313.0, 271.0, | ||||
| 210.7 | ||||
| 29.9 | Trialloyl hexoside | 225/276 | 634.9 | 482.8, 465.0, 313.0 |
| 31.1 | Tetragalloyl | 223/271 | 787.0 | 635.0, 482.9, 464.9, |
| hexoside | 168.9 | |||
| 32.3 | Tetragalloyl | 223/274 | 787.0 | 635.0, 482.9, 464.9, |
| hexoside | 168.9 | |||
| 35.2 | Tetragalloyl | 223/270 | 786.8 | 635.0, 465.8, 403.0, |
| hexoside | 124.1 | |||
| 37.2 | Tetragalloyl | 263/278/370 | 786.9 | 635.0, 464.9, 317.0 |
| hexoside + Myricetin | 479.0 | |||
| hexoside | ||||
| 40.0 | Tetragalloyl | 223/278 | 786.9 | 635.0, 401.0, 313.0, |
| hexoside | 210.9, 169.0 | |||
| 45.1 | Tetragalloyl | 225/276 | 787.0 | 635.0, 617.0, 465.8 |
| hexoside | ||||
| 47.3 | Tetragalloyl | 223/281/393sh | 786.9 | 635.0, 616.9, 462.8, |
| hexoside | 271.0, 124.8 | |||
| 49.5 | Tetragalloyl | 223/277/355 | 787.0 | 617.0, 464.9, 271.0, |
| hexoside + Myricetin | 168.8, | |||
| deoxy-hexoside (1) | 463.0 | 271.0, 316.0 | ||
| 51.3 | Myricetin deoxy- | 260/300sh/348 | 463.0 | 316.9, 315.9, 287.0, |
| hexoside (2) | 271.0 | |||
| 52.1 | Ellagic acid hexoside | 250/369 | 463.0 | 301.0, 229.0, 201.1, |
| 169.1 | ||||
| 54.2 | Quercetin hexoside | 253/298sh/352 | 462.9 | 300.9, 270.8, 254.9, |
| 151.1 | ||||
| 56.5 | Naringin | 225/281/335 | 579.0 | 459.1, 271.0 |
| 58.6 | Isohesperetin | 229/281/328 | 579.0 | 459.1, 2710 |
| (Narirutin) | ||||
| 59.8 | Quercetin deoxy- | 226/253/261sh/3 | 447.0 | 300.0, 301.0, 271.0, |
| hexoside | 48 | 255.0 | ||
| 62.2 | Hesperetin | 226/283/331 | 609.1 | 461.1, 446.9, 300.9 |
| rutinoside | ||||
| 71.0 | Kaempferol | 221/251/263sh/3 | 593.1 | 285.0 |
| rutinoside | 45 | |||
| 72.7 | Methylquercetin | 220/253/294sh/3 | 314.9 | 299.9, 271.0 |
| 54 |
| Chow | HFHS | HFHS + CSAT+® | |
|---|---|---|---|
| Body weight (g) | 29.7 ± 0.54 | 46.4 ± 1.6 *** | 48.7 ± 1.3 *** |
| Food intake (g/mouse/day) | 3.8 ± 0.03 | 2.8 ± 0.02 *** | 2.9 ± 0.03 *** |
| Visceral Retroperitoneal adipose tissue | 372 ± 35.3 | 1556 ± 67.3 *** | 1414 ± 79.2 *** |
| (mg/cm) | |||
| Subcutaneous lumbar adipose tissue (mg/cm) | 125.6 ± 8.5 | 945 ± 76.3 *** | 873 ± 93.2 *** |
| Interescapular Brown adipose tissue (mg/cm) | 67.2 ± 5.5 | 122 ± 13.7 *** | 174 ± 11.8 *** ## |
| Heart (mg/cm) | 107.6 ± 4.4 | 130 ± 4.6 ** | 113 ± 4.1 # |
| Kidneys (mg/cm) | 205.9 ± 4.9 | 257 ± 12.4 ** | 234 ± 9.1 |
| Adrenal glands (mg/cm) | 1.3 ± 0.1 | 1.80 ± 0.15 * | 1.75 ± 0.11 * |
| Spleen (mg/cm) | 39.9 ± 2.6 | 51.4 ± 4.5 ** | 48.7 ± 2.7 ** |
| Liver (mg/cm) | 620 ± 20.5 | 896 ± 62.3 * | 931 ± 74.6 ** |
| Gastrocnemious (mg/cm) | 78.5 ± 2.6 | 83.2 ± 2.5 | 80.3 ± 2.4 |
| Soleus (mg/cm) | 4.9 ± 0.2 | 7.3 ± 0.6 ** | 5.7 ± 0.3 # |
| Chow | HFHS | HFHS + CSAT+® | |
|---|---|---|---|
| Adiponectin (ng/mL) | 4771 ± 598 | 3084 ± 443.8 * | 5805 ± 828 # |
| Leptin (ng/mL) | 1.06 ± 0.3 | 22.5 ± 2.8 *** | 26.5 ± 1.9 *** |
| Total lipids (mg/dL) | 3752 ± 150 | 5011 ± 274 *** | 5284 ± 198 *** |
| Triglycerides (mg/dL) | 68.9 ± 4.3 | 124 ± 9.1 *** | 105 ± 4.8 *** |
| Total cholesterol (mg/dL) | 175 ± 9.8 | 390 ± 11.6 *** | 339 ± 18.6 *** # |
| LDL-c (mg/dL) | 76.1 ± 6.7 | 189.8 ± 9.9 *** | 144 ± 12.9 *** # |
| HDL-c (mg/dL) | 73.8 ± 10.4 | 197.7 ± 26.8 *** | 181 ± 23.2 ** |
| IL-6 (pg/mL) | 39.1 ± 4.3 | 61.7 ± 4.6 * | 46.1 ± 2.8 # |
© 2020 by the authors. Licensee MDPI, Basel, Switzerland. This article is an open access article distributed under the terms and conditions of the Creative Commons Attribution (CC BY) license (http://creativecommons.org/licenses/by/4.0/).
Share and Cite
de la Fuente-Fernández, M.; González-Hedström, D.; Amor, S.; Tejera-Muñoz, A.; Fernández, N.; Monge, L.; Almodóvar, P.; Andrés-Delgado, L.; Santamaría, L.; Prodanov, M.; et al. Supplementation with a Carob (Ceratonia siliqua L.) Fruit Extract Attenuates the Cardiometabolic Alterations Associated with Metabolic Syndrome in Mice. Antioxidants 2020, 9, 339. https://doi.org/10.3390/antiox9040339
de la Fuente-Fernández M, González-Hedström D, Amor S, Tejera-Muñoz A, Fernández N, Monge L, Almodóvar P, Andrés-Delgado L, Santamaría L, Prodanov M, et al. Supplementation with a Carob (Ceratonia siliqua L.) Fruit Extract Attenuates the Cardiometabolic Alterations Associated with Metabolic Syndrome in Mice. Antioxidants. 2020; 9(4):339. https://doi.org/10.3390/antiox9040339
Chicago/Turabian Stylede la Fuente-Fernández, María, Daniel González-Hedström, Sara Amor, Antonio Tejera-Muñoz, Nuria Fernández, Luis Monge, Paula Almodóvar, Laura Andrés-Delgado, Luis Santamaría, Marin Prodanov, and et al. 2020. "Supplementation with a Carob (Ceratonia siliqua L.) Fruit Extract Attenuates the Cardiometabolic Alterations Associated with Metabolic Syndrome in Mice" Antioxidants 9, no. 4: 339. https://doi.org/10.3390/antiox9040339