Improved Tetanic Force and Mitochondrial Calcium Homeostasis by Astaxanthin Treatment in Mouse Skeletal Muscle

Abstract
: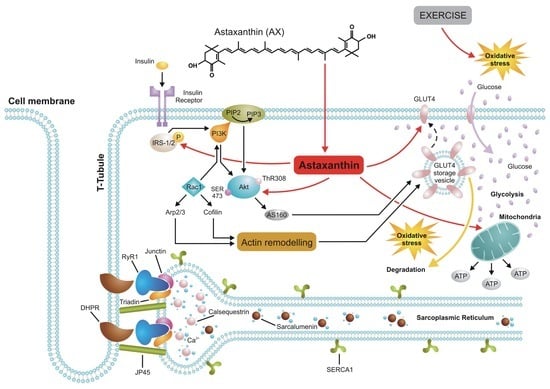
1. Introduction
2. Materials and Methods
2.1. Animal Care
2.2. Astaxanthin (AX) Diet
2.3. In Vivo Experiments
2.3.1. Body Weight Measurement
2.3.2. Forepaw Grip Test
2.4. In Vitro Experiments
2.4.1. Measurement of EDL Muscle Force
2.4.2. Isolation of Single FDB Muscle Fibers
2.4.3. Confocal Microscopy and Image Analysis
2.4.4. Voltage Clamp
2.4.5. Measurement of Mitochondrial Calcium Uptake
2.5. Experimental Solutions
2.6. Statistical Analysis
3. Results
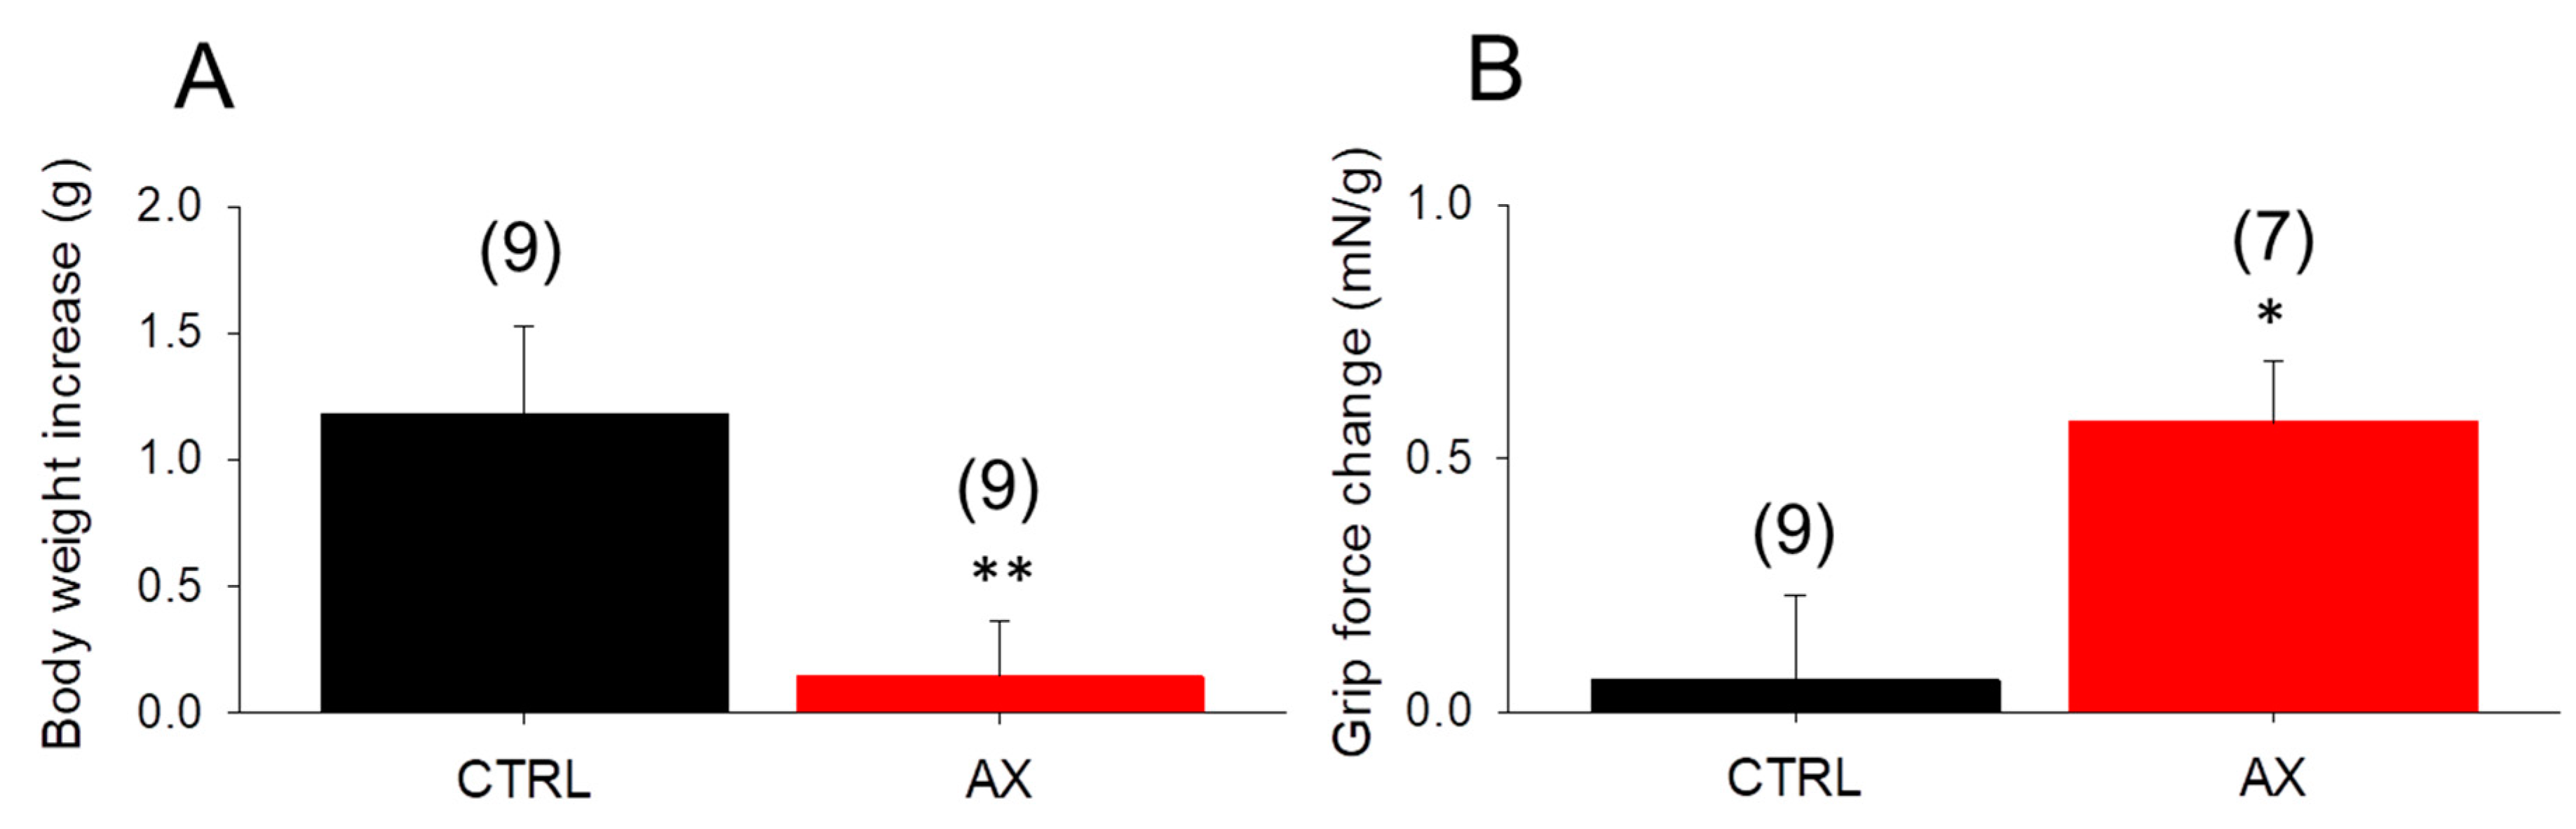
3.1. Body Weight Gain Decreases, Grip Force Increases in AX Mice
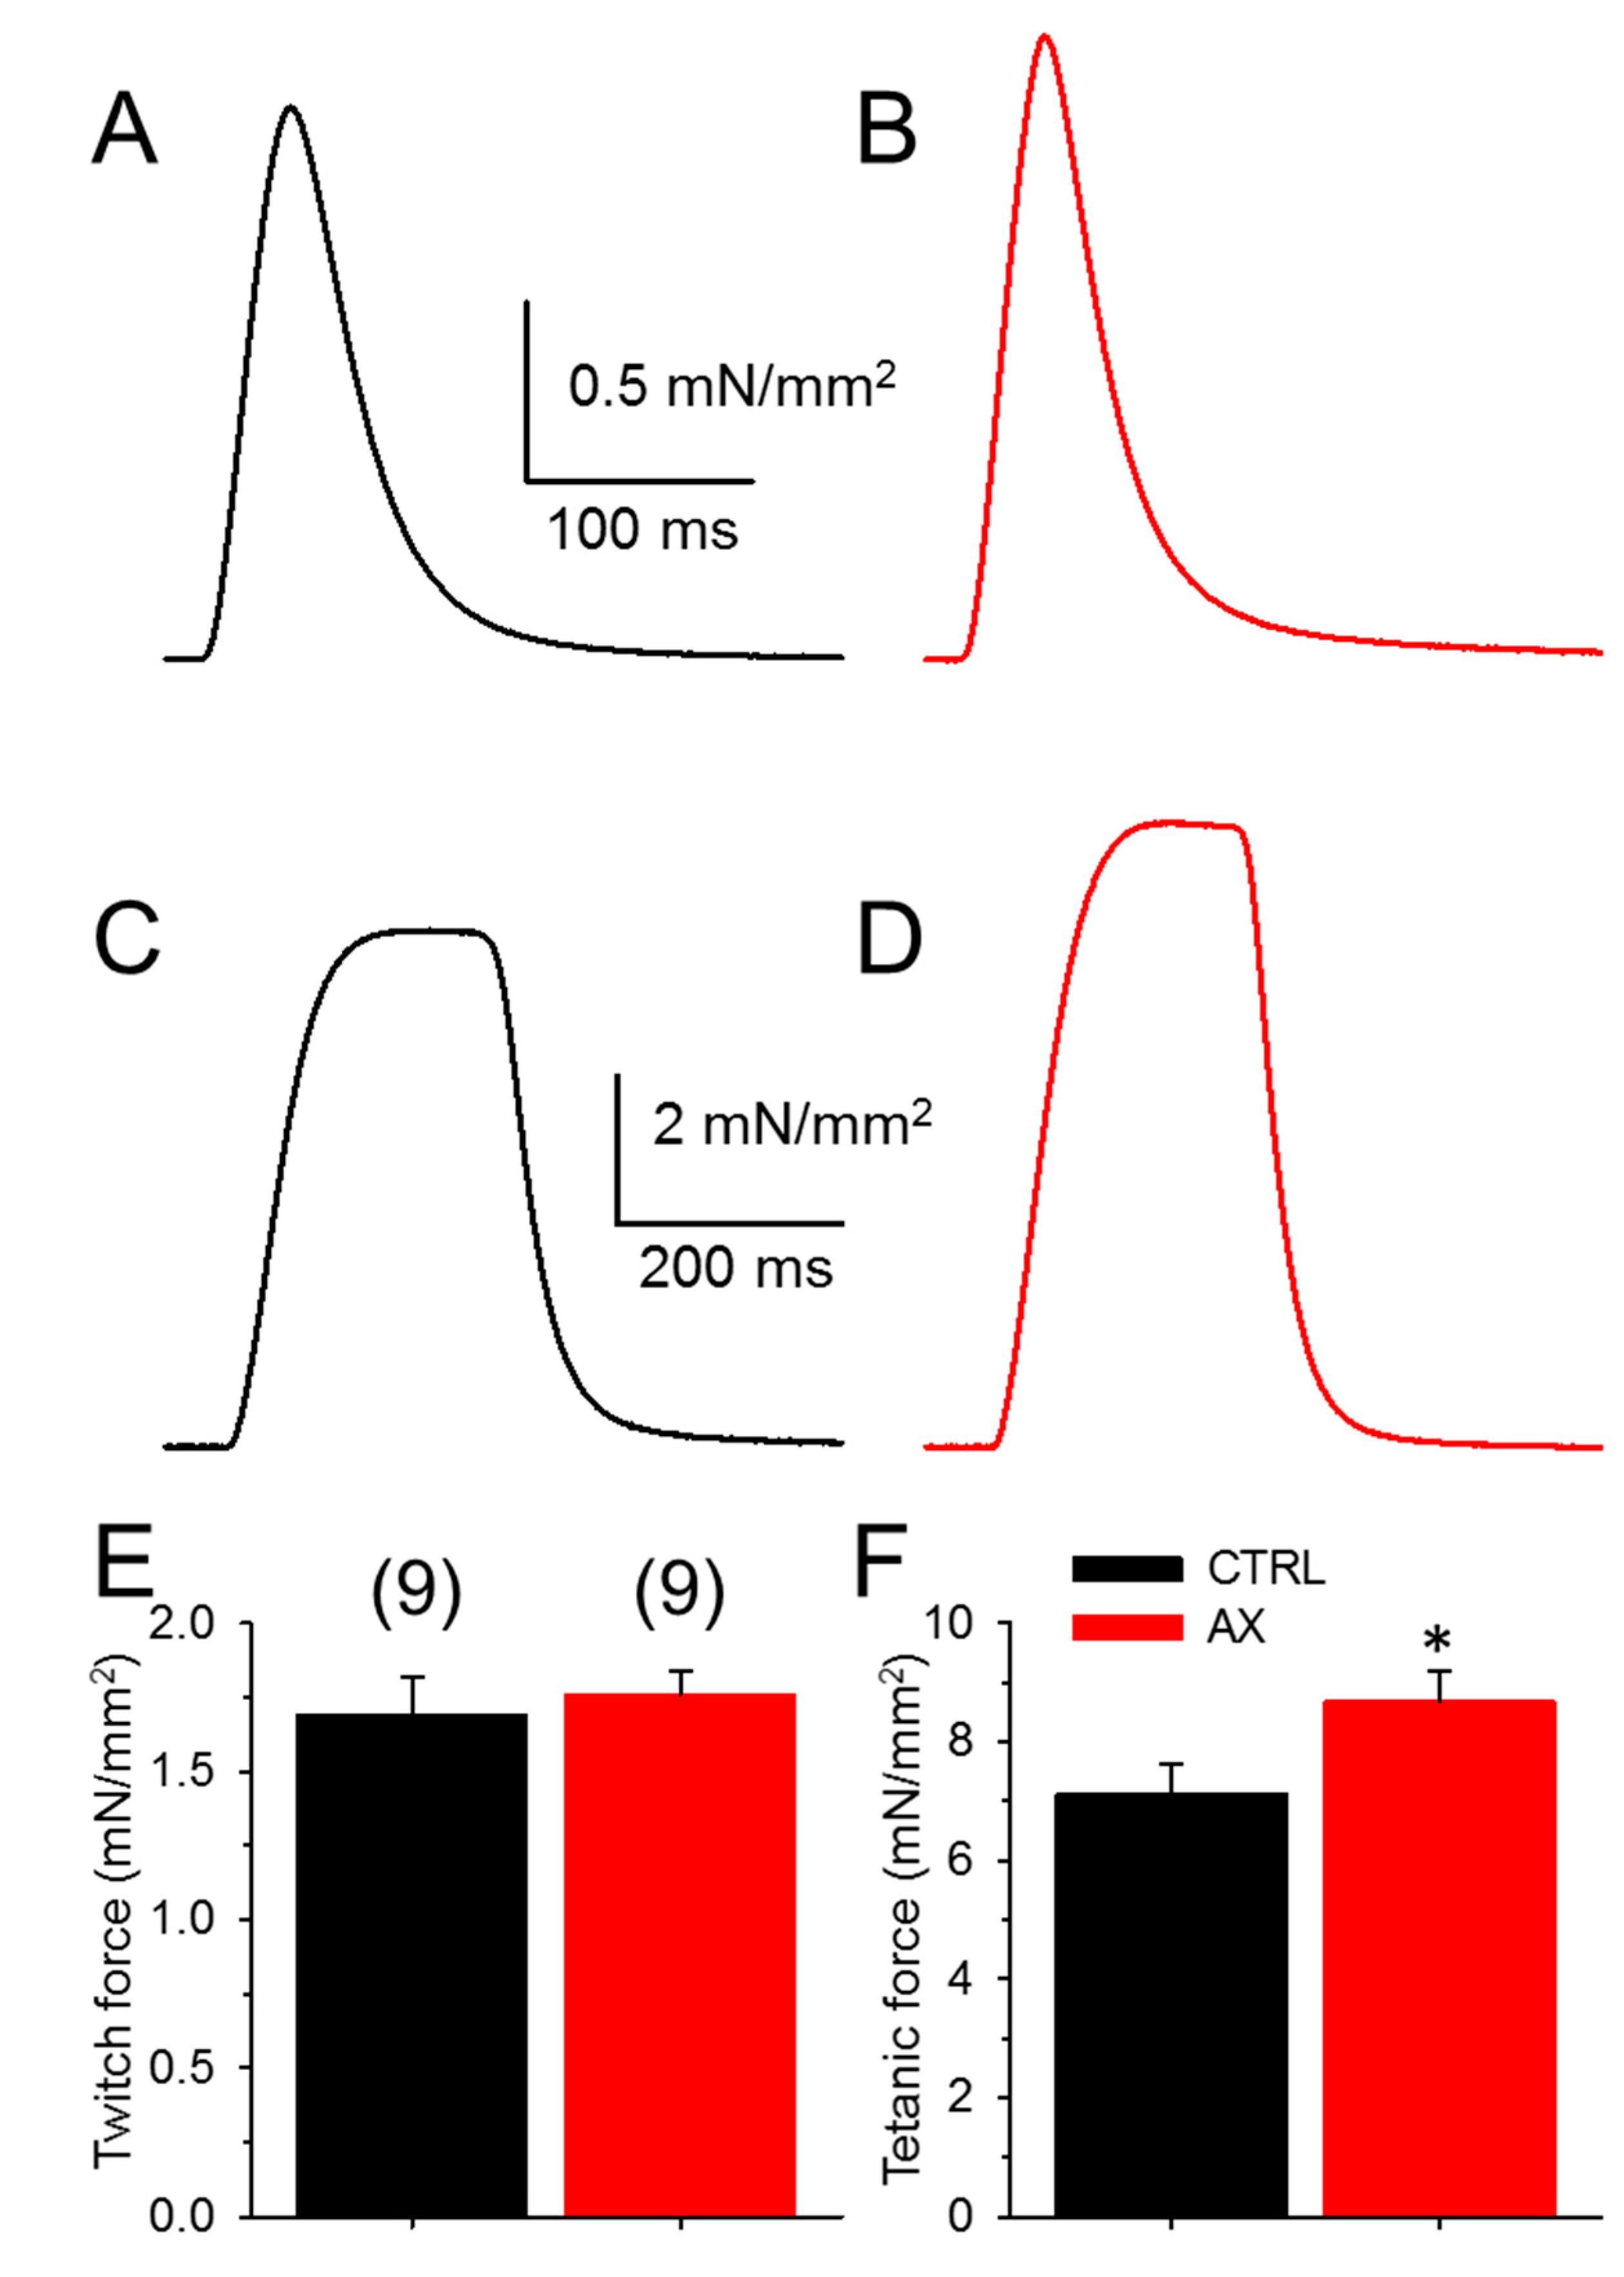
3.2. Tetanic Force Increases in AX Mice
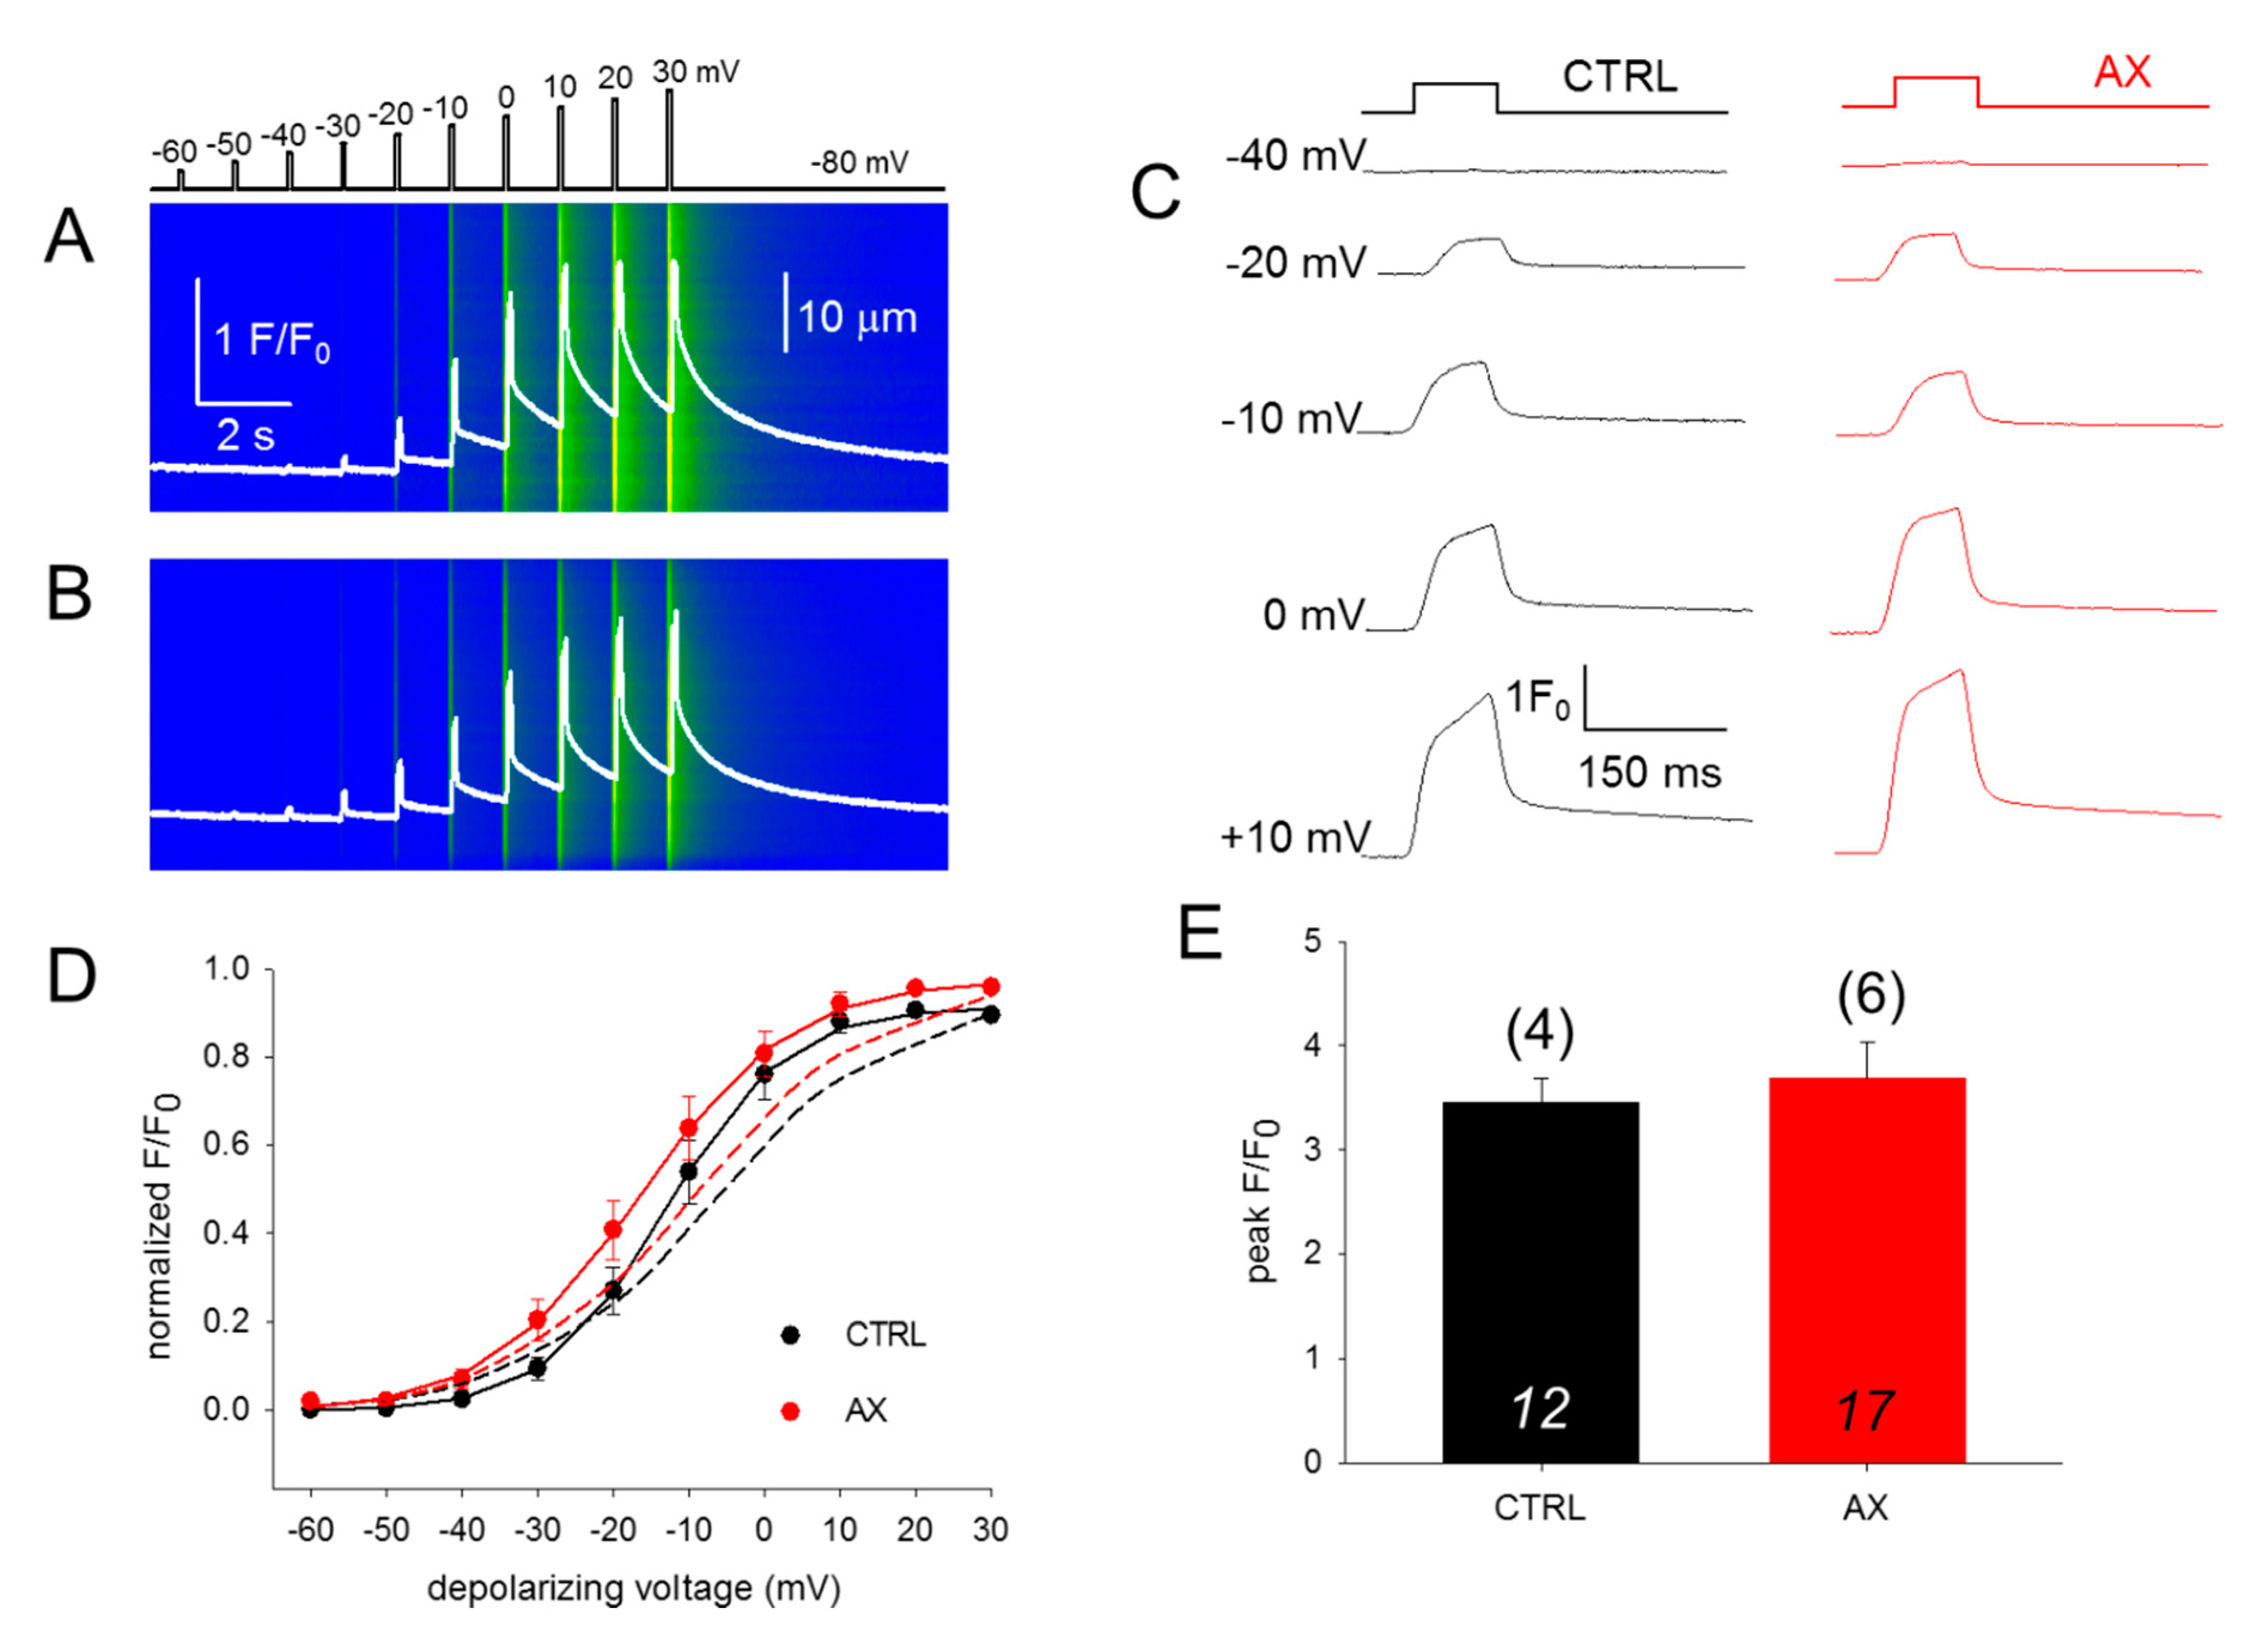
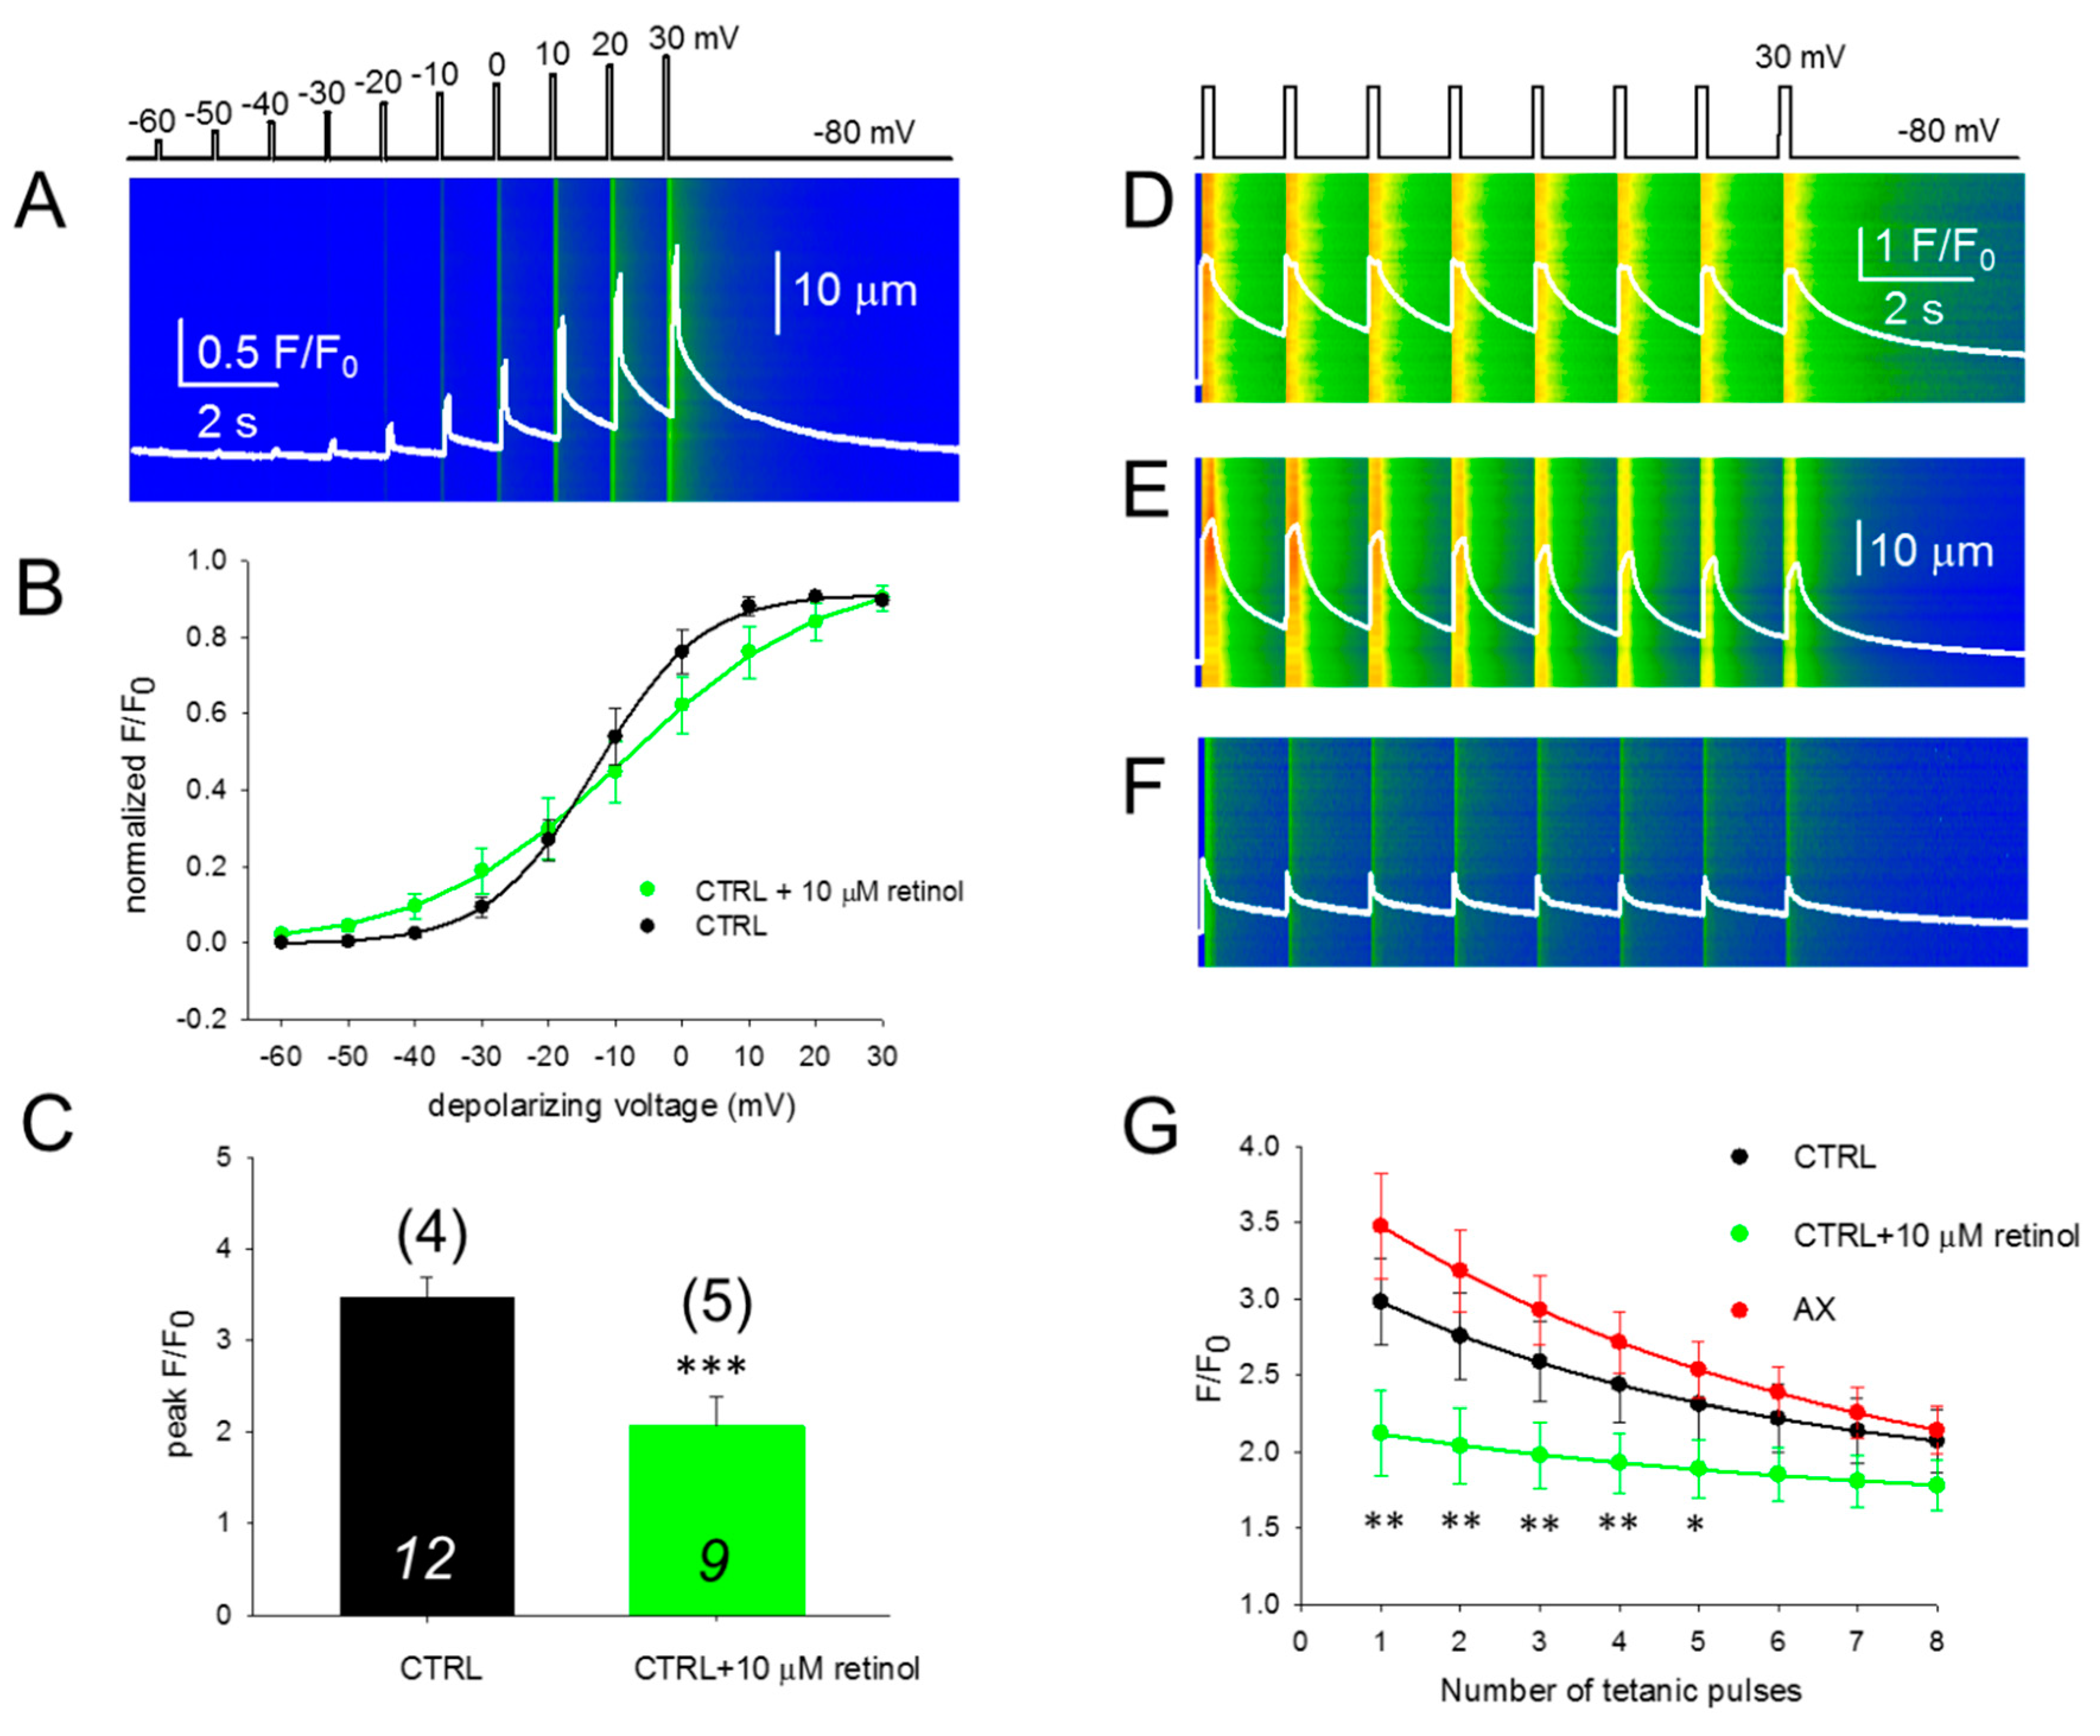
3.3. SR Ca2+ Release and its Voltage-Dependence Remain Unaltered in AX Mice
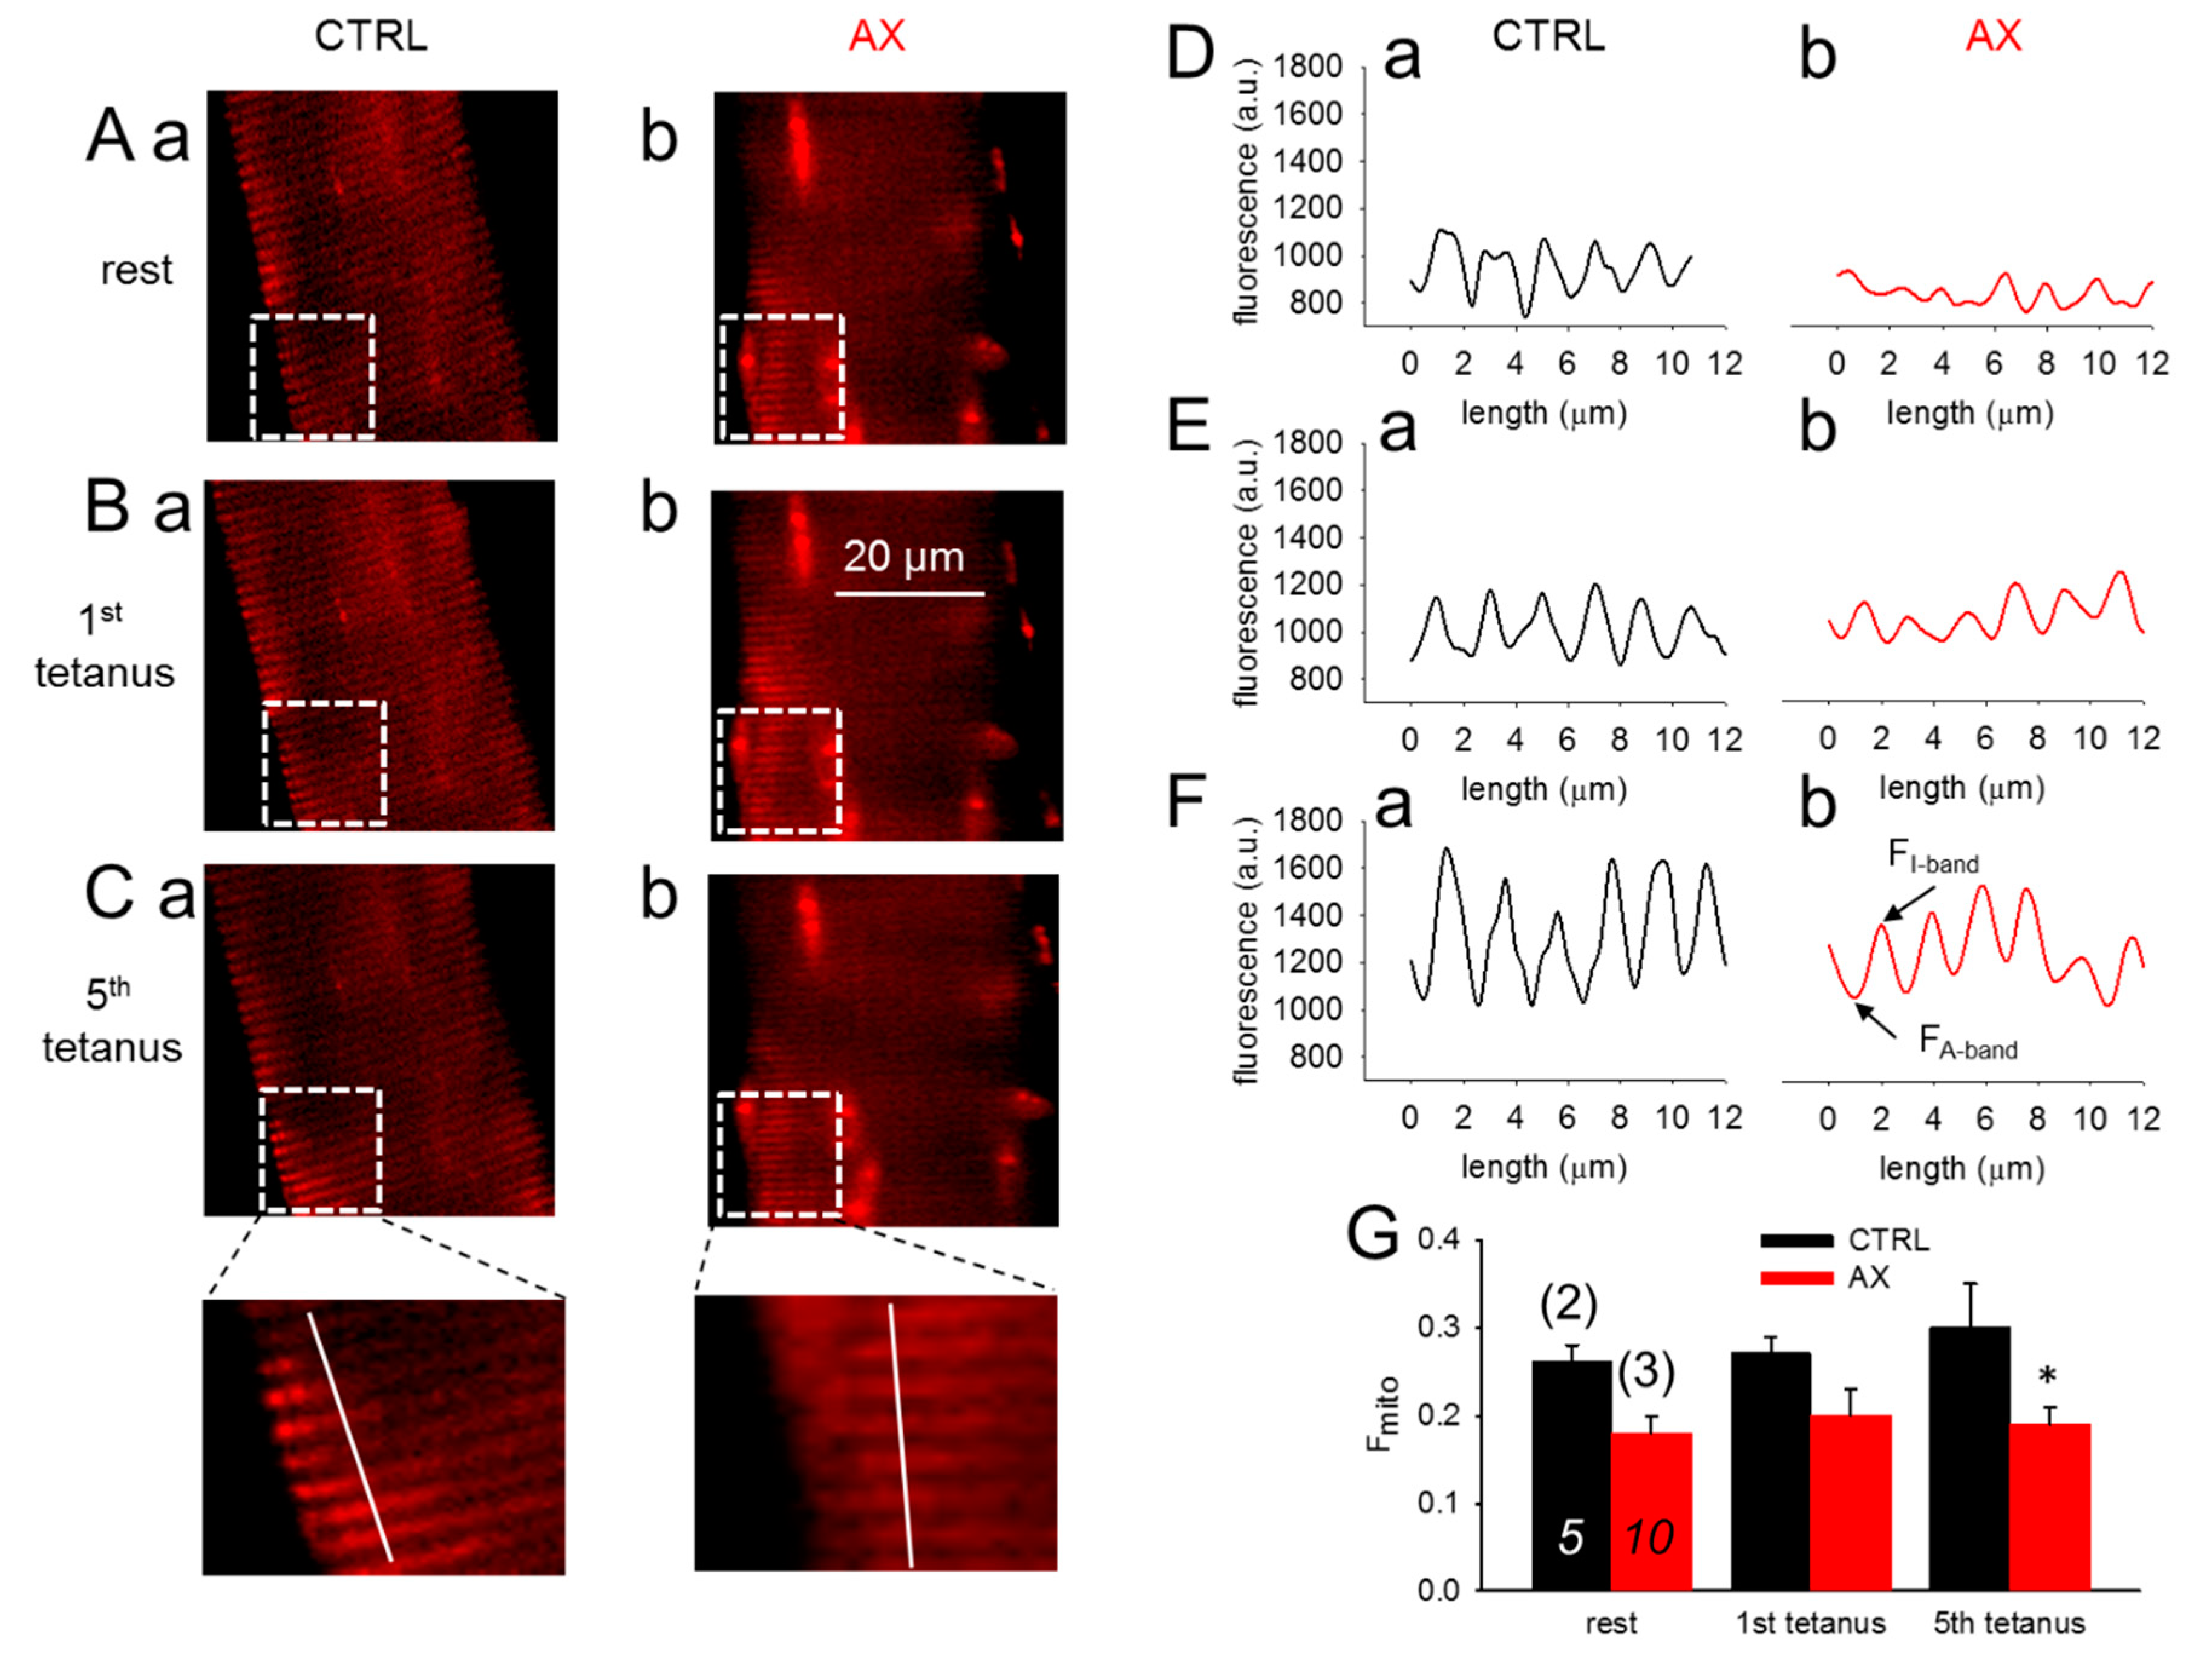
3.4. Mitochondrial Calcium Uptake is Reduced in AX Mice
3.5. SR Ca2+ Release is Compromised in the Presence of Retinol
3.6. Fatigability of Ca2+ Release is Decreased by AX and Increased by Retinol
4. Discussion
4.1. AX and Muscle Force
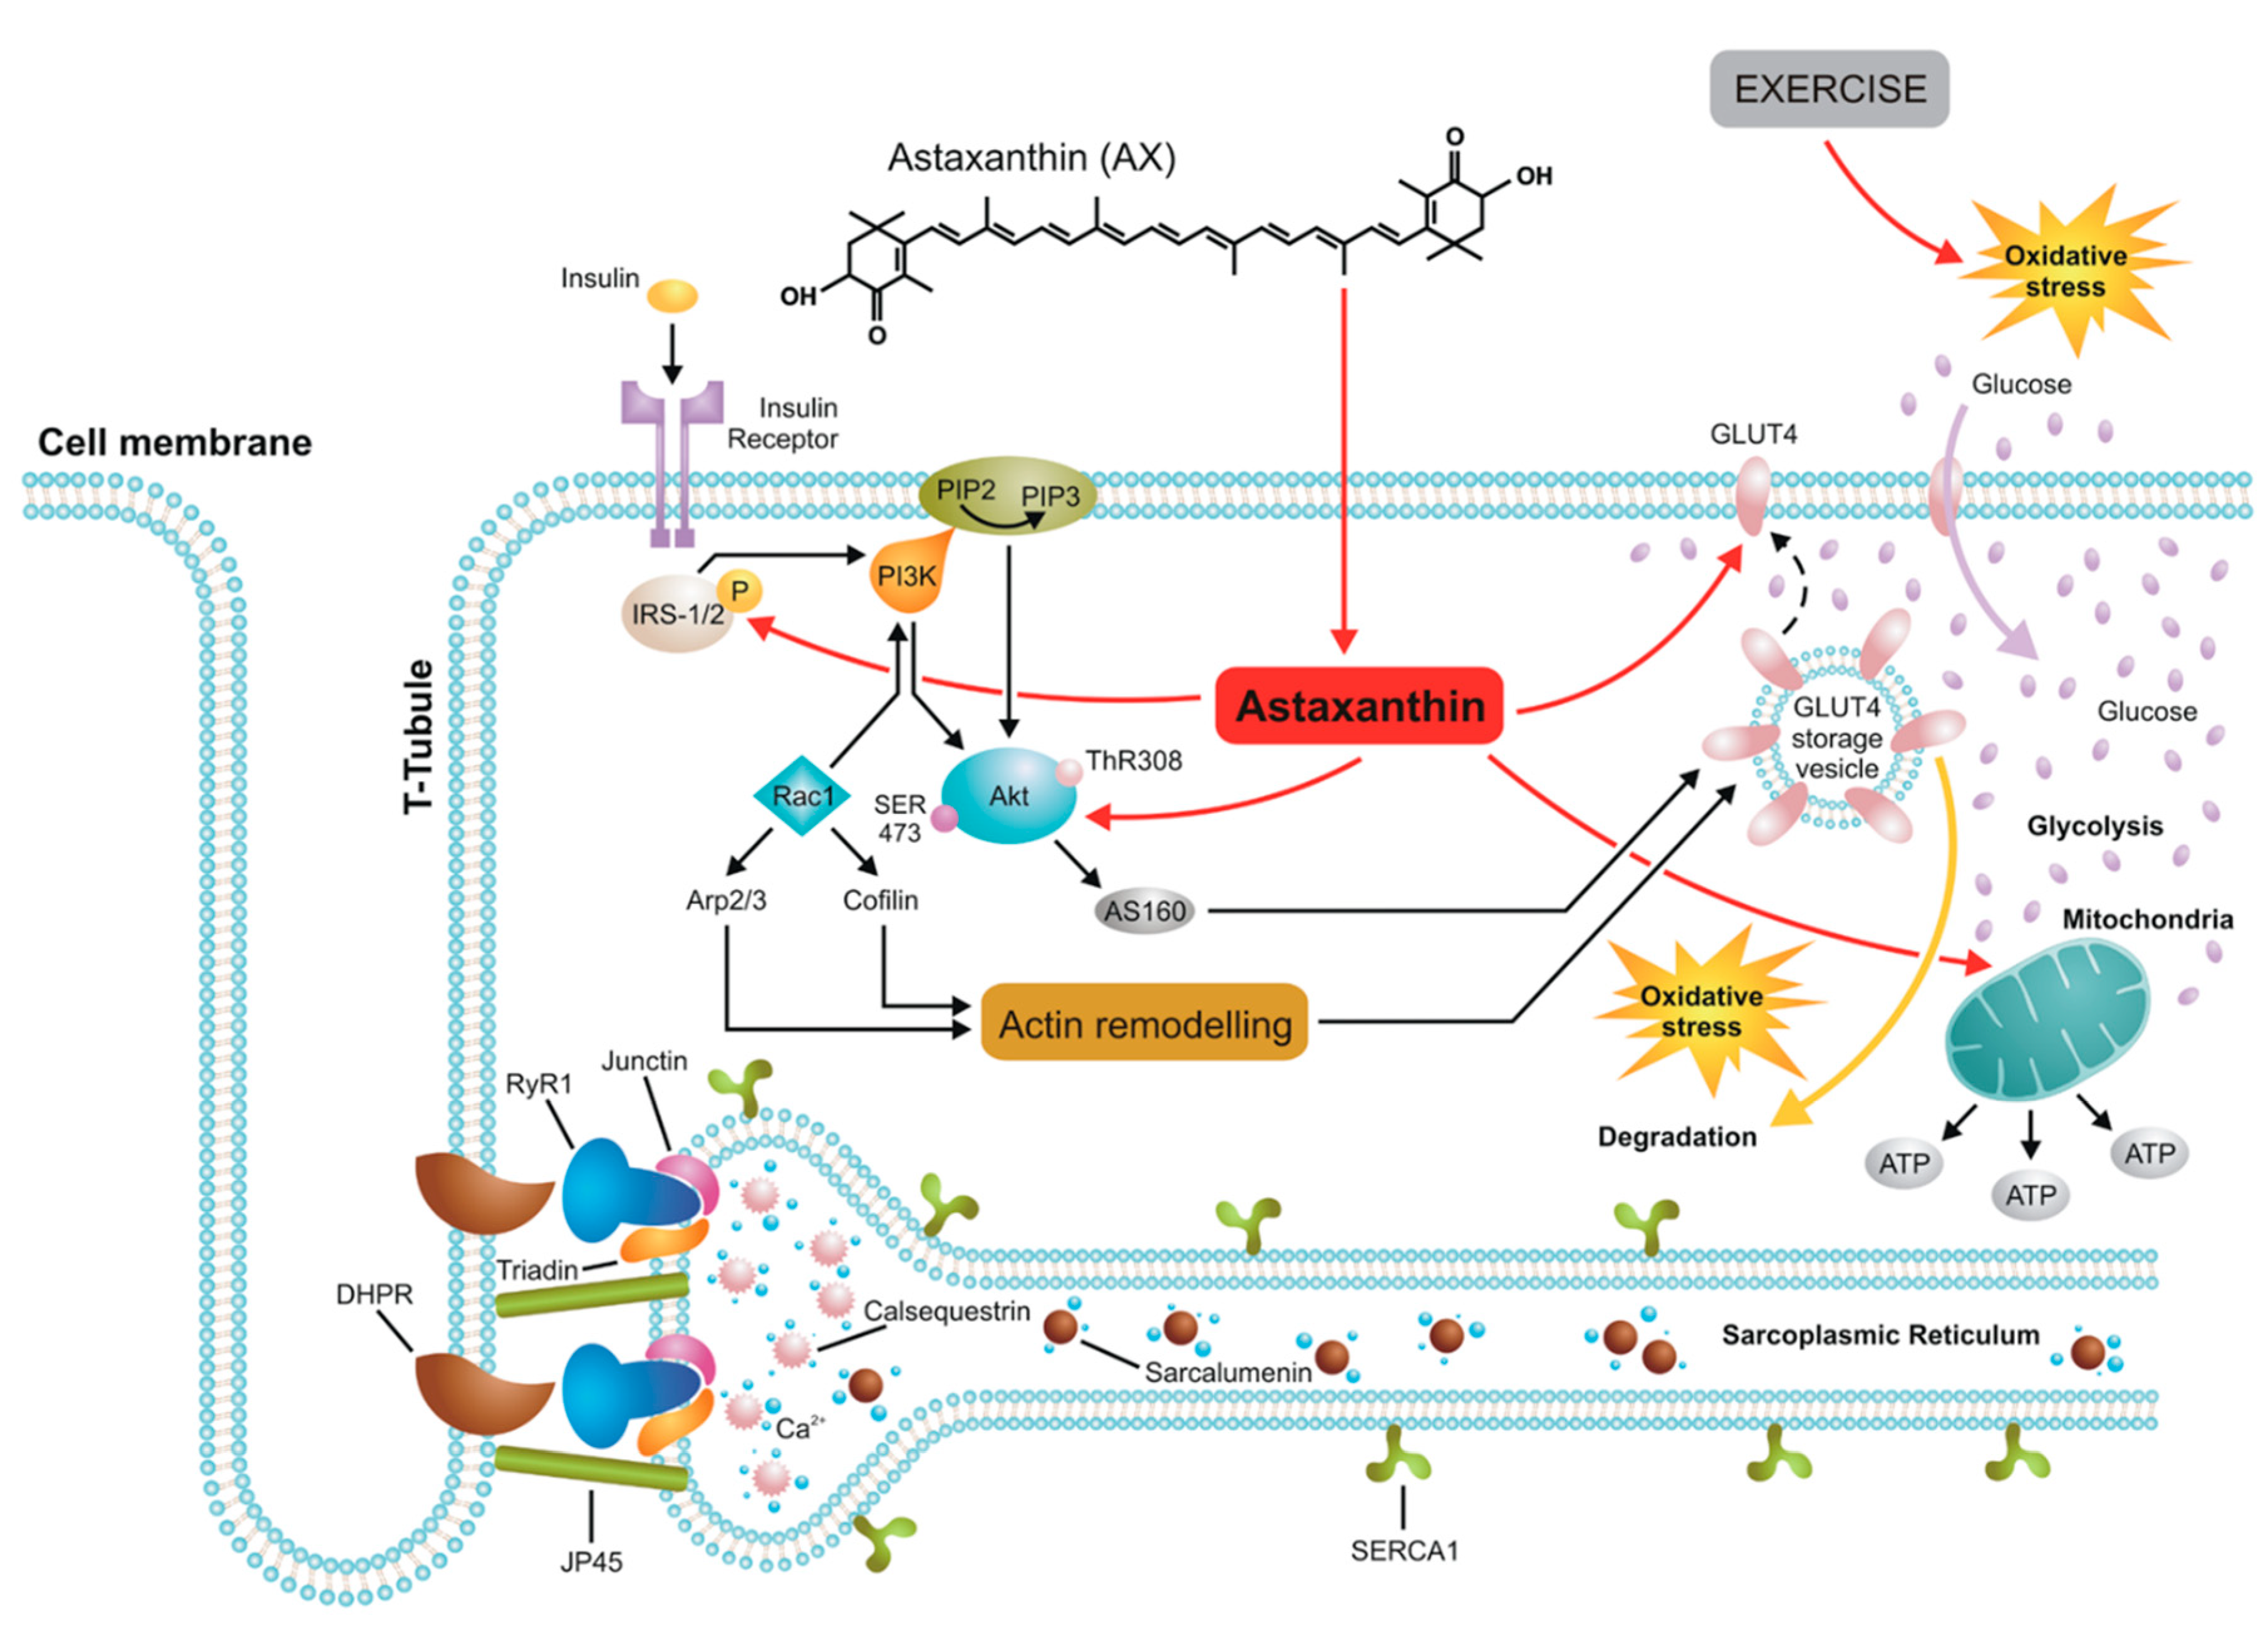
4.2. AX and Mitochondrial Ca2+ Signaling
4.3. AX and Glucose Metabolism
5. Conclusions
Author Contributions
Funding
Acknowledgments
Conflicts of Interest
References
- Urso, M.L.; Clarkson, P.M. Oxidative stress, exercise, and antioxidant supplementation. Toxicology 2003, 189, 41–54. [Google Scholar] [CrossRef]
- Powers, S.K.; Kavazis, A.N.; DeRuisseau, K.C. Mechanisms of disuse muscle atrophy: Role of oxidative stress. Am. J. Physiol. Regul. Integr. Comp. Physiol. 2005, 288, R337–R344. [Google Scholar] [CrossRef] [PubMed] [Green Version]
- Powers, S.K.; Nelson, W.B.; Hudson, M.B. Exercise-induced oxidative stress in humans: Cause and consequences. Free Radic. Biol. Med. 2011, 51, 942–950. [Google Scholar] [CrossRef] [PubMed]
- Powers, S.K.; Jackson, M.J. Exercise-induced oxidative stress: Cellular mechanisms and impact on muscle force production. Physiol. Rev. 2008, 88, 1243–1276. [Google Scholar] [CrossRef] [PubMed] [Green Version]
- Dröge, W. Free radicals in the physiological control of cell function. Physiol. Rev. 2002, 82, 47–95. [Google Scholar] [CrossRef] [PubMed]
- Reid, M.B.; Haack, K.E.; Franchek, K.M.; Valberg, P.A.; Kobzik, L.; West, M.S. Reactive oxygen in skeletal muscle. I. Intracellular oxidant kinetics and fatigue in vitro. J. Appl. Physiol. 1992, 73, 1797–1804. [Google Scholar] [CrossRef] [PubMed]
- O’Neill, C.A.; Stebbins, C.L.; Bonigut, S.; Halliwell, B.; Longhurst, J.C. Production of hydroxyl radicals in contracting skeletal muscle of cats. J. Appl. Physiol. 1996, 81, 1197–1206. [Google Scholar] [CrossRef]
- Aguiló, A.; Tauler, P.; Sureda, A.; Cases, N.; Tur, J.; Pons, A. Antioxidant diet supplementation enhances aerobic performance in amateur sportsmen. J. Sports Sci. 2007, 25, 1203–1210. [Google Scholar] [CrossRef]
- Poulsen, H.E.; Loft, S.; Vistisen, K. Extreme exercise and oxidative DNA modification. J. Sports Sci. 1996, 14, 343–346. [Google Scholar] [CrossRef]
- Alessio, H.M.; Hagerman, A.E.; Fulkerson, B.K.; Ambrose, J.; Rice, R.E.; Wiley, R.L. Generation of reactive oxygen species after exhaustive aerobic and isometric exercise. Med. Sci. Sports Exerc. 2000, 32, 1576–1581. [Google Scholar] [CrossRef]
- Reid, M.B.; Stokicć, D.S.; Koch, S.M.; Khawli, F.A.; Arturo Leis, A. N-acetylcysteine inhibits muscle fatigue in humans. J. Clin. Investig. 1994, 94, 2468–2474. [Google Scholar] [CrossRef] [PubMed]
- Gomez-Cabrera, M.; Domenech, E.; Viña, J. Moderate exercise is an antioxidant: Upregulation of antioxidant genes by training. Free Radic. Biol. Med. 2008, 44, 126–131. [Google Scholar] [CrossRef] [PubMed]
- Sacheck, J.M.; Milbury, P.E.; Cannon, J.G.; Roubenoff, R.; Blumberg, J.B. Effect of vitamin E and eccentric exercise on selected biomarkers of oxidative stress in young and elderly men. Free Radic. Biol. Med. 2003, 34, 1575–1588. [Google Scholar] [CrossRef]
- Venditti, P.; Napolitano, G.; Barone, D.; Di Meo, S. Vitamin E supplementation modifies adaptive responses to training in rat skeletal muscle. Free Radic. Res. 2014, 48, 1179–1189. [Google Scholar] [CrossRef]
- Ristow, M. Unraveling the truth about antioxidants: Mitohormesis explains ROS-induced health benefits. Nat. Med. 2014, 20, 709–711. [Google Scholar] [CrossRef]
- Mastaloudis, A.; Traber, M.G.; Carstensen, K.; Widrick, J.J. Antioxidants did not prevent muscle damage in response to an ultramarathon run. Med. Sci. Sports Exerc. 2006, 38, 72–80. [Google Scholar] [CrossRef]
- Finaud, J.; Lac, G.; Filaire, E. Oxidative stress: Relationship with exercise and training. Sports Med. 2006, 36, 327–358. [Google Scholar] [CrossRef]
- Petiz, L.L.; Girardi, C.S.; Bortolin, R.C.; Kunzler, A.; Gasparotto, J.; Rabelo, T.K.; Matté, C.; Moreira, J.C.; Gelain, D.P. Vitamin A Oral Supplementation Induces Oxidative Stress and Suppresses IL-10 and HSP70 in Skeletal Muscle of Trained Rats. Nutrients 2017, 9, 353. [Google Scholar] [CrossRef] [Green Version]
- Sleeman, M.W.; Wortley, K.E.; Lai, K.-M.V.; Gowen, L.C.; Kintner, J.; Kline, W.O.; Garcia, K.; Stitt, T.N.; Yancopoulos, G.D.; Wiegand, S.J.; et al. Absence of the lipid phosphatase SHIP2 confers resistance to dietary obesity. Nat. Med. 2005, 11, 199–205. [Google Scholar] [CrossRef]
- Ruiz, A.; Dror, E.; Handschin, C.; Furrer, R.; Perez-Schindler, J.; Bachmann, C.; Treves, S.; Zorzato, F. Over-expression of a retinol dehydrogenase (SRP35/DHRS7C) in skeletal muscle activates mTORC2, enhances glucose metabolism and muscle performance. Sci. Rep. 2018, 8, 636. [Google Scholar] [CrossRef] [Green Version]
- Nishida, Y.; Yamashita, E.; Miki, W. Quenching Activities of Common Hydrophilic and Lipophilic Antioxidants against Singlet Oxygen Using Chemiluminescence Detection System. Carotenoid Sci. 2007, 11, 16–20. [Google Scholar]
- Sawaki, K.; Yoshigi, H.; Aoki, K.; Koikawa, N.; Azumane, A.; Kaneko, K.; Yamaguchi, M. Sports Performance benefits from taking Natural Astaxanthin characterized by visual acuity and muscle fatigue improvements in humans. Therap. Med. 2002, 18, 73–88. [Google Scholar]
- Fukamauchi, M. Food functionality of astaxathin-10: Synergistic effects of astaxanthin-10 intake and aerobic exercise. Food Style 21 2007, 11, 1–4. [Google Scholar]
- Wolf, A.M.; Asoh, S.; Hiranuma, H.; Ohsawa, I.; Iio, K.; Satou, A.; Ishikura, M.; Ohta, S. Astaxanthin protects mitochondrial redox state and functional integrity against oxidative stress. J. Nutr. Biochem. 2010, 21, 381–389. [Google Scholar] [CrossRef] [PubMed]
- Rodriguez-Amaya, D.B. Quantitative Analysis, in Vitro Assessment of Bioavailability and Antioxidant Activity of Food Carotenoids—A Review. J. Food Compos. Anal. 2010, 23, 726–740. [Google Scholar] [CrossRef]
- Hussein, G.; Sankawa, U.; Goto, H.; Matsumoto, K.; Watanabe, H. Astaxanthin, a carotenoid with potential in human health and nutrition. J. Nat. Prod. 2006, 69, 443–449. [Google Scholar] [CrossRef]
- Ambati, R.R.; Phang, S.M.; Ravi, S.; Aswathanarayana, R.G. Astaxanthin: Sources, extraction, stability, biological activities and its commercial applications—A review. Mar. Drugs 2014, 12, 128–152. [Google Scholar] [CrossRef]
- Sztretye, M.; Dienes, B.; Gönczi, M.; Czirják, T.; Csernoch, L.; Dux, L.; Szentesi, P.; Keller-Pintér, A. Astaxanthin: A Potential Mitochondrial-Targeted Antioxidant Treatment in Diseases and with Aging. Oxid. Med. Cell. Longev. 2019. [Google Scholar] [CrossRef] [Green Version]
- Zhang, Z.W.; Xu, X.C.; Liu, T.; Yuan, S. Mitochondrion-permeable antioxidants to treat ROS-burst-mediated acute diseases. Oxid. Med. Cell. Longev. 2016, 2016, 6859523. [Google Scholar] [CrossRef] [Green Version]
- Kuroki, T.; Ikeda, S.; Okada, T.; Maoka, T.; Kitamura, A.; Sugimoto, M.; Kume, S. Astaxanthin ameliorates heat stress-induced impairment of blastocyst development in vitro: Astaxanthin colocalization with and action on mitochondria. J. Assist. Reprod. Genet. 2013, 30, 623–631. [Google Scholar] [CrossRef] [Green Version]
- Tanabe, T.; Beam, K.G.; Numa, S. Regions of the skeletal muscle dihydropyridine receptor critical for excitation–contraction coupling. Nature 1990, 346, 567–569. [Google Scholar] [CrossRef] [PubMed]
- MacLennan, D.H. Ca2+ signalling and muscle disease. Eur. J. Biochem. 2000, 267, 5291–5297. [Google Scholar] [CrossRef] [PubMed]
- Hovnanian, A. SERCA pumps and human diseases. Subcell Biochem. 2007, 45, 337–363. [Google Scholar] [CrossRef] [PubMed]
- Rossi, A.E.; Dirksen, R.T. Sarcoplasmic reticulum: The dynamic calcium governor of muscle. Muscle Nerve 2006, 33, 715–731. [Google Scholar] [CrossRef] [PubMed]
- Gunter, T.E.; Buntinas, L.; Sparagna, G.; Eliseev, R.; Gunter, K. Mitochondrial calcium transport: Mechanisms and functions. Cell Calcium 2000, 28, 285–296. [Google Scholar] [CrossRef] [PubMed]
- Gunter, T.E.; Yule, D.I.; Gunter, K.K.; Eliseev, R.I.; Salter, J.D. Calcium and mitochondria. FEBS Lett. 2004, 567, 96–102. [Google Scholar] [CrossRef] [PubMed]
- Lawler, J.M.; Hu, Z.; Barnes, W.S. Effect of reactive oxygen species on K+ contractures in the rat diaphragm. J. Appl. Physiol. 1998, 84, 948–953. [Google Scholar] [CrossRef]
- Dulhunty, A.F.; Zhu, P.H. Do independent processes control the activation and inactivation of potassium contracture tension in rat skeletal muscle? J. Membr. Biol. 1993, 135, 245–252. [Google Scholar] [CrossRef]
- Liu, G.; Abramson, J.J.; Zable, A.C.; Pessah, I.N. Direct evidence for the existence and functional role of hyperreactive sulfhydryls on the ryanodine receptor-triadin complex selectively labelled by the coumarin maleimide 7-diethylamino-3-(4′-maleimidylphenyl)-4-methylcoumarin. Mol. Pharmacol. 1994, 45, 189–200. [Google Scholar]
- Aghdasi, B.; Zhang, J.Z.; Wu, Y.; Reid, M.B.; Hamilton, S.L. Multiple classes of sulfhydryls modulate the skeletal muscle Ca2+ release channel. J. Biol. Chem. 1997, 272, 3739–3748. [Google Scholar] [CrossRef] [Green Version]
- Andersson, B.C.; Betzenhauser, M.J.; Reiken, S.; Meli, A.C.; Umanskaya, A.; Xie, W.; Shiomi, T.; Zalk, R.; Lacampagne, A.; Marks, A.R. Ryanodine Receptor Oxidation Causes Intracellular Calcium Leak and Muscle Weakness in Aging. Cell Metab. 2011, 14, 196–207. [Google Scholar] [CrossRef] [PubMed] [Green Version]
- Aoi, W.; Naito, Y.; Sakuma, K.; Kuchide, M.; Tokuda, H.; Maoka, T.; Toyokuni, S.; Oka, S.; Yasuhara, M.; Yoshikawa, T. Astaxanthin limits exercise-induced skeletal and cardiac muscle damage in mice. Antioxid. Redox Signal. 2003, 5, 139–144. [Google Scholar] [CrossRef] [PubMed]
- Aoi, W.; Maoka, T.; Abe, R.; Fujishita, M.; Tominaga, K. Comparison of the effect of non-esterified and esterified astaxanthins on endurance performance in mice. J. Clin. Biochem. Nutr. 2018, 62, 161–166. [Google Scholar] [CrossRef] [PubMed] [Green Version]
- Visioli, F.; Artaria, C. Astaxanthin in cardiovascular health and disease: Mechanisms of action, therapeutic merits, and knowledge gaps. Food Funct. 2017, 8, 39–63. [Google Scholar] [CrossRef] [PubMed]
- Bodnár, D.; Geyer, N.; Ruzsnavszky, O.; Oláh, T.; Hegyi, B.; Sztretye, M.; Fodor, J.; Dienes, B.; Balogh, Á.; Papp, Z.; et al. Hypermuscular mice with mutation in the myostatin gene display altered calcium signaling. J. Physiol. 2014, 592, 1353–1365. [Google Scholar] [CrossRef] [PubMed] [Green Version]
- Bodnár, D.; Ruzsnavszky, O.; Oláh, T.; Dienes, B.; Balatoni, I.; Ungvári, É.; Benkő, I.; Babka, B.; Prokisch, J.; Csernoch, L.; et al. Dietary selenium augments sarcoplasmic calcium release and mechanical performance in mice. Nutr. Metab. 2016, 13, 76. [Google Scholar] [CrossRef] [Green Version]
- Szentesi, P.; Jacquemond, V.; Kovács, L.; Csernoch, L. Intramembrane charge movement and sarcoplasmic calcium release in enzymatically isolated mammalian skeletal muscle fibres. J. Physiol. 1997, 505, 371–384. [Google Scholar] [CrossRef] [Green Version]
- Fodor, J.; Gonczi, M.; Sztretye, M.; Dienes, B.; Olah, T.; Szabo, L.; Csoma, E.; Szentesi, P.; Szigeti, G.P.; Marty, I.; et al. Altered expression of triadin 95 causes parallel changes in localized Ca2+ release events and global Ca2+ signals in skeletal muscle cells in culture. J. Physiol. 2008, 586, 5803–5818. [Google Scholar] [CrossRef]
- Sztretye, M.; Geyer, N.; Vincze, J.; Al-Gaadi, D.; Oláh, T.; Szentesi, P.; Kis, G.; Balatoni, I.; Csernoch, L.; Dienes, B. Store-operated calcium entry is important for maintaining sarcoplasmic calcium content and release in mammalian skeletal muscle fibers. Biophys. J. 2017, 113, 2496–2507. [Google Scholar] [CrossRef] [Green Version]
- Ainbinder, A.; Boncompagni, S.; Protasi, F.; Dirksen, R.T. Role of Mitofusin-2 in mitochondrial localization and calcium uptake in skeletal muscle. Cell Calcium 2015, 57, 14–24. [Google Scholar] [CrossRef] [Green Version]
- Fassett, R.G.; Coombes, J.S. Astaxanthin in Cardiovascular Health and Disease. Molecules 2012, 17, 2030–2048. [Google Scholar] [CrossRef] [PubMed]
- Evans, W.J. Vitamin E, vitamin C, and exercise. Am. J. Clin. Nutr. 2000, 72, 647S–652S. [Google Scholar] [CrossRef] [PubMed]
- Aoi, W.; Naito, Y.; Takanami, Y.; Ishii, T.; Kawai, Y.; Akagiri, S.; Kato, Y.; Osawa, T.; Yoshikawa, T. Astaxanthin improves muscle lipid metabolism in exercise via inhibitory effect of oxidative CPT I modification. Biochem. Biophys. Res. Commun. 2008, 366, 892–897. [Google Scholar] [CrossRef] [PubMed]
- Mao, G.; Kraus, G.A.; Kim, I.; Spurlock, M.E.; Bailey, T.B.; Beitz, D.C. Effect of a mitochondria-targeted vitamin E derivative on mitochondrial alteration and systemic oxidative stress in mice. Br. J. Nutr. 2011, 106, 87–95. [Google Scholar] [CrossRef] [PubMed] [Green Version]
- Kanazashi, M.; Tanaka, M.; Nakanishi, R.; Maeshige, N.; Fujino, H. Effects of astaxanthin supplementation and electrical stimulation on muscle atrophy and decreased oxidative capacity in soleus muscle during hindlimb unloading in rats. J. Physiol. Sci. 2019, 69, 757–767. [Google Scholar] [CrossRef] [PubMed]
- Ikeuchi, M.; Koyama, T.; Takahashi, J.; Yazawa, K. Effects of Astaxanthin in Obese Mice Fed a High-Fat Diet. Biosci. Biotechnol. Biochem. 2007, 71, 893–899. [Google Scholar] [CrossRef] [Green Version]
- Boncompagni, S.; Rossi, A.E.; Micaroni, M.; Beznoussenko, G.V.; Polishchuk, R.S.; Dirksen, R.T.; Protasi, F. Mitochondria are linked to calcium stores in striated muscle by developmentally regulated tethering structures. Mol. Biol. Cell 2009, 20, 1058–1067. [Google Scholar] [CrossRef]
- Pan, X.; Liu, J.; Nguyen, T.; Liu, C.; Sun, J.; Teng, Y.; Fergusson, M.M.; Rovira, I.I.; Allen, M.; Springer, D.A.; et al. The physiological role of mitochondrial calcium revealed by mice lacking the mitochondrial calcium uniporter. Nat. Cell Biol. 2013, 15, 1464–1472. [Google Scholar] [CrossRef] [Green Version]
- De Stefani, D.; Raffaello, A.; Teardo, E.; Szabò, I.; Rizzuto, R. A forty-kilodalton protein of the inner membrane is the mitochondrial calcium uniporter. Nature 2011, 476, 336–340. [Google Scholar] [CrossRef]
- Paillard, M.; Csordás, G.; Szanda, G.; Golenár, T.; Debattisti, V.; Bartok, A.; Wang, N.; Moffat, C.; Seifert, E.L.; Spät, A.; et al. Tissue-Specific Mitochondrial Decoding of Cytoplasmic Ca2+ Signals Is Controlled by the Stoichiometry of MICU1/2 and MCU. Cell Rep. 2017, 18, 2291–2300. [Google Scholar] [CrossRef] [Green Version]
- Yi, J.; Ma, C.; Li, Y.; Weisleder, N.; Rios, E.; Ma, J.; Zhou, J. Mitochondrial calcium uptake regulates rapid calcium transients in skeletal muscle during excitation–contraction (E-C) coupling. J. Biol. Chem. 2011, 286, 32436–32443. [Google Scholar] [CrossRef] [PubMed] [Green Version]
- Rossi, A.E.; Boncompagni, S.; Wei, L.; Protasi, F.; Dirksen, R.T. Differential impact of mitochondrial positioning on mitochondrial Ca2+ uptake and Ca2+ spark suppression in skeletal muscle. Am. J. Physiol. Cell Physiol. 2011, 301, C1128–C1139. [Google Scholar] [CrossRef] [PubMed] [Green Version]
- Rudolf, R.; Mongillo, M.; Magalhães, P.J.; Pozzan, T. In vivo monitoring of Ca2+ uptake into mitochondria of mouse skeletal muscle during contraction. J. Cell Biol. 2004, 166, 527–536. [Google Scholar] [CrossRef] [PubMed] [Green Version]
- Polotow, T.G.; Vardaris, C.V.; Mihaliuc, A.R.; Gonçalves, M.S.; Pereira, B.; Ganini, D.; Barros, M.P. Astaxanthin supplementation delays physical exhaustion and prevents redox imbalances in plasma and soleus muscles of Wistar rats. Nutrients 2014, 6, 5819–5838. [Google Scholar] [CrossRef] [Green Version]
- Vecellio Reane, D.; Vallese, F.; Checchetto, V.; Acquasaliente, L.; Butera, G.; De Filippis, V.; Szabò, I.; Zanotti, G.; Rizzuto, R.; Raffaello, A. A MICU1 Splice Variant Confers High Sensitivity to the Mitochondrial Ca2+ Uptake Machinery of Skeletal Muscle. Mol. Cell 2016, 64, 760–773. [Google Scholar] [CrossRef] [Green Version]
- Kwong, J.Q.; Huo, J.; Bround, M.J.; Boyer, J.G.; Schwanekamp, J.A.; Ghazal, N.; Maxwell, J.T.; Jang, Y.C.; Khuchua, Z.; Shi, K.; et al. The mitochondrial calcium uniporter underlies metabolic fuel preference in skeletal muscle. JCI Insight 2018, 3. [Google Scholar] [CrossRef] [Green Version]
- Gherardi, G.; Nogara, L.; Ciciliot, S.; Fadini, G.P.; Blaauw, B.; Braghetta, P.; Bonaldo, P.; De Stefani, D.; Rizzuto, R.; Mammucari, C. Loss of mitochondrial calcium uniporter rewires skeletal muscle metabolism and substrate preference. Cell Death Differ. 2019, 26, 362–381. [Google Scholar] [CrossRef] [Green Version]
- Sleeman, M.W.; Zhou, H.; Rogers, S.; Ng, K.W.; Best, J.D. Retinoic acid stimulates glucose transporter expression in L6 muscle cells. Mol. Cell Endocrinol. 1995, 108, 161–167. [Google Scholar] [CrossRef]
- Bonet, M.L.; Ribot, J.; Palou, A. Lipid metabolism in mammalian tissues and its control by retinoic acid. Biochim. Biophys. Acta 2012, 1821, 177–189. [Google Scholar] [CrossRef]
- Arunkumar, E.; Bhuvaneswari, S.; Anuradha, C.V. An intervention study in obese mice with astaxanthin, a marine carotenoid--effects on insulin signaling and pro-inflammatory cytokines. Food Funct. 2012, 3, 120–126. [Google Scholar] [CrossRef]
- Amengual, J.; García-Carrizo, F.J.; Arreguín, A.; Mušinović, H.; Granados, N.; Palou, A.; Bonet, M.L.; Ribot, J. Retinoic Acid Increases Fatty Acid Oxidation and Irisin Expression in Skeletal Muscle Cells and Impacts Irisin In Vivo. Cell Physiol. Biochem. 2018, 46, 187–202. [Google Scholar] [CrossRef] [PubMed] [Green Version]


| Parameters | Twitch | Tetanus | ||
|---|---|---|---|---|
| Control | Astaxanthin | Control | Astaxanthin | |
| Number of muscles | 9 | 9 | 9 | 9 |
| Force (mN/mm2) | 1.69 ± 0.13 | 1.76 ± 0.08 | 7.13 ± 0.49 | 8.67 ± 0.53 * |
| TTP (ms) | 32.5 ± 1.4 | 33.1 ± 1.1 | 173.9 ± 5.3 | 169.4 ± 4.3 |
| HRT (ms) | 29.2 ± 1.0 | 28.8 ± 1.0 | 75.1 ± 6.6 | 81.0 ± 3.5 |
© 2020 by the authors. Licensee MDPI, Basel, Switzerland. This article is an open access article distributed under the terms and conditions of the Creative Commons Attribution (CC BY) license (http://creativecommons.org/licenses/by/4.0/).
Share and Cite
Sztretye, M.; Singlár, Z.; Szabó, L.; Angyal, Á.; Balogh, N.; Vakilzadeh, F.; Szentesi, P.; Dienes, B.; Csernoch, L. Improved Tetanic Force and Mitochondrial Calcium Homeostasis by Astaxanthin Treatment in Mouse Skeletal Muscle. Antioxidants 2020, 9, 98. https://doi.org/10.3390/antiox9020098
Sztretye M, Singlár Z, Szabó L, Angyal Á, Balogh N, Vakilzadeh F, Szentesi P, Dienes B, Csernoch L. Improved Tetanic Force and Mitochondrial Calcium Homeostasis by Astaxanthin Treatment in Mouse Skeletal Muscle. Antioxidants. 2020; 9(2):98. https://doi.org/10.3390/antiox9020098
Chicago/Turabian StyleSztretye, Mónika, Zoltán Singlár, László Szabó, Ágnes Angyal, Norbert Balogh, Faranak Vakilzadeh, Péter Szentesi, Beatrix Dienes, and László Csernoch. 2020. "Improved Tetanic Force and Mitochondrial Calcium Homeostasis by Astaxanthin Treatment in Mouse Skeletal Muscle" Antioxidants 9, no. 2: 98. https://doi.org/10.3390/antiox9020098