
Electrochemical Methodologies for Investigating the Antioxidant Potential of Plant and Fruit Extracts: A Review

 , ,
, ,  and
and
Abstract
:1. Introduction
2. Conventional Assays/Methods for Determination of AOC
3. Electrochemical Methodologies
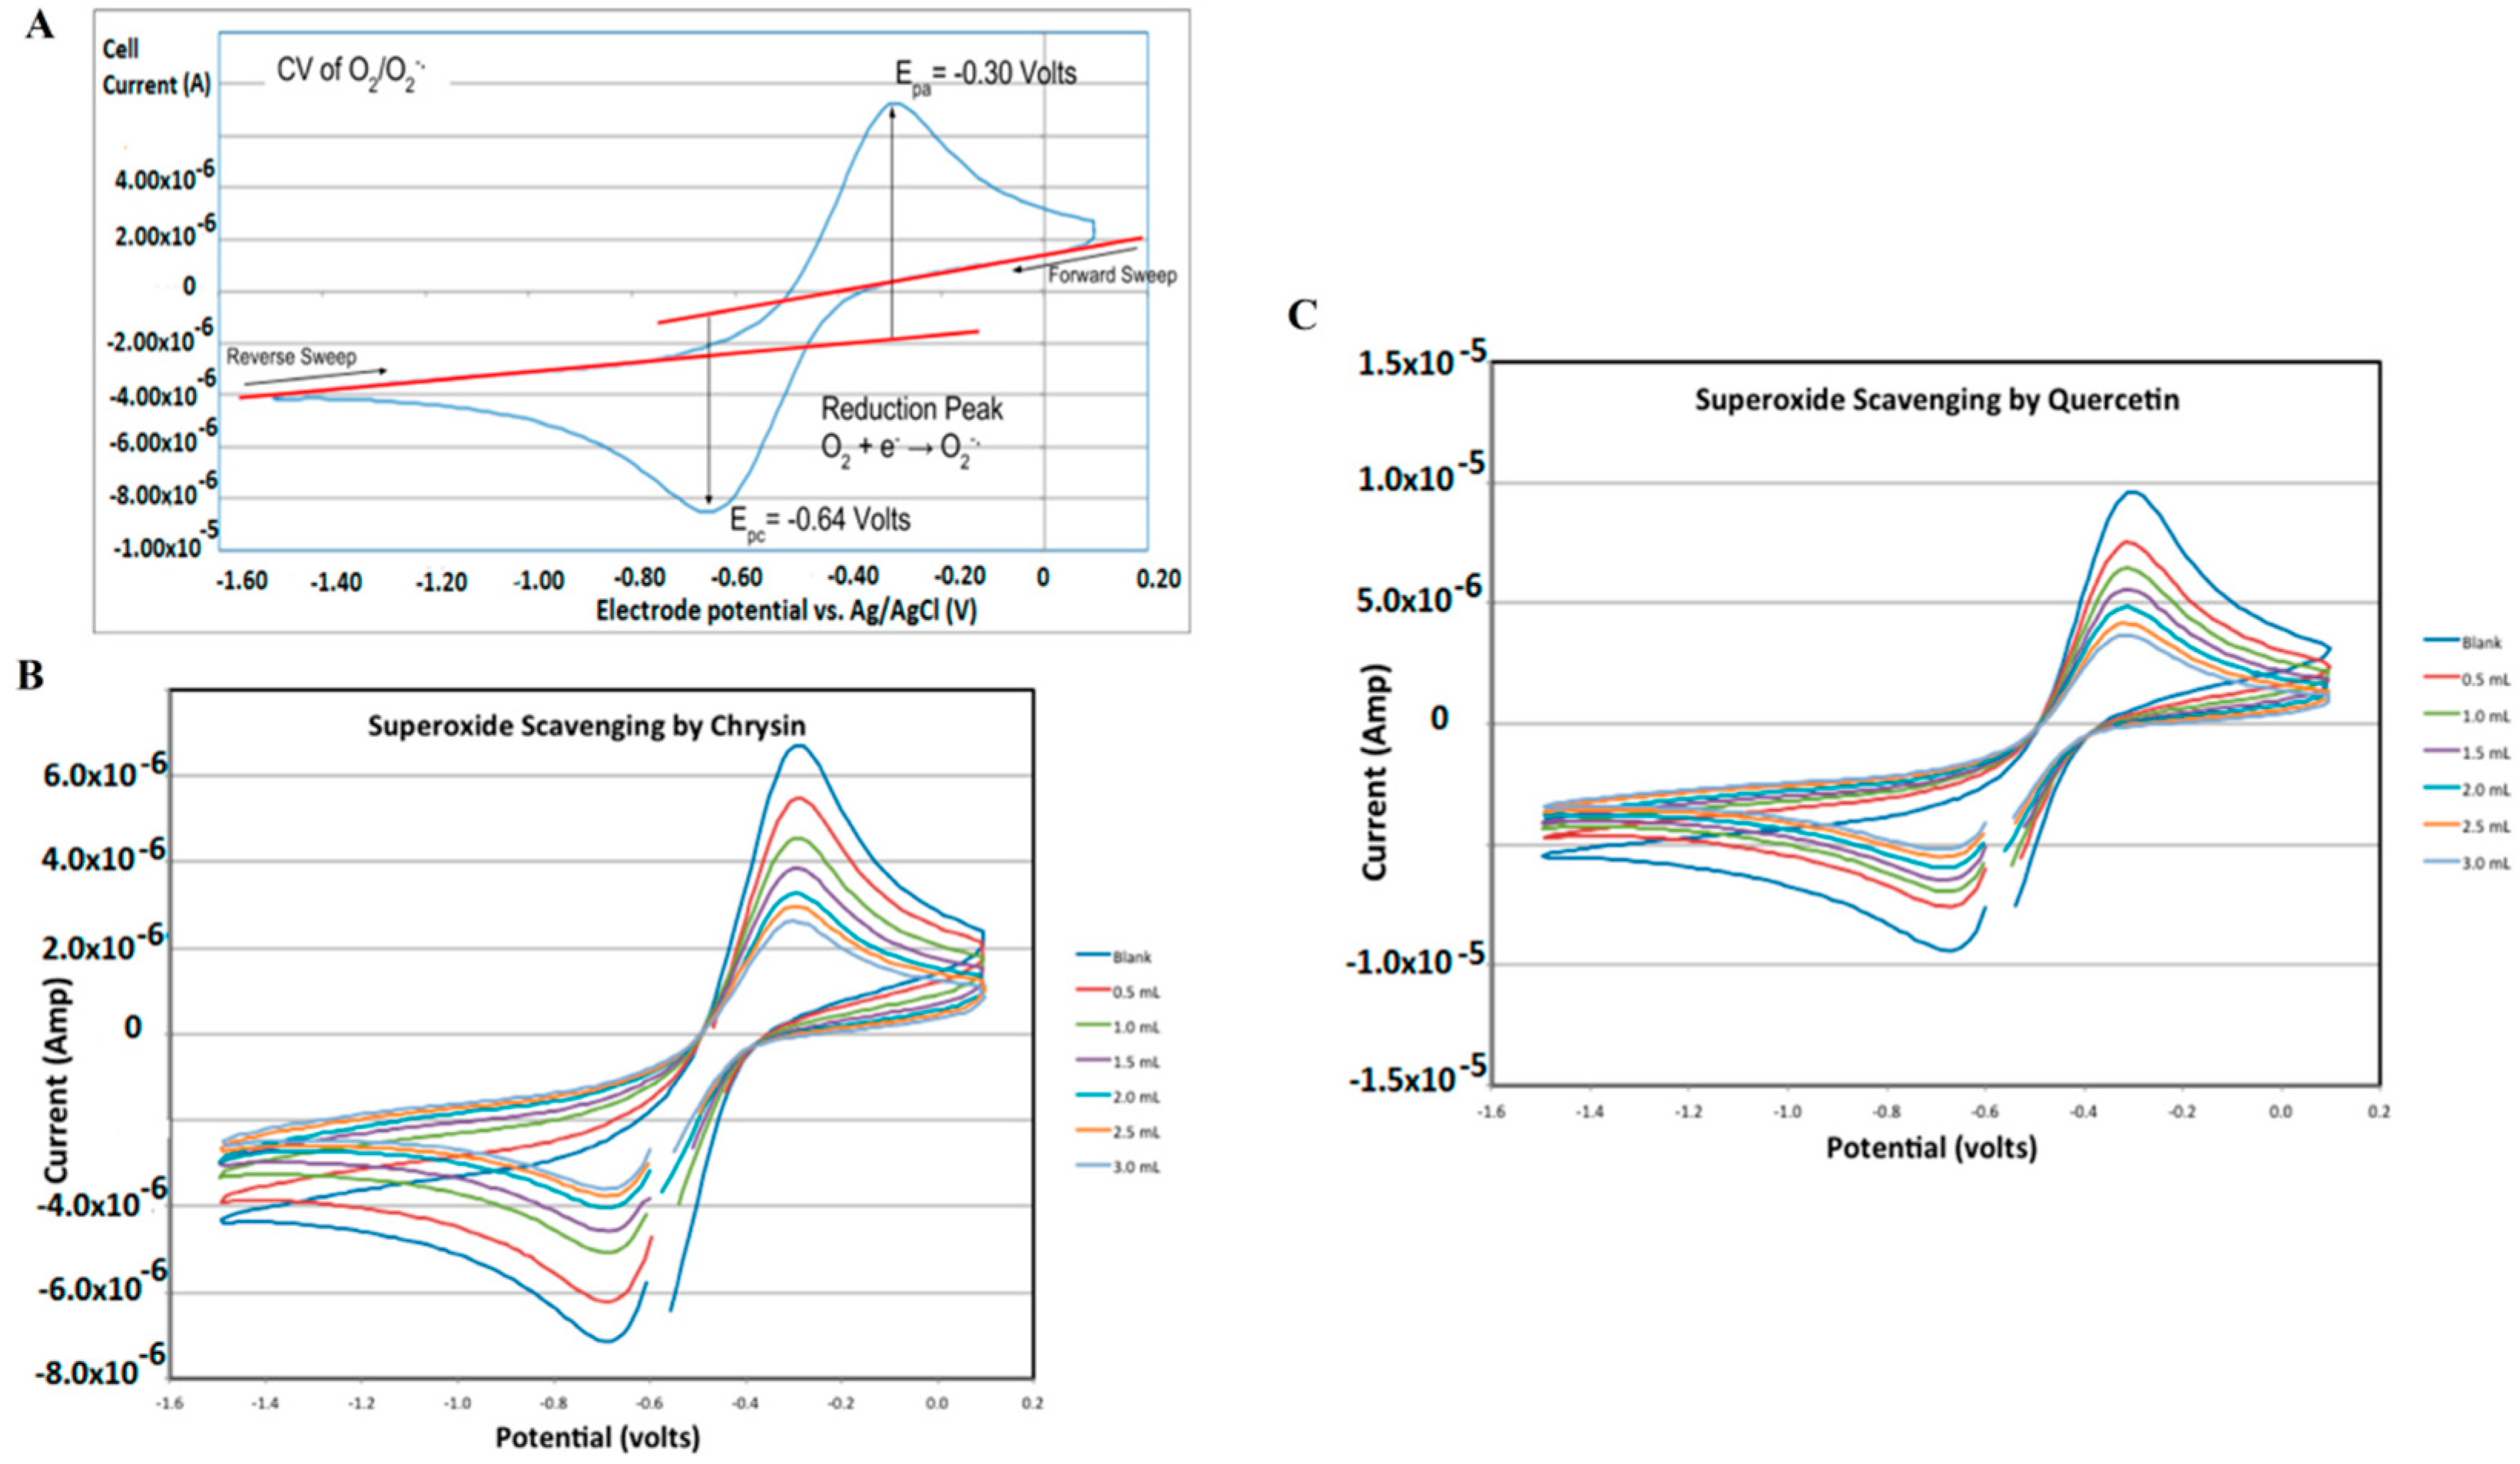
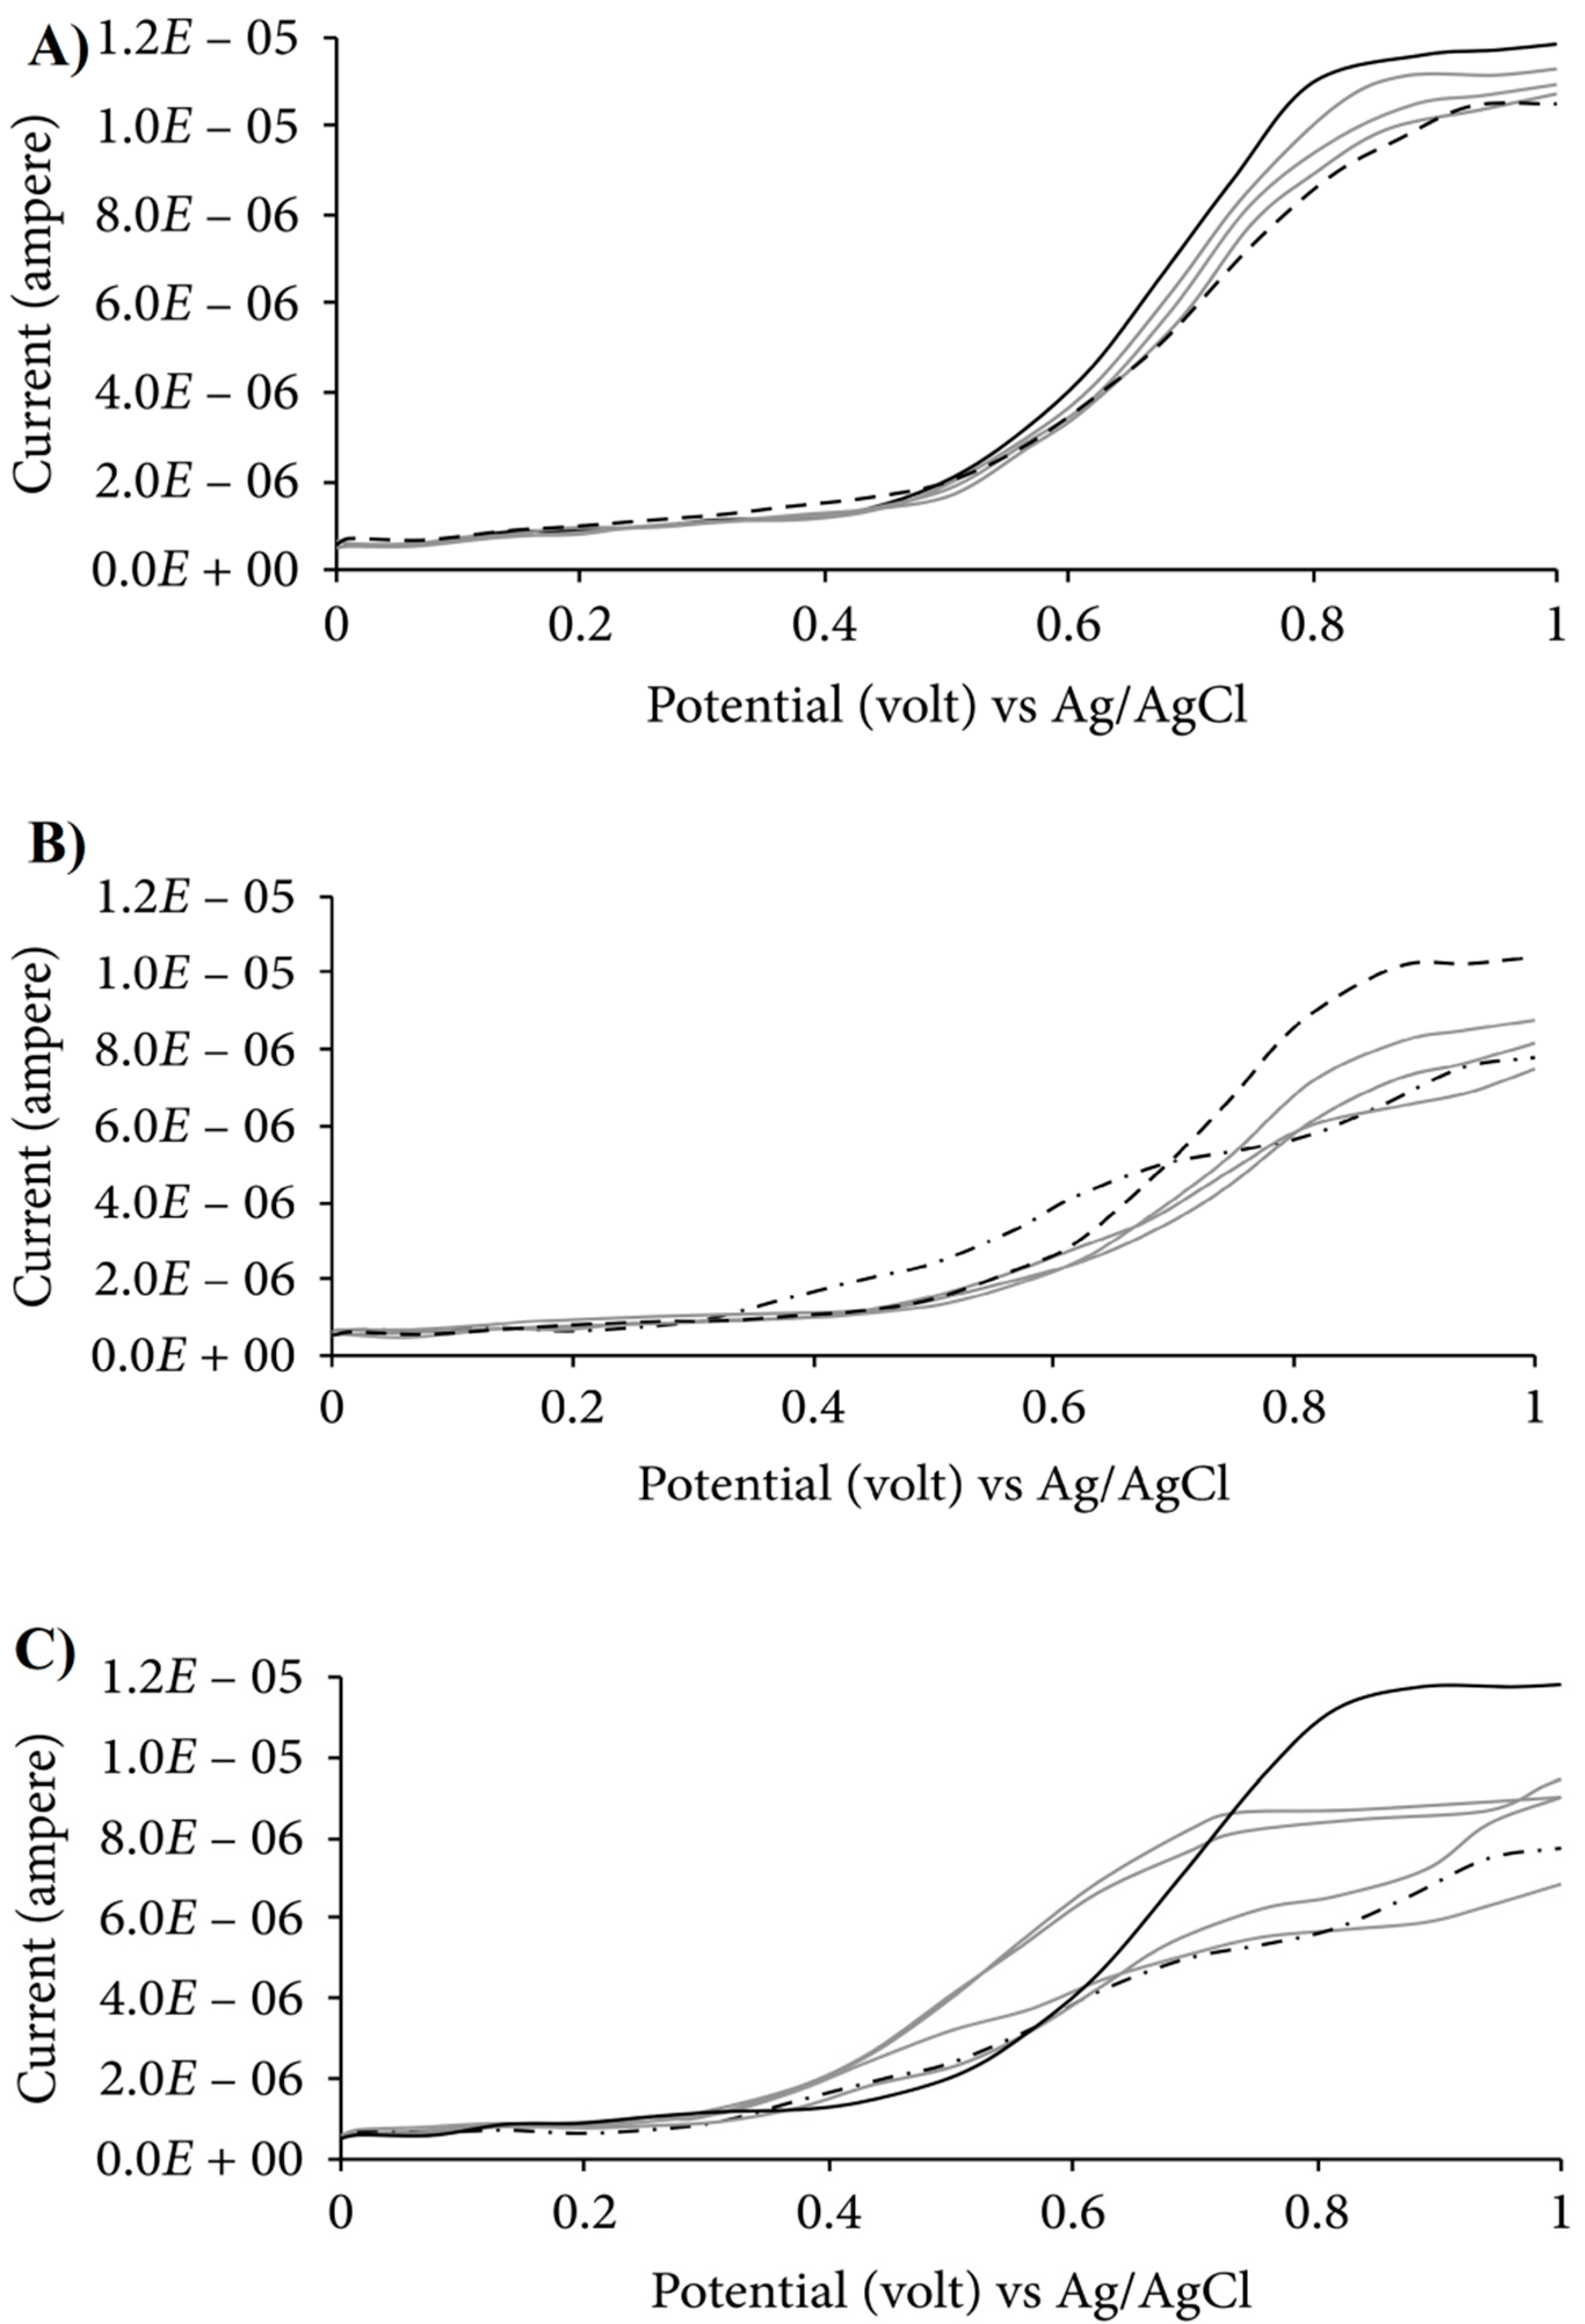
3.1. Cyclic Voltammetry (CV)
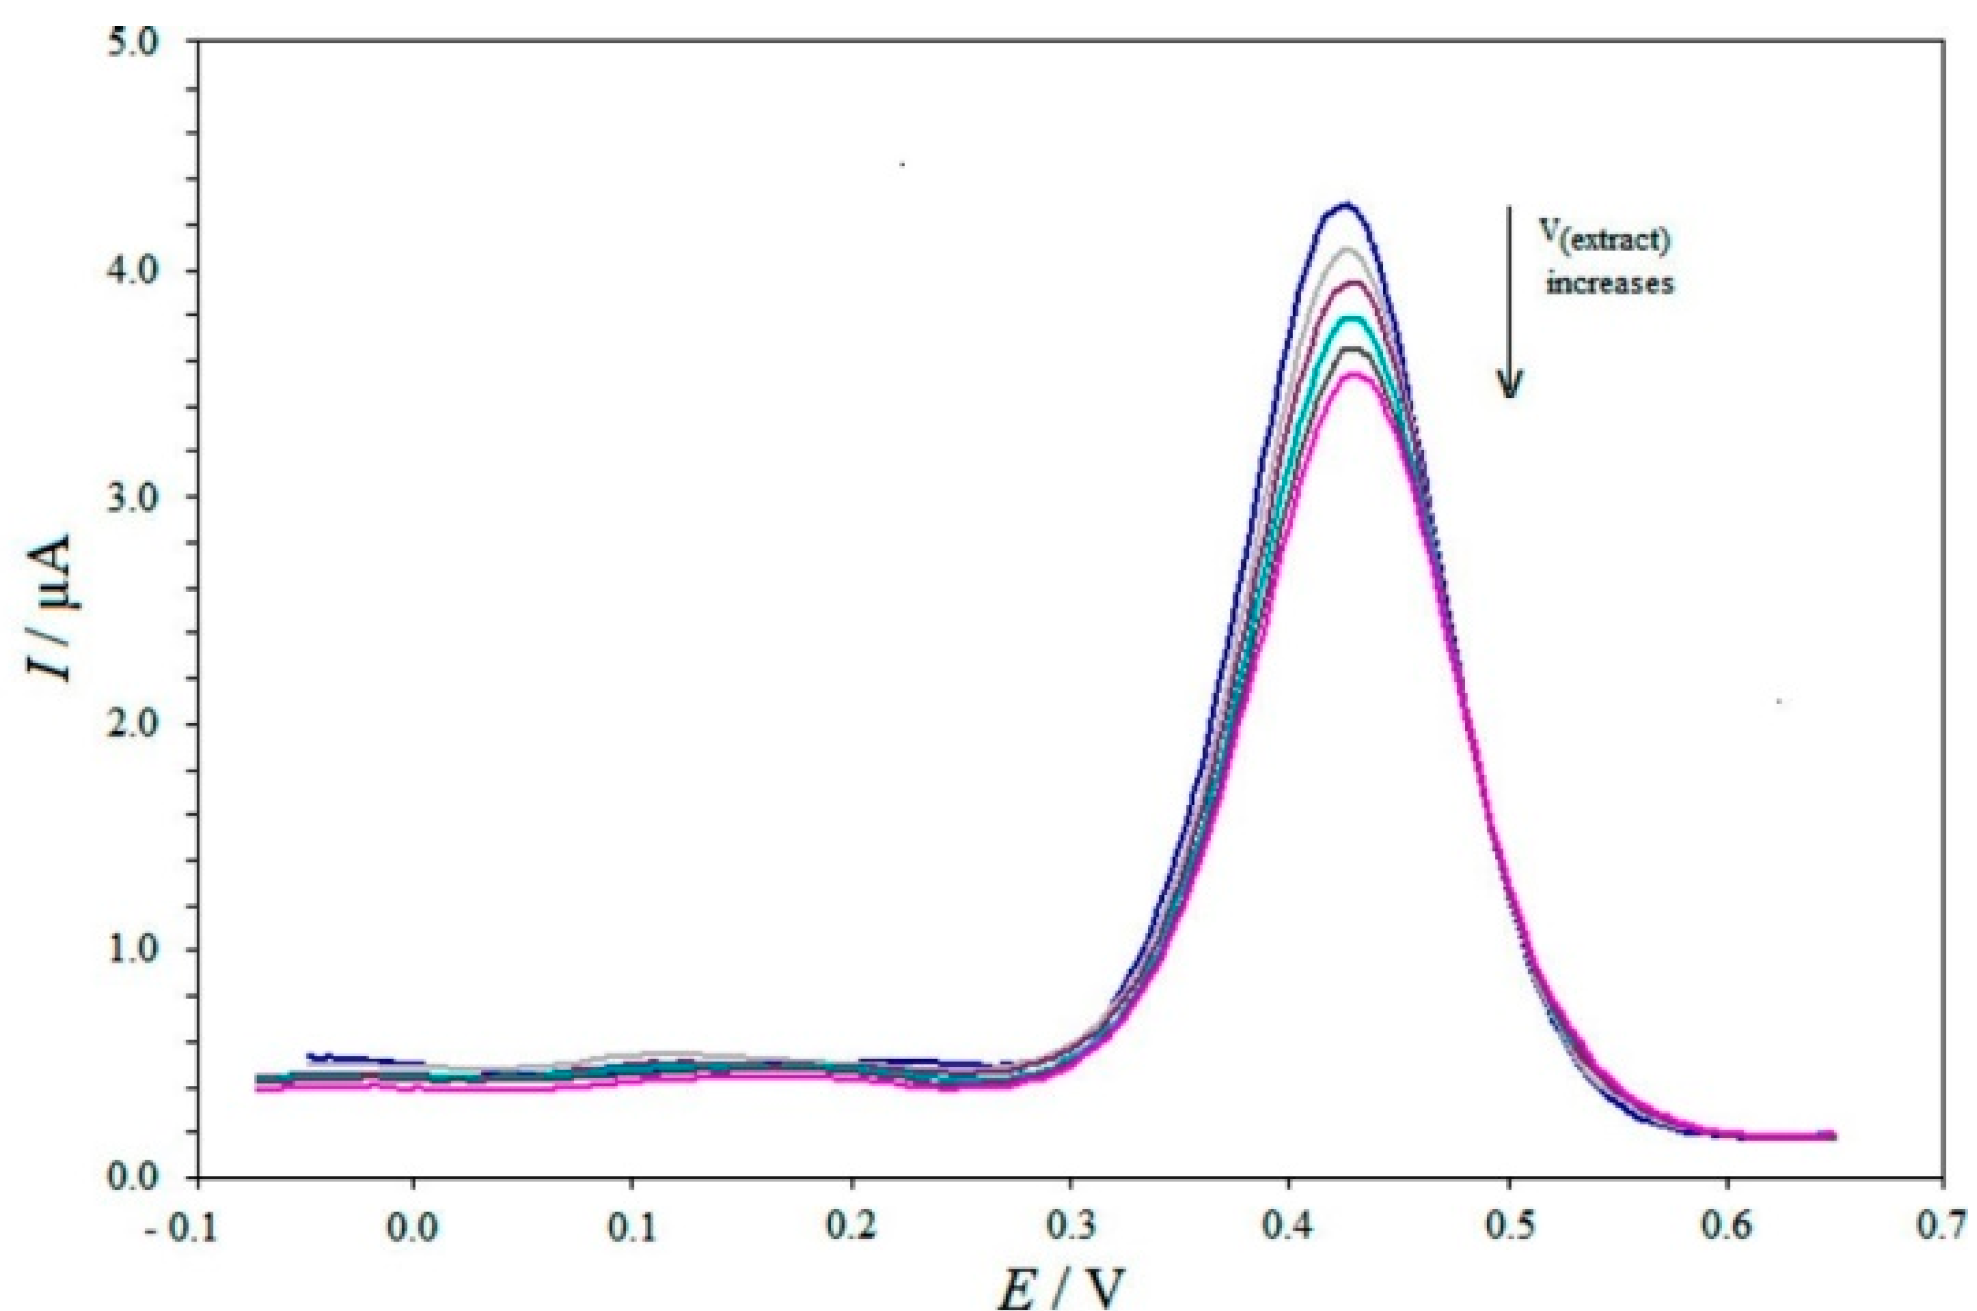
3.2. Differential Pulse Voltammetry (DPV)
3.3. Square Wave Voltammetry (SWV)
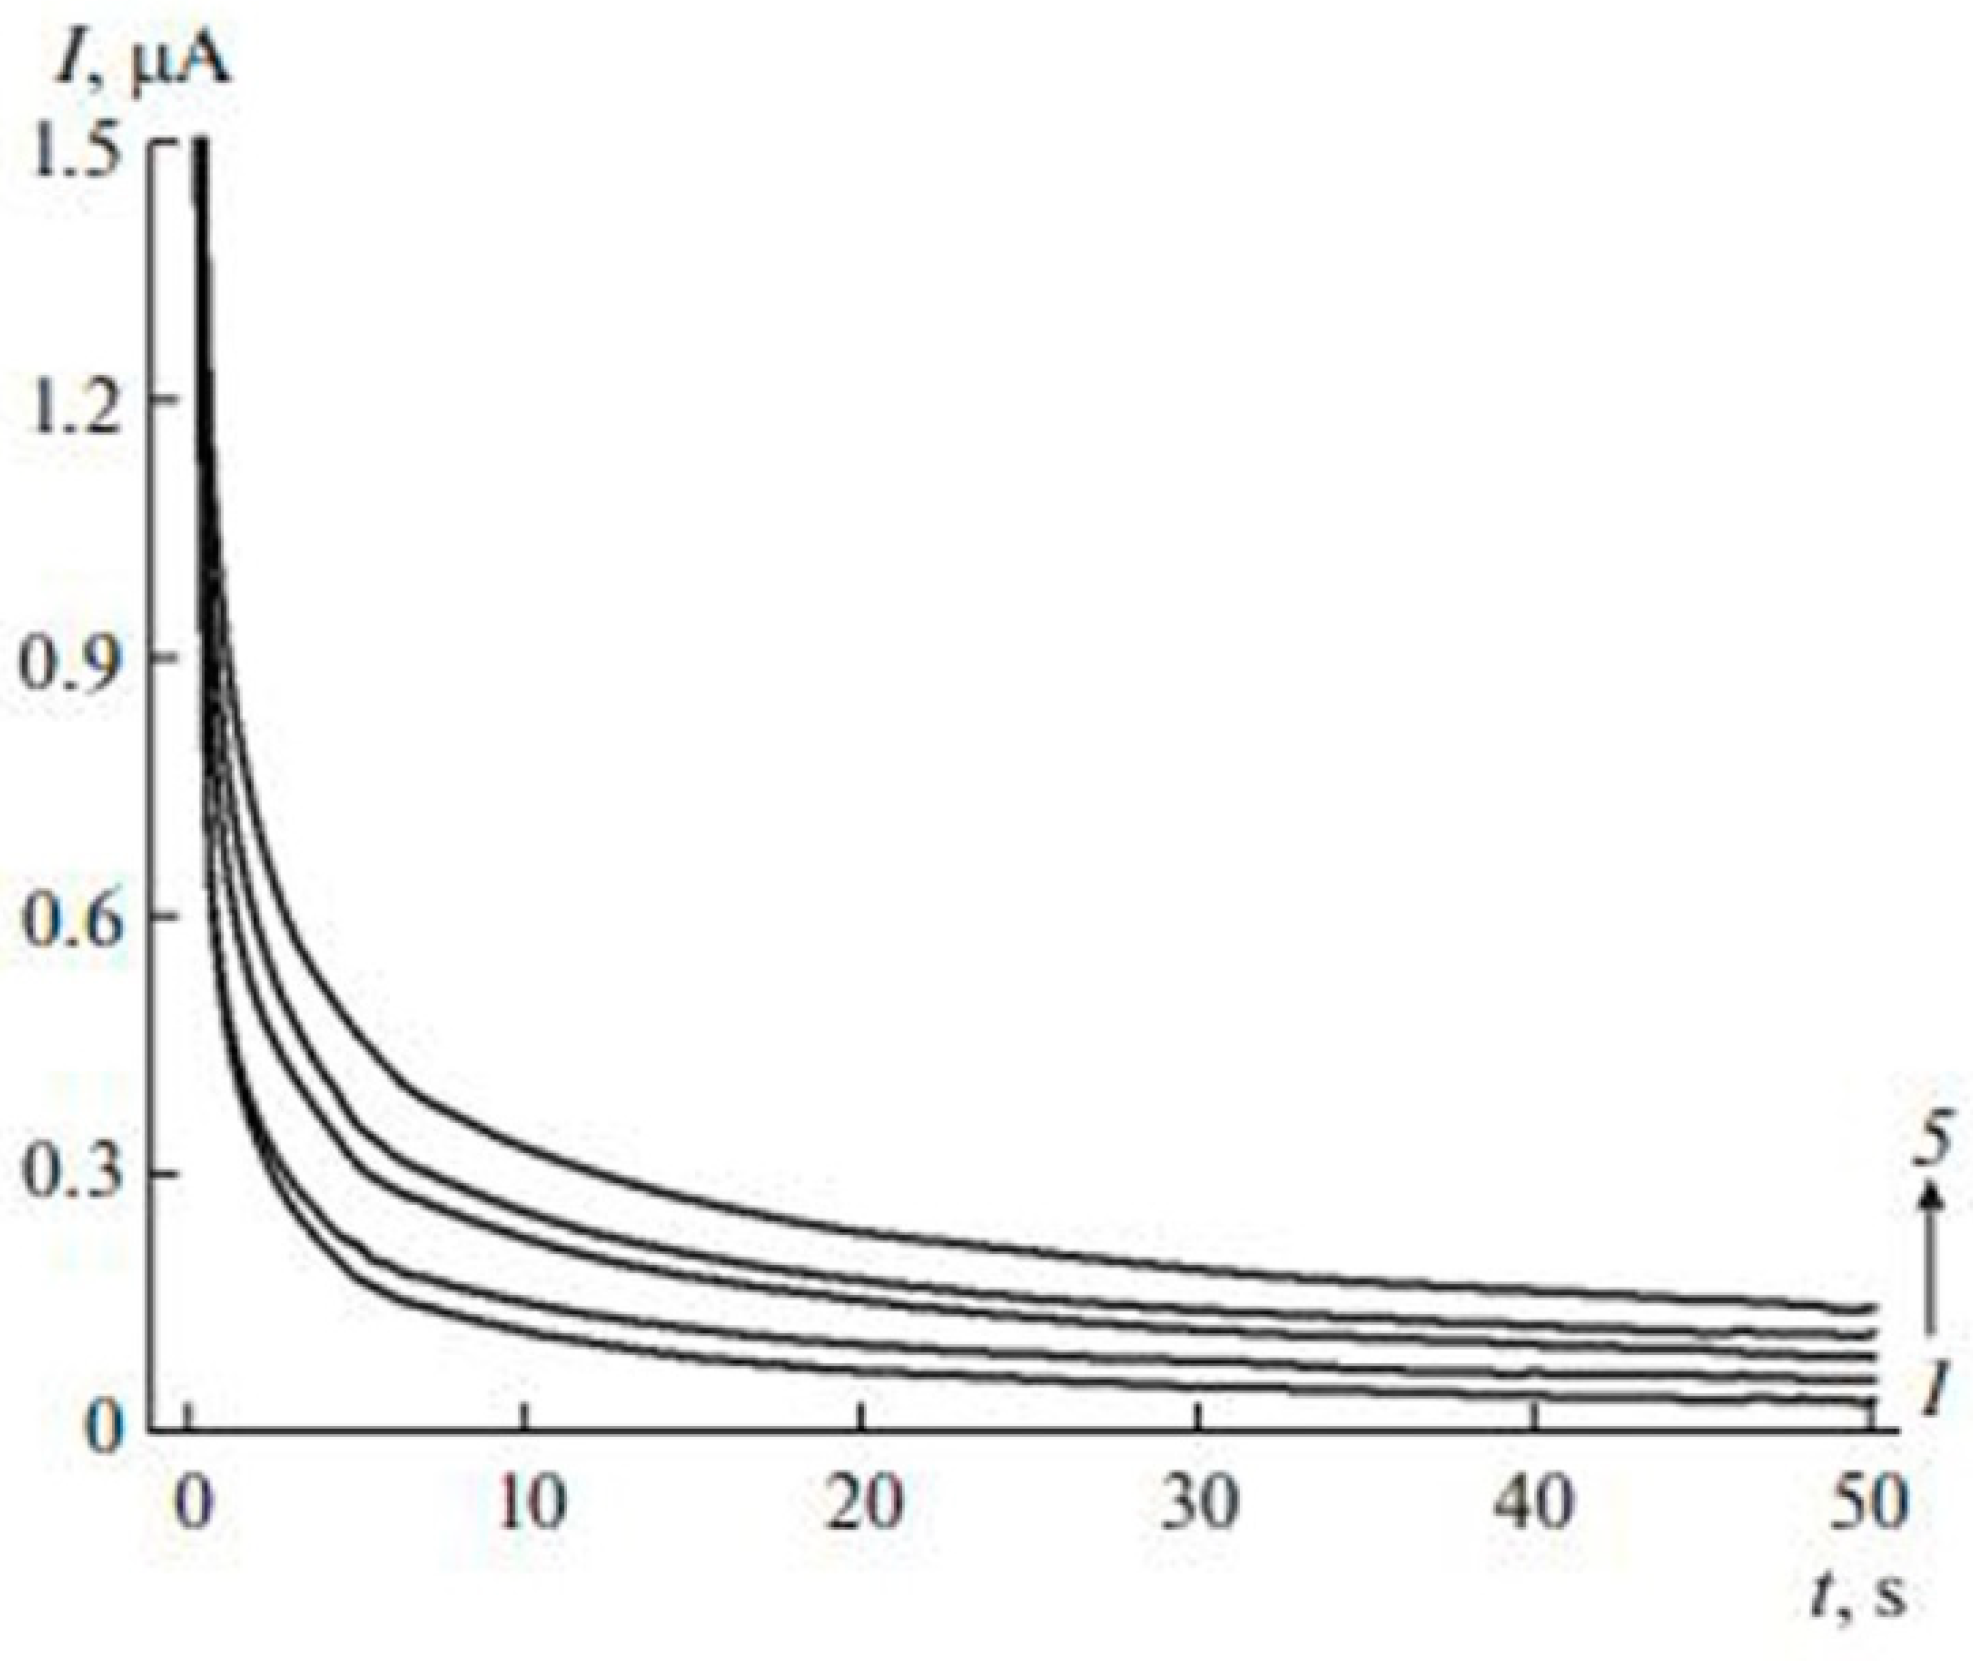
3.4. Amperometric Measurements (Chronoamperometry)
4. Applications of the Electrochemical Methods for the AOC
4.1. AOC Determination of the Fruit’s Extract
4.2. AOC Determination of the Plant’s Extract
5. Conclusions
6. Future Perspectives
- The electrochemical techniques should be applied in conjugation with the chromatographic technique as the electrochemical techniques were still not able to identify the phytochemicals present in the extract.
- During the study of the correlation of the electrochemical techniques with the conventional methodologies, the fact that the electrochemical techniques are used to measure the TAC rather than measuring the particular antioxidants for the particular reaction should not be ignored. The cumulative antioxidant potential should be considered to be a preferable approach in determining the selective antioxidants via particular reactions.
- The flow injection analysis alongside the stationary electrochemical techniques should also be performed for studying the AOC potential of the extract.
Funding
Acknowledgments
Conflicts of Interest
References
- Munteanu, I.G.; Apetrei, C. Analytical methods used in determining antioxidant activity: A review. Int. J. Mol. Sci. 2021, 22, 3380. [Google Scholar] [CrossRef] [PubMed]
- Masek, A.; Latos-Brozio, M.; Chrzescijanska, E.; Podsedek, A. Polyphenolic profile and antioxidant activity of Juglans regia L. leaves and husk extracts. Forests 2019, 10, 988. [Google Scholar] [CrossRef] [Green Version]
- Antolovich, M.; Prenzler, P.D.; Patsalides, E.; McDonald, S.; Robards, K. Methods for testing antioxidant activity. Analyst 2002, 127, 183–198. [Google Scholar] [CrossRef] [PubMed]
- Apak, R.; Özyürek, M.; Güçlü, K.; Çapanoğlu, E. Antioxidant activity/capacity measurement. 1. Classification, physicochemical principles, mechanisms, and electron transfer (ET)-based assays. J. Agric. Food Chem. 2016, 64, 997–1027. [Google Scholar] [CrossRef]
- Sadeer, B.N.; Montesano, D.; Albrizio, S.; Zengin, G.; Mahomoodally, M.F. The versatility of antioxidant assays in food science and safety—Chemistry, applications, strengths, and limitations. Antioxidants 2020, 9, 709. [Google Scholar] [CrossRef]
- Bunaciu, A.A.; Danet, A.F.; Fleschin, Ş.; Aboul-Enein, H.Y. Recent applications for in vitro antioxidant activity assay. Crit. Rev. Anal. Chem. 2016, 46, 389–399. [Google Scholar] [CrossRef]
- Shahidi, F.; Zhong, Y. Measurement of antioxidant activity. J. Funct. Foods 2015, 18, 757–781. [Google Scholar] [CrossRef]
- Cömert, E.D.; Gökmen, V. Evolution of food antioxidants as a core topic of food science for a century. Food Res. Int. 2018, 105, 76–93. [Google Scholar] [CrossRef]
- Ácsová, A.; Martiniaková, S.; Hojerová, J. Selected in vitro methods to determine antioxidant activity of hydrophilic/lipophilic substances. Acta Chim. Slov. 2019, 12, 200–211. [Google Scholar] [CrossRef] [Green Version]
- Dżugan, M.; Tomczyk, M.; Sowa, P.; Grabek-Lejko, D. Antioxidant activity as biomarker of honey variety. Molecules 2018, 23, 2069. [Google Scholar] [CrossRef] [Green Version]
- Siddeeg, A.; AlKehayez, N.M.; Abu-Hiamed, H.A.; Al-Sanea, E.A.; Al-Farga, A.M. Mode of action and determination of antioxidant activity in the dietary sources: An overview. Saudi J. Biol. Sci. 2021, 28, 1633–1644. [Google Scholar] [CrossRef] [PubMed]
- Apak, R. Current issues in antioxidant measurement. J. Agric. Food Chem. 2019, 67, 9187–9202. [Google Scholar] [CrossRef] [PubMed]
- Oroian, M.; Escriche, I. Antioxidants: Characterization, natural sources, extraction and analysis. Food Res. Int. 2015, 74, 10–36. [Google Scholar] [CrossRef] [PubMed]
- Brainina, K.Z.; Tarasov, A.V.; Kazakov, Y.E.; Vidrevich, M.B. Platinum electrode regeneration and quality control method for chronopotentiometric and chronoamperometric determination of antioxidant activity of biological fluids. J. Electroanal. Chem. 2018, 808, 14–20. [Google Scholar] [CrossRef]
- Mohtar, L.G.; Messina, G.A.; Bertolino, F.A.; Pereira, S.V.; Raba, J.; Nazareno, M.A. Comparative study of different methodologies for the determination the antioxidant activity of Venezuelan propolis. Microchem. J. 2020, 158, 105244. [Google Scholar] [CrossRef]
- Ilyasov, I.R.; Beloborodov, V.L.; Selivanova, I.A.; Terekhov, R.P. ABTS/PP decolorization assay of antioxidant capacity reaction pathways. Int. J. Mol. Sci. 2020, 21, 1131. [Google Scholar] [CrossRef] [Green Version]
- Alnemari, R.M.; Brüßler, J.; Keck, C.M. Assessing the Oxidative State of the Skin by Combining Classical Tape Stripping with ORAC Assay. Pharmaceuticals 2022, 15, 520. [Google Scholar] [CrossRef]
- Valgimigli, L.; Baschieri, A.; Amorati, R. Antioxidant activity of nanomaterials. J. Mater. Chem. B 2018, 6, 2036–2051. [Google Scholar] [CrossRef] [PubMed]
- Guerreiro, A.; Andrade, M.A.; Menezes, C.; Vilarinho, F.; Dias, E. Antioxidant and cytoprotective properties of cyanobacteria: Potential for biotechnological applications. Toxins 2020, 12, 548. [Google Scholar] [CrossRef]
- Shivakumar, A.; Kumar, Y.M.S. Critical review on the analytical mechanistic steps in the evaluation of antioxidant activity. Crit. Rev. Anal. Chem. 2018, 48, 214–236. [Google Scholar] [CrossRef] [PubMed]
- Sethi, S.; Joshi, A.; Arora, B.; Bhowmik, A.; Sharma, R.R.; Kumar, P. Significance of FRAP, DPPH, and CUPRAC assays for antioxidant activity determination in apple fruit extracts. Eur. Food Res. Technol. 2020, 246, 591–598. [Google Scholar] [CrossRef]
- Ravindranath, V.; Singh, J.; Jayaprakasha, G.K.; Patil, B.S. Optimization of Extraction Solvent and Fast Blue BB Assay for Comparative Analysis of Antioxidant Phenolics from Cucumis melo L. Plants 2021, 10, 1379. [Google Scholar] [CrossRef] [PubMed]
- Cai, R.; Wang, L.N.; Fan, J.J.; Geng, S.Q.; Liu, Y.M. New 4-N-phenylaminoquinoline derivatives as antioxidant, metal chelating and cholinesterase inhibitors for Alzheimer’s disease. Bioorg. Chem. 2019, 93, 103328. [Google Scholar] [CrossRef] [PubMed]
- Kiokias, S.; Proestos, C.; Oreopoulou, V. Effect of natural food antioxidants against LDL and DNA oxidative changes. Antioxidants 2018, 7, 133. [Google Scholar] [CrossRef] [PubMed] [Green Version]
- Coulombier, N.; Jauffrais, T.; Lebouvier, N. Antioxidant compounds from microalgae: A review. Mar. Drugs 2021, 19, 549. [Google Scholar] [CrossRef]
- Kellett, M.E.; Greenspan, P.; Pegg, R.B. Modification of the cellular antioxidant activity (CAA) assay to study phenolic antioxidants in a Caco-2 cell line. Food Chem. 2018, 244, 359–363. [Google Scholar] [CrossRef]
- Miller, N.; Rice-Evans, C. Spectrophotometric determination of antioxidant activity. Redox Rep. 1996, 2, 161–171. [Google Scholar] [CrossRef]
- Lu, X.; Rasco, B.A. Determination of antioxidant content and antioxidant activity in foods using infrared spectroscopy and chemometrics: A review. Crit. Rev. Food Sci. Nutr. 2012, 52, 853–875. [Google Scholar] [CrossRef]
- de Lima, A.B.S.; Batista, A.S.; Santos, M.R.C.; da Rocha, R.d.S.; da Silva, M.V.; Ferrão, S.P.B.; de Almeida, V.V.S.; Santos, L.S. Spectroscopy NIR and MIR toward predicting simultaneous phenolic contents and antioxidant in red propolis by multivariate analysis. Food Chem. 2022, 367, 130744. [Google Scholar] [CrossRef]
- Cui, Q.; Wang, Y.; Zhou, W.; He, S.; Yang, M.; Xue, Q.; Wang, Y.; Zhao, T.; Cao, J.; Khan, A. Phenolic composition, antioxidant and cytoprotective effects of aqueous-methanol extract from Anneslea fragrans leaves as affected by drying methods. Int. J. Food Sci. Technol. 2021, 56, 4807–4819. [Google Scholar] [CrossRef]
- Buldurun, K.; Turan, N.; Bursal, E.; Mantarcı, A.; Turkan, F.; Taslimi, P.; Gülçin, İ. Synthesis, spectroscopic properties, crystal structures, antioxidant activities and enzyme inhibition determination of Co (II) and Fe (II) complexes of Schiff base. Res. Chem. Intermed. 2020, 46, 283–297. [Google Scholar] [CrossRef]
- İlyasoğlu, H.; Nadzieja, M.; Guo, Z. Caffeic acid grafted chitosan as a novel dual-functional stabilizer for food-grade emulsions and additive antioxidant property. Food Hydrocoll. 2019, 95, 168–176. [Google Scholar] [CrossRef]
- Zamani, M.; Delfani, A.M.; Jabbari, M. Scavenging performance and antioxidant activity of γ-alumina nanoparticles towards DPPH free radical: Spectroscopic and DFT-D studies. Spectrochim. Acta A Mol. Biomol. Spectrosc. 2018, 201, 288–299. [Google Scholar] [CrossRef] [PubMed]
- Cirak, C.; Radusiene, J.; Raudone, L.; Vilkickyte, G.; Seyis, F.; Marksa, M.; Ivanauskas, L.; Yayla, F. Phenolic compounds and antioxidant activity of Achillea arabica populations. S. Afr. J. Bot. 2022, 147, 425–433. [Google Scholar] [CrossRef]
- Yalçın, S.; Uzun, M.; Karakaş, Ö.; Sözgen Başkan, K.; Okudan, E.Ş.; Apak, M.R. Determination of Total Antioxidant Capacities of Algal Pigments in Seaweed by the Combination of High-Performance Liquid Chromatography (HPLC) with A Cupric Reducing Antioxidant Capacity (CUPRAC) Assay. Anal. Lett. 2021, 54, 2239–2258. [Google Scholar] [CrossRef]
- Deseo, M.A.; Elkins, A.; Rochfort, S.; Kitchen, B. Antioxidant activity and polyphenol composition of sugarcane molasses extract. Food Chem. 2020, 314, 126180. [Google Scholar] [CrossRef] [PubMed]
- Tu, J.; Shi, D.; Wen, L.; Jiang, Y.; Zhao, Y.; Yang, J.; Liu, H.; Liu, G.; Yang, B. Identification of moracin N in mulberry leaf and evaluation of antioxidant activity. Food Chem. Toxicol. 2019, 132, 110730. [Google Scholar] [CrossRef]
- Moreno, M.T.; Rodríguez Mellado, J.M. Spectrophotometric and Electrochemical Assessment of the Antioxidant Capacity of Aqueous and Ethanolic Extracts of Citrus Flavedos. Oxygen 2022, 2, 9. [Google Scholar] [CrossRef]
- Arman, A.; Üzer, A.; Sağlam, Ş.; Erçağ, E.; Apak, R. Indirect electrochemical determination of antioxidant capacity with hexacyanoferrate (III) reduction using a gold nanoparticle-coated o-phenylenediamine-aniline copolymer electrode. Anal. Lett. 2019, 52, 1282–1297. [Google Scholar] [CrossRef]
- Deepa, R.R.; Arulraj, A.A.D.; Mideen, A.; Gandhidasan, R.R.; Vasantha, V. Evaluation of antioxidant property of quinones and calculation of their binding constant values with DNA by Electrochemical Technique. Der Pharma Chem. 2018, 10, 69–78. [Google Scholar]
- Sochor, J.; Dobes, J.; Krystofova, O.; Ruttkay-Nedecky, B.; Babula, P.; Pohanka, M.; Jurikova, T.; Zitka, O.; Adam, V.; Klejdus, B. Electrochemistry as a tool for studying antioxidant properties. Int. J. Electrochem. Sci. 2013, 8, 8464–8489. [Google Scholar]
- Ivanova, A.; Gerasimova, E.; Gazizullina, E. Study of antioxidant properties of agents from the perspective of their action mechanisms. Molecules 2020, 25, 4251. [Google Scholar] [CrossRef] [PubMed]
- David, I.G.; Popa, D.E.; Buleandră, M.; Cheregi, M.C. Electrochemical methods and (bio) sensors for rosmarinic acid investigation. Chemosensors 2020, 8, 74. [Google Scholar] [CrossRef]
- Adamcová, A.; Horna, A.; Šatínský, D. Determination of Phloridzin and Other Phenolic Compounds in Apple Tree Leaves, Bark, and Buds Using Liquid Chromatography with Multilayered Column Technology and Evaluation of the Total Antioxidant Activity. Pharmaceuticals 2022, 15, 244. [Google Scholar] [CrossRef]
- Bedlovičová, Z.; Strapáč, I.; Baláž, M.; Salayová, A. A brief overview on antioxidant activity determination of silver nanoparticles. Molecules 2020, 25, 3191. [Google Scholar] [CrossRef]
- Koc, T.B.; Kuyumcu Savan, E.; Karabulut, I. Determination of Antioxidant Properties and β-Carotene in Orange Fruits and Vegetables by an Oxidation Voltammetric Assay. Anal. Lett. 2022, 55, 891–903. [Google Scholar] [CrossRef]
- Harnisch, F.; Freguia, S. A basic tutorial on cyclic voltammetry for the investigation of electroactive microbial biofilms. Chem. Asian J. 2012, 7, 466–475. [Google Scholar] [CrossRef]
- Ricci, A.; Parpinello, G.P.; Teslić, N.; Kilmartin, P.A.; Versari, A. Suitability of the cyclic voltammetry measurements and DPPH• spectrophotometric assay to determine the antioxidant capacity of food-grade oenological tannins. Molecules 2019, 24, 2925. [Google Scholar] [CrossRef] [Green Version]
- Pastor, F.T.; Šegan, D.M.; Gorjanović, S.Ž.; Kalušević, A.M.; Sužnjević, D.Ž. Development of voltammetric methods for antioxidant activity determination based on Fe (III) reduction. Microchem. J. 2020, 155, 104721. [Google Scholar] [CrossRef]
- Jiao, Y.; Kilmartin, P.A.; Fan, M.; Quek, S.Y. Assessment of phenolic contributors to antioxidant activity of new kiwifruit cultivars using cyclic voltammetry combined with HPLC. Food Chem. 2018, 268, 77–85. [Google Scholar] [CrossRef]
- Wang, H.-W.; Bringans, C.; Hickey, A.J.; Windsor, J.A.; Kilmartin, P.A.; Phillips, A.R. Cyclic Voltammetry in Biological Samples: A Systematic Review of Methods and Techniques Applicable to Clinical Settings. Signals 2021, 2, 12. [Google Scholar] [CrossRef]
- Li, X.; Qin, Z.; Fu, H.; Li, T.; Peng, R.; Li, Z.; Rini, J.M.; Liu, X. Enhancing the performance of paper-based electrochemical impedance spectroscopy nanobiosensors: An experimental approach. Biosens. Bioelectron. 2021, 177, 112672. [Google Scholar] [CrossRef] [PubMed]
- Han, Q.; Pang, J.; Li, Y.; Sun, B.; Ibarlucea, B.; Liu, X.; Gemming, T.; Cheng, Q.; Zhang, S.; Liu, H. Graphene Biodevices for Early Disease Diagnosis Based on Biomarker Detection. ACS Sens. 2021, 6, 3841–3881. [Google Scholar] [CrossRef] [PubMed]
- Belli, S.; Rossi, M.; Molasky, N.; Middleton, L.; Caldwell, C.; McKenney, B.C.; Duong, M.; Chiu, J.; Gibbs, E.; Caldwell, A.; et al. Effective and novel application of hydrodynamic voltammetry to the study of superoxide radical scavenging by natural phenolic antioxidants. Antioxidants 2019, 8, 14. [Google Scholar] [CrossRef] [PubMed] [Green Version]
- Reddy, Y.M.; Kumar, S.P.; Saritha, K.V.; Gopal, P.; Reddy, T.M.; Gandara, S.J. Phytochemical profiling of methanolic fruit extract of Gardenia latifolia Ait. by LC-MS/MS analysis and evaluation of its antioxidant and antimicrobial activity. Plants 2021, 10, 545. [Google Scholar] [CrossRef] [PubMed]
- Percevault, L.; Limanton, E.; Nicolas, P.; Paquin, L.; Lagrost, C. Electrochemical Determination and Antioxidant Capacity Modulation of Polyphenols in Deep Eutectic Solvents. ACS Sustain. Chem. Eng. 2020, 9, 776–784. [Google Scholar] [CrossRef]
- David, M.; Serban, A.; Radulescu, C.; Danet, A.F.; Florescu, M. Bioelectrochemical evaluation of plant extracts and gold nanozyme-based sensors for total antioxidant capacity determination. Bioelectrochemistry 2019, 129, 124–134. [Google Scholar] [CrossRef]
- Tufan, A.N.; Baki, S.; Guclu, K.; Ozyurek, M.; Apak, R. A novel differential pulse voltammetric (DPV) method for measuring the antioxidant capacity of polyphenols-reducing cupric neocuproine complex. J. Agric. Food Chem. 2014, 62, 7111–7117. [Google Scholar] [CrossRef]
- Piszcz, P.; Głód, B.K. Antioxidative properties of selected polish honeys. J. Apic. Sci. 2019, 63, 81–91. [Google Scholar] [CrossRef] [Green Version]
- Della Pelle, F.; Compagnone, D. Nanomaterial-based sensing and biosensing of phenolic compounds and related antioxidant capacity in food. Sensors 2018, 18, 462. [Google Scholar] [CrossRef] [Green Version]
- Latos-Brozio, M.; Masek, A.; Chrzescijanska, E.; Podsędek, A.; Kajszczak, D. Characteristics of the Polyphenolic Profile and Antioxidant Activity of Cone Extracts from Conifers Determined Using Electrochemical and Spectrophotometric Methods. Antioxidants 2021, 10, 1723. [Google Scholar] [CrossRef] [PubMed]
- Belfar, A.; Bensaci, C.; Belguidoum, M. Evaluation of Antioxidant Capacity by Cyclic Voltammetry of Phoenix dactylifera L.(date palm). Asian J. Res. Chem. 2022, 15, 138–144. [Google Scholar] [CrossRef]
- Nikolic, M.; Pavlovic, A.; Mitic, S.; Tosic, S.; Mitic, M.; Kalicanin, B.; Manojlovic, D.; Stankovic, D. Use of cyclic voltammetry to determine the antioxidant capacity of berry fruits: Correlation with spectrophotometric assays. Eur. J. Hortic. Sci. 2019, 84, 152–160. [Google Scholar] [CrossRef] [Green Version]
- Vasyliev, G.S.; Vorobyova, V.I.; Linyucheva, O.V. Evaluation of reducing ability and antioxidant activity of fruit pomace extracts by spectrophotometric and electrochemical methods. J. Anal. Methods Chem. 2020, 2020, 8869436. [Google Scholar] [CrossRef]
- Aslışen, B.; Koçak, Ç.C.; Koçak, S. Electrochemical determination of sesamol in foods by square wave voltammetry at a boron-doped diamond electrode. Anal. Lett. 2020, 53, 343–354. [Google Scholar] [CrossRef]
- Karimi, F.; Bijad, M.; Farsi, M.; Vahid, A.; Bami, A.H.; Wen, Y.; Ganjali, M.R. A new nanostructure square wave voltammetric platform for determination of tert-butylhydroxyanisole in food samples. Curr. Anal. Chem. 2019, 15, 172–176. [Google Scholar] [CrossRef]
- Angelis, N.P.; Mendonça, C.J.; da Rocha, R.L.; Capelari, B.T.; Prete, C.M.; Segatelli, G.M.; Borsato, D.; Tarley, R.T.C. Feasibility of a Nano-Carbon Black Paste Electrode for Simultaneous Voltammetric Determination of Antioxidants in Food Samples and Biodiesel in the Presence of Surfactant. Electroanalysis 2020, 32, 1198–1207. [Google Scholar] [CrossRef]
- Vicuña, G.C.; Pizarro, S.; Labarca, B.V.; Delgadillo, A. A square wave voltammetry study on the antioxidant interaction and effect of extraction method for binary fruit mixture extracts. J. Chem. 2019, 2019, 8706061. [Google Scholar]
- Brainina, K.Z.; Varzakova, D.P.; Gerasimova, E.L. A chronoamperometric method for determining total antioxidant activity. J. Anal. Chem. 2012, 67, 364–369. [Google Scholar] [CrossRef]
- Porfírio, D.A.; Ferreira, Q.R.; Malagutti, A.R.; Valle, E.M. Electrochemical study of the increased antioxidant capacity of flavonoids through complexation with iron (II) ions. Electrochim. Acta 2014, 141, 33–38. [Google Scholar] [CrossRef]
- Tirawattanakoson, R.; Rattanarat, P.; Ngamrojanavanich, N.; Rodthongkum, N.; Chailapakul, O. Free radical scavenger screening of total antioxidant capacity in herb and beverage using graphene/PEDOT: PSS-modified electrochemical sensor. J. Electroanal. Chem. 2016, 767, 68–75. [Google Scholar] [CrossRef]
- Ziyatdinova, G.K.; Kozlova, E.V.; Budnikov, H.C. Chronoamperometric evaluation of the antioxidant capacity of tea on a polyquercetin-modified electrode. J. Anal. Chem. 2017, 72, 382–389. [Google Scholar] [CrossRef]
- de Macêdo, I.Y.L.; Garcia, L.F.; Neto, J.R.O.; de Siqueira Leite, K.C.; Ferreira, V.S.; Ghedini, P.C.; de Souza Gil, E. Electroanalytical tools for antioxidant evaluation of red fruits dry extracts. Food Chem. 2017, 217, 326–331. [Google Scholar] [CrossRef] [PubMed]
- Hoyos-Arbeláez, J.; Blandón-Naranjo, L.; Vázquez, M.; Contreras-Calderón, J. Antioxidant capacity of mango fruit (Mangifera indica). An electrochemical study as an approach to the spectrophotometric methods. Food Chem. 2018, 266, 435–440. [Google Scholar] [CrossRef]
- Zielińska, D.; Turemko, M. Electroactive phenolic contributors and antioxidant capacity of flesh and peel of 11 apple cultivars measured by cyclic voltammetry and HPLC–DAD–MS/MS. Antioxidants 2020, 9, 1054. [Google Scholar] [CrossRef]
- Amamra, S.; Charef, N.; Arrar, L.; Belhaddad, O.; Khennouf, S.; Zaim, K.; Baghiani, A. Phenolic content, antioxidant and antibacterial effects of fruit extracts of Algerian ash, Fraxinus excelsior. Indian J. Pharm. Sci. 2018, 80, 1021–1028. [Google Scholar] [CrossRef] [Green Version]
- Kostka, T.; Ostberg-Potthoff, J.J.; Stärke, J.; Guigas, C.; Matsugo, S.; Mirčeski, V.; Stojanov, L.; Veličkovska, S.K.; Winterhalter, P.; Esatbeyoglu, T. Bioactive phenolic compounds from Lingonberry (Vaccinium vitis-idaea L.): Extraction, chemical characterization, fractionation and cellular antioxidant activity. Antioxidants 2022, 11, 467. [Google Scholar] [CrossRef]
- Stevanović, M.; Stevanović, S.; Mihailović, M.; Kiprovski, B.; Bekavac, G.; Mikulič-Petkovšek, M.; Lović, J. Antioxidant capacity of dark red corn–Biochemical properties coupled with electrochemical evaluation. Rev. Chim. 2020, 71, 31–41. [Google Scholar] [CrossRef]
- Pilaquinga, F.; Morey, J.; Fernandez, L.; Espinoza-Montero, P.; Moncada-Basualto, M.; Pozo-Martinez, J.; Olea-Azar, C.; Bosch, R.; Meneses, L.; Debut, A. Determination of Antioxidant Activity by Oxygen Radical Absorbance Capacity (ORAC-FL), Cellular Antioxidant Activity (CAA), Electrochemical and Microbiological Analyses of Silver Nanoparticles Using the Aqueous Leaf Extract of Solanum mammosum L. Int. J. Nanomed. 2021, 16, 5879. [Google Scholar] [CrossRef]
- Jara-Palacios, M.J.; Escudero-Gilete, M.L.; Hernández-Hierro, J.M.; Heredia, F.J.; Hernanz, D. Cyclic voltammetry to evaluate the antioxidant potential in winemaking by-products. Talanta 2017, 165, 211–215. [Google Scholar] [CrossRef]
- García-Carvajal, E.; Blandón-Naranjo, L.; Villa-Montoya, V.; Vázquez, M.V.; Peláez-Jaramillo, C. Electrochemical Approach to the Study of the Antioxidant Capacity of Vaccinium Meridionale Swart at Different Ripening Stages. Port. Electrochim. Acta 2019, 37, 71–82. [Google Scholar] [CrossRef]
- Issaad, F.Z.; Fernandes, I.P.; Enache, T.A.; Mouats, C.; Rodrigues, I.A.; Oliveira-Brett, A.M. Flavonoids in selected Mediterranean fruits: Extraction, electrochemical detection and total antioxidant capacity evaluation. Electroanalysis 2017, 29, 358–366. [Google Scholar] [CrossRef]
- Khiya, Z.; Oualcadi, Y.; Gamar, A.; Berrekhis, F.; Zair, T.; Hilali, F.E. Correlation of total polyphenolic content with antioxidant activity of hydromethanolic extract and their fractions of the Salvia officinalis leaves from different regions of Morocco. J. Chem. 2021, 2021, 8585313. [Google Scholar] [CrossRef]
- Munteanu, I.G.; Apetrei, C. A Review on Electrochemical Sensors and Biosensors Used in Assessing Antioxidant Activity. Antioxidants 2022, 11, 584. [Google Scholar] [CrossRef] [PubMed]
- Amamra, S.; Cartea, M.E.; Belhaddad, O.E.; Soengas, P.; Baghiani, A.; Kaabi, I.; Arrar, L. Determination of total phenolics contents, antioxidant capacity of Thymus vulgaris extracts using electrochemical and spectrophotometric methods. Int. J. Electrochem. Sci 2018, 13, 7882–7893. [Google Scholar] [CrossRef]
- Chochevska, M.; Jančovska Seniceva, E.; Veličkovska, S.K.; Naumova-Leţia, G.; Mirčeski, V.; Rocha, J.M.F.; Esatbeyoglu, T. Electrochemical Determination of Antioxidant Capacity of Traditional Homemade Fruit Vinegars Produced with Double Spontaneous Fermentation. Microorganisms 2021, 9, 1946. [Google Scholar] [CrossRef]
- Fuentes, E.; Alcañiz, M.; Contat, L.; Baldeón, E.O.; Barat, J.M.; Grau, R. Influence of potential pulses amplitude sequence in a voltammetric electronic tongue (VET) applied to assess antioxidant capacity in aliso. Food Chem. 2017, 224, 233–241. [Google Scholar] [CrossRef]
- Guediri, I.; Boubekri, C.; Smara, O.; Lanez, T. Total phenolic contents and determination of Antioxidant activity by DPPH, FRAP, and cyclic voltammetry of the fruit of Solanum nigrum (black nightshade) growing in the south of Algeria. Asian J. Res. Chem. 2021, 14, 47–55. [Google Scholar] [CrossRef]
- Aravena-Sanhueza, F.; Pérez-Rivera, M.; Castillo-Felices, R.; Mundaca-Uribe, R.; Aranda Bustos, M.; Peña Farfal, C. Determination of antioxidant capacity (orac) of Greigia sphacelata and correlation with voltammetric methods. J. Chil. Chem. Soc. 2020, 65, 4925–4928. [Google Scholar] [CrossRef]
- de Menezes Peixoto, C.R.; Fraga, S.; da Rosa Justim, J.; Gomes, M.S.; Carvalho, D.G.; Jarenkow, J.A.; de Moura, N.F. Voltammetric determination of total antioxidant capacity of Bunchosia glandulifera tree extracts. J. Electroanal. Chem. 2017, 799, 519–524. [Google Scholar] [CrossRef]
- Oualcadi, Y.; Aityoub, A.; Berrekhis, F. Investigation of different antioxidant capacity measurements suitable for bioactive compounds applied to medicinal plants. J. Food Meas. Charact. 2021, 15, 71–83. [Google Scholar] [CrossRef]
- Barbosa, G.B.; Gomez, E.C.; Inutan, E.D.V. Cyclic voltammetry and spectrophotometric determination of antioxidant activities of selected Ginger Species. Asian J. Biol. Life Sci. 2018, 7, 98–104. [Google Scholar] [CrossRef] [Green Version]
- Mahmood, A.; Saqib, M.; Ali, M.; Abdullah, M.I.; Khalid, B. Theoretical investigation for the designing of novel antioxidants. Can. J. Chem. 2013, 91, 126–130. [Google Scholar] [CrossRef]
- Saqib, M.; Iqbal, S.; Mahmood, A.; Akram, R. Theoretical investigation for exploring the antioxidant potential of chlorogenic acid: A density functional theory study. Int. J. Food Prop. 2016, 19, 745–751. [Google Scholar] [CrossRef] [Green Version]
- Mahmood, A.; Wang, J.L. A time and resource efficient machine learning assisted design of non-fullerene small molecule acceptors for P3HT-based organic solar cells and green solvent selection. J. Mater. Chem. A 2021, 9, 15684–15695. [Google Scholar] [CrossRef]
- Mahmood, A.; Wang, J.L. Machine learning for high performance organic solar cells: Current scenario and future prospects. Energy Environ. Sci. 2021, 14, 90–105. [Google Scholar] [CrossRef]


| Classification | Assays | Mechanism Involved | Main Protocol | Advantages/Disadvantages | Detection Technique | Ref. |
|---|---|---|---|---|---|---|
| Chemical-Based Assays | ||||||
| ROS/free radical-based scavenging assay | TEAC/ABTS assay | ET mechanism and HAT mechanism(Mixed mechanisms) | The AOC is estimated by studying the color diminishing capability of the sample. The ABTS+ radicals are colored and generated in the medium by the interaction of ABTS with K2S2O8. The antioxidant reaction with this organic radical provides the information regarding the AOC of the sample | Advantages Rapid. Facile. Natural and synthetic antioxidant samples are studied. Assay can be applied over large pH ranges. Hydrophilic and hydrophobic antioxidants can be studied. Disadvantages Precision is moderate. The result of the assay depends upon the reaction time, which lowers the chance of comparative analysis. The steric hindrance and molecular size of the ABTS+ radical make it difficult for the antioxidants present in the medium to interact with this radical. | Calorimetry. Spectroscopy (decrease in the absorbance value at 743 nm). | [16] |
| ORAC assay | The radical chain-breaking potential of the antioxidants present in the sample by blocking the peroxy radical generation of AAPH. The peroxy radicals react with the fluorescent probe to generate the non-fluorescent product. | Advantages Food-based samples involving the peroxy radicals (lipid oxidation) can be properly assessed by this assay. Rapid. Can be automated. Disadvantages A competitive technique where the antioxidant and fluorescent probe compete for scavenging the peroxy radicals. Use of fluorescent probe (ß-PE) can cause false ORAC readings. For studying the AOC for hydrophilic and hydrophobic antioxidants, the modification of ORAC assays is required. | Fluorimetry (decrease in the fluorescence intensity area under the curve of fluorescence intensity versus time graph). Quantification of the non-fluorescent product generated. | [17] | ||
| TRAP assay | The luminol-enhanced chemiluminescence owing to the presence of the luminol-derived radicals (generated due to the AAPH thermal decomposition) is quenched by the antioxidants present in the sample. | Advantages Rapid. Change can be visually observed. Disadvantages Laborious and complex methodology to perform. The antioxidants that do not have a clear lag phase cannot be detected by using TRAP assay. Low reproducibility. | Quenching of chemiluminescence. The duration of the lag phase is utilized for the quantification of the antioxidant. | [18] | ||
| ß-Carotene bleaching assay | Aqueous emulsion of ß-carotene and linoleic acid generates the free radical in the medium owing to the spontaneous oxidation of the fatty acids. The sample is decolorized owing to the presence of antioxidants in the medium. | Advantages Rapid. Change can be visually observed. Can screen both the hydrophobic and hydrophilic antioxidants. Disadvantages ß-Carotene is sensitive to temperature and pH change which causes the errors in reading. Low reproducibility. | Calorimetry. Spectroscopy (decrease in the absorbance at 470 nm). | [19] | ||
| DPPH assay | The AOC is estimated by studying the decrease in the absorbance value at 517 nm associated with the DPPH· radical. The antioxidant reaction with this organic radical lowers the concentration of the radical in the medium that expresses itself by the reduction in the absorbance intensity at the characteristic wavelength of the radical. | Advantages Rapid. Facile. Low cost. Disadvantages Lacking standardization. The reaction parameters (including pH, solvent, dissolved oxygen, exposure to light radiations, etc.) affect the AOC values. This kinetic fact is generally ignored. The steric hindrance and molecular size of the DPPH· radical make it difficult for the antioxidants present in the medium to interact with this radical. DPPH is not favorable for ranking the antioxidants owing to its dependence on numerous uncontrollable factors. | Calorimetry. Spectroscopy (decrease in the absorbance at 517 nm). | [16] | ||
| TOSC assay | The oxidation of KMBA results in the formation of ethylene by ROS. Presence of antioxidants inhibits the formation of ethylene. | Advantages Rapid. Facile. Low cost Disadvantages Low accuracy. | Headspace gas chromatography for the determination of ethylene. | [20] | ||
| Redox potential based assay (non-radical based assays) | CUPRAC assay | ET mechanism | Potential of antioxidants to reduce the Cu2+ ions into the Cu1+ ions is utilized as a means to estimate the AOC. The Cu1+ ions form a complex with neocuproine or bathocuproine, which is detected by spectrophotometric analysis. | Advantages Rapid. Facile. Hydrophilic and lyophilic antioxidants can be studied. Disadvantages Require the specific pH. Variation in the pH makes this method ineffective as the complex formation is hindered. CUPRAC cannot measure the HAT mechanism and therefore, it cannot be utilized to study the intracellular fluids and the human blood plasma/serum. | Calorimetry. Spectroscopy (appearance of absorption band at 450 nm and 490 nm in case of neocuproine and bathocuproine, respectively). | [21] |
| FRAP assay | Potential of antioxidants to reduce the [Fe3+-(TPTZ)2]3+ complex into the [Fe2+-(TPTZ)2]2+ is utilized as a means to estimate the AOC. | Advantages Rapid. Facile. Disadvantages Require the acidic medium. Variation in the pH makes this method ineffective as the iron complex undergoes precipitation. FRAP cannot measure the HAT mechanism and therefore, it cannot be utilized to study the intracellular fluids and the human blood plasma/serum. | Calorimetry Spectroscopy (increase in the absorption values at 593 nm). | [21] | ||
| TPC or FCR assay | The Folin–Ciocalteu reagent in a strong basic environment generates the phenolate anions, which are reduced by the phenolic antioxidants present in the sample. | Advantages Rapid. TPC/FCR assay determines the total antioxidant assay. Operationally simple. Reproducible. Disadvantages Non-phenolic compounds can interfere with the Folin–Ciocalteu reagent and cause error in the readings. Strong basic environment is required. | Colorimetry Spectroscopy (appearance of blue-colored chromophore having maximum wavelength values in the range of 620–765 nm). | [22] | ||
| Metal chelation capacity | Chelation effects of antioxidants for the quenching of the metal ions (ferrous ions) are used as a means to measure the AOC values. | Advantage Utilized to study the AOC value of the secondary antioxidants. The test provides the accurate assessment of the antioxidant potential of compounds during lipid peroxidation. Disadvantages Standardization of the protocol is required. | Spectroscopy (decrease in absorbance intensity of Fe2+-ferrozinen at 562 nm). | [23] | ||
| Biochemical based assay | ||||||
| In vivo assay | LDL assay | ET/HAT mechanisms | The oxidation capacity of LDL lipid peroxidation is reduced owing to the presence of antioxidants. | Advantage Utilized to study the AOC value of the secondary antioxidants. The test provides an accurate assessment of the antioxidant potential of compounds during lipid peroxidation. Endogenous antioxidants can be studied by using the LDL assay. Disadvantages Standardization of the protocol is required. Mechanism involved in the quenching requires further exploration. | Chemiluminescent (radiations emitted by the oxidative products). Spectroscopy (formation of diene conjugates at 234 nm). | [24] |
| TBARS assay | The unsaturated lipid degradation results in the formation of MDA in the presence of ROS, and this MDA interact with TBA to produce [MDA-(TBA)2] complex. The presence of antioxidants reduces the formation of this complex, which is used as a tool to measure the AOC of the antioxidant. | Advantage Utilized to study the AOC value of the secondary antioxidants. The test provides an accurate assessment of the antioxidant potential of compounds during lipid peroxidation. Disadvantages It is a pH-dependent procedure. Acidic pH and temperature values of 100 °C are essential for carrying out the reaction. | Calorimetry Spectroscopy (Reduction in the [MDA-(TBA)2] complex presents the absorption band at 532 nm). | [25] | ||
| CAA assay | Within the cell medium, the DCFH-DA is deacylated by cellular enzymes to generate DCFH within the cells. The peroxy radicals formed from AAPH easily cross the cellular membrane and convert the DCFH into fluorescent DCF. The presence of the antioxidants reduces the DCF generation. | Advantage The performance of the test within the cell medium makes this test the best representative test for studying antioxidants present within the cell. Dietary supplements, food samples, beverages, and other biogenic samples can be studied by using this assay. Disadvantages It is a complex test with intercalated mechanisms. The results acquired from the CAA assay do not correlate well with the chemical assays. | Fluorimetry (Decrease in the fluorescence intensity). | [26] | ||
| Detection Method | Samples Analysed for Antioxidant Capacity | Nature of the Sample | Detection Assay | Application of Antioxidant | Ref. |
|---|---|---|---|---|---|
| Spectroscopic methods | Red propolis extracts | Natural | Multivariate analysis (determining phenolic compounds and their bioactive properties) DPPH assay The reducing power assay β-carotene assay | Several types of biological activities were documented attributed to its chemical constituents | [29] |
| Aqueous and methanolic extracts from A. fragrans leaves (Two dihydrochalcone glycosides named confusoside and vacciniifolin) | Natural Extract | DPPH assay ABTS assay FRAP assay | A bioactive functional plant and the leaves of A. fragrans could be used as a potential source of natural antioxidants for food and pharmaceutical applications | [30] | |
| Co (II) and Fe (II) complexes of Schiff base | Synthetic | In vitro assays FRAP assay CUPRAC assay ABTS assay DPPH assay Enzyme inhibition studies. | Antioxidant activities and enzyme inhibition determination were carried out. The best inhibitor complex for CA I and II isoenzymes was the Fe(II) complex with Ki values of 52.83 ± 11.52 and 63.34 ± 8.88, respectively | [31] | |
| Caffeic acid grafted chitosan | Synthetic | DPPH assay | A novel dual-functional stabilizer for food-grade emulsions and additive antioxidant property | [32] | |
| γ-alumina nanoparticles | Synthetic | DPPH assay Computational methods (DFT-D studies) | Radical scavenging performance and antioxidant activity | [33] | |
| Chromatographic Methods | Achillea Arabica Contents of phenolics, including caffeoylquinic acid derivatives, quercetin, luteolin, apigenin and some of their derivatives | Natural | HPLC-PDA fingerprint analysis ABTS assay FRAP assays. | It can be incorporated in food and pharmaceutical applications | [34] |
| Essential antioxidant algal pigments present in marine algae (S. vulgare, C. barbata brown, and F. petiolata green algae species) | Natural | CUPRAC assay ABTS assay HPLC | Potentially rich sources of valuable nutrients and the favorable choice in many different industrial fields: hydrocolloid extraction, fertilizers, extracts for cosmetics and pharmaceuticals, biofuels, bioplastics, and wastewater treatment | [35] | |
| Flavone triglycosides identified in sugarcane molasses (Chrysoeriol-C-glycosides such as scoparin | Natural | ABTS assay CAA assays LCMSs | Can be used as potential source of polyphenols that can be beneficial to health | [36] | |
| Mulberry leaf (Prenylated phenolics a, moracin N) | Natural | DPPH assay CAA assay HPLC UHPLC | Multiple health benefits | [37] | |
| Electrochemical methods | Citrus peel residues (flavedo) | Natural | CUPRAC assay DPPH assay | Food, pharmaceutical and cosmetic industries | [38] |
| Plant tea samples such as green tea, lime, and coral moss | Natural | Voltammetry | Nutritional science | [39] | |
| quinones: Mansanone-D, Mansanone-H, Sissoidenone and 4-methoxy dalbergione isolated from Dalbergia sissoides | Natural | CV | Antioxidant activity and strong interaction with DNA | [40] |
| Studied Extract | Extract Type | Conventional Techniques | Electrochemical Techniques | Electrodes | Parameter Identified | Remarks | Ref. |
|---|---|---|---|---|---|---|---|
| Zespri® Sweet Green kiwifruit (Actinidia chinensis x Actinidia deliciosa) | Flesh and skin extract of the kiwi fruit | For phenolic contents: TPC analysis TFC analysis TAC analysis ABTS assay DPPH assay FRAP assay | CV coupled with the HPLC | Reference Electrode: Ag/AgCl electrode Working Electrode: Glassy carbon electrode | Identification of phenolic contents by comparing them with the phenolic standards. Identified phenolic components: Catechin Gallic acid Protocatechuic acid Vanillic acid Caffeic acid Syringic acid Epicatechin Epigallocatechin gallate p-Coumaric acid Rutin Ferulic acid Epicatechin gallate Quercetin trans-Cinnamic acid The reducing potential and AOC of these compounds were studied by using the parameters of Epa, Ipa and Q500. | Among the fourteen identified phenolic components, CV was able to identify the nine antioxidant molecules present in the extract. Moreover, CV was identified to be the better technique in comparison to the spectroscopic and antioxidants assays as it records the total AOC values in comparison to the particular mechanism (scavenging, ability to reduce metal, or lipid peroxidation inhibition. One drawback that was observed in case of CV technique was that the ascorbic acid could not be studied through this, while other techniques detected it in the phytochemical profiling. | [50] |
| Zespri® SunGold Kiwifruit (Actinidia chinensis) | |||||||
| Hayward commercial fruit | |||||||
| Vitis vinifera L. (Grape pomace) | Grape pomace (seed, skin and stem extract) | TPC analysis TBARS assay | CV | Three-electrode system Reference system: Ag/AgCl electrodeWorking electrode: Glassy carbon electrode Auxiliary electrode: Platinum wire | Identification of electrochemical phenolic compounds: (3′, 4′-dihydroxyl moiety of phenolic compounds). The Q500 parameter was used to identify the total phenolic content of the extract. The Ipc, Ipa, Epa, Epc, and Emid parameters are utilized to investigate the following observables: Total AOC of the extracts Byproducts after the antioxidant reaction Concentration of antioxidantsElectrochemical mechanism | Individual phenols are not detected. Correlation between the TBARS and CV was studied by Pearson’s correlation. | [80] |
| Greigia Sphacelata | Fruit | ORAC test | DPV | Three-electrode system Reference system: Ag/AgCl electrodeWorking electrode: Glassy carbon electrode Auxiliary electrode: Platinum wire | Current, potential and area under the current-potential curve are the main Electrochemical parameters utilized to investigate the AOC potential of the sample. | Despite differences in the operating mechanism of the utilized assays of ORAC assay (fluorescent method) and DPV (an electrochemical method), Pearson’s correlation test revealed that both methods exhibited a correlation value of 0.969 with each other. The authors also reported that the understudy sample has very low antioxidant activity values. | [88] |
| Solanum nigrum | Black nightshade fruit | TPC analysis TFC analysis TAC analysis DPPH assay FRAP assay | CV | Three-electrode system Reference system: Hg/Hg2Cl2 electrode Working electrode: Glassy carbon electrode Auxiliary electrode: Platinum wire | Epa and Ipa values were used to estimate the AOC values of the fruit extract. The higher Ipa values were co-related with, the higher antioxidant activity. The shape of the voltammogram (i.e., absence of the cathodic peak) was used to obtain information regarding the irreversibility of the phenolic components present in the extract. | Superoxide radical scavenging assay was utilized as a means to study the AOC values by using the CV technique, indicating that CV can be used to investigate the ability of the extract to quench the superoxide radical. Ethyl acetate extract of fruit expressed better AOC and scavenging results in comparison to chloroform and n-butanol extract of the fruit. | [89] |
| Phoenix dactylifera. L. | Date palm fruit | TPC analysis TFC analysis DPPH assay FRAP assay | CV | Three-electrode system Reference system: Hg/Hg2Cl2 electrode Working electrode: Glassy carbon electrode Auxiliary electrode: Platinum wire | Reduction in the Ipa values associated with the superoxide radical was used as a representation tool indicating the decrease in the concentration of radical owing to the presence of phytochemicals in the extract. The shape of voltammogram is used for studying the irreversibility of the phytochemicals involved. | Authors observed that spectrophotometer suffers from the drawback that phytochemicals exhibit the peaks in the same range and, consequently, are not properly identified by spectroscopic techniques. The electrochemical method removes this problem. | [62] |
| Bunchosia glandulifera | Seed, bark, leaf and root extract | TPC analysis β-Carotene test Ascorbic acid test DPPH assay FRAP assay ABTS assay | CV DPV | Three-electrode system Reference system: Ag/AgCl electrode Working electrode: Glassy carbon electrode Auxiliary electrode: Platinum wire | Current, potential and area under the current-potential curve are the main electrochemical parameters utilized to investigate the AOC potential of the sample | The solvent of DMSO is noxious and its use as a solvent should not be encouraged. However, the study presented an excellent comparison between electrochemical methodologies and revealed that the CV showed better linearity in the case of the DPV. Furthermore, the authors found the AOC value of the seed extract presented the best results among all other extracts. | [90] |
| Punica granatum L. | Pomegranate peels | TPC analysis TFC analysis TCT analysis DPPH assay FRAP assay | CV | Three-electrode system Reference system: Ag/AgCl electrode Working electrode: Glassy carbon electrode Auxiliary electrode:Platinum wire | Anodic current, anodic potential and area under the current-potential curve are the main electrochemical parameters utilized to investigate the AOC potential of the sample. | The extraction of the phenolic components was performed by using the response surface methodology (RSM). The authors identified that the AOC potential of the five medicinal plants exhibited almost 36 times lower efficacy in comparison to the ascorbic acid-based test, indicating that the CV is not suitable for measuring the AOC value for the extracts containing the high molecular weight antioxidants. | [91] |
| Argania spinosa L. | Argan hull | ||||||
| Corrigiola telephiifolia Pourr. | Serghina | ||||||
| Prunus dulcis | Almond | ||||||
| Rubia tinctorum L. | Madder root |
Publisher’s Note: MDPI stays neutral with regard to jurisdictional claims in published maps and institutional affiliations. |
© 2022 by the authors. Licensee MDPI, Basel, Switzerland. This article is an open access article distributed under the terms and conditions of the Creative Commons Attribution (CC BY) license (https://creativecommons.org/licenses/by/4.0/).
Share and Cite
Alam, M.W.; Najeeb, J.; Naeem, S.; Usman, S.M.; Nahvi, I.; Alismail, F.; Abuzir, A.; Farhan, M.; Nawaz, A. Electrochemical Methodologies for Investigating the Antioxidant Potential of Plant and Fruit Extracts: A Review. Antioxidants 2022, 11, 1205. https://doi.org/10.3390/antiox11061205
Alam MW, Najeeb J, Naeem S, Usman SM, Nahvi I, Alismail F, Abuzir A, Farhan M, Nawaz A. Electrochemical Methodologies for Investigating the Antioxidant Potential of Plant and Fruit Extracts: A Review. Antioxidants. 2022; 11(6):1205. https://doi.org/10.3390/antiox11061205
Chicago/Turabian StyleAlam, Mir Waqas, Jawayria Najeeb, Sumaira Naeem, Sheikh Muhammad Usman, Insha Nahvi, Fai Alismail, Alaaedeen Abuzir, Mohd Farhan, and Allah Nawaz. 2022. "Electrochemical Methodologies for Investigating the Antioxidant Potential of Plant and Fruit Extracts: A Review" Antioxidants 11, no. 6: 1205. https://doi.org/10.3390/antiox11061205