
Melatonin Alleviates Oxidative Stress Induced by H2O2 in Porcine Trophectoderm Cells


1
College of Animal Science and Technology, Henan Agricultural University, Zhengzhou 450000, China
2
Institute of Subtropical Agriculture, Chinese Academy of Sciences, Changsha 410125, China
*
Author to whom correspondence should be addressed.
Antioxidants 2022, 11(6), 1047; https://doi.org/10.3390/antiox11061047
Submission received: 15 April 2022
/
Revised: 13 May 2022
/
Accepted: 18 May 2022
/
Published: 25 May 2022
(This article belongs to the Special Issue Oxidative Stress, Reactive Oxygen Species and Animal Nutrition)
Abstract
:Placental oxidative stress has been implicated as a main risk factor for placental dysfunction. Alleviation of oxidative stress and enhancement of antioxidant capacity of porcine trophectoderm (PTr2) cells are effective means to maintaining normal placental function. The present study was conducted to evaluate the protective effect of melatonin (MT) on H2O2-induced oxidative damage in PTr2 cells. Our data revealed that pretreatment with MT could significantly improve the decrease in cell viability induced by H2O2, and reduce intracellular reactive oxygen species (ROS) levels and the ratio of apoptotic cells. Here, we compared the transcriptomes of untreated versus melatonin-treated PTr2 cells by RNA-seq analysis and found that differentially expressed genes (DEGs) were highly enriched in the Wnt signaling, TGF-beta signaling and mTOR signaling pathways. Moreover, pretreatment with MT upregulated the antioxidant-related genes such as early growth response3 (EGR3), WAP four-disulfide core domain1 (WFDC1), heme oxygenase1 (HMOX1) and vimentin (VIM). These findings reveal that melatonin protects PTr2 cells from H2O2-induced oxidative stress damage.
1. Introduction
Pregnancy is particularly sensitive to oxidative stress, defined as increased basal oxygen consumption in both the fetus and the mother [1]. Numerous factors can trigger oxidative stress during gestation. The placenta plays an important role in maintaining fetal and maternal homeostasis, is rich in mitochondria and consumes approximately 1% of the basal metabolic rate of the mother when fully developed [2]. Meanwhile, the placental environment transforms from a hypoxic environment to an oxygen-rich environment as the placenta matures and its vascularization develops. Considering, the placenta’s significant mitochondrial mass, high metabolic rate and oxygen-rich environment, the generation of ROS increases in the placenta, which is easily subjected to a degree of oxidative stress.
During pregnancy, the placenta is susceptible to oxidative stress and has a reduced antioxidant capacity, which can pose a potential problem for late animal reproduction and affect maternal homeostasis and fetal growth and development [3,4,5]. PTr2 cells are a significant cell type of the placenta, and they represent one of the earliest events of spectral differentiation in mammalian embryos [6,7,8]. Placental oxidative stress is involved in pregnancy complications, and previous studies have shown that oxidative stress of PTr2 cells can lead to pathological conditions of pregnancy (early pregnancy loss and impaired placentation) [9,10]. Therefore, improving the defensive ability of PTr2 cells to effectively counteract ROS generation is beneficial to maintaining fetal pig growth and increasing the productive performance of dams.
The imbalance between ROS production and antioxidant capacity leads to oxidative stress [11]. To prevent oxidative stress, the supply of antioxidants is essential. Although endogenous antioxidants help protect against oxidative damage, alone they are insufficient to solve the problem. In preclinical studies, antioxidants (vitamins C and E) can lower maternal oxidative stress during pregnancy, but decreased fetal growth and abnormal maternal blood pressure might occur with a certain probability [12]. There are few satisfactory treatment strategies for these conditions, thus, developing new strategies to alleviate oxidative stress is of great significance.
MT is an endogenous substance with antioxidant properties [13]. MT exerts antioxidative action through multiple pathways [14]. On the one hand, MT protects the body from the harmful effects of free radical damage [15,16]. On the other hand, MT alleviates oxidative stress and protects the ovaries from oxidative damage by elevating antioxidant enzyme activity [17,18]. The antioxidant effects of MT can protect cells from the damage of oxidative stress damage [19,20]. However, its protective effects against PTr2 cells oxidative stress and the underlying antioxidant mechanism have yet to be investigated.
In this study, we investigated the protective effects of MT against H2O2-induced oxidative damage in PTr2 cells. Our findings can provide a theoretical basis for the development of the clinical application of MT during pregnancy and provide guidance for developing effective nutritional strategies to improve sow health.
2. Materials and Methods
2.1. Cell Culture and Sample Preparation
The PTr2 cell line used in this experiment were previously established and characterized from porcine blastocysts (collected on day 12 of pregnancy) [21,22]. Cell cultures were grown under completely sterile conditions and kept incubated at 37 °C in a 5% carbon dioxide (CO2) atmosphere. When the culture reached 80−90% confluence, cells were detached from the culture flasks by 0.25% trypsin treatment and counted, and the concentration was adjusted to 104 cells/mL (0.1 mL) of DMEM/F12 complete medium for subsequent experiments.
Chemicals were purchased from Thermo Fisher Scientific (Fair Lawn, NJ, USA): 1% penicillin–streptomycin liquid (catalog #: 15140122); DMEM/Ham’s F-12 medium (DMEM/F12; catalog #: 11330032); 10% fetal bovine serum (FBS; catalog #: 10099141); and trypsin-EDTA (catalog #: 25200-056, purchased as 0.25%). Cell culture plates and plastic flasks were purchased from Corning Incorporated (Corning, NY, USA). MT was purchased from Sigma—Aldrich: (catalog #: M5250).
2.2. Evaluation of the Cell Protection against Oxidative Damage
To evaluate the protective effect against oxidative stress in PTr2 cells after treatment with MT, preliminary experiments were performed to determine assess cell viability and determine an appropriate concentration of H2O2 for subsequent experiments by the CCK-8 assay [23]. PTr2 cells were inoculated into 96-well plates, treated with 50, 100, 200 and 500 μM MT and cultured at 37 ℃ with 5% CO2 for 24 h. Then, the cells were stimulated with 120 μmol/L H2O2, and after 4 h, cell viability was measured by the CCK-8 assay [24]. The relative number of viable cells can be determined from the measured absorbance value (OD value). There were six replicate sets of wells per MT concentration.
Cell viability was calculated by the following formula:
Cell viability (%) = (treatment group OD − blank group OD)/(control group OD − blank group OD) × 100.
2.3. Apoptosis Detection
To further investigate whether MT could protect against H2O2-induced cell apoptosis in PTr2 cells, apoptosis rates were evaluated by flow cytometry using Annexin V-FITC/PI [25]. Based on the 2.2 testing, PTr2 cells were incubated in a 6-well plate (1 × 10⁵ cells/well) and pretreated with MT (0, 100, 250, 500 and 1000 μM) for 24 h, and subsequently treated with 120 μM H2O2 for 4 h. The cells were washed; 2 μg annexin-V FITC and 10 μL PI were added, and then the cells were incubated in the dark for 15 min and analyzed on a flow cytometer (ex488 nm and em578 nm, Becton Dickinson, San Jose, CA, USA).
2.4. Measurement of Intracellular ROS
The intracellular ROS levels were detected by flow cytometry using the ROS-specific fluorescence dichlorodihydrofluorescein diacetate (DCFH-DA) [26]. Based on the 2.2–2.3 testing, PTr2 cells were incubated in a 6-well plate and pretreated with MT (0, 250 and 500 μM) for 24 h, and subsequently treated with 120 μM H2O2 for 4 h. After that, cells washed twice with PBS, and then incubated with 10 μM DCFH-DA in PBS at 37 °C for 30 min. After the cells were collected and the fluorescence intensity of DCF was quantified on a FACS Calibur (λex/em = 488/525 nm). Then, mean intensity of ROS was collected from 1 × 10⁵ cell counts. Finally, the intracellular ROS levels and their analyses were performed using a FACS Calibur Flow Cytometer (BD Biosciences).
2.5. Transcriptome Sequencing
PTr2 cells were grouped based on reference to the transcriptome sequencing, and the cells were cultured in 6-well plates (1 × 10⁵ cells/well) with 500 μM MT and 120 μM H2O2 at the indicated time points, as described above. The PTr2 cell samples of three individuals (designed as biological replicates) in each of the four groups were subjected to high-throughput transcriptome sequencing, and the rest of the samples were reserved for standby using. Total mRNA was extracted from cells as previously described. RNA sequencing data were processed using Trimmomatic [27], gene expression calculation using cufflinks and the read counts of each gene were obtained by htseq-count [28,29], differentially expressed genes (DEGs) identification with the DESeq R package functions estimate size factors and the nbinom test [30], gene ontology (GO) enrichment analysis and pathway enrichment were performed using R based on the hypergeometric distribution [31,32]. The high-quality reads were aligned to the pig reference genome (UCSC susScr3) using Hisat2 software [33]. Then, the protein–protein interaction network (PPIs) information of these DEGs was predicted by the STRING database (version 11.5) [34]. After mapping the DEGs into this database, and a combined score ≥ 0.4 was exported [35]. Then, the PPIs of these DEGs were visualized in Cytoscape, and the hub genes among the PPI network were identified and ranked using the CytoHubba plugin and the maximal clique centrality (MCC) method of Cytoscape software (Version 3.8.2; The Cytoscape Consortium, New York, NY, USA).
The grouping information is as follows:
- (1)
- Control group: The PTr2 cells were cultured in basic growth medium (DMEM,10% FBS) were used as a control;
- (2)
- MT group: The PTr2 cells were treated for 24 h in a medium containing 500 μM MT;
- (3)
- H2O2 group: The PTr2 cells were grown in normal medium for 24 h, washed with PBS three times and treated with H2O2 for 4 h;
- (4)
- MT-H2O2 (MH) group: The PTr2 cells were grown in a medium containing 500 μM MT for 24 h, washed with PBS three times and treated with H2O2 for 4 h.
2.6. Real-Time PCR Analysis
To verify the data of RNA-Seq data, real-time quantitative PCR (qRT–PCR) was performed on six randomly selected DEGs. The β-actin gene was used as the reference gene, and the primers for the six genes were designed using Primer5. Real-time PCR was performed using the miScript SYBR Green PCR kit (Thermo) to detect the expression of DEGs on the Rocho Lightcycler 480II (Roche). We calculated the relative gene expression levels with the comparative CT method (referred to as the 2−△△CT method), with three replicates for each reaction [36].
2.7. Western Blot Analysis
PTr2 cells were cultured in different media and performed as described in the methods. After two washes with PBS, the cells were lysed with protein extraction reagent and harvested (Thermo Fisher Scientific Inc., Waltham, MA, USA) [37]. The protein concentrations were determined by using a BCA kit. All protein samples were diluted to an equal concentration using RIPA buffer. Western blot analysis was performed as previously described with minor modifications [38]. After protein concentration determination, the extracted proteins were loaded on a 10% separation gel and 4% concentration gel, and then transferred onto PVDF membranes. The proteins were sealed with 5% skimmed milk powder, and then incubated overnight with the indicated primary antibodies at 4 °C, followed by incubation at room temperature for 2 h with secondary antibodies. Experiments were conducted using the following primary antibodies: WFDC1 (1:500, OM117200, omnimAbs), HMOX1 (1:500, 27282-1-AP, Proteintech), MXI1 (1:500, OM105330, omnimAbs), PLAG1 (1:500, OM108610, omnimAbs), ViIM (1:200, OM115585, SANTA CRUZ), EGR3 (1:500, OM106724, omnimAbs) and β-actin (1:5000, 66009-1-Ig, Proteintech).
2.8. Statistical Analysis
The statistical analysis was performed using one-way ANOVA with SPSS software (version 18.0, USA), and values were expressed as the mean ± SEM (standard errors of means) where the p-value was considered less than 0.05 and it was statistically significant.
3. Results
3.1. Effects of H2O2 on the Viability of PTr2 Cells at Different MT Concentrations
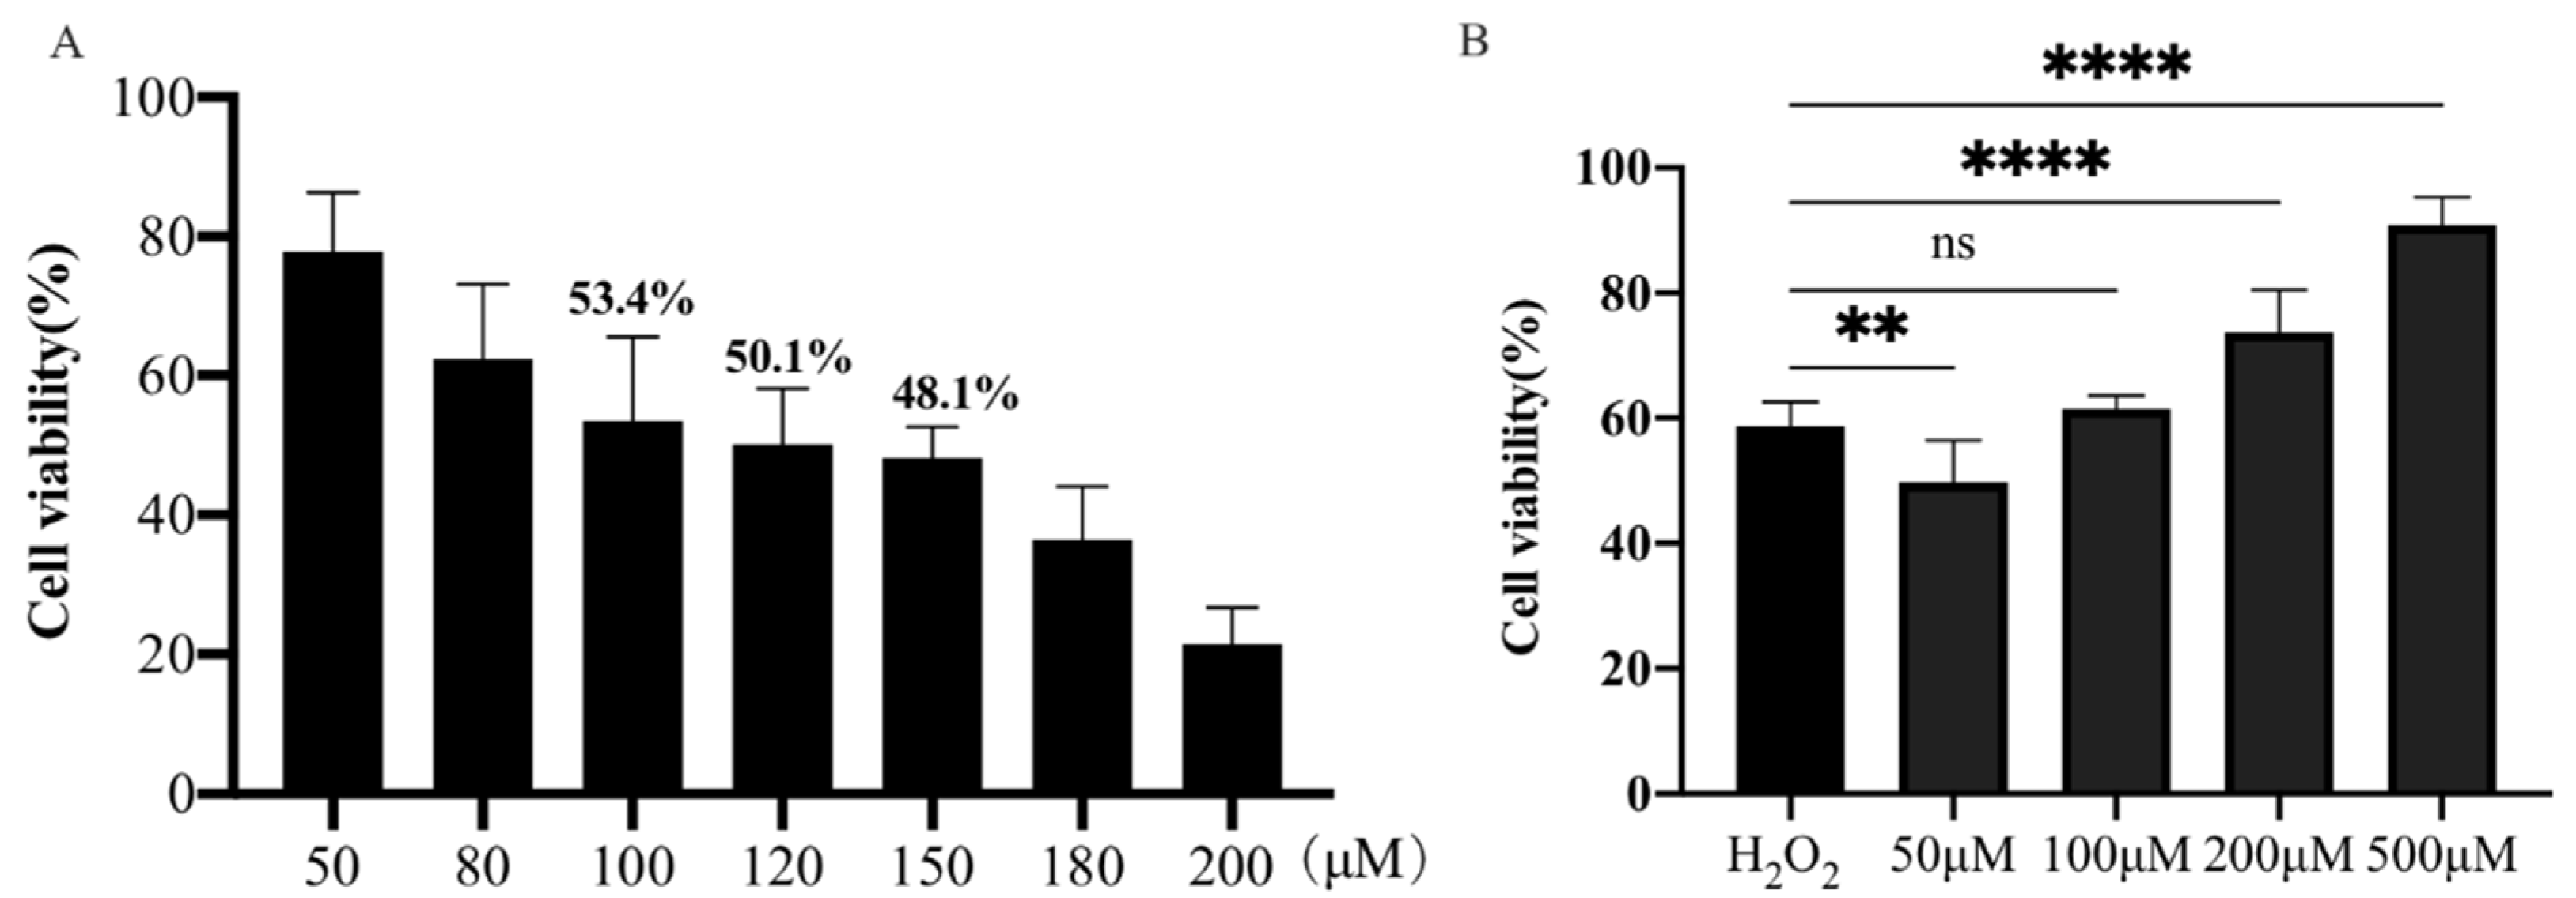
Initially, the viability of PTr2 cells treated with different concentrations of H2O2 was determined using a CCK-8 assay. As shown in Figure 1A, the 120 μM H2O2 was used to establish the oxidative stress model of PTr2 cells, and the cell viability decreased to 50.15 ± 0.03% compared with the control group after induction for 4 h. PTr2 cells were pretreated with different concentrations of MT (50, 100, 200 and 500 μM) for 24 h, and then treated with 120 μM H2O2 for 4 h. As shown in Figure 1B, pretreatment with 500 μM MT significantly enhanced the viability of H2O2-treated PTr2 cells.
3.2. Protective Effects of MT against H2O2-Induced Apoptosis in PTr2 Cells
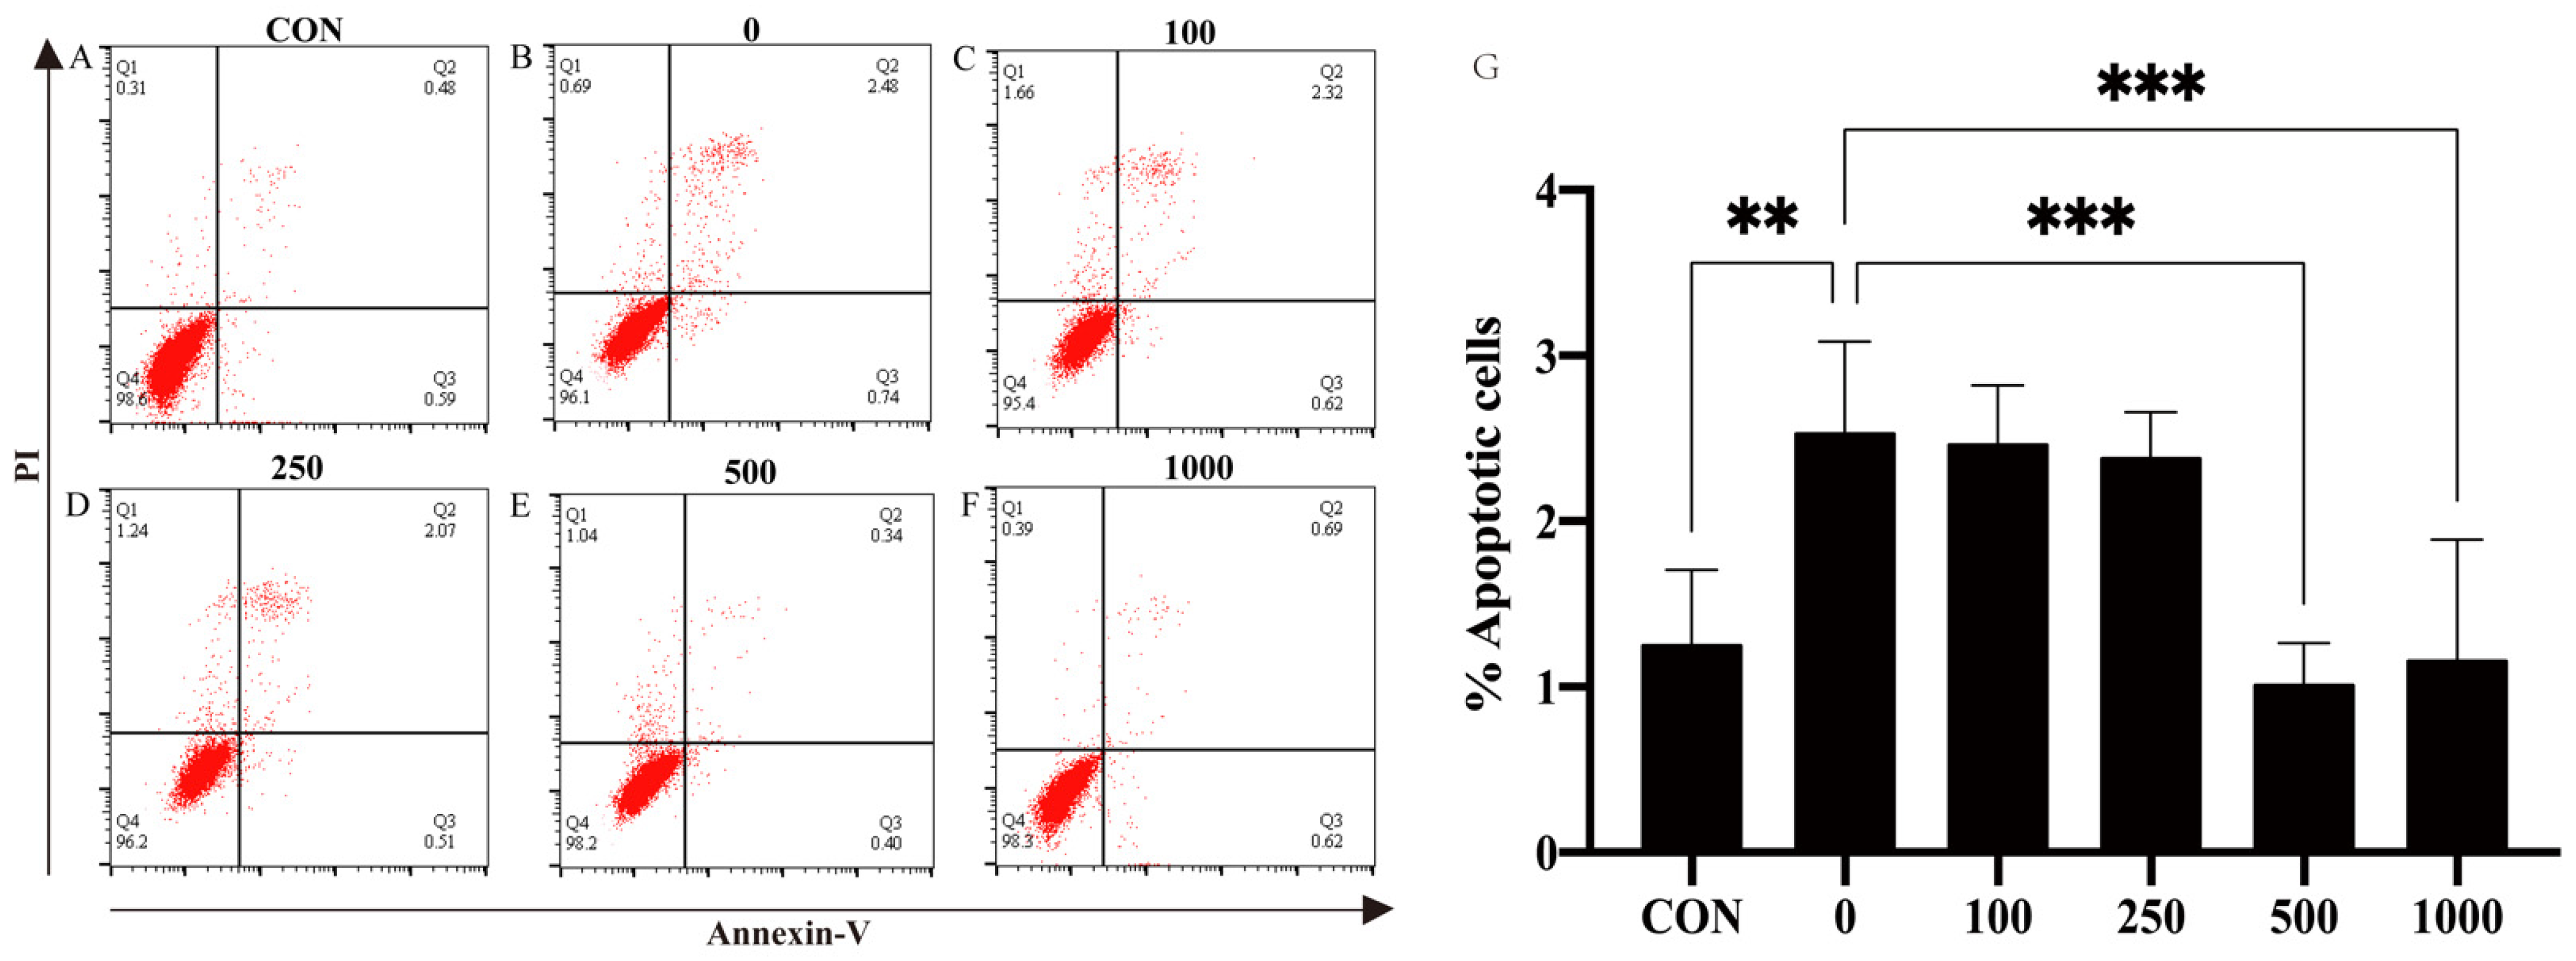
To further investigate whether MT could protect against H2O2-induced cell apoptosis in PTr2 cells, apoptosis rates were evaluated by flow cytometry using Annexin V-FITC/PI. Compared with the group, the cell apoptosis rate was significantly (p < 0.05) increased in the H2O2 group. The increased apoptosis rate of PTr2 cells caused by H2O2 induction was significantly (p < 0.05) decreased after MT pretreatment (Figure 2).
3.3. Effect of MT on H2O2-Induced ROS Production in PTr2 Cells
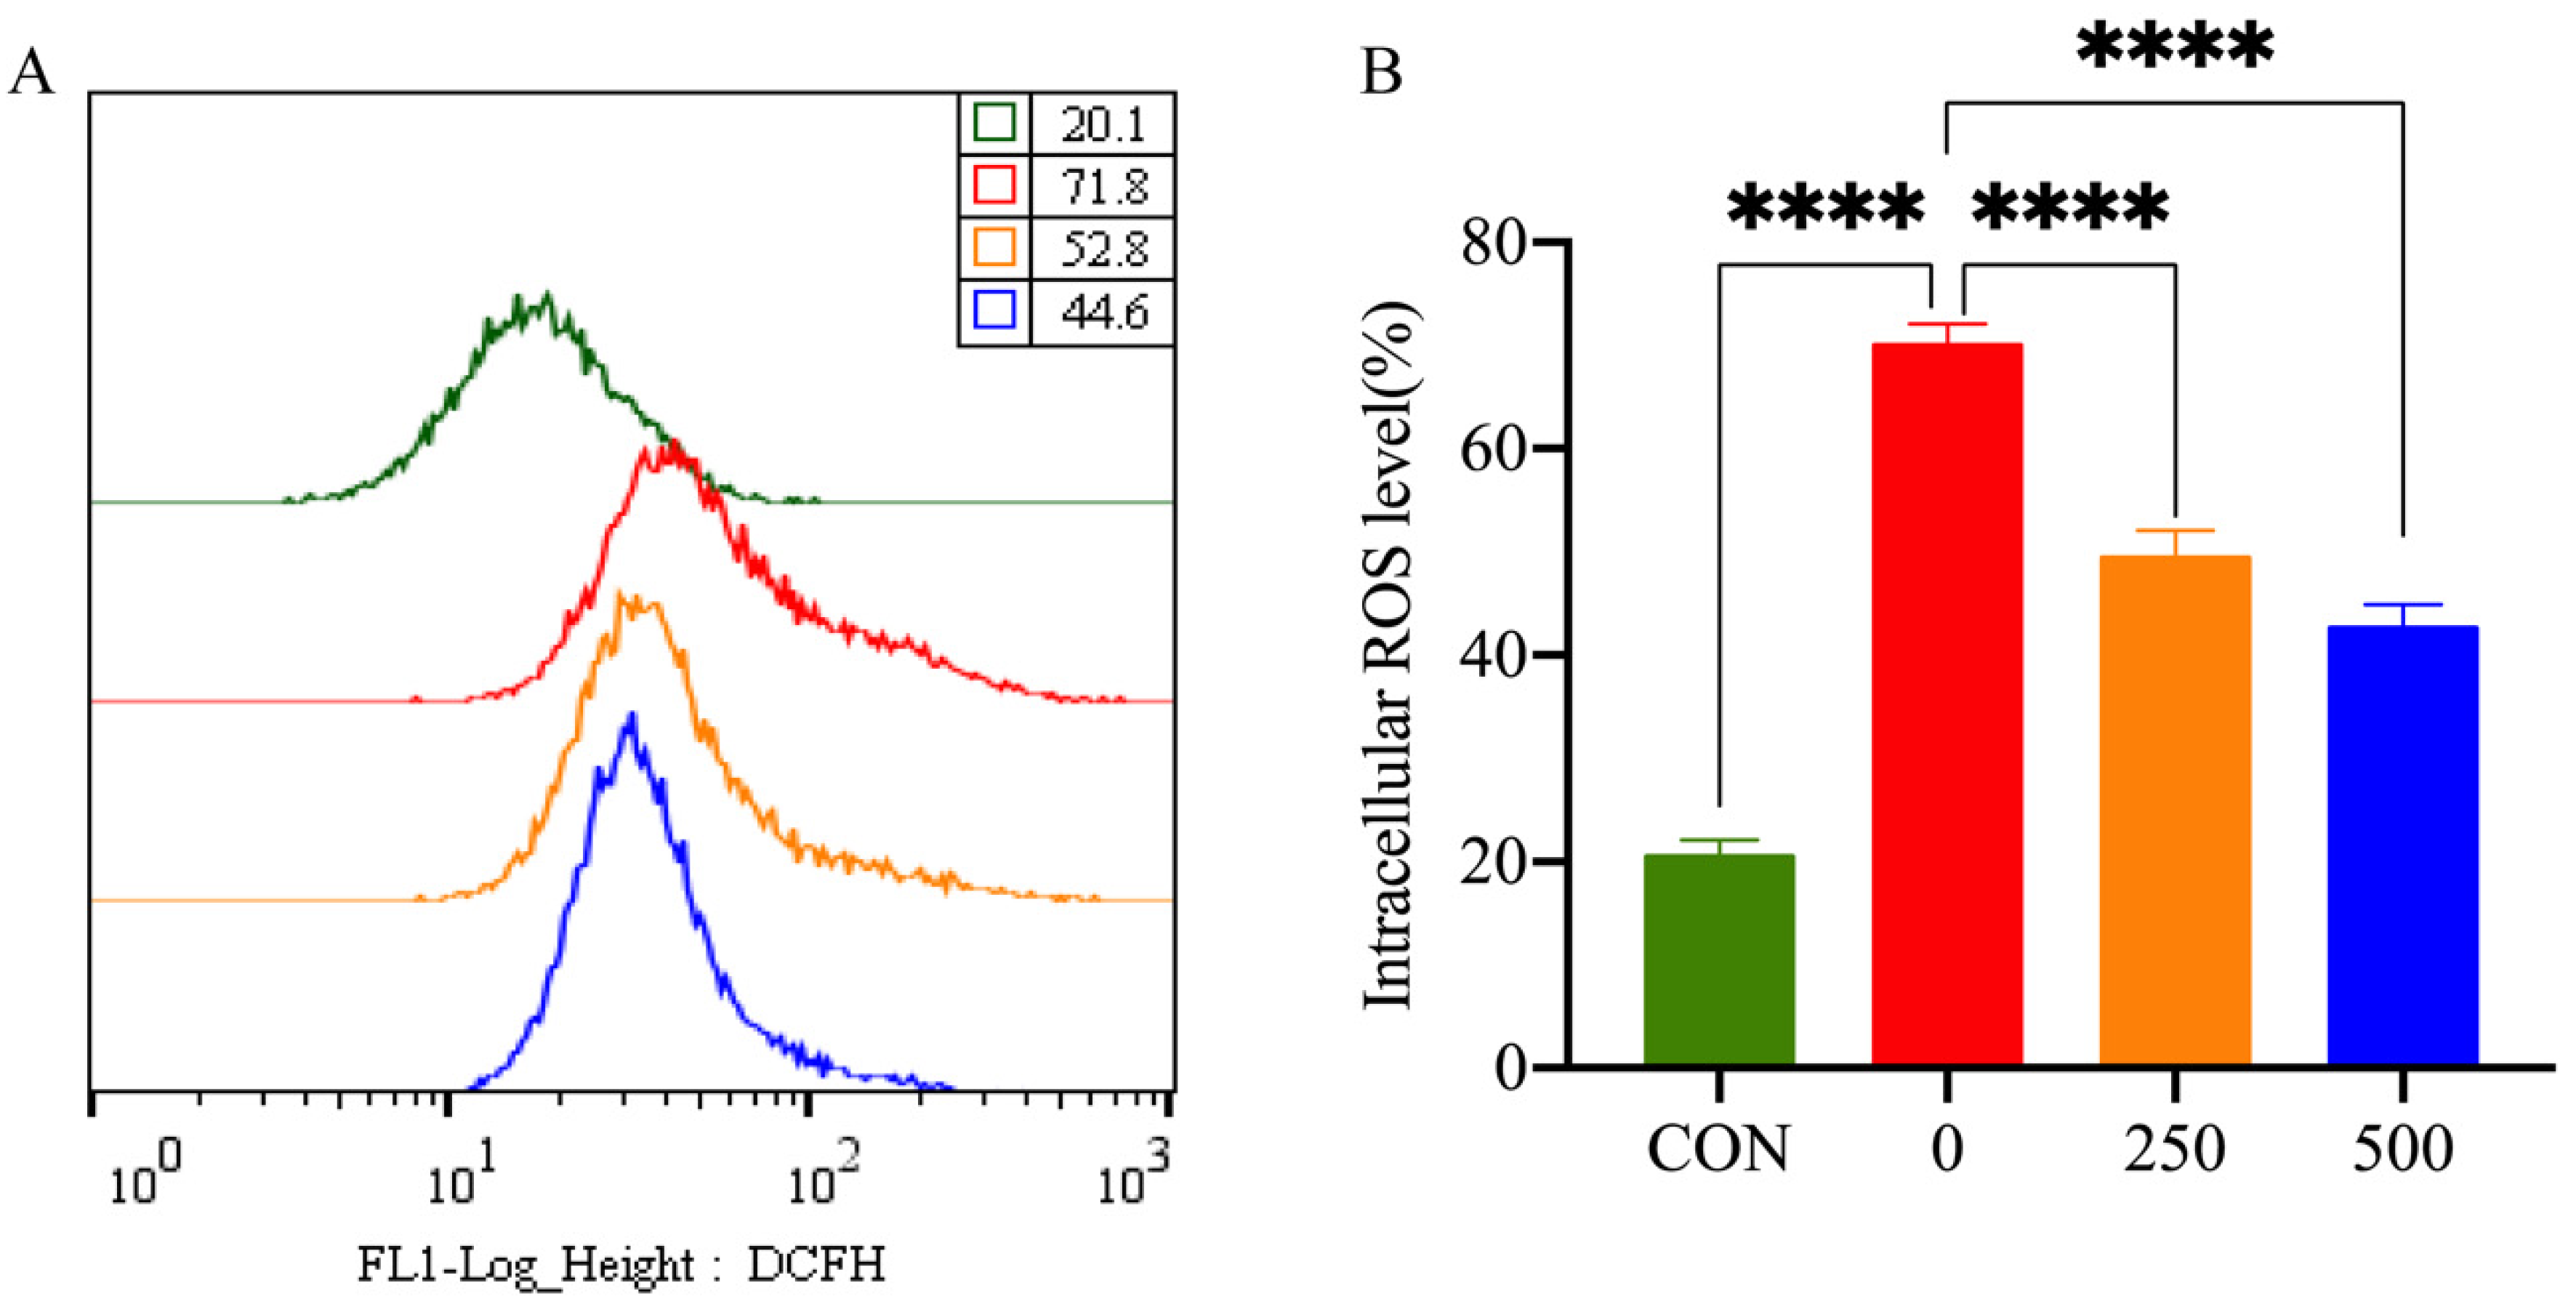
To study the antioxidant activity of MT, the intracellular ROS levels of PTr2 cells were examined by measuring the DCFH fluorescence intensity (Figure 3). Treatment with H2O2 significantly increased the intracellular level of ROS in PTr2 cells. However, 500 μM MT pretreatment significantly reduced ROS production.
3.4. Transcript Expression in PTr2 Cells
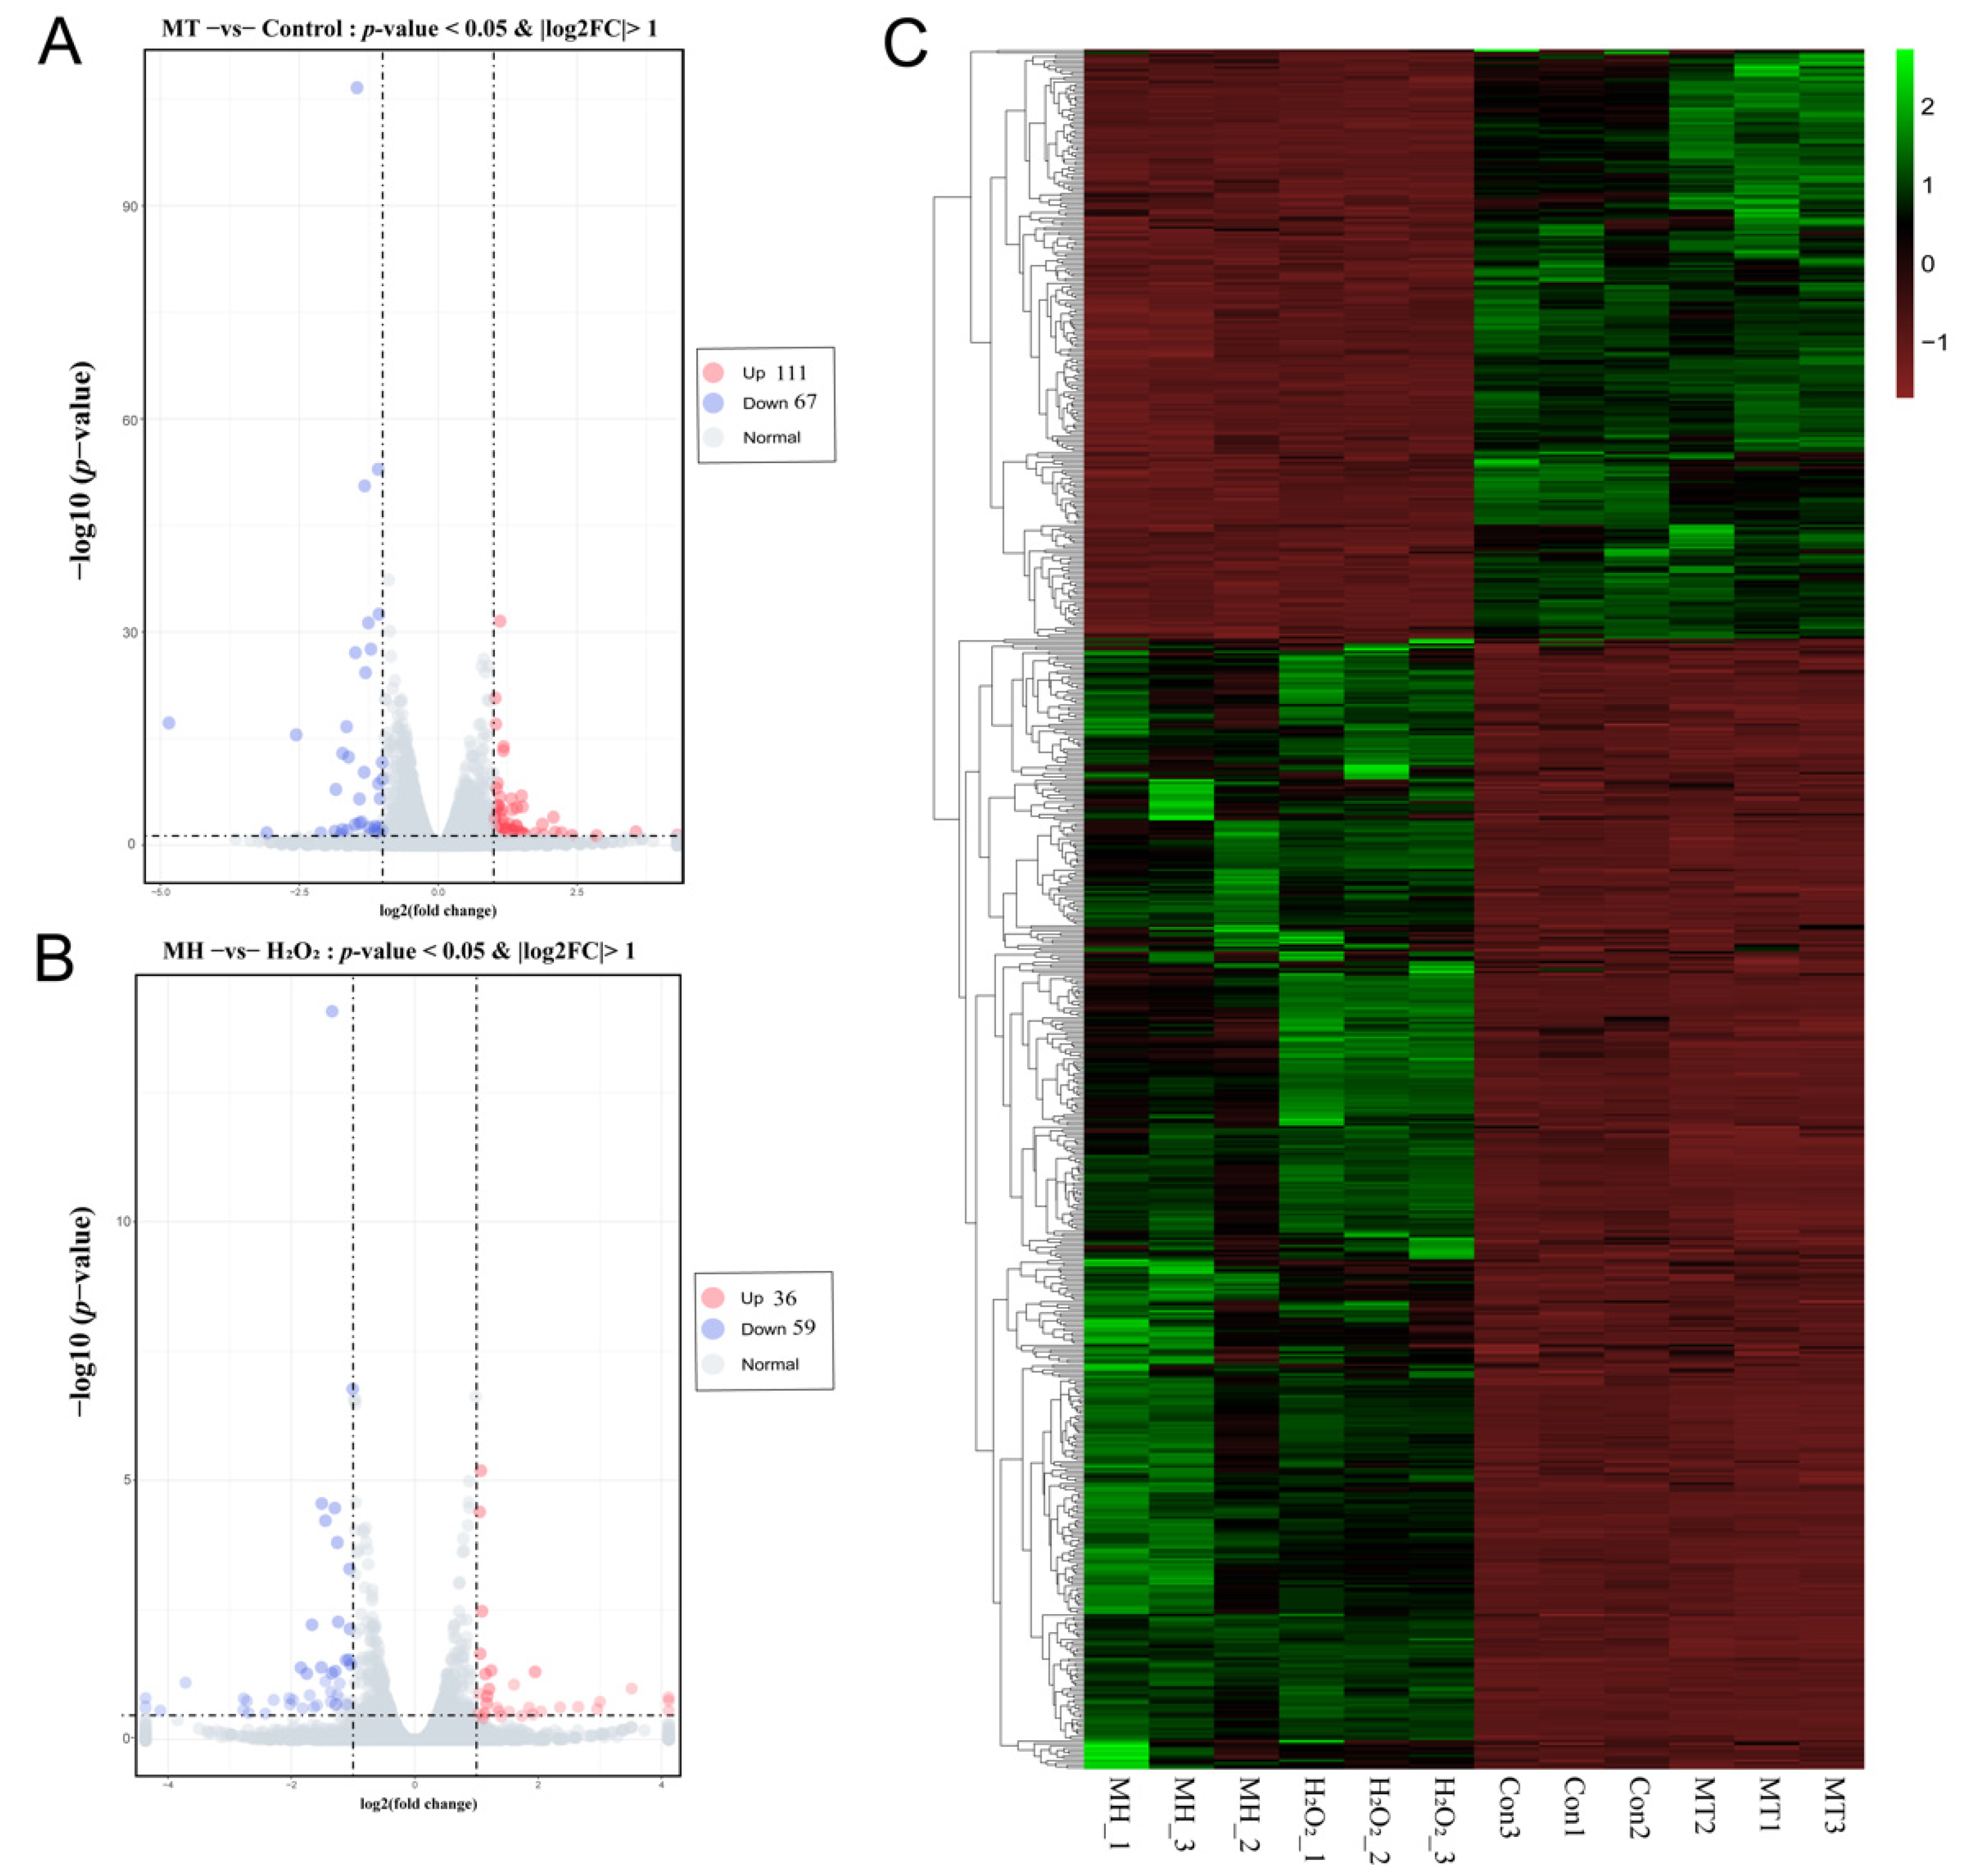
To investigate genes affected by MT, gene expression profiling of the control, MT, MH and H2O2 groups was performed: A total of 178 DEGs were obtained in MT group compared with the control group, including 67 downregulated and 111 upregulated genes (Figure 4A); Similarly, compared with the H2O2 group, a total of 95 DEGs were found in the MH group, including 59 downregulated and 36 upregulated genes (Figure 4B). A heatmap of DEGs is shown in Figure 4C, which displays a contrasting gene expression profile between different groups.
3.5. Functional Enrichment of DEGs
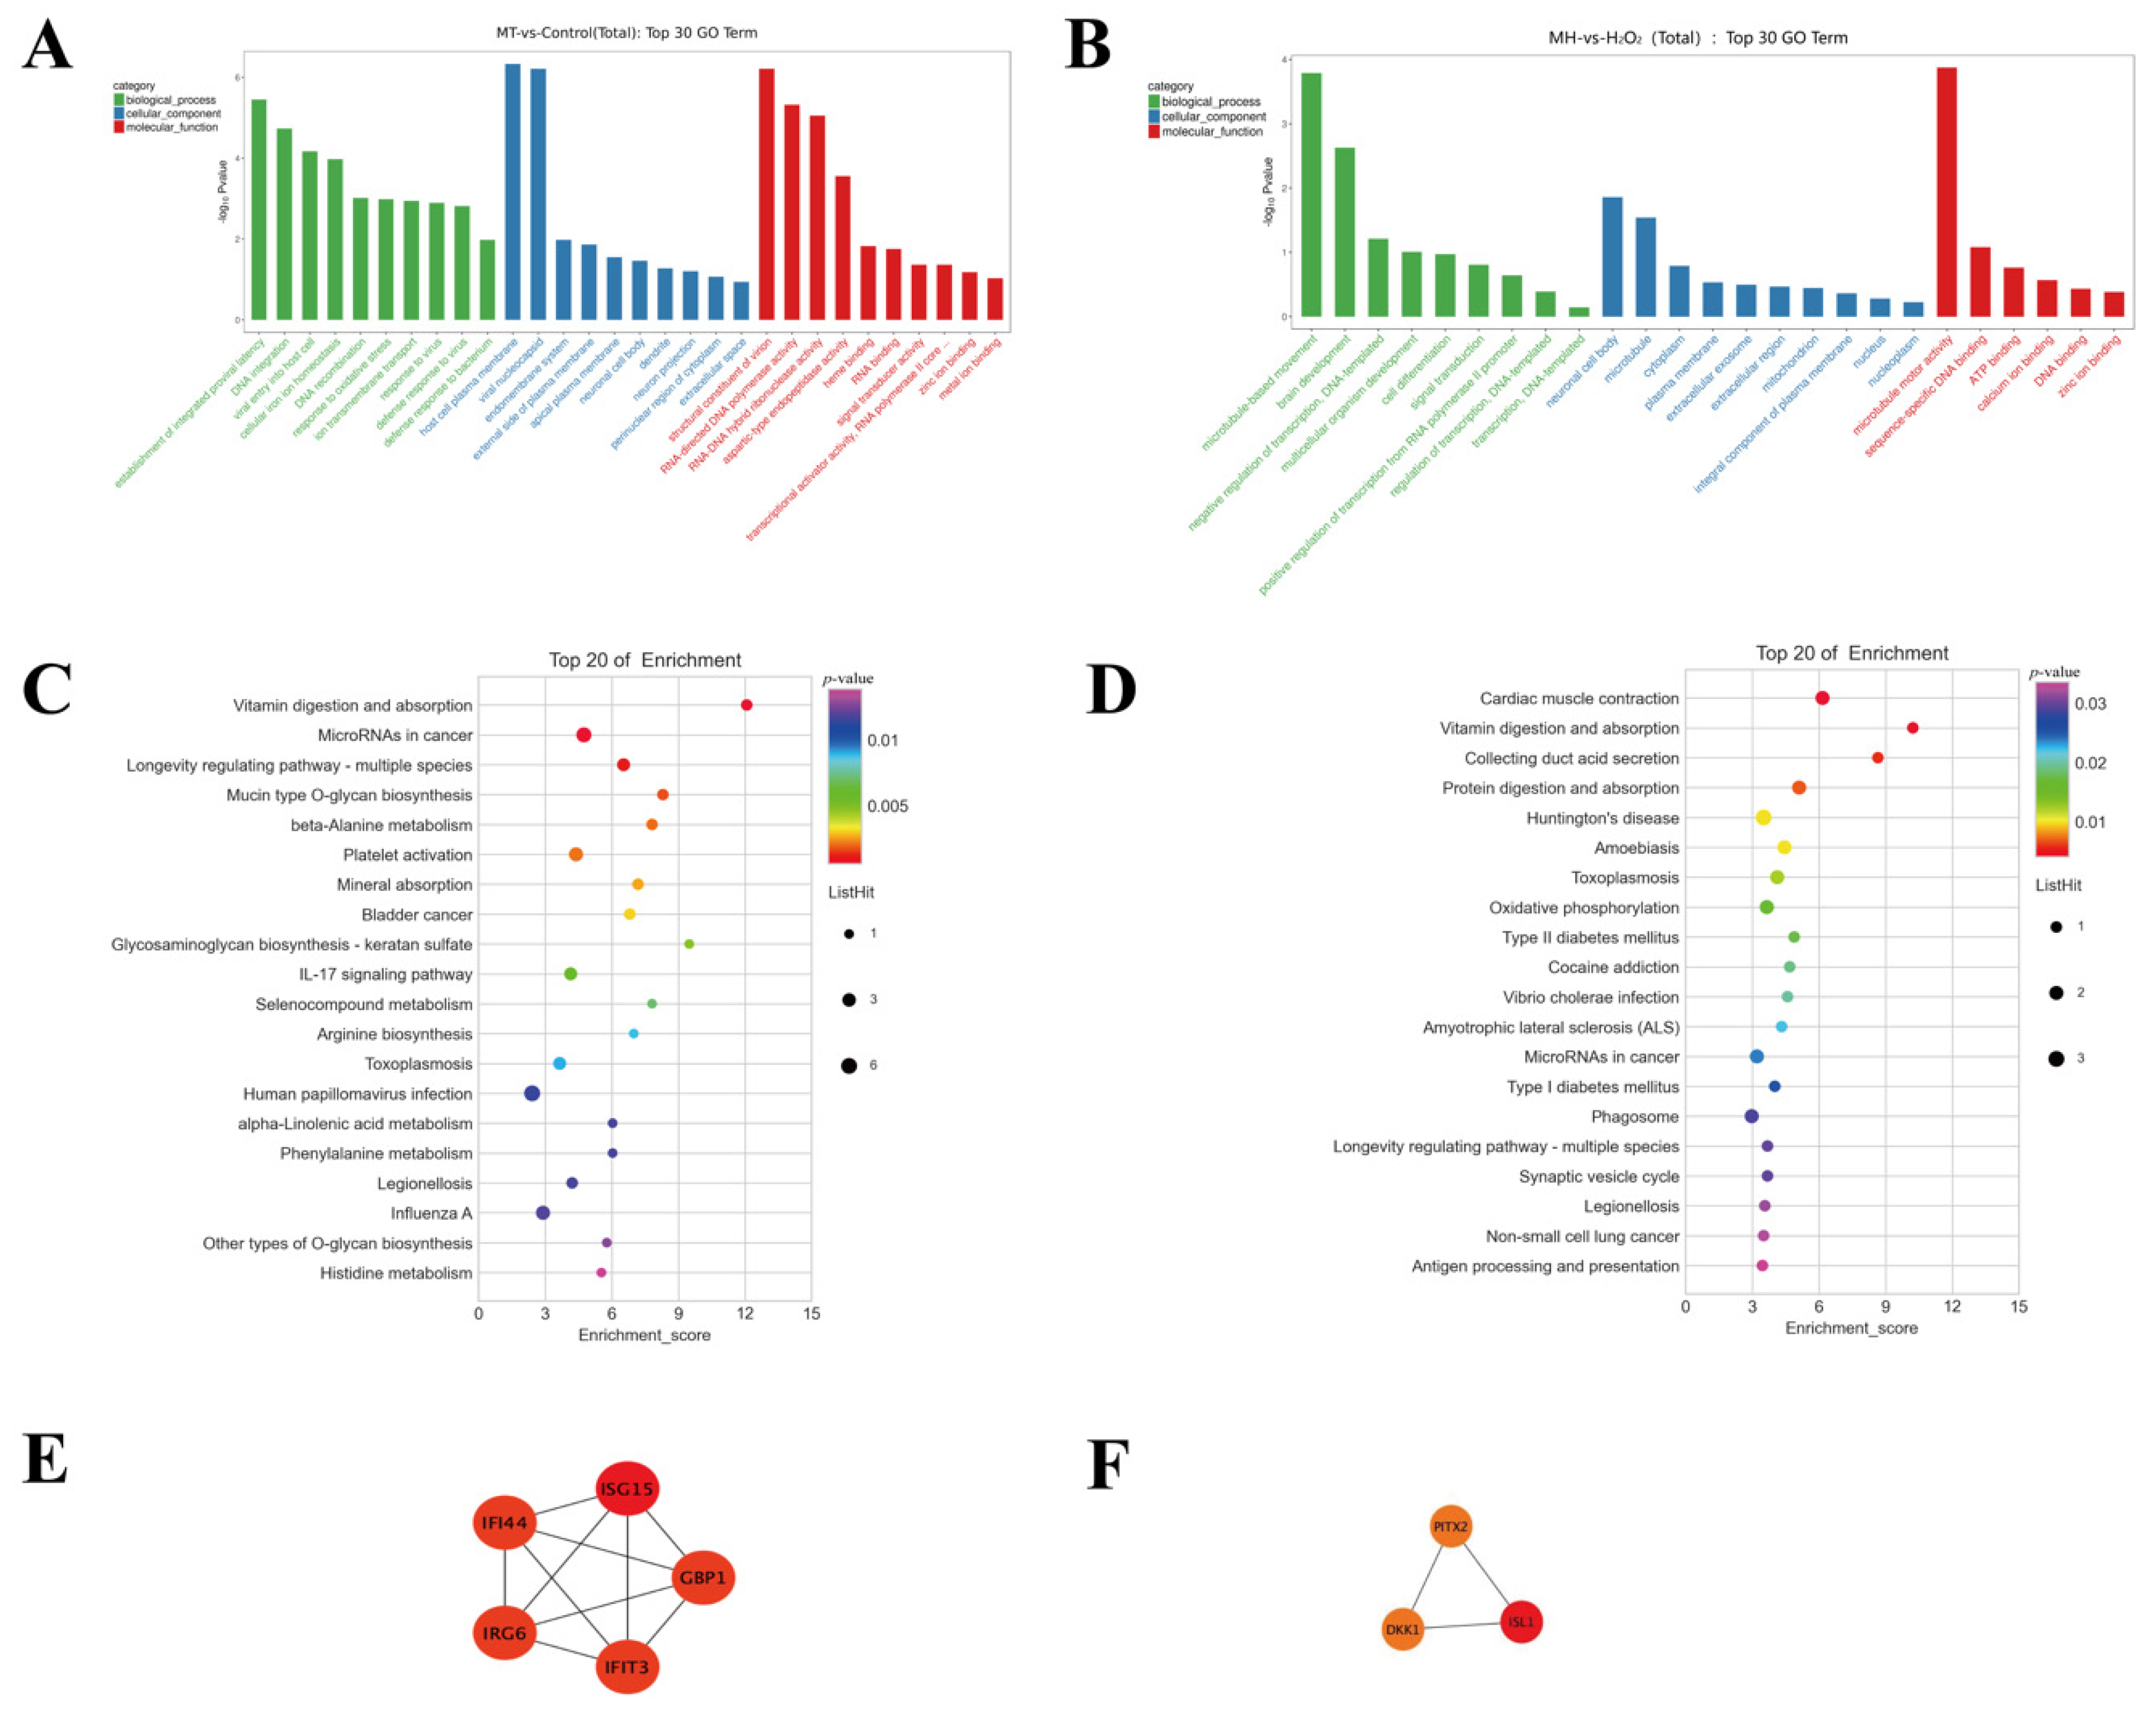
To further analyze the function of DEGs, we performed a pathway analysis. As shown in Figure 5, the GO analysis showed that the DEGs were significantly enriched into the terms, including “establishment of integrated proviral latency” in the biological process (BP) category, “host cell plasma membrane” in the cellular component (CC) category, and “structural constituent of virion” in the molecular function (MF) category (MT vs. CON) (Table S1). Furthermore, “microtubule-based movement” was identified in the BP category, “neuronal cell body” was identified in the CC category, and “microtubule motor activity” was identified in the MF category between the MH and H2O2 groups (Table S2). In addition, the KEGG pathway enrichment analysis showed that upregulated DEGs in MT pretreatment were significantly enriched in the “Wnt signaling pathway”, “TGF-beta signaling pathway”, and “mTOR signaling pathway” and so on (Figure 5C,D).
To further screen for hub genes, a network of the DEGs was obtained using STRING, MCODE and CytoHubba to identify the modules and hub genes in Cytoscape. As shown in Tables S3 and S4, the hub genes were identified by CytoHubba plug-ins in the groups (MT vs. CON) and groups (MH vs. H2O2), respectively. Furthermore, the most significant 1 modules were filtered using the MCODE (Figure 5C,D).
3.6. qRT–PCR Validation
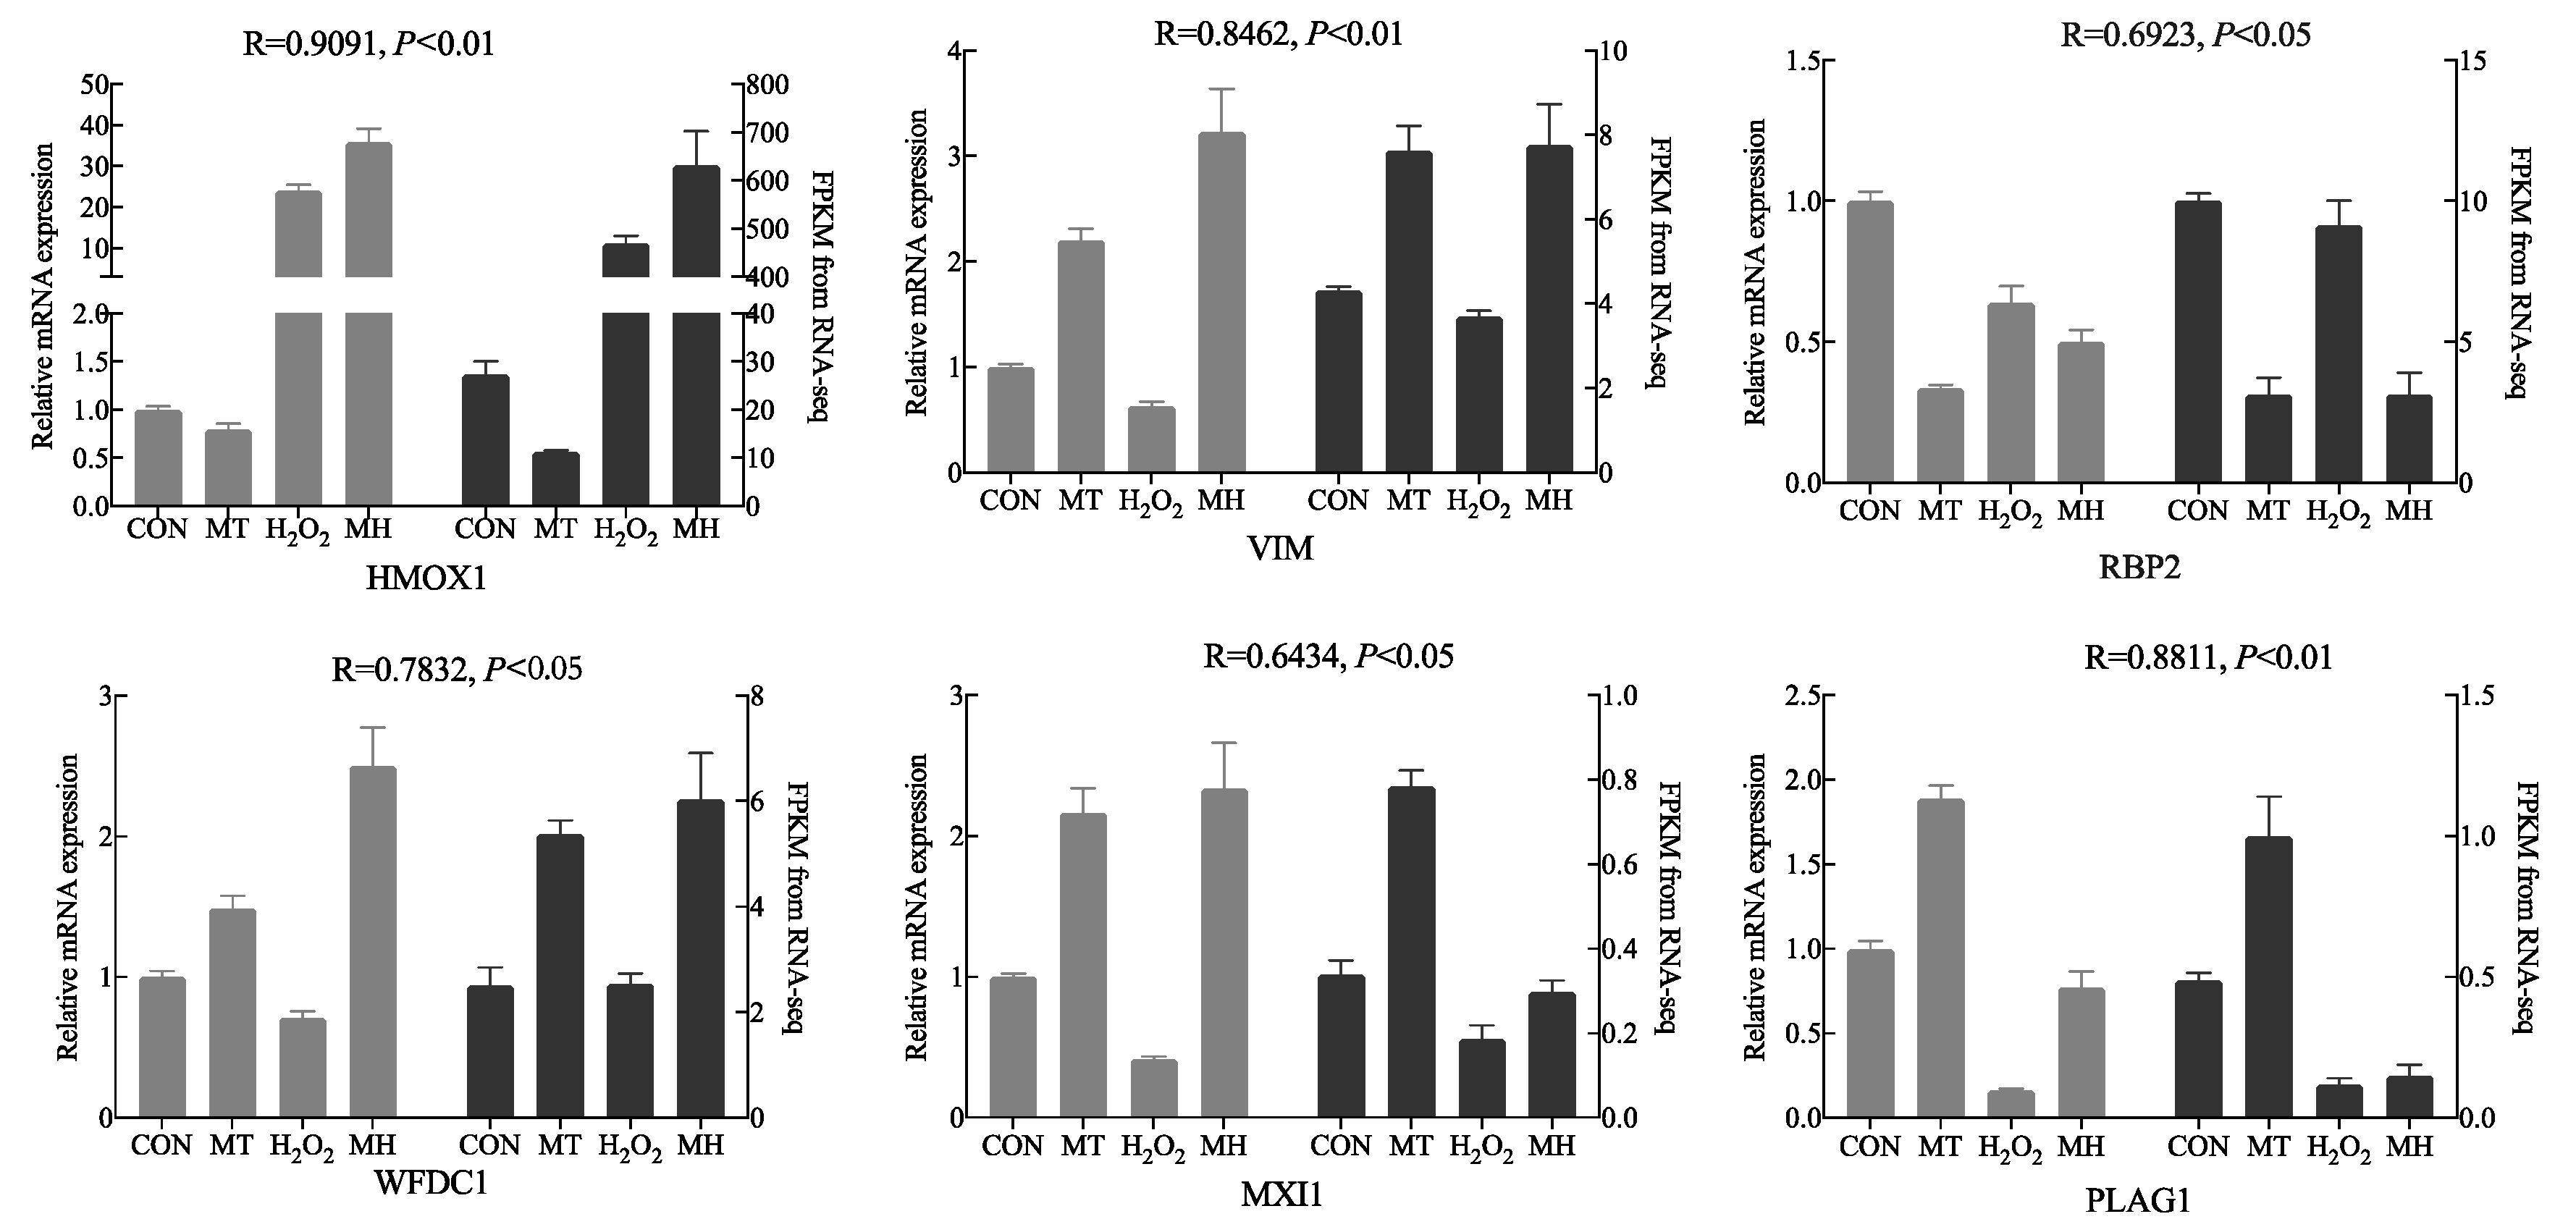
To validate the accuracy of the RNA-seq data and detect DEGs, we screened six DEGs (HMOX1, VIM, RBP2, WFDC1, MXI1 and PLAG1) for qRT-PCR analysis. The same trends in gene expression were detected in the data obtained by RNA-seq and qPCR, suggesting that RNA-seq accurately quantified cell gene expression in the CON, MT, H2O2 and MH groups (Figure 6). Notably, the significant positive correlation between RNA sequencing data and a qRT-PCR analysis supported the results found.
3.7. Effects of MT Pretreatment on H2O2-Induced Protein Expression in PTr2 Cells
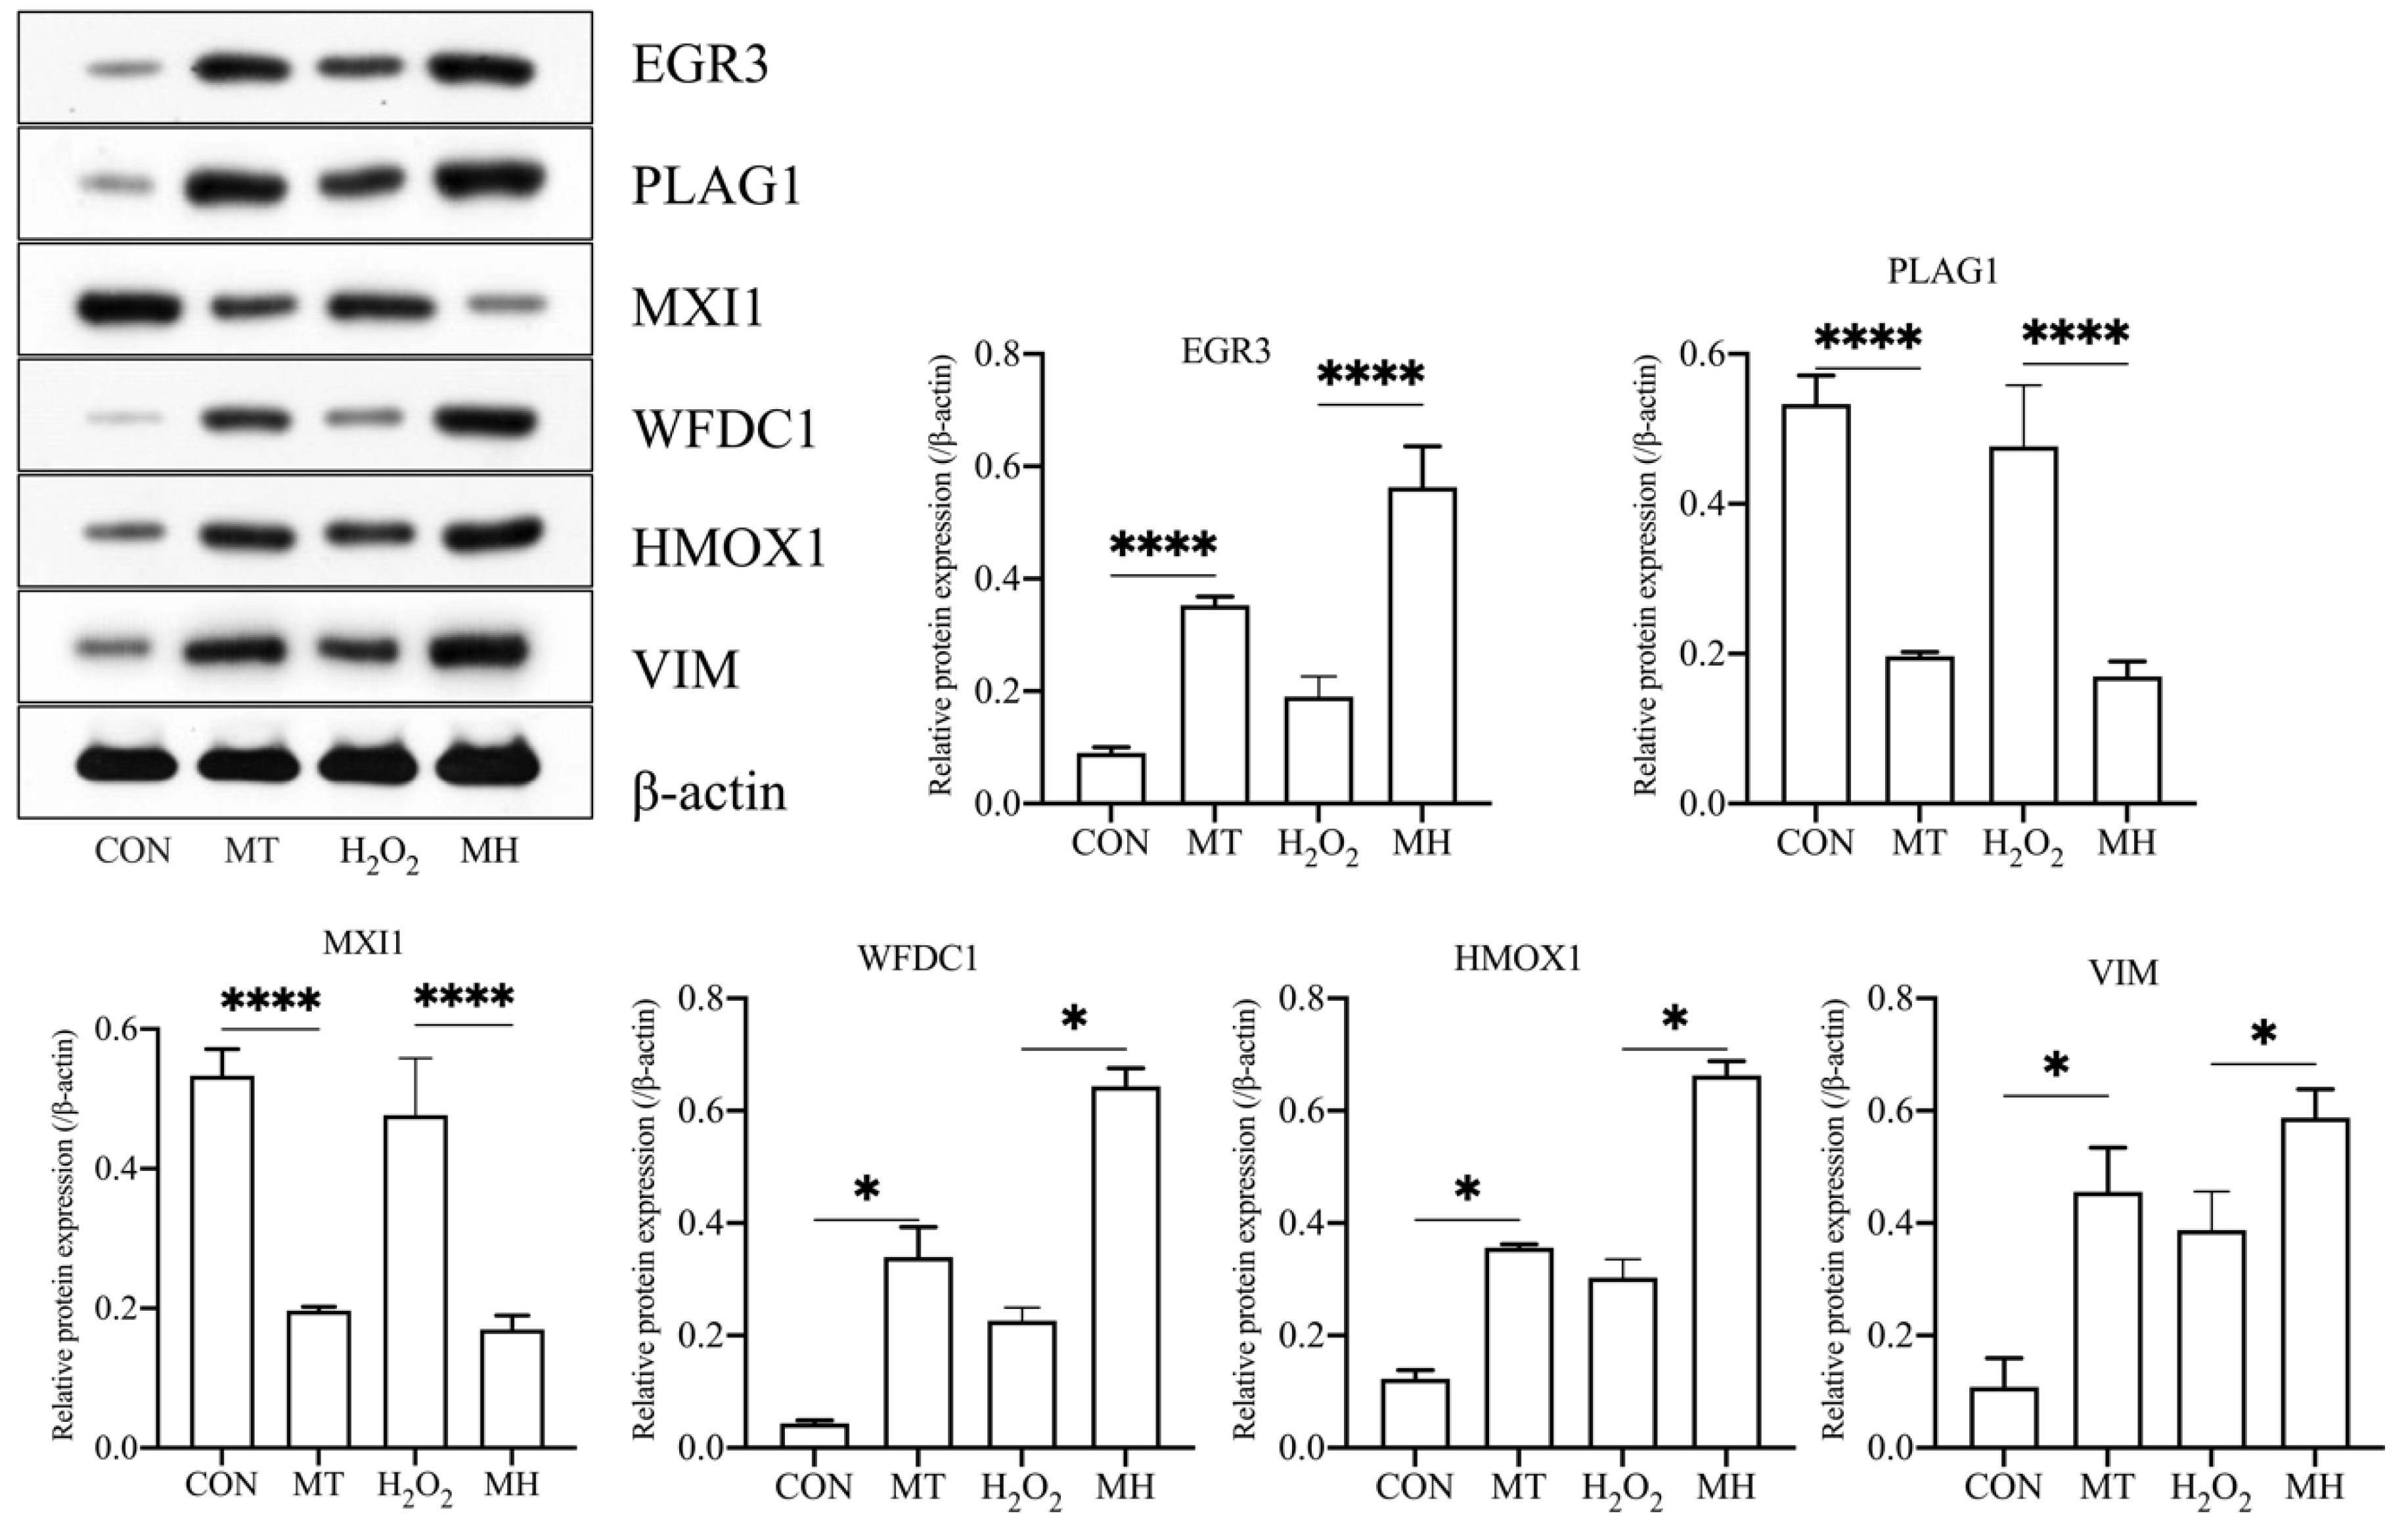
To investigate the effect of MT on H2O2-mediated oxidative stress in PTr2 cells, we selected EGR3, PLAG1, MXI1, WFDC1, HMOX1 and VIM for the Western blot analysis. As shown in Figure 7, the EGR3, HMOX1, VIM and WFDC1 proteins were significantly upregulated in the MT group compared with the CON group and significantly were upregulated in the MH group compared with the H2O2 group. However, the expression levels of the PLAG1 and MXI1 were significantly lower in the MT group than in the CON group, and significantly lower in the MH group than in the H2O2 group. The corresponding differentially expressed genes are listed in Table 1.
4. Discussion
Oxidative stress in the placenta can lead to reproductive dysfunction, and can be transmitted to offspring [39,40]. Some antioxidants have been shown to reduce oxidative damage in animals, but this remains to be further explored [41]. Therefore, in this study, the protective effects of MT on oxidative stress were investigated.
PTr2 cells are significant cell types of the placenta and play important roles in fetal nutrition and growth throughout development [42]. However, overproduction of ROS may lead to placental oxidative stress and cell apoptosis [11,43,44]. We observed that pretreatment with 500 μM MT ameliorated the H2O2-induced reduction in PTr2 cell viability and significantly decreased ROS production. These results indicated that MT pretreatment exhibited antioxidant activity, consistent with previous studies showing that MT has various positive anti-apoptotic and antioxidative stress effects during pre- and postimplantation development of cloned mouse embryos [45,46]. Furthermore, we found that MT (500 μM) pretreatment significantly alleviated H2O2-induced cell apoptosis, suggesting that MT might alleviate H2O2-induced oxidative damage by reducing ROS levels and protecting cells against apoptosis.
To filter candidate genes involved in the regulation of the oxidative stress response, a transcriptome analysis was further performed in cultured PTr2 cells with different treatments. The GO enrichment analysis of upregulated DEGs (CON vs. MT) showed that “response to oxidative stress” (GO: 0006979) was significantly enriched. The results indicated that DEGs involved in “positive regulation of the Wnt signaling pathway” were upregulated in the MH group.
The KEGG pathway enrichment analysis showed that the Wnt signaling pathway, “TGF-beta signaling pathway” and “mTOR signaling pathways” were significantly enriched for DEGs between the MH and H2O2 groups. The Wnt signaling pathway has been reported to be redox-sensitive and regulated by oxidative stress [47,48,49]. In the present study, DEGs were significantly enriched in the Wnt signaling pathway, suggesting that MT may play a protective role in H2O2-induced oxidative stress in PTr2 cells by regulating the Wnt signaling pathway. In addition, the TGF-beta signaling pathway is also an effective signaling pathway involved in the acceleration of oxidative stress and apoptosis [50]. Previous studies have shown that long-chain fatty acids (LCFAs) facilitate hepatocyte activation by upregulating oxidative stress through TGF-β signaling pathway-related genes [51]. Compared with H2O2-treated cells, PITX2 was identified as an upregulated DEG in MT-treated PTr2 cells, and it was demonstrated to be significantly enriched in the TGF-beta signaling pathway. PITX2 is a pivotal component of both the TGF-beta and Wnt/beta-catenin signaling pathways, which play an important role in TGF-beta signaling pathway [52]. Together, these results suggest that MT alleviates H2O2-induced oxidative stress by activating the TGF-beta signaling pathway. The mTOR signaling pathway is also related to oxidative stress or antioxidant capacity [53,54]. In this study, ATP6V1C2 was upregulated in MT-treated PTr2 cells and was enriched in the mTOR signaling pathway. Similar results have been described indicating that melatonin alleviates high glucose-induced apoptosis in Schwann cells through the mTOR and Wnt signaling pathways [55].
Our study suggests that MT may serve as a protective agent against oxidative stress-induced PTr2 cell apoptosis. According to the results, MT (500 μM) pretreatment significantly increases the expression of HMOX1, VIM and EGR3 at both the mRNA and protein levels in PTr2 cells. Previous studies have reported that HMOX1, VIM and EGR3 can protect cells against oxidative stress and play roles in cellular antioxidant defense [56,57,58,59]. HMOX1 is a commonly used marker of oxidative stress, and its increased expression is associated with resistance to oxidant-induced apoptosis as an adaptation response [60,61]. In addition, the activation of HMOX1 is involved in heme catabolism and induced by oxidative stress [62]. In this study, MT-pretreated cells showed higher HMOX1 expression levels than the H2O2 group, suggesting that MT (500 μM) may alleviate oxidative stress by upregulating the expression of HMOX1.
Previously, VIM has been shown to effectively improve the decreased epithelial-to-mesenchymal transition (EMT) capacity of placental trophoblast cells caused by hypoxia [63]. VIM is significantly increased in response to increased ROS under oxidative stress conditions in H2O2-treated renal cell lines [64]. Loss of VIM function in mice results in defects in the response and adaptation to oxidative damage [65]. Here we showed that MT (500 μM) significantly reduced H2O2-induced apoptosis in vitro, which may be involved in upregulating the expression of VIM.
EGR3 is a member of the EGR family transcription factors that regulate cell responses to proliferation, survival and apoptosis [66,67]. In this work, we found that MT (500 μM) pretreatment significantly increased EGR3 expression and was associated with increased PTr2 cell proliferation and decreased apoptosis compared with the H2O2 group in vitro. Therefore, MT (500 μM) may affect the expression of antioxidant-related proteins (such as HMOX1, VIM, EGR3) to alleviate oxidative stress induced by H2O2.
Additionally, we prioritized the module hub genes ISG15 and ISL1 by CytoHubba in groups (MT vs. CON) and groups (MH vs. H2O2), respectively. ISG15 is a stress response gene that may act as a contributor to tumor suppressors and inflammatory responses [68]. Previous studies have shown that ISG15 can reach high levels in response to oxidative stress [69]. Moreover, ISL1 was downregulated to protect cells from apoptosis under oxidative stress conditions [70]. Interestingly, our study showed that ISL1 gene expression was lower in the MH group than in the H2O2 group, suggesting that MT might alleviate the oxidative stress by downregulating ISL1 expression.
5. Conclusions
In summary, MT effectively protects H2O2-treated PTr2 cells against oxidative stress by decreasing intracellular ROS generation and cell apoptosis and regulating the expression of antioxidant-related genes. MT as an antioxidant candidate might protect PTr2 cells from excessive oxidative stress during pregnancy. These results are expected to provide a theoretical basis for the development of the clinical application of MT during pregnancy and provide guidance for developing effective nutritional strategies to improve sow health.
Supplementary Materials
The following supporting information can be downloaded at: https://www.mdpi.com/article/10.3390/antiox11061047/s1. Table S1: GO enrichment analysis of DEGs (DEGs in MT group vs. CON group); Table S2: GO enrichment analysis of DEGs (DEGs in MH group vs. H2O2 group); Table S3 Hub genes ranked by the Degree method in CytoHubba (MT VS. CON); Table S4: Hub genes ranked by the Degree method in CytoHubba (MH VS. H2O2).
Author Contributions
Conceptualization, Y.F.; methodology, Y.C.; software, H.G.; validation, Z.J.; resources, G.S. and Q.W.; writing—original draft preparation, Y.F.; writing—review and editing, Y.F.; visualization, Y.F.; supervision, K.X.; project administration, K.X.; funding acquisition, K.X. All authors have read and agreed to the published version of the manuscript.
Funding
This research was funded by the Natural Science Foundation of Guangxi Province (2020JJB130030), the Special funds for the construction of innovative provinces in Hunan (grant numbers 2020JJ5635, 2019RS1068, 2020WK2030, 2021NK1012), the National Natural Science Foundation of China (31601953), and Open Fund of Key Laboratory of Agro-ecological Processes in Subtropical Region, Chinese Academy of Sciences (ISA2019304).
Institutional Review Board Statement
Not applicable.
Informed Consent Statement
Not applicable.
Data Availability Statement
The raw reads were deposited to Sequence Read Archive (SRA) database (PRJNA820162 for RNA-seq).
Acknowledgments
We would like to thank Guoyao Wu and Fuller W. Bazer of Texas A & M University for generating PTr2 cell lines used in this study.
Conflicts of Interest
The authors declare that the research was conducted in the absence of any commercial or financial relationships that could be construed as a potential conflict of interest.
References
- Da Rocha Nina Junior, A.; Furtunato Maia, J.M.; Vitor Martins, S.C.; Gonçalves, J.F.D.C. Photochemical efficiency and oxidative, metabolism of tree species during acclimation to high and low irradiance. Plants 2020, 9, 1047. [Google Scholar] [CrossRef]
- Sies, H. Role of reactive oxygen species in biological processes. Klin. Wochenschr. 1991, 69, 965–968. [Google Scholar] [CrossRef]
- Xu, M.; Che, L.; Gao, K.; Wang, L.; Yang, X.; Wen, X.; Jiang, Z.; Wu, D. Effects of dietary taurine supplementation to gilts during late gestation and lactation on offspring growth and oxidative stress. Animals 2019, 9, 220. [Google Scholar] [CrossRef] [PubMed] [Green Version]
- Fan, Z.; Xiao, Y.; Chen, Y.; Wu, X.; Zhang, G.; Wang, Q.; Xie, C. Effects of catechins on litter size, reproductive performance and antioxidative status in gestating sows. Anim. Nutr. 2015, 1, 271–275. [Google Scholar] [CrossRef] [PubMed]
- Fry, R.C.; Bangma, J.; Szilagyi, J.; Rager, J.E. Developing novel in vitro methods for the risk assessment of developmental and placental toxicants in the environment. Toxicol. Appl. Pharmacol. 2019, 378, 114635. [Google Scholar] [CrossRef] [PubMed]
- Qi, L.; Jiang, J.; Zhang, J.; Zhang, L.; Wang, T. Curcumin protects human trophoblast HTR8/SVneo cells from HO-induced oxidative stress by activating Nrf2 signaling pathway. Antioxidants 2020, 9, 121. [Google Scholar] [CrossRef] [PubMed] [Green Version]
- Singh, K.; Hamilton, S.T.; Shand, A.W.; Hannan, N.J.; Rawlinson, W.D. Receptors in host pathogen interactions between human cytomegalovirus and the placenta during congenital infection. Rev. Med. Virol. 2021, 31, e2233. [Google Scholar] [CrossRef]
- Wang, J.; Anguera, M.C. In vitro differentiation of human pluripotent stem cells into trophoblastic cells. J. Vis. Exp. 2017, 121, 55268. [Google Scholar] [CrossRef]
- Khera, A.; Vanderlelie, J.J.; Holland, O.; Perkins, A.V. Overexpression of endogenous anti-oxidants with selenium supplementation protects trophoblast cells from reactive oxygen species-induced apoptosis in a bcl-2-dependent manner. Biol. Trace Elem. Res. 2017, 177, 394–403. [Google Scholar] [CrossRef]
- Khera, A.; Dong, L.F.; Holland, O.; Vanderlelie, J.; Pasdar, E.A.; Neuzil, J.; Perkins, A.V. Selenium supplementation induces mitochondrial biogenesis in trophoblasts. Placenta 2015, 36, 863–869. [Google Scholar] [CrossRef]
- Panaite, T.D.; Saracila, M.; Papuc, C.P.; Predescu, C.N.; Soica, C. Influence of dietary supplementation of bark on performance, oxidative stress parameters in liver and gut microflora of broilers. Animals 2020, 10, 958. [Google Scholar] [CrossRef] [PubMed]
- Roberts, J.M.; Myatt, L.; Spong, C.Y.; Thom, E.A.; Hauth, J.C.; Leveno, K.J.; Pearson, G.D.; Wapner, R.J.; Varner, M.W.; Thorp, J.M.; et al. Vitamins C and E to prevent complications of pregnancy-associated hypertension. N. Engl. J. Med. 2010, 362, 1282–1291. [Google Scholar] [CrossRef] [PubMed] [Green Version]
- Martins, L.G.; Khalil, N.M.; Mainardes, R.M. PLGA Nanoparticles and polysorbate-80-coated PLGA nanoparticles increase the in vitro antioxidant activity of melatonin. Curr. Drug Deliv. 2018, 15, 554–563. [Google Scholar] [CrossRef] [PubMed]
- Reiter, R.J.; Tan, D.-X.; Mayo, J.C.; Sainz, R.M.; Leon, J.; Czarnocki, Z. Melatonin as an antioxidant: Biochemical mechanisms and pathophysiological implications in humans. Acta Biochim. Pol. 2003, 50, 1129–1146. [Google Scholar] [CrossRef] [Green Version]
- Jang, H.; Hong, K.; Choi, Y. Melatonin and fertoprotective adjuvants: Prevention against premature ovarian failure during chemotherapy. Int. J. Mol. Sci. 2017, 18, 1221. [Google Scholar] [CrossRef] [PubMed]
- Koca Çalişkan, U.; Aka, C.; Bor, E. Melatonin in edible and non-edible plants. Turk. J. Pharm. Sci. 2017, 14, 75–83. [Google Scholar] [CrossRef]
- Kandemir, Y.B.; Konuk, E.; Katırcı, E.; Xxx, F.; Behram, M. Is the effect of melatonin on vascular endothelial growth factor receptor-2 associated with angiogenesis in the rat ovary? Clinics 2019, 74, e658. [Google Scholar] [CrossRef] [PubMed]
- Xu, M.; Shao, Q.; Ye, S.; Li, S.; Wu, M.; Ding, M.; Li, Y. Simultaneous extraction and identification of phenolic compounds in using microwave-assisted extraction combined with UPLC-Q-TOF-MS/MS and their antioxidant activities. Front. Plant Sci. 2017, 8, 1474. [Google Scholar] [CrossRef]
- Li, Y.; Fang, L.; Yu, Y.; Shi, H.; Wang, S.; Guo, Y.; Sun, Y. Higher melatonin in the follicle fluid and MT2 expression in the granulosa cells contribute to the OHSS occurrence. Reprod. Biol. Endocrinol. 2019, 17, 37. [Google Scholar] [CrossRef]
- Santamaría, R.; Díaz-Tocados, J.M.; Pendón-Ruiz De Mier, M.V.; Robles, A.; Salmerón-Rodríguez, M.D.; Ruiz, E.; Vergara, N.; Aguilera-Tejero, E.; Raya, A.; Ortega, R.; et al. Increased phosphaturia accelerates the decline in renal function: A search for mechanisms. Sci. Rep. 2018, 8, 13701. [Google Scholar] [CrossRef]
- Jaeger, L.A.; Spiegel, A.K.; Ing, N.H.; Johnson, G.A.; Bazer, F.W.; Burghardt, R.C. Functional effects of transforming growth factor beta on adhesive properties of porcine trophectoderm. Endocrinology 2005, 146, 3933–3942. [Google Scholar] [CrossRef] [Green Version]
- Hakhyun, K.; Jaeger, L.A.; Johnson, G.A.; Spencer, T.E.; Bazer, F.W. Keratinocyte growth factor is up-regulated by estrogen in the porcine uterine endometrium and functions in trophectoderm cell proliferation and differentiation. Endocrinology 2001, 142, 2303–2310. [Google Scholar]
- Wankun, X.; Wenzhen, Y.; Min, Z.; Weiyan, Z.; Huan, C.; Wei, D.; Lvzhen, H.; Xu, Y.; Xiaoxin, L. Protective effect of paeoniflorin against oxidative stress in human retinal pigment epithelium in vitro. Mol. Vis. 2011, 17, 3512–3522. [Google Scholar]
- Wang, J.; Fu, D.; Senouthai, S.; Jiang, Y.; Hu, R.; You, Y. Identification of the transcriptional networks and the involvement in angiotensin II-induced injury after CRISPR/Cas9-mediated knockdown of cyr61 in HEK293T cells. Mediat. Inflamm. 2019, 2019, 8697257. [Google Scholar] [CrossRef] [Green Version]
- Fiocchetti, M.; Cipolletti, M.; Leone, S.; Naldini, A.; Carraro, F.; Giordano, D.; Verde, C.; Ascenzi, P.; Marino, M. Neuroglobin in breast cancer cells: Effect of hypoxia and oxidative stress on protein level, localization, and anti-apoptotic function. PLoS ONE 2016, 11, e0154959. [Google Scholar] [CrossRef] [PubMed] [Green Version]
- Shu, K.; Zhang, Y. Protodioscin protects PC12 cells against oxygen and glucose deprivation-induced injury through miR-124/AKT/Nrf2 pathway. Cell Stress Chaperones 2019, 24, 1091–1099. [Google Scholar] [CrossRef] [PubMed]
- Bolger, A.M.; Lohse, M.; Usadel, B. Trimmomatic: A flexible trimmer for Illumina sequence data. Bioinformatics 2014, 30, 2114–2120. [Google Scholar] [CrossRef] [PubMed] [Green Version]
- Trapnell, C.; Williams, B.A.; Pertea, G.; Mortazavi, A.; Kwan, G.; van Baren, M.J.; Salzberg, S.L.; Wold, B.J.; Pachter, L. Transcript assembly and quantification by RNA-Seq reveals unannotated transcripts and isoform switching during cell differentiation. Nat. Biotechnol. 2010, 28, 511–515. [Google Scholar] [CrossRef] [PubMed] [Green Version]
- Anders, S.; Pyl, P.T.; Huber, W. HTSeq--a Python framework to work with high-throughput sequencing data. Bioinformatics 2015, 31, 166–169. [Google Scholar] [CrossRef] [PubMed]
- Zhuo, Z.; Fang, S.; Hu, Q.; Huang, D.; Feng, J. Digital gene expression profiling analysis of duodenum transcriptomes in SD rats administered ferrous sulfate or ferrous glycine chelate by gavage. Sci. Rep. 2016, 6, 37923. [Google Scholar] [CrossRef] [Green Version]
- Kanehisa, M.; Araki, M.; Goto, S.; Hattori, M.; Itoh, M. KEGG for linking genomes to life and the environment. Nucleic Acids Res. 2008, 36, D480–D484. [Google Scholar] [CrossRef] [PubMed]
- Huai, W.; Liu, X.; Wang, C.; Zhang, Y.; Chen, X.; Chen, X.; Xu, S.; Thomas, T.; Li, N.; Cao, X. KAT8 selectively inhibits antiviral immunity by acetylating IRF3. J. Exp. Med. 2019, 216, 772–785. [Google Scholar] [CrossRef] [PubMed] [Green Version]
- Kim, D.; Langmead, B.; Salzberg, S.L. HISAT: A fast spliced aligner with low memory requirements. Nat. Methods 2015, 12, 357–360. [Google Scholar] [CrossRef] [PubMed] [Green Version]
- Lu, G.-F.; Chen, S.C.; Xia, Y.P.; Ye, Z.M.; Cao, F.; Hu, B. Synergistic inflammatory signaling by cGAS may be involved in the development of atherosclerosis. Aging 2021, 13, 5650–5673. [Google Scholar] [CrossRef]
- Wang, L.; Zeng, D.; Wang, Q.; Liu, L.; Lu, T.; Gao, Y. Screening and Identification of Novel Potential Biomarkers for Breast Cancer Brain Metastases. Front. Oncol. 2021, 11, 784096. [Google Scholar] [CrossRef]
- Song, S.; Wang, Z.; Ren, Y.; Sun, H. Full-length transcriptome analysis of the ABCB, PIN/PIN-LIKES, and AUX/LAX families involved in somatic embryogenesis of DC. fisch. Int. J. Mol. Sci. 2020, 21, 453. [Google Scholar] [CrossRef] [Green Version]
- Yin, J.; Li, Y.; Zhu, X.; Han, H.; Ren, W.; Chen, S.; Bin, P.; Liu, G.; Huang, X.; Fang, R.; et al. Effects of Long-Term Protein Restriction on Meat Quality, Muscle Amino Acids, and Amino Acid Transporters in Pigs. J. Agric. Food Chem. 2017, 65, 9297–9304. [Google Scholar] [CrossRef]
- Xu, K.; Fu, Y.; Gao, H.; Bai, M.; Liu, H.; Duan, Y. L-tryptophan activates the aryl hydrocarbon receptor and induces cell cycle arrest in porcine trophectoderm cells. Theriogenology 2021, 171, 137–146. [Google Scholar] [CrossRef]
- Tian, L.; Huang, J.; Wen, A.; Yan, P. Impaired mitochondrial function results from oxidative stress in the full-term placenta of sows with excessive back-fat. Animals 2020, 10, 360. [Google Scholar] [CrossRef] [Green Version]
- Omonijo, F.A.; Ni, L.; Gong, J.; Wang, Q.; Lahaye, L.; Yang, C. Essential oils as alternatives to antibiotics in swine production. Anim. Nutr. 2018, 4, 126–136. [Google Scholar] [CrossRef]
- Radyuk, S.N. Mechanisms underlying the biological effects of molecular hydrogen. Curr. Pharm. Des. 2021, 27, 626–735. [Google Scholar] [CrossRef] [PubMed]
- Zhang, H.; Yong, H.; Wang, L.; Yu, T.; Tong, D. Immortalization of porcine placental trophoblast cells through reconstitution of telomerase activity. Theriogenology 2016, 85, 1446–1456. [Google Scholar] [CrossRef] [PubMed]
- Zhang, Y.; Sun, D.; Meng, Q.; Guo, W.; Chen, Q.; Zhang, Y. Grifola frondosa polysaccharides induce breast cancer cell apoptosis via the mitochondrial-dependent apoptotic pathway. Int. J. Mol. Med. 2017, 40, 1089–1095. [Google Scholar] [CrossRef] [Green Version]
- Lewandowska, M.; Sajdak, S.; Lubiński, J. The role of early pregnancy maternal selenium levels on the risk for small-for-gestational age newborns. Nutrients 2019, 26, 2298. [Google Scholar] [CrossRef] [PubMed] [Green Version]
- Zhang, H.M.; Zhang, Y. Melatonin: A well-documented antioxidant with conditional pro-oxidant actions. J. Pineal Res. 2015, 57, 131–146. [Google Scholar] [CrossRef]
- Lee, A.R.; Hong, K.; Choi, S.H.; Park, C.; Park, J.K.; Lee, J.I.; Bang, J.I.; Seol, D.-W.; Lee, J.E.; Lee, D.R. Anti-apoptotic regulation contributes to the successful nuclear reprogramming using cryopreserved oocytes. Stem Cell Rep. 2019, 12, 545–556. [Google Scholar] [CrossRef] [Green Version]
- Zhou, T.; Zhou, K.K.; Lee, K.; Gao, G.; Lyons, T.J.; Kowluru, R.; Ma, J.X. The role of lipid peroxidation products and oxidative stress in activation of the canonical wingless-type MMTV integration site (WNT) pathway in a rat model of diabetic retinopathy. Diabetologia 2011, 54, 459–468. [Google Scholar] [CrossRef] [Green Version]
- Wan, Y.; Li, D.; Deng, M.; Liu, Z.; Liu, L.; Wang, F. Comprehensive transcriptome analysis of mRNA expression patterns of early embryo development in goat under hypoxic and normoxic conditions. Biology 2021, 10, 381. [Google Scholar] [CrossRef]
- Diao, Y.; Chen, B.; Wei, L.; Wang, Z. Polyphenols (S3) Isolated from cone scales of pinus koraiensis alleviate decreased bone formation in rat under simulated microgravity. Sci. Rep. 2018, 8, 12719. [Google Scholar] [CrossRef]
- Zhao, C.; Shen, Q. Overexpression of small ubiquitin-like modifier 2 ameliorates high glucose-induced reductions in cardiomyocyte proliferation via the transforming growth factor-β/Smad pathway. Mol. Med. Rep. 2018, 18, 4877–4885. [Google Scholar] [CrossRef] [Green Version]
- Liu, J.; Yang, P.; Zuo, G.; He, S.; Tan, W.; Zhang, X.; Su, C.; Zhao, L.; Wei, L.; Chen, Y.; et al. Long-chain fatty acid activates hepatocytes through CD36 mediated oxidative stress. Lipids Health Dis. 2018, 17, 153. [Google Scholar] [CrossRef] [PubMed] [Green Version]
- Doerdelmann, T.; Kojetin, D.J.; Baird-Titus, J.M.; Solt, L.A.; Burris, T.P.; Rance, M. Structural and biophysical insights into the ligand-free Pitx2 homeodomain and a ring dermoid of the cornea inducing homeodomain mutant. Biochemistry 2012, 51, 665–676. [Google Scholar] [CrossRef] [PubMed] [Green Version]
- Guo, D.; Cheng, L.; Shen, Y.; Li, W.; Li, Q.; Zhong, Y.; Miao, Y. 6-Bromoindirubin-3′-oxime (6BIO) prevents myocardium from aging by inducing autophagy. Aging 2020, 12, 26047–26062. [Google Scholar] [CrossRef] [PubMed]
- Fanoudi, S.; Hosseini, M.; Alavi, M.S.; Boroushaki, M.T.; Hosseini, A.; Sadeghnia, H.R. Everolimus, a mammalian target of rapamycin inhibitor, ameliorated streptozotocin-induced learning and memory deficits via neurochemical alterations in male rats. EXCLI J. 2018, 17, 999–1017. [Google Scholar] [PubMed]
- Tiong, Y.L.; Ng, K.Y.; Koh, R.Y.; Ponnudurai, G.; Chye, S.M. Melatonin prevents oxidative stress-induced mitochondrial dysfunction and apoptosis in high glucose-treated schwann cells via upregulation of Bcl2, NF-κB, mTOR, wnt signalling pathways. Antioxidants 2019, 8, 198. [Google Scholar] [CrossRef] [Green Version]
- Mcmahon, M.; Ding, S.; Acosta-Jimenez, L.P.; Frangova, T.G.; Henderson, C.J.; Wolf, C.R. Measuring in vivo responses to endogenous and exogenous oxidative stress using a novel haem oxygenase 1 reporter mouse. J. Physiol. 2018, 596, 105–127. [Google Scholar] [CrossRef] [Green Version]
- Yeh, S.J.; Chang, C.A.; Li, C.W.; Wang, L.H.C.; Chen, B.S. Comparing progression molecular mechanisms between lung adenocarcinoma and lung squamous cell carcinoma based on genetic and epigenetic networks: Big data mining and genome-wide systems identification. Oncotarget 2019, 10, 3760–3806. [Google Scholar] [CrossRef] [Green Version]
- Vangala, R.K.; Ravindran, V.; Ghatge, M.; Shanker, J.; Arvind, P.; Bindu, H.; Shekar, M.; Rao, V.S. Integrative bioinformatics analysis of genomic and proteomic approaches to understand the transcriptional regulatory program in coronary artery disease pathways. PLoS ONE 2013, 8, e57193. [Google Scholar] [CrossRef] [Green Version]
- Fox, M.E.; Lobo, M.K. The molecular and cellular mechanisms of depression: A focus on reward circuitry. Mol. Psychiatry 2019, 24, 1798–1815. [Google Scholar] [CrossRef]
- Stoner, G.D.; Dombkowski, A.A.; Reen, R.K.; Cukovic, D.; Salagrama, S.; Wang, L.S.; Lechner, J.F. Carcinogen-altered genes in rat esophagus positively modulated to normal levels of expression by both black raspberries and phenylethyl isothiocyanate. Cancer Res. 2008, 68, 6460–6467. [Google Scholar] [CrossRef] [Green Version]
- Mcconnachie, L.A.; White, C.C.; Botta, D.; Zadworny, M.E.; Cox, D.P.; Beyer, R.P.; Hu, X.; Eaton, D.L.; Gao, X.; Kavanagh, T.J. Heme oxygenase expression as a biomarker of exposure to amphiphilic polymer-coated CdSe/ZnS quantum dots. Nanotoxicology 2013, 7, 181–191. [Google Scholar] [CrossRef] [PubMed] [Green Version]
- Banerjee, S.; Shah, S.K.; Melnyk, S.B.; Pathak, R.; Hauer-Jensen, M.; Pawar, S.A. Cebpd is essential for gamma-tocotrienol mediated protection against radiation-induced hematopoietic and intestinal injury. Antioxidants 2018, 7, 55. [Google Scholar] [CrossRef] [PubMed] [Green Version]
- Zhao, X.; Jiang, X.; Liu, Z.; Zhou, M.; Zhang, J.; Wang, X.; Li, X. Long noncoding RNA VIM antisense RNA 1 (VIM-AS1) plays an important role in development of preeclampsia by regulation of epithelial mesenchymal transition. Med. Sci. Monit. 2019, 25, 8306–8314. [Google Scholar] [CrossRef] [PubMed]
- Eltoweissy, M.; Müller, G.A.; Bibi, A.; Nguye, P.V.; Dihazi, G.H.; Müller, C.A.; Dihazi, H. Proteomics analysis identifies PARK7 as an important player for renal cell resistance and survival under oxidative stress. Mol. Biosyst. 2011, 7, 1277–1288. [Google Scholar] [CrossRef] [PubMed] [Green Version]
- Mor-Vaknin, N.; Legendre, M.; Yu, Y.; Serezani, C.H.C.; Garg, S.K.; Jatzek, A.; Swanson, M.D.; Gonzalez-Hernandez, M.J.; Teitz-Tennenbaum, S.; Punturieri, A.; et al. Murine colitis is mediated by vimentin. Sci. Rep. 2013, 3, 1045. [Google Scholar] [CrossRef] [PubMed] [Green Version]
- Feng, S.; Wang, J.; Zhang, Y.; Creighton, C.J.; Ittmann, M. FGF23 promotes prostate cancer progression. Oncotarget 2015, 6, 17291–17301. [Google Scholar] [CrossRef] [PubMed] [Green Version]
- Baron, V.; De Gregorio, G.; Krones-Herzig, A.; Virolle, T.; Calogero, A.; Urcis, R.; Mercola, D. Inhibition of Egr-1 expression reverses transformation of prostate cancer cells in vitro and in vivo. Oncogene 2003, 22, 4194–4204. [Google Scholar] [CrossRef] [Green Version]
- Lou, Z.; Wei, J.; Riethman, H.; Baur, J.A.; Wright, W.E. Telomere length regulates ISG15 expression in human cells. Aging 2009, 1, 608. [Google Scholar] [CrossRef] [Green Version]
- Vuillier, F.; Li, Z.; Commere, P.H.; Dynesen, L.T.; Pellegrini, S. USP18 and ISG15 coordinately impact on SKP2 and cell cycle progression. Sci. Rep. 2019, 9, 4066. [Google Scholar] [CrossRef] [Green Version]
- Guo, T.; Wang, W.; Hui, Z.; Liu, Y.; Zhou, C. ISL1 Promotes Pancreatic Islet Cell Proliferation. PLoS ONE 2011, 6, e22387. [Google Scholar] [CrossRef] [Green Version]
Figure 1.
Effect of H2O2 on antioxidant properties of PTr2 cells. (A) The PTr2 cells were treated with different concentrations of H2O2 for 4 h, and then the cell vitality was detected using a CCK-8 assay. (B) The PTr2 Cells were cultured with different concentrations of MT for 24 h before incubated with 120 μM H2O2 for 4 h and cell viability was detected using a CCK-8 assay. The data are expressed as the means ± SEM from at least 6 separate experiments. p < 0.05 was considered to be statistically significant. p > 0.05 (ns), p < 0.01 (**), p < 0.0001 (****).

Figure 2.
Effects of MT treatment on H2O2-induced apoptosis in PTr2 cells. The PTr2 cells were treated with medium as control (A) and MT at the concentrations of 0 (B), 100 (C), 250 (D), 500 (E), and 1000 (F) for 24 h and then exposed to H2O2 for 4 h. (G) Histograms showed that distribution of apoptotic cells after different treatment. The data are expressed as the means ± SEM from at least 6 separate experiments. p < 0.05 was considered to be statistically significant. p > 0.05 (ns), p < 0.01 (**), p < 0.0001 (***).

Figure 3.
Effect of MT on H2O2-induced release of ROS in PTr2 cells. (A) Intracellular ROS level was detected by flow cytometry; (B) Histogram analysis showing the intracellular ROS levels. The data are expressed as the means ± SEM from at least 6 separate experiments. p < 0.05 was considered to be statistically significant. p > 0.05 (ns), p < 0.0001 (****).

Figure 4.
Effect of MT on mRNAs expression of PTr2 cells. (A) The volcano figure analysis of differentially expressed mRNAs in MT and control groups of porcine trophectoderm cells by RNA-seq (B) The volcano figure analysis of differentially expressed mRNAs in MH and H2O2 groups of PTr2 cells by RNA-seq. The pink, blue, and grey colors represent the terms means upregulation downregulation and normal expression, respectively. (C) Cluster analysis of DEGs by the FPKM value. The x-axis indicates the samples in the different groups. The y-axis is the gene cluster across different groups. Green indicates the highly expressed genes, and red indicates the genes with low expression by the value of log10 (FPKM + 1).

Figure 5.
KEGG pathway enrichment, GO functional annotation and PPI network analysis for DEGs. (A) the top 30 enriched GO terms (MT vs. CON); (B)the top 30 enriched GO terms (MH vs. H2O2); The y-axis represents enrichment factor. The x-axis represents GO terms. The pathways with numbers of differential genes greater than 2 were screened. (C) the top 20 KEGG enriched pathways (MT vs. CON); (D) the top 20 KEGG enriched pathways (MH vs. H2O2); The y-axis The y-axis corresponds to the KEGG Pathway. The x-axis shows the enrichment factor. The color of the dot represents the p-value and the size of the dot represents the number of DEGs mapped to the reference pathways. (E) Module 1 (MT vs. CON). (F) Module 2 (MH vs. H2O2). The color indicate in red (high score) and yellow (low score).

Figure 6.
Comparison of the gene expression levels of RNA-seq with real-time PCR. The right axis represents the expression levels determined by RNA-seq in FPKM units, and the left axis represents gene expression levels determined by real-time PCR. Bars represent the mean ± SEM of three samples. The black column indicates the FPKM value; the grey column indicates the real-time PCR using β-actin as a reference gene.

Figure 7.
MT protects PTr2 cells from H2O2-induced oxidative stress by inducing proteins expression. Western blot analysis were performed to detect the protein levels in different group. The data are expressed as the means ± SEM from at least 3 separate experiments. p < 0.05 was considered to be statistically significant. p > 0.05 (ns), p < 0.05 (*), p < 0.0001 (****).


Table 1.
RT-qPCR measurement of differential gene expression.
| Gene Name | CON | MT | p-Value | H2O2 | MH | p-Value |
|---|---|---|---|---|---|---|
| HMOX1 | 1 ± 0.0613 | 0.793 ± 0.109 | 0.046 | 24.073 ± 2.338 | 35.906 ± 5.714 | 0.029 |
| VIM | 1 ± 0.057 | 2.204 ± 0.187 | 0.005 | 0.629 ± 0.077 | 3.228 ± 0.710 | 0.003 |
| WFDC1 | 1 ± 0.078 | 1.488 ± 0.151 | 0.008 | 0.711 ± 0.083 | 2.502 ± 0.469 | 0.003 |
| MXI1 | 1 ± 0.0416 | 2.164 ± 0.304 | 0.003 | 0.417 ± 0.034 | 2.337 ± 0.559 | 0.004 |
| PLAG1 | 0.999 ± 0.078 | 1.887 ± 0.134 | 0.001 | 0.163 ± 0.015 | 0.773 ± 0.161 | 0.003 |
| EGR3 | 1 ± 0.106 | 1.948 ± 0.366 | 0.013 | 1.868 ± 0.134 | 42.606 ± 4.535 | 0.004 |
The RT-qPCR results are expressed as the mean ± SEM of at least three independent experiments.
Publisher’s Note: MDPI stays neutral with regard to jurisdictional claims in published maps and institutional affiliations. |
© 2022 by the authors. Licensee MDPI, Basel, Switzerland. This article is an open access article distributed under the terms and conditions of the Creative Commons Attribution (CC BY) license (https://creativecommons.org/licenses/by/4.0/).
Share and Cite
MDPI and ACS Style
Fu, Y.; Chen, Y.; Jin, Z.; Gao, H.; Song, G.; Wang, Q.; Xu, K. Melatonin Alleviates Oxidative Stress Induced by H2O2 in Porcine Trophectoderm Cells. Antioxidants 2022, 11, 1047. https://doi.org/10.3390/antiox11061047
AMA Style
Fu Y, Chen Y, Jin Z, Gao H, Song G, Wang Q, Xu K. Melatonin Alleviates Oxidative Stress Induced by H2O2 in Porcine Trophectoderm Cells. Antioxidants. 2022; 11(6):1047. https://doi.org/10.3390/antiox11061047
Chicago/Turabian StyleFu, Yawei, Yue Chen, Zhao Jin, Hu Gao, Gang Song, Qian Wang, and Kang Xu. 2022. "Melatonin Alleviates Oxidative Stress Induced by H2O2 in Porcine Trophectoderm Cells" Antioxidants 11, no. 6: 1047. https://doi.org/10.3390/antiox11061047
Note that from the first issue of 2016, this journal uses article numbers instead of page numbers. See further details here.