1. Introduction
Pepper (
Capsicum annuum L.) is one of the most consumed vegetable and spice crops. Despite its numerous characteristics that determine the consumer acceptance of the fruit, it is still highly sought after worldwide. While shape and pungency are also determining factors, colour in particular ranks very high in the perceived palatability and perceived flavour intensity of fruits/vegetables [
1,
2,
3]. Colours of the immature pepper fruits vary from ivory to green, and newer varieties may even exhibit different shades of purple, whereas the colouration of mature fruits of cultivated peppers ranges from white through yellow, orange and red to even a brownish hue. The main determinants of colour in pepper fruit are the chlorophyll, carotenoid and anthocyanin pigments [
4,
5,
6,
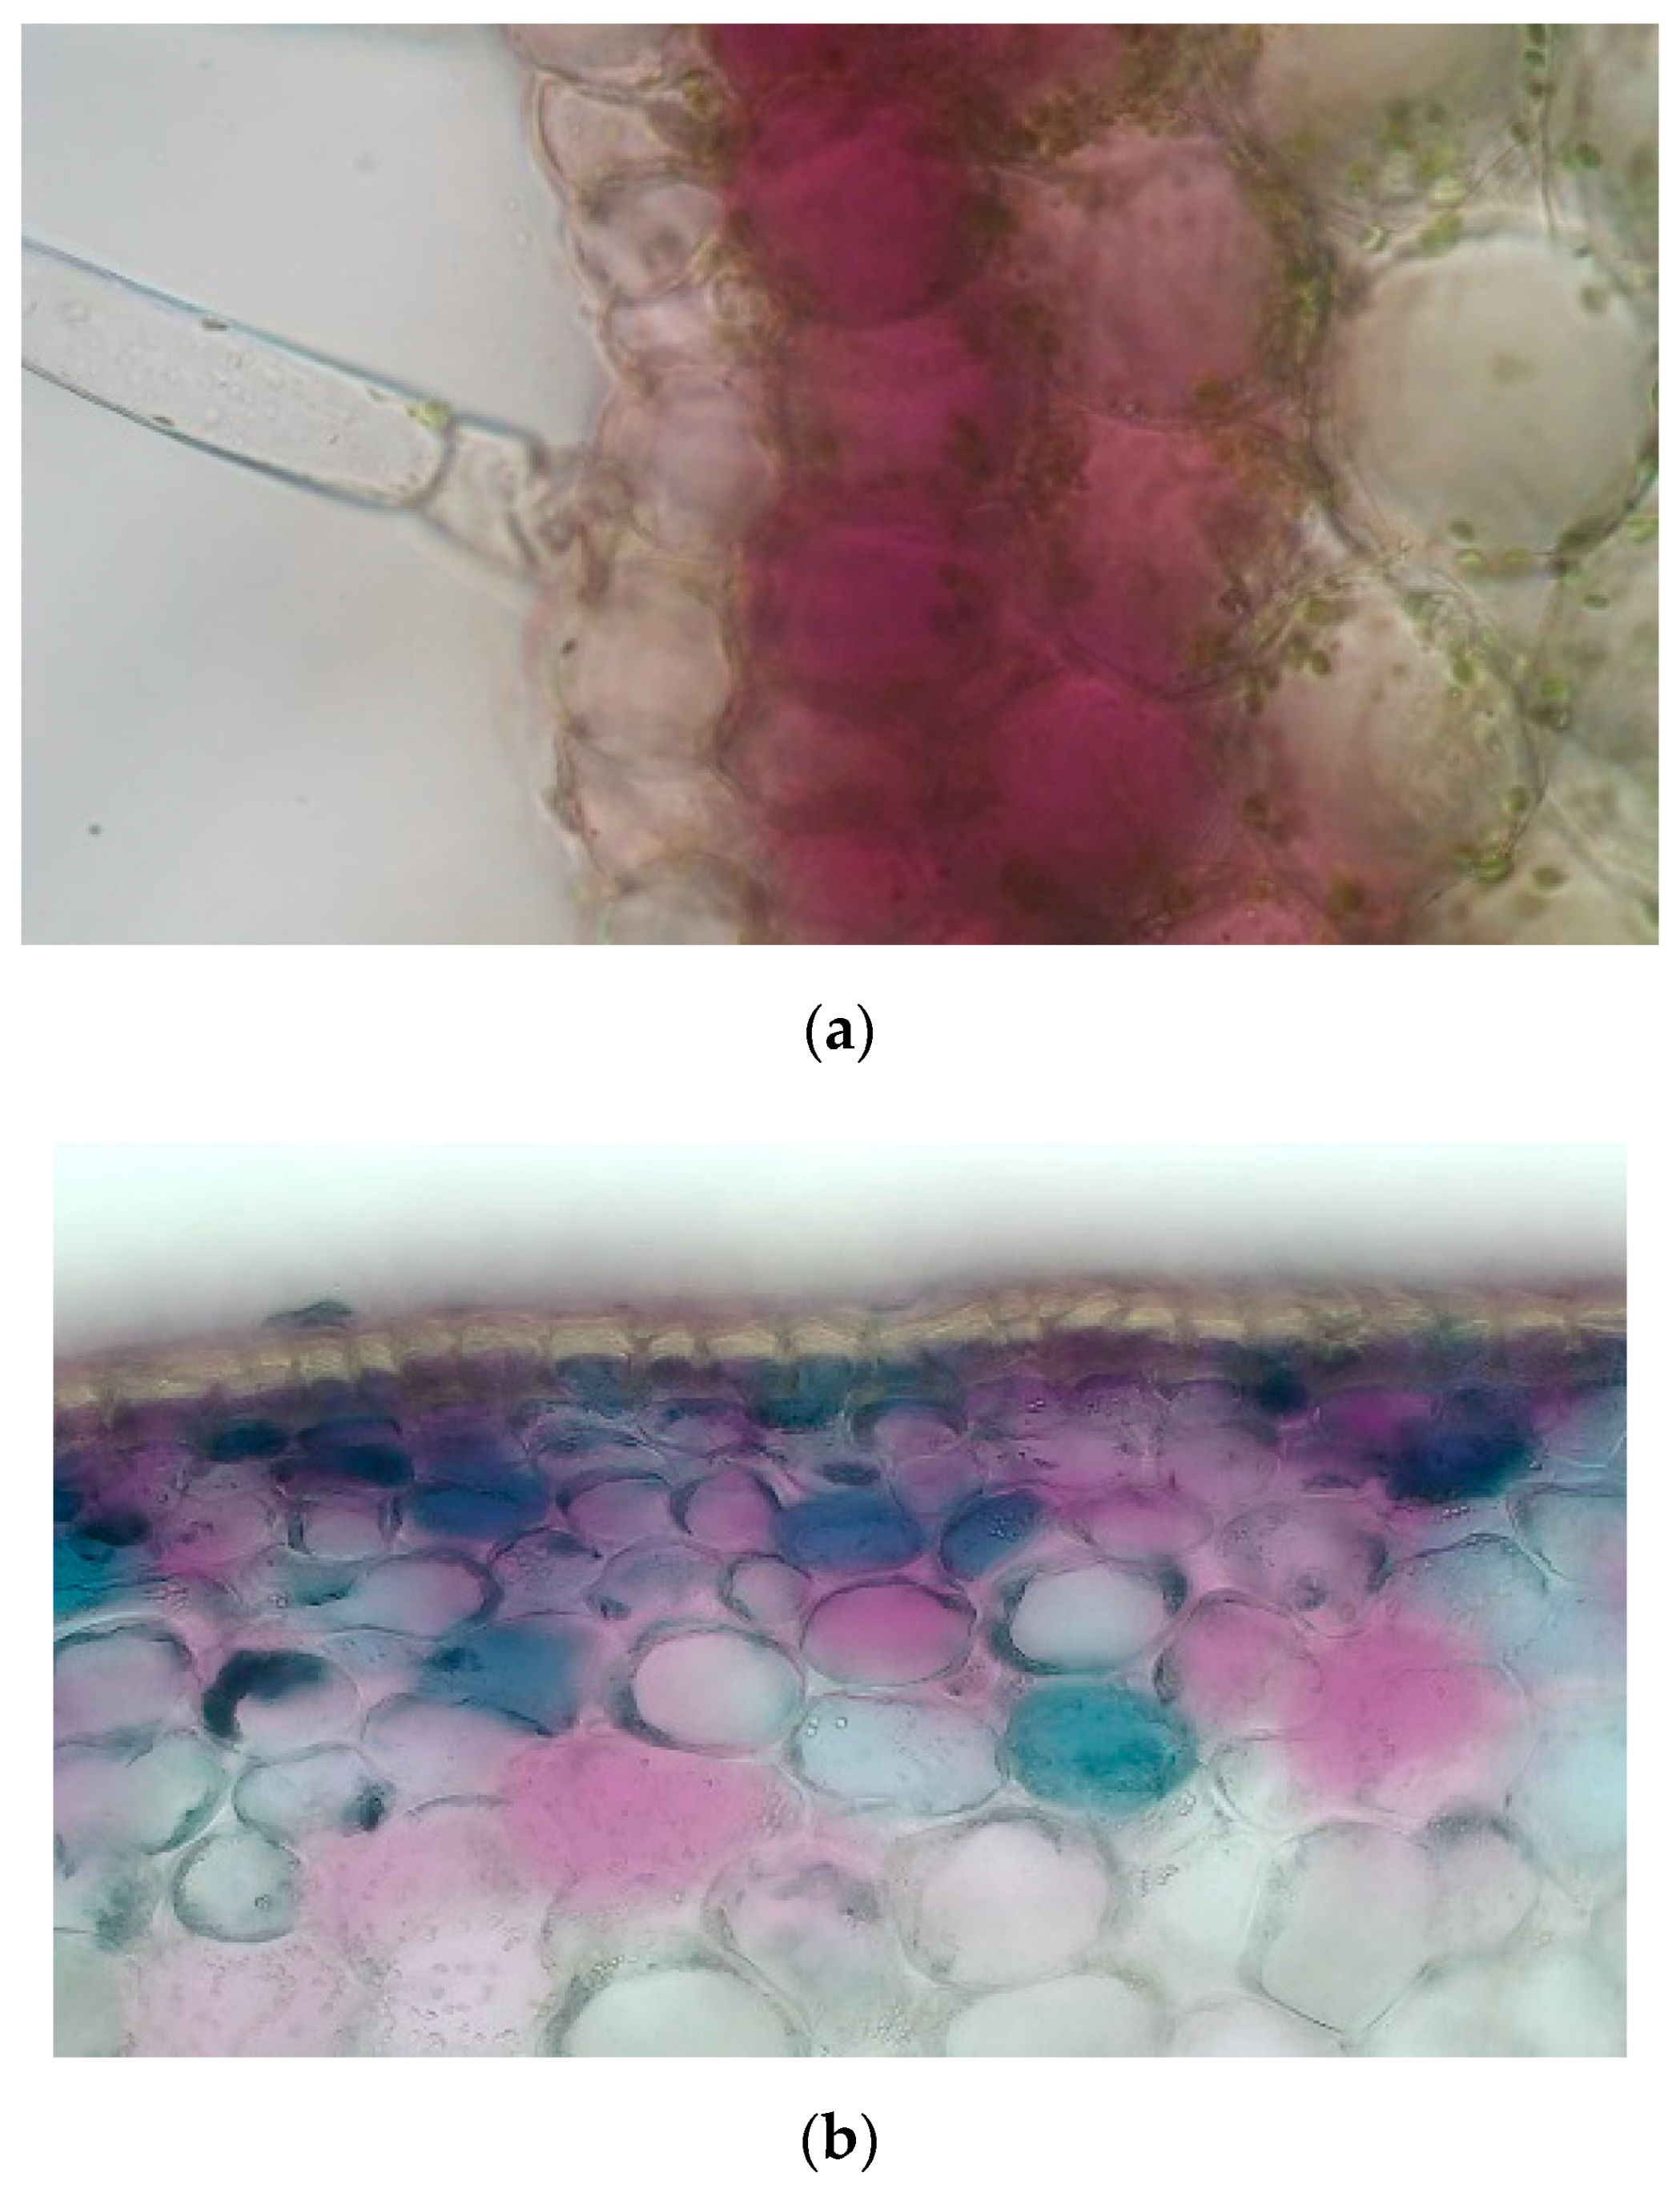
7]. These pigments are stored in different cell compartments; chlorophylls are located within the chloroplasts, carotenoids are stored in the chromoplasts, while anthocyanins and other flavonoids are accumulated in vacuoles in the cells’ cytoplasm.
Fruit colour is of upmost importance since pigments affecting the colouration further contribute to a wide variety of functions such as protection against various abiotic stresses, e.g., UV light, excess light, cold temperature, and pathogens. More importantly, they contribute to the flavour and nutraceutical properties since most of these compounds exhibit antioxidant activity. Thus, these phytochemicals possess potential health benefits for a human diet. For instance, carotenoids are involved in the scavenging of both peroxyl radicals and singlet oxygen species (O
2−) [
8]. A carotenoid-rich diet could lower risk of several types of cancer and cardiovascular disease. Capsanthin—a red pigment which is synthesized exclusively in
Capsicum spp.—proved to suppress hydroperoxide formation, and since they decompose slower than other carotenoids found in peppers, their radical scavenging activity lasts longer [
9]. From nutraceutical aspects, various pepper fruits’ carotenoid accumulation is among the highest in plants [
10]. A teaspoon of its powder provides the Recommended Dietary Allowance for vitamin A of an adult person after the conversion of the precursor carotenoids to vitamin A [
11].
Flavonoids are a large class of compounds that are important antioxidants. Numerous studies indicate that a flavonoid-rich diet reduces the risk of coronary heart disease, stroke and lung/breast cancer [
12]. Their antioxidant properties are determined by both the chemical structure and by the redox properties; based on these, they can serve as O
2− quenchers, hydrogen donors or reducing agents. Further, they are efficient against lipid oxidation [
13,
14,
15].
Health-conscious diets are on the rise, and currently there is an ever-growing interest towards flavonoid/anthocyanin-rich functional foods, hence purple fruits and vegetables are commercially valued. The biosynthesis of flavonoids, and subsequently anthocyanins, is regulated by the MYB transcription factors. The production of anthocyanins branches off from the flavonoid pathway and they are synthesized via the early biosynthetic genes (EBGs), e.g., chalcone synthase (
CHS), chalcone isomerase (
CHI), flavanone-3-hydroxylase (
F3H), and the late biosynthetic genes (LBGs) such as dihydroflavonol reductase (
DFR), anthocyanidin synthase (
ANS), flavonoid 3′5′-hydroxylase (
F3′5′H), glutathion S-transferase (
GST), and anthocyanidin 3-O-glucosyltransferase (
UFGT) [
16]. The regulation of the pathway is well studied, although there are still conflicting results which have yet to be clarified. In general, it is agreed that a regulatory complex (MBW), taking up from MYB, bHLH and WD40 transcription factors, initiates the transcription of the LBGs. In the case of pepper, three MYB coding genes are located next to each other on the 10th chromosome. Out of these, so far only the so-called MYBa is said to participate in the biosynthesis [
17,
18].
Many studies examined the phytochemical composition of different pepper cultivars, but there are only a few which monitor the changes of these compounds upon maturation [
19]. In this study, we take differently coloured breeding lines to determine how the colouration affects the nutraceutical properties of the peppers, as well as how the phytochemical composition changes during maturation. Furthermore, we investigate the regulatory mechanism of the anthocyanin biosynthesis with emphasis being put on the MYB transcription factors and their putative role. By this, we can rule out whether the anthocyanin build-up, hence the higher amount of polyphenols in the berries, could add to the overall antioxidant capacity of the pepper. This work could not only assist breeders to select for candidate accessions with great nutritional properties as partners in breeding programs but may also shed light on the basis of the transcriptional regulation of the anthocyanin biosynthesis.
2. Materials and Methods
Mutant pepper breeding lines used for this study were provided by the PepGen Kft. (Budapest, Hungary). In addition, 5 anthocyanin mutant
C. annuum peppers, a
C. annuum ‘Soroksári’ cultivar—which does not synthetize anthocyanins—and an extreme purple
C. chinense ‘Pimienta de Neyde’ (‘Pim. Ney.’) cultivar were applied (
Table 1).
The plants were grown under greenhouse conditions. Ten fruits were gathered at 4 distinct phenophases of the ripening from each genotype. In addition to the two economically ripe stages, green stage 1 (GS1)—20 days post anthesis (dpa), green stage 2 (GS2)—30 dpa, the breaker—40 dpa, when the berries are turning into their biologically ripe colour, and the full biological ripeness stage—60 dpa, were examined. Fruits were cut, seeds, placenta, calyx and pedicel were removed, and the remaining pericarp was flash-frozen in liquid N2. Samples were stored at −70 °C until further use.
2.1. Sample Preparation
For more precise comparison of the breeding lines, during sample preparation we opted for the most measurements to be carried out from the same set of extractions. For the total monomeric anthocyanin (TMA), total phenolic content (TPC) and ferric reducing ability of plasma (FRAP) assays samples (pericarp) were crushed and homogenized in liquid N2. The extraction was carried out with MeOH:H2O:HCOOH (60:39:1 v/v%). Extracts were centrifuged at 4 °C at 4300 rpm for 20 min and the resulting supernatant was used. Until the measurements the prepared samples were stored at −32 °C. For the total flavonoid content (TFC) assay, fruit samples without seeds were sliced and extracted with Milli-Q water in a ration of 1:10. To determine the total carotenoid content (TC), samples were extracted with EtOH:acetone (1:1 v/v%), filtered and kept in dark at −32 °C until use.
Samples for the enzymatic activity of catalase (CAT) and peroxidase (POD) measurements were ground in cold sodium phosphate buffer (25 mM, pH 7.8), supplemented with 0.8 g/l PVP and 1 mM EDTA, and were centrifuged for 20 min at 12,000× g at 4 °C. Supernatant was applied for the studies. For the superoxide dismutase (SOD) assay, 50 mM NaPO4 buffer was supplemented with 1 mM EDTA and 2 w/v% PVP was applied. Samples were centrifuged for 20 min at 12,000× g at 4 °C and the supernatant was used for the studies. Until the measurements, samples were stored at −32 °C. For each measurement 3 technical replicates were applied.
2.2. Total Monomeric Anthocyanin Content (TMA)
Total monomeric anthocyanin content was measured by a pH differential method as described by Lee et al. [
20]. To the samples KOH (pH 1.0) and sodium acetate (NaOAc) (pH 4.5) buffers were measured. After 15 min, absorbance was recorded by a Jenway 6105 UV/Vis spectrophotometer at λ = 520 nm and λ = 700 nm. Total monomeric anthocyanin content was calculated by the following formula:
where
= (
520nm −
700nm)pH 1.0 − (
520n −
700nm)pH 4.5,
(molecular weight) = 449.2 g/mol for cyanidin-3-glucosyde,
= Dilution factor,
= 26,900 molar extinction coefficient for cyanidin-3-glucosyde,
= pathlength in cm. Results are expressed as µg cyanidin-3-glucosyde/g dry weight (dw) (µg cy-3-glu/g).
2.3. Total Polyphenolic Content (TPC)
Total soluble polyphenols were measured with Folin–Ciocalteu reagent according to Singleton and Rossi, at λ = 760 nm with a Jenway 6105 UV/Vis [
21]. TPC was calculated based on the calibration curve of 0, 6, 12, 18, 24 and 30 µg/mL gallic acid, generating the equation of y = 0.0187x − 0.0009, R
2 = 0.9996. The results are expressed as mg gallic acid equivalent (Ga)/g dw.
2.4. Antioxidant Activity (FRAP)
The fruits’ antioxidant capacity was measured by the FRAP assay according to Benzie and Strain, at λ = 593 nm with a Jenway 6105 UV/Vis spectrophotometer [
22]. FRAP was calculated based on the calibration curve of 0, 6, 12, 18, 24 and 30 µmol/L ascorbic acid, generating the equation of y = 0.0478x + 0.0104, R
2 = 0.9997. The results are expressed as µmol ascorbic acid (As) equivalent/g dw.
2.5. Total Flavonoid Content (TFC)
Total flavonoid content was determined according to Sytar et al., aluminium chloride colorimetric method [
23]. From the supernatant, 500 µL was added to 1.5 mL 95% EtOH, 0.1 mLA lCl
3, 0.1 mL potassium acetate and 2.8 mL water. The absorbance was measured at λ = 415 nm using a Jenway 6105 UV/Vis spectrophotometer. TFC was calculated on the basis of the calibration curve of quercetin standard for which 0, 20, 40, 80, 120, 160 and 200 µg/mL quercetin was used, generating the equation of y = 0.0059x + 0.0361, R
2 = 0.9989. Results are expressed as mg quercetin equivalent (Qe)/g dw.
2.6. Total Carotenoid Content (TC)
Total carotenoid content was measured a method described by Hornero-Mendez and Minguez-Mosquera [
24]. Absorbance was measured by a Jenway 6105 UV/Vis spectrophotometer at λ = 452 nm and λ = 472 nm, characteristic absorption maximum of red and yellow carotenoids, respectively, results are expressed as mg/kg dw. The total carotenoid content was calculated using the following formula:
where
= absorbance (measured at either λ = 452 nm or 472 nm),
= total extract volume,
= sample weight and
= 2009 or 2144 (extinction coefficient of capsanthin and β-carotene in acetone, respectively). The sum of the two measurements gives the total carotenoid content.
2.7. Catalase Enzyme Activity (CAT)
The CAT activity measurement was carried out according to Xing et al. [
25]. For the sample extract, sodium phosphate buffer (50 mM, pH 7) and 40 mM H
2O
2 as a substrate was measured. After the addition of the H
2O
2 the change in the absorbance was monitored at λ = 240 nm in 60 s intervals with a Jenway 6105 UV/Vis spectrophotometer. Results are displayed in U/g dw.
2.8. Peroxidase Enzyme Activity (POD)
The POD activity measurement was carried out according to Xing et al., samples were mixed with a buffer containing 8 mM guaiacol and 100 mM sodium phosphate pH 6.4. After the addition of 24 mM H2O2 as a substrate, the change in the absorbance was recorded at λ = 460 nm in 60 s intervals with a Jenway 6105 UV/Vis spectrophotometer. Results are displayed in U/g dw.
2.9. Superoxide Dismutase Enzyme Activity (SOD)
SOD activity was assayed by its ability to inhibit the photochemical reduction of nitroblue tetrazolium according to Beauchamp and Fridovich [
26]. The reaction mixture contained 50 mM sodium phosphate buffer, 10 µM EDTA, 13 mM L-methionine, 75 µM nitroblue tetrazolium (NBT) and 2 µM riboflavin. During the reaction assay preparation, the mixture was kept in dark and to kickstart the reaction, the ready reaction mixture was illuminated with luminescent light for 10 min. Absorbance was measured at λ = 560 nm wavelength. Results are displayed in U/g dw.
2.10. Soluble Solid Content (SSC) and pH
The pH of the berries was measured with LAQUAtwin water quality pocket meter by Horiba (Kyoto, Japan), and their ºBRIX was determined by a digital refractometer, PR-201ᾳ, ATAGO®.
2.11. Determination of Colour Hue
Photos of the collected berries were taken in each phenophase upon sample collection with a Pentax GR2 camera. Average colour was determined with Adobe Photoshop CC (2019), the HEX values were converted to decimals in MS Excel version 2202 and were compared to the results of the other measurements.
2.12. RNA Isolation and Quantitative Real-Time PCR
Total RNA was isolated from the pericarp of fruits in each phenophase with Omega E.Z.N.A.
® Plant RNA Kit (Norcross, GA, USA). The integrity and quantity of the RNA samples were verified and measured by agarose gel electrophoresis and Nanodrop 1000 spectrophotometer by Thermo Fisher Scientific (Waltham, MA, USA), respectively. From the RNA cDNA was synthesized with RevertAid H Minus First Strand cDNA Synthesis Kit by Thermo Fisher Scientific (Waltham, MA, USA) with oligo-dT and random primers were applied, according to the manufacturer’s instructions. The qRT-PCR was carried out in a Stratagene MX3000p instrument using actin as reference gene. For PCRs we used Power Up™ SYBR™ Green Master Mix, Applied Biosystems by Thermo Fisher Scientific (Vilnius, Lithuania) according to the manufacturer’s instructions. Primers used in this study were either published previously by Aza-Gonzalez et al. or were designed by Primer3 using Zunla’s genome as a reference (
Table 2) [
4].
2.13. Statistical Analysis
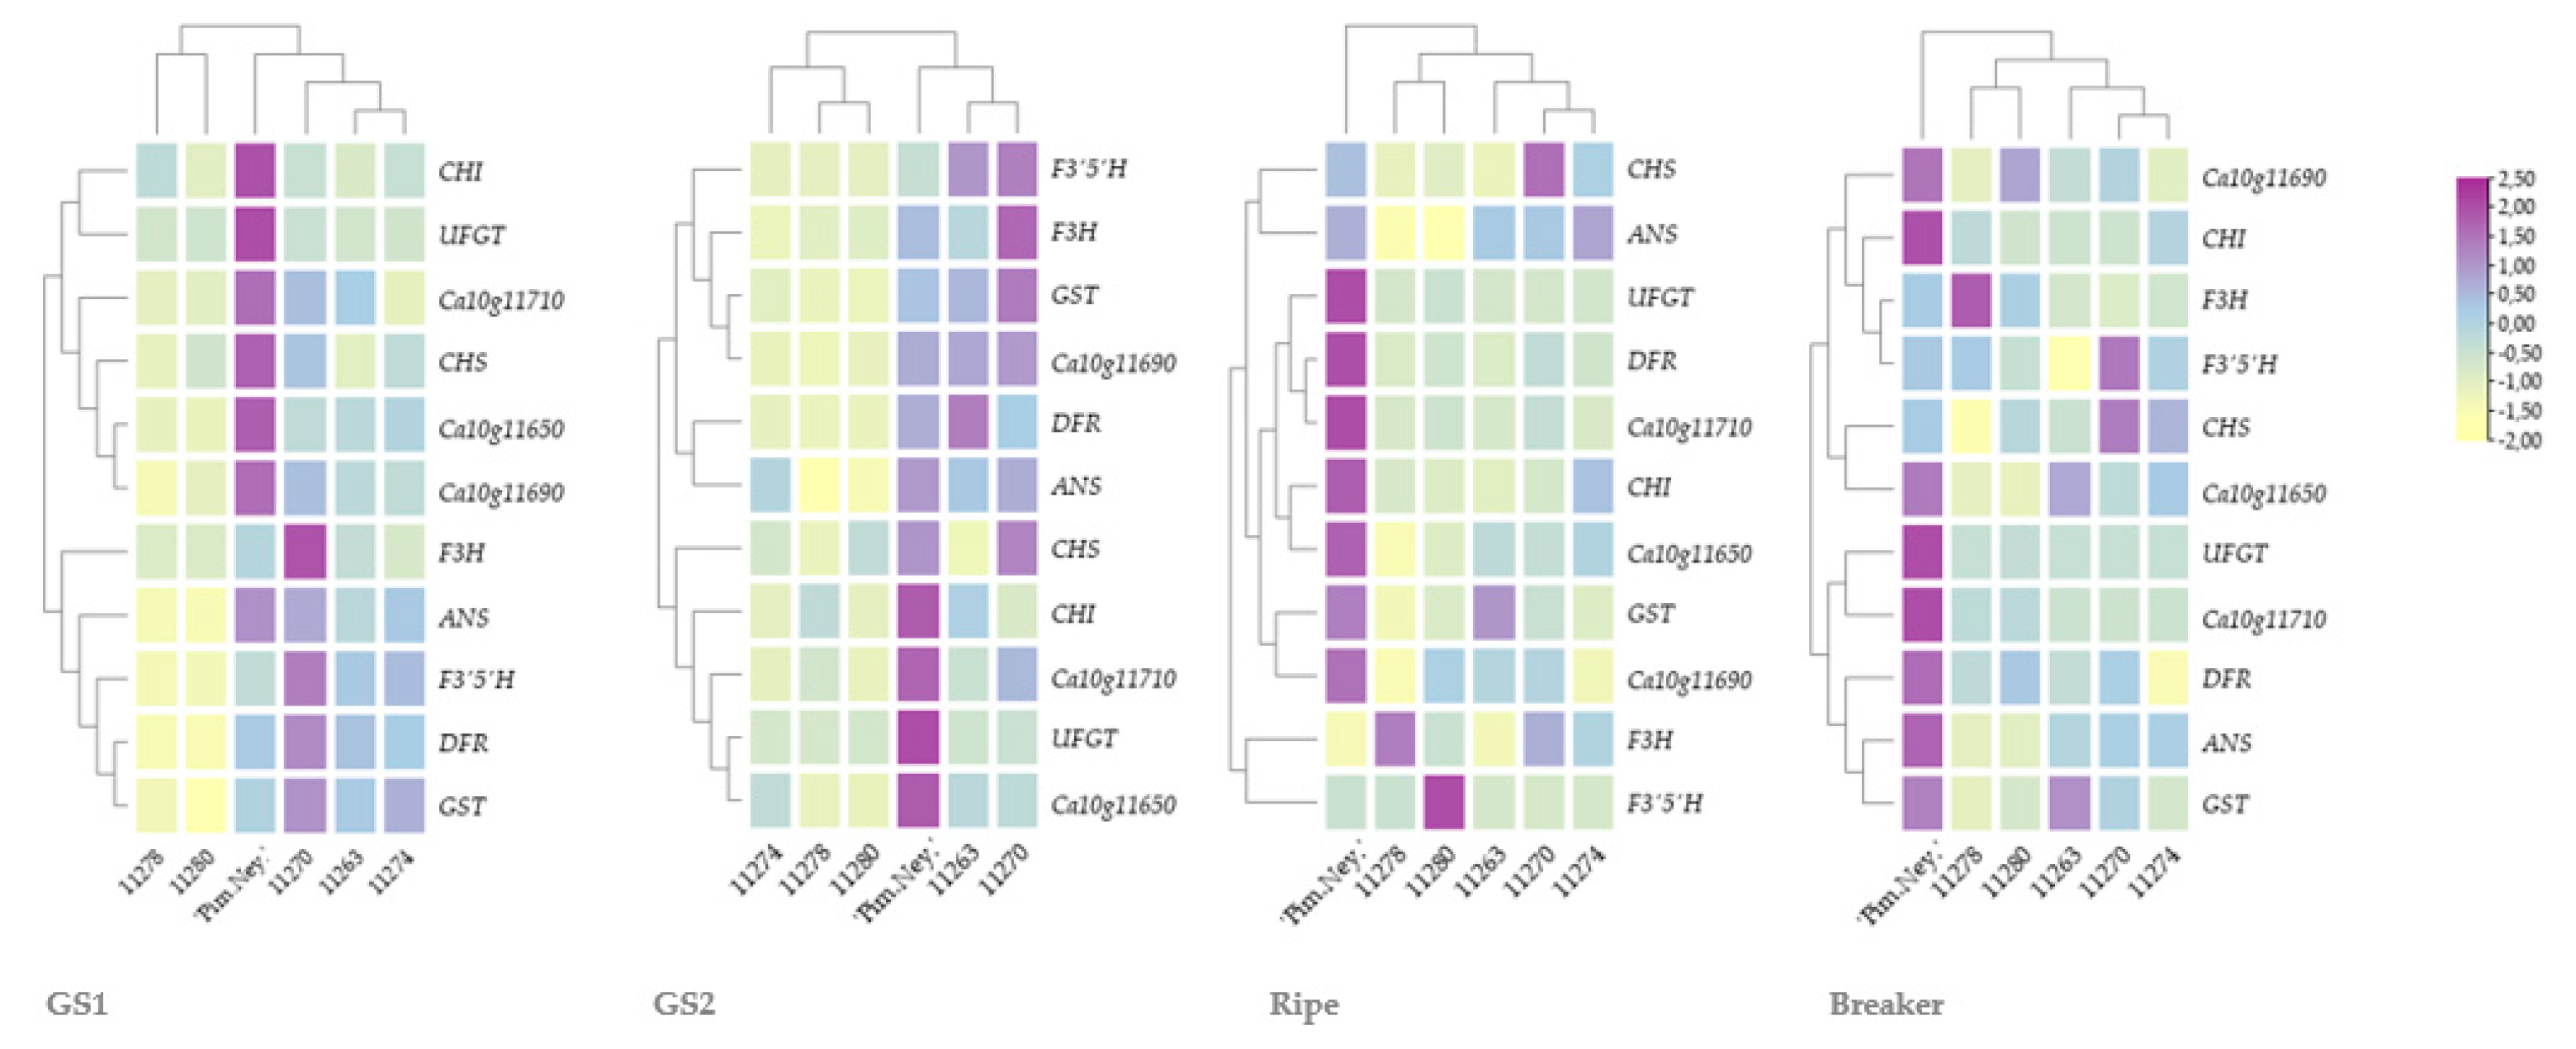
The qRT-PCR data were evaluated via the ddCT method. The heatmap was constructed with TBtools using Eucledian distancing and cladogram branch type [
27]. Microsoft Excel and IBM SPSS 25 were applied to calculate means, standard deviation of the means from the repeated measurements as well as Pearson correlation coefficient and F-value from analysis of variance (ANOVA).
4. Conclusions
Taken together, significant changes both in between the genotypes and in between the different phenophases were observed in the case of enzymatic and non-enzymatic antioxidants. ‘Pim. Ney.’, the extreme purple genotype, exhibited outstanding results for TPC, TFC and FRAP in each phenophase compared to the rest of the samples. This might be due to the elevated amount of anthocyanins, which results in this rich dietary composition. On the other hand, the anthocyanin-pigmented C. annuum breeding lines did not live up to the expectations, since the white-berried breeding lines usually scored higher values for TPC, TFC and FRAP in the early phenophases. Based on this study, economically-ripe purple-berried breeding lines could not serve as functional food solely due to their anthocyanin build-up; however, other genotypes, such as the extreme purple ‘Pim. Ney.’, may be recommended as a dietary supplement or a partner in breeding programs for functional foods.
As for the regulation of anthocyanin biosynthesis, we found that besides Ca10g11650, two other putative regulatory MBYs (Ca10g11690 and Ca10g11710) are also involved in the regulation of the pathway. However, to validate the exact function of the two putative regulatory MYBs, other approaches such as virus-induced gene silencing studies should be applied as well.


 ,
, 


