Author Contributions
Conceptualization, M.S., G.B., U.M. and S.D.; Methodology, M.S., J.H., J.F., D.v.S., J.K., L.H., A.Z., M.B., J.I., U.G.; Formal Analysis, J.H.; Investigation, J.H. , J.F., L.H., A.Z., M.B., J.I.; Resources, J.H.; Data Curation, J.H.; Writing-Original Draft Preparation, J.H.; Writing-Review & Editing, M.S., L.H., D.v.S., M.B., A.Z. U.M., J.I., S.D.; Visualization, J.H.; Supervision, G.B., S.D.; Project Administration, U.M.; Funding Acquisition, U.M., S.D. J.I.
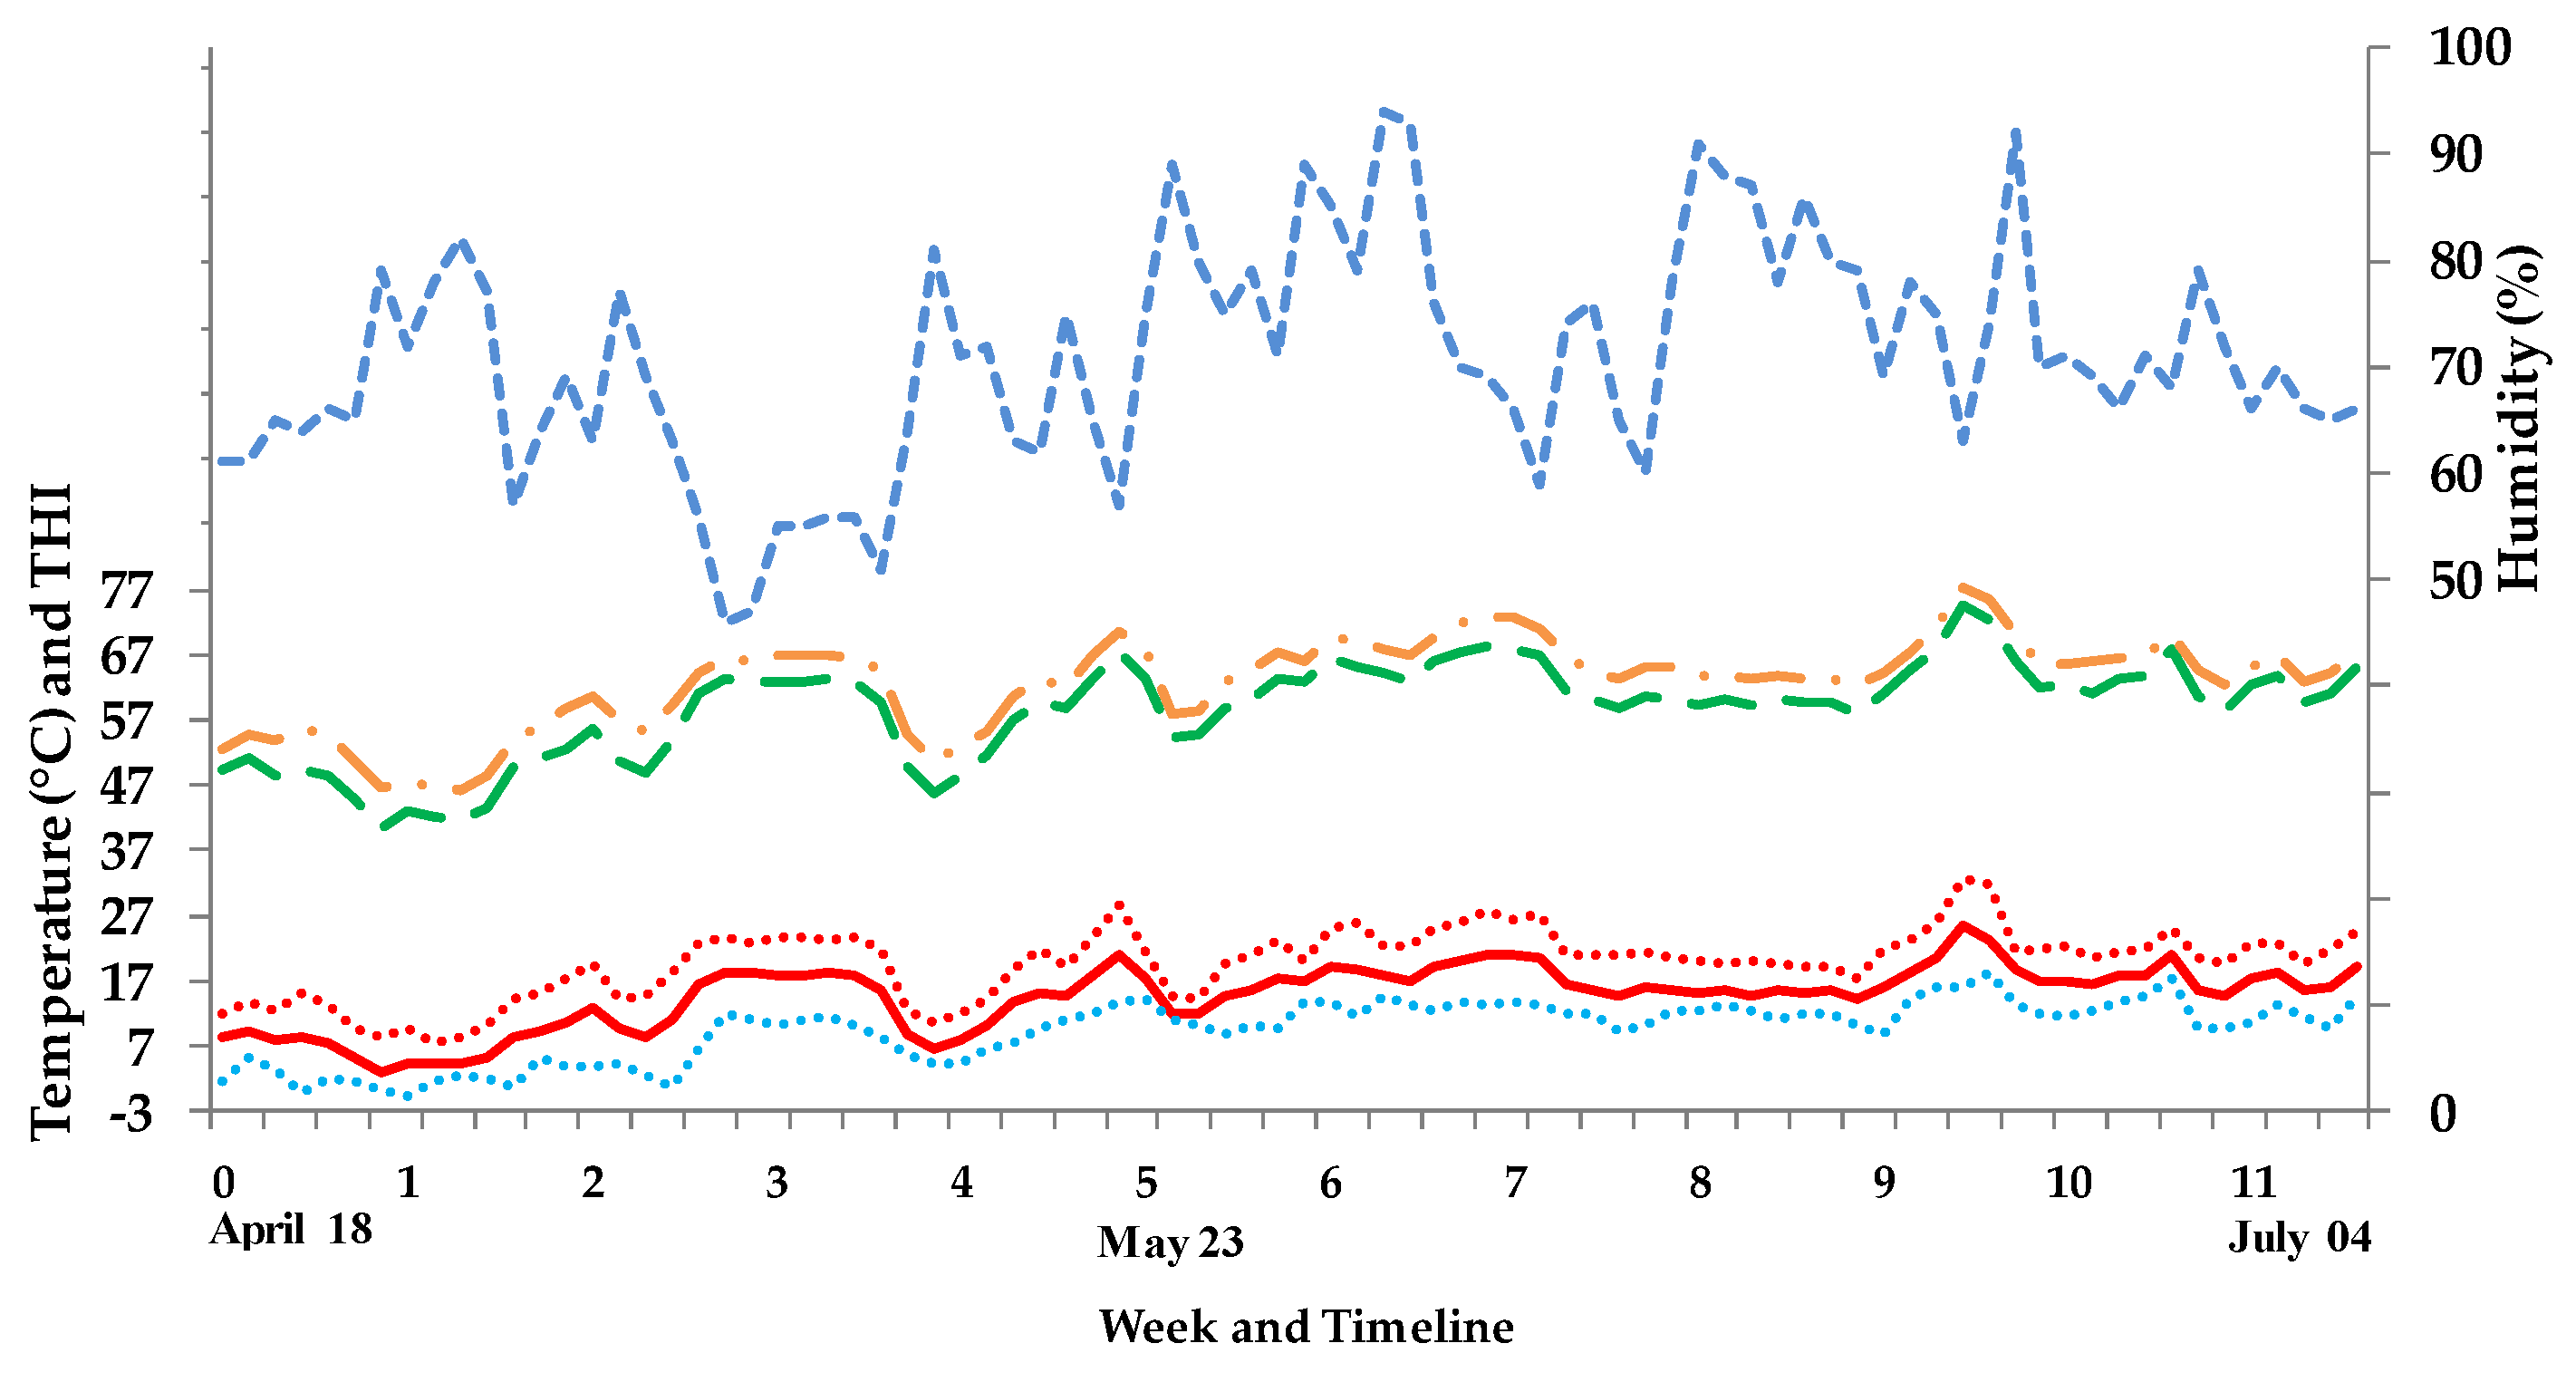
Figure 1.
Daily outdoor average ambient temperature (solid line, red) with minima and maxima (dotted lines; blue, light red), outdoor humidity (small dashed line; blue), outdoor THI (dashed dot line, orange), and indoor THI (dash line; green). THI = temperature humidity indices; calculated according to Hahn [
11];
, where td = dry bulb temperature (°C) and RH = relative humidity.
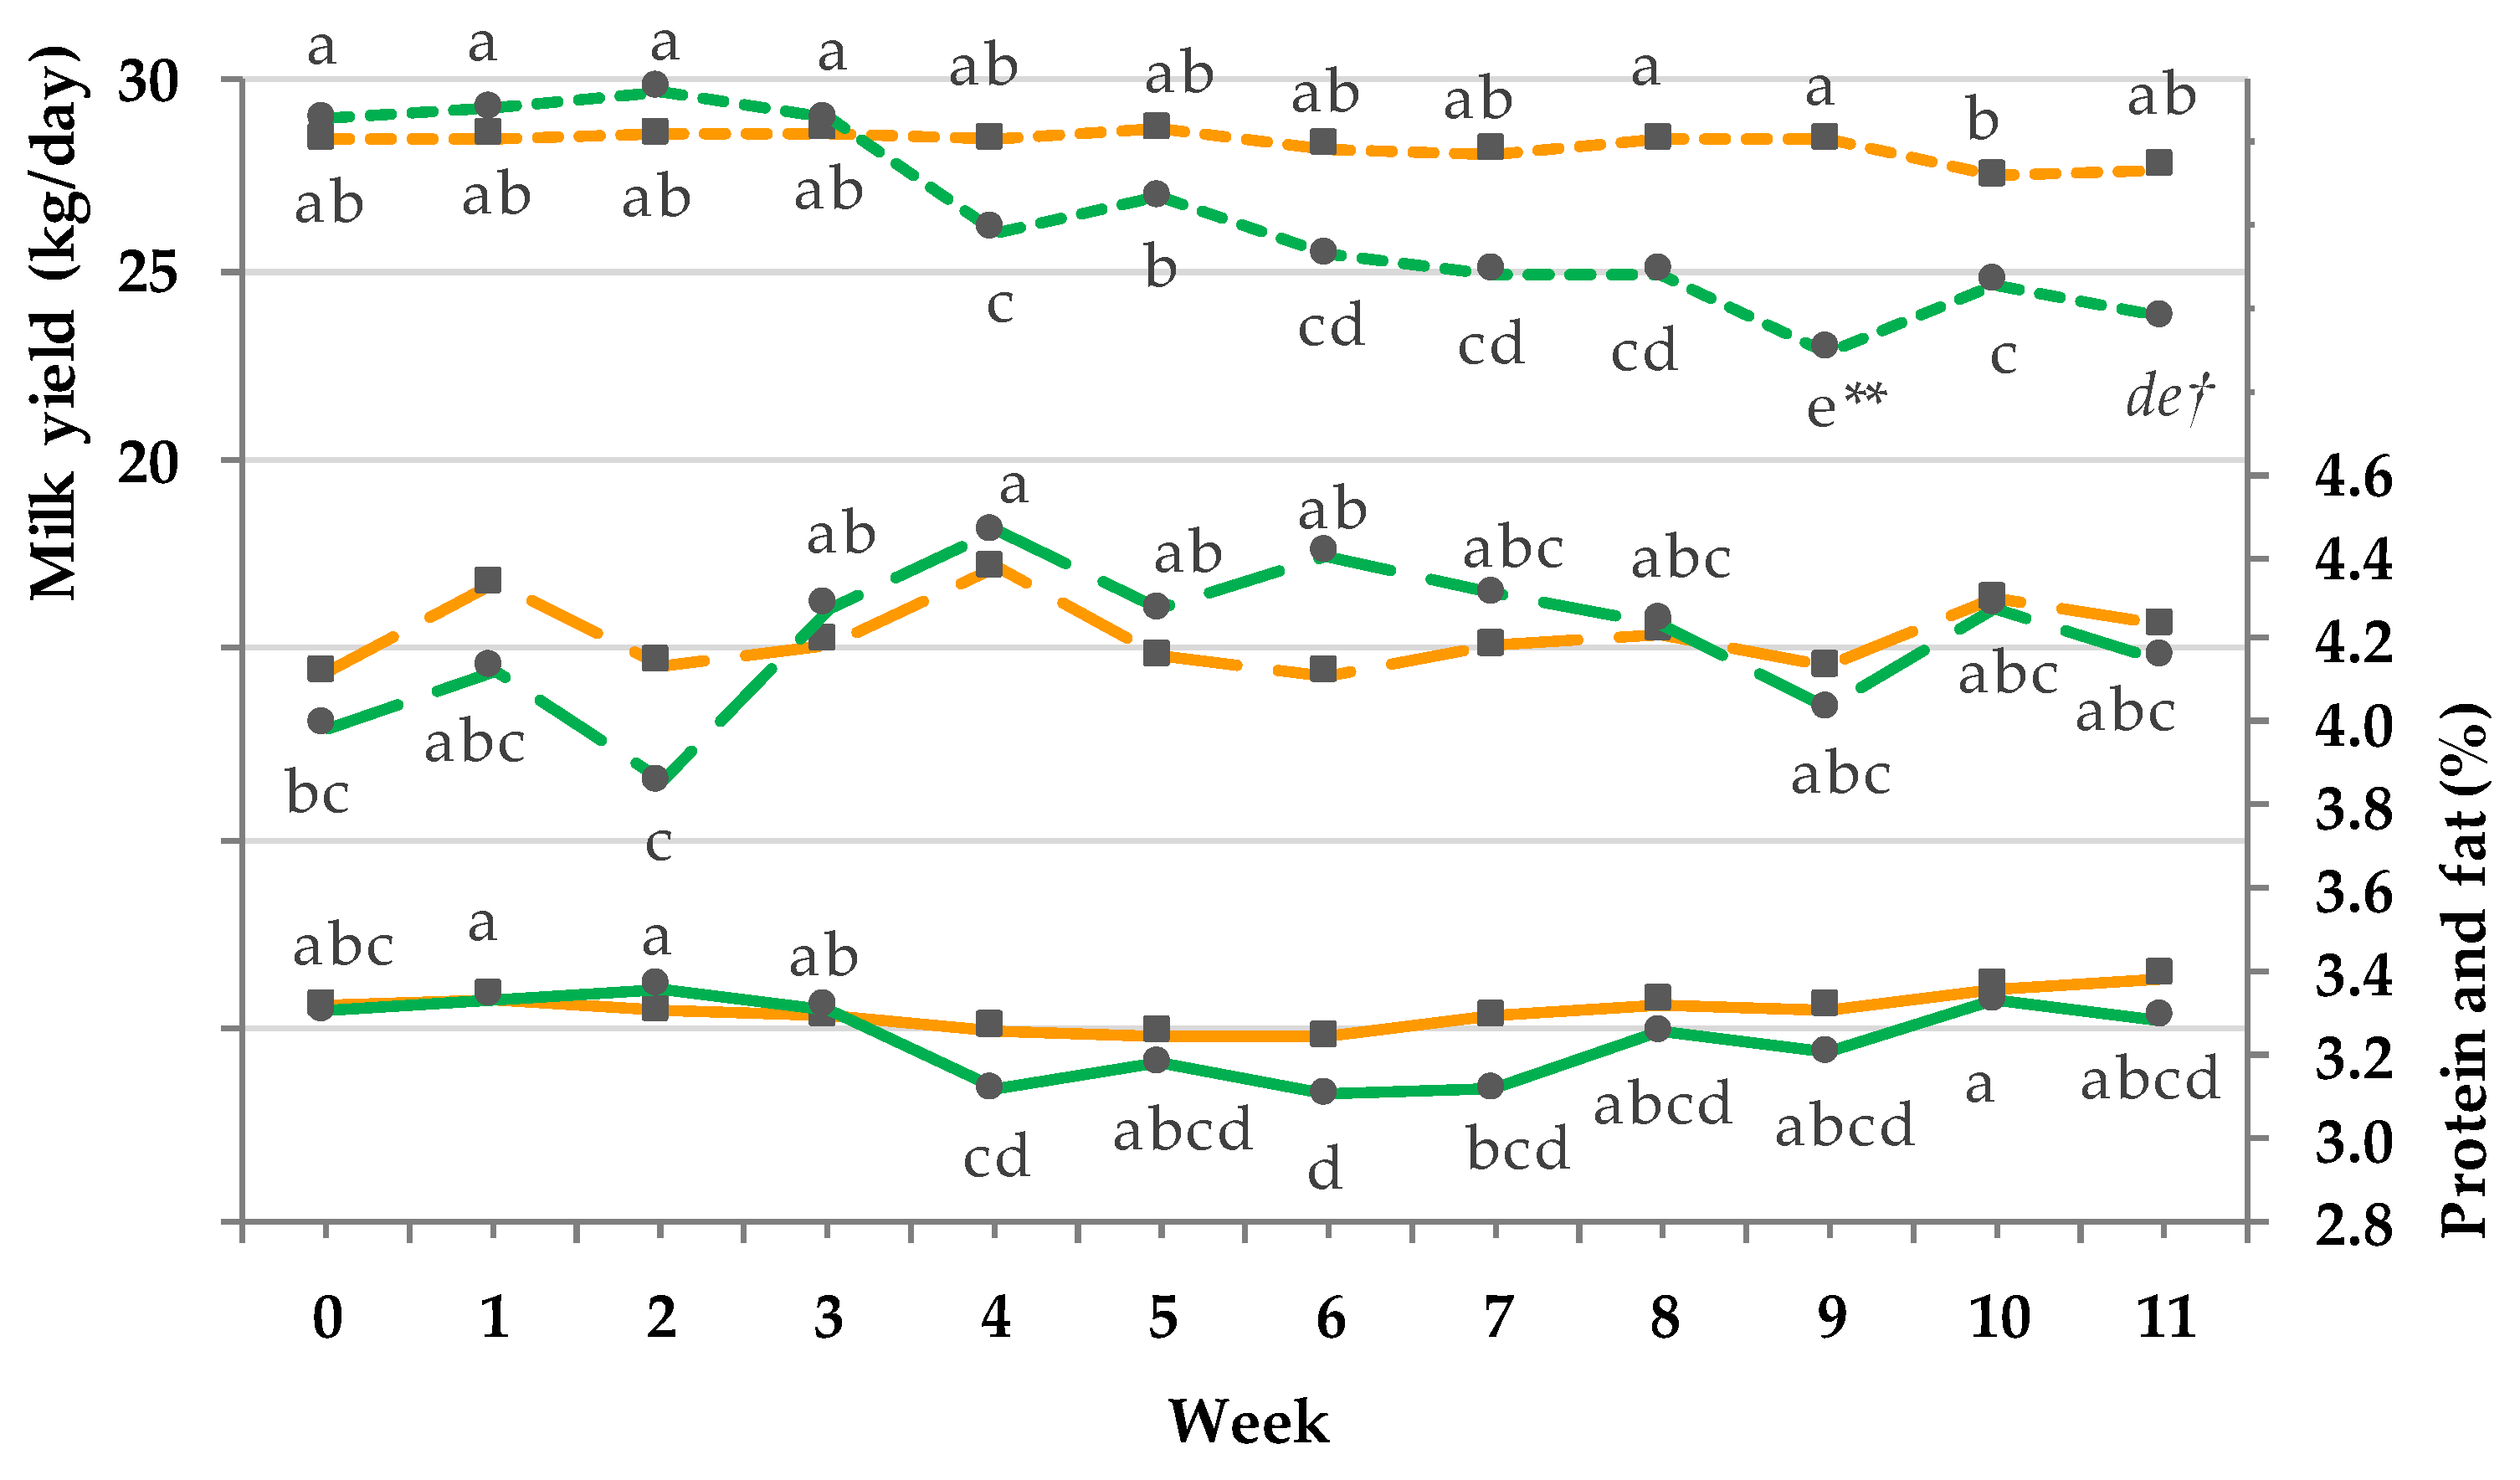
Figure 2.
Effect of a ration change from an indoor-based total mixed ration (TMR) to pasture on milk yield (kg/day, short dashed line, pooled SEM = 0.9), fat (%, long dashed line; pooled SEM = 0.1), and protein (% solid line; pooled SEM = 0.04); ■ = confinement group (CG, n = 31; orange); ● = pasture group (PG, n = 26; green). Significance: milk yield kg/day= group (G): P = 0.104, time (T): p < 0.001, GxT: p < 0.001; fat% = G: p = 0.943, T: p < 0.001, GxT: p < 0.001; protein% = G: p <0.001, T: p < 0.001, GxT: p < 0.05. Different symbols indicate significant differences between groups in particular week (** p ≤ 0.01; † p ≤ 0.1); different letters (a–e) indicate significant differences between weeks within particular groups (p ≤ 0.05). The CG stayed on a TMR-based diet during the entire trial, while the PG was slowly introduced to a pasture-based ration: week 0 and 1 = TMR, week 2 = TMR and 3 h pasture/day, week 3 and 4 = TMR and 12 h pasture/day, and week 5 to 11 = pasture and 4.5 kg DM concentrate/cow/day.
![Animals 08 00169 g002]()
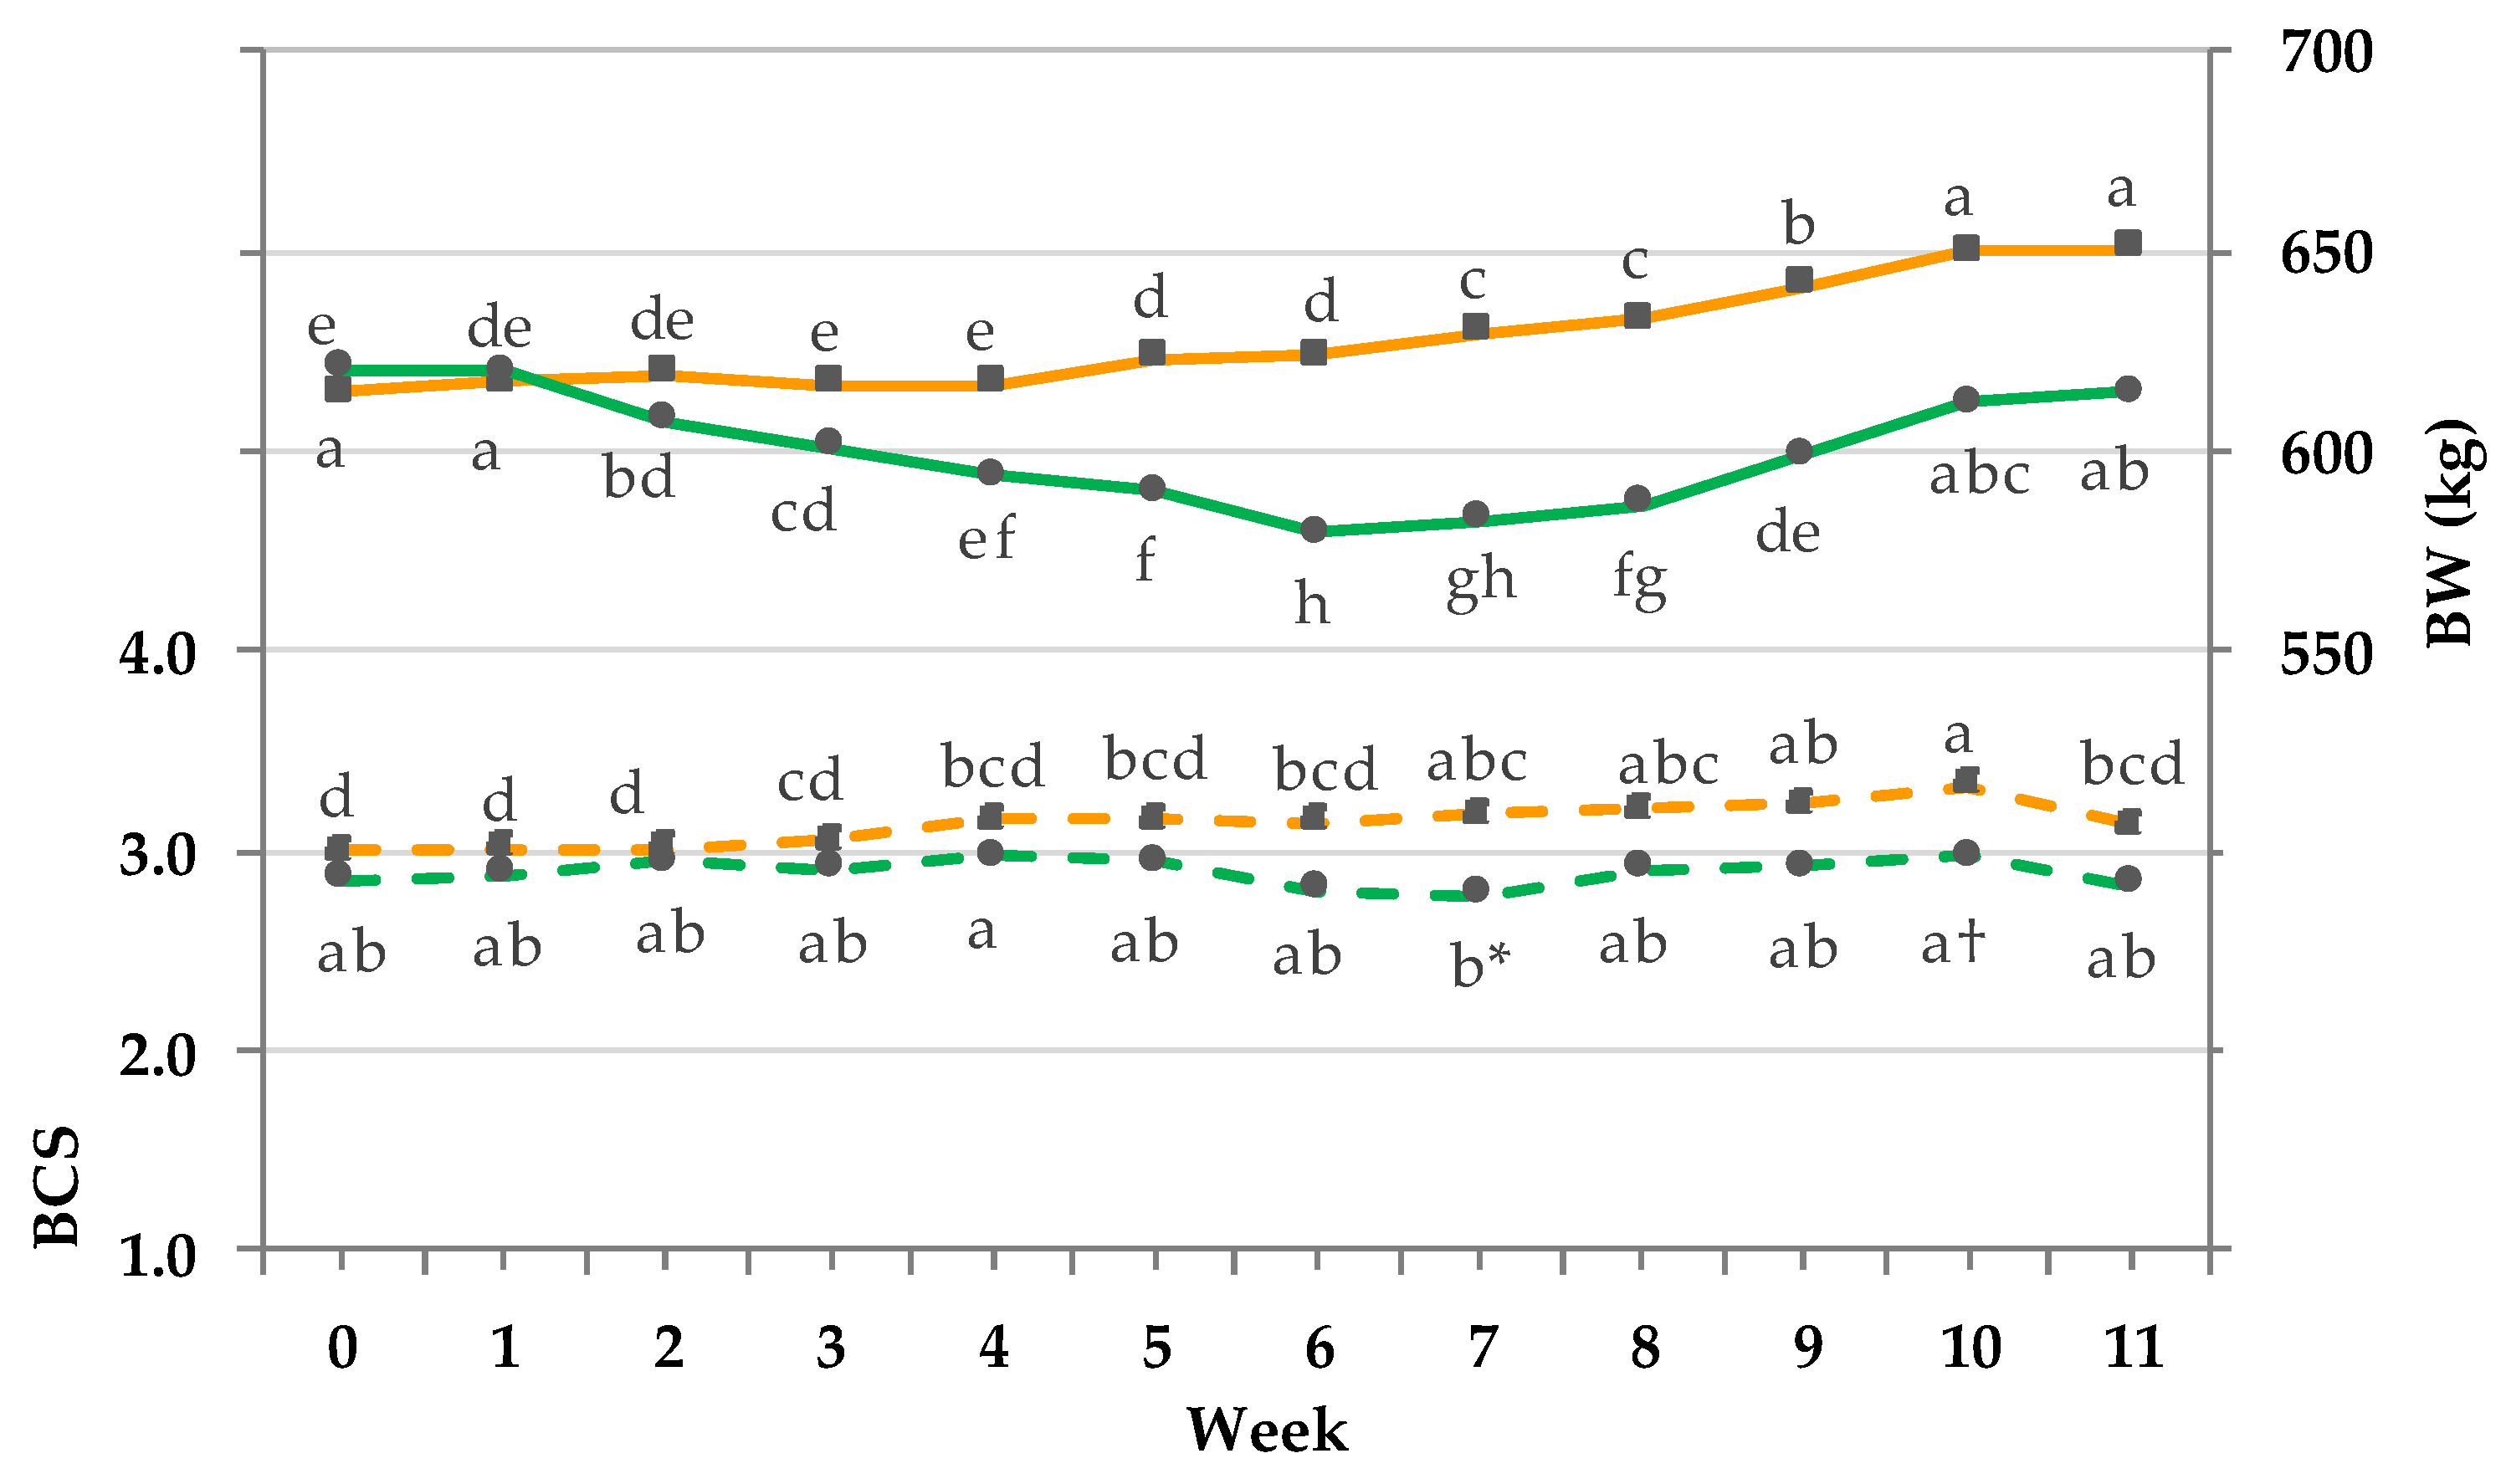
Figure 3.
Effect of a ration change from an indoor-based total mixed ration (TMR) to pasture on body weight (BW) kg (solid line, pooled SEM = 11) and body condition score (BCS) (dashed line; pooled SEM = 0.07); ■ = confinement group (CG, n = 31; orange); ● = pasture group (PG, n = 26; green). Significance: BW = group (G): p < 0.1, time (T): p < 0.001, GxT: p < 0.001; BCS = G: p < 0.05, T: p < 0.001, GxT: p < 0.001. Different letters (a–h) indicate significant differences between weeks within particular groups (p ≤ 0.05). Because of technical problems in week 9 the average BW of week 8 and 10 was assumed for both groups. The CG stayed on a TMR-based diet during the entire trial, while the PG was slowly introduced to a pasture-based ration: week 0 and 1 = TMR, week 2 = TMR and 3 h pasture/day, week 3 and 4 = TMR and 12 h pasture/day, and week 5 to 11 = pasture and 4.5 kg DM concentrate/cow/day.
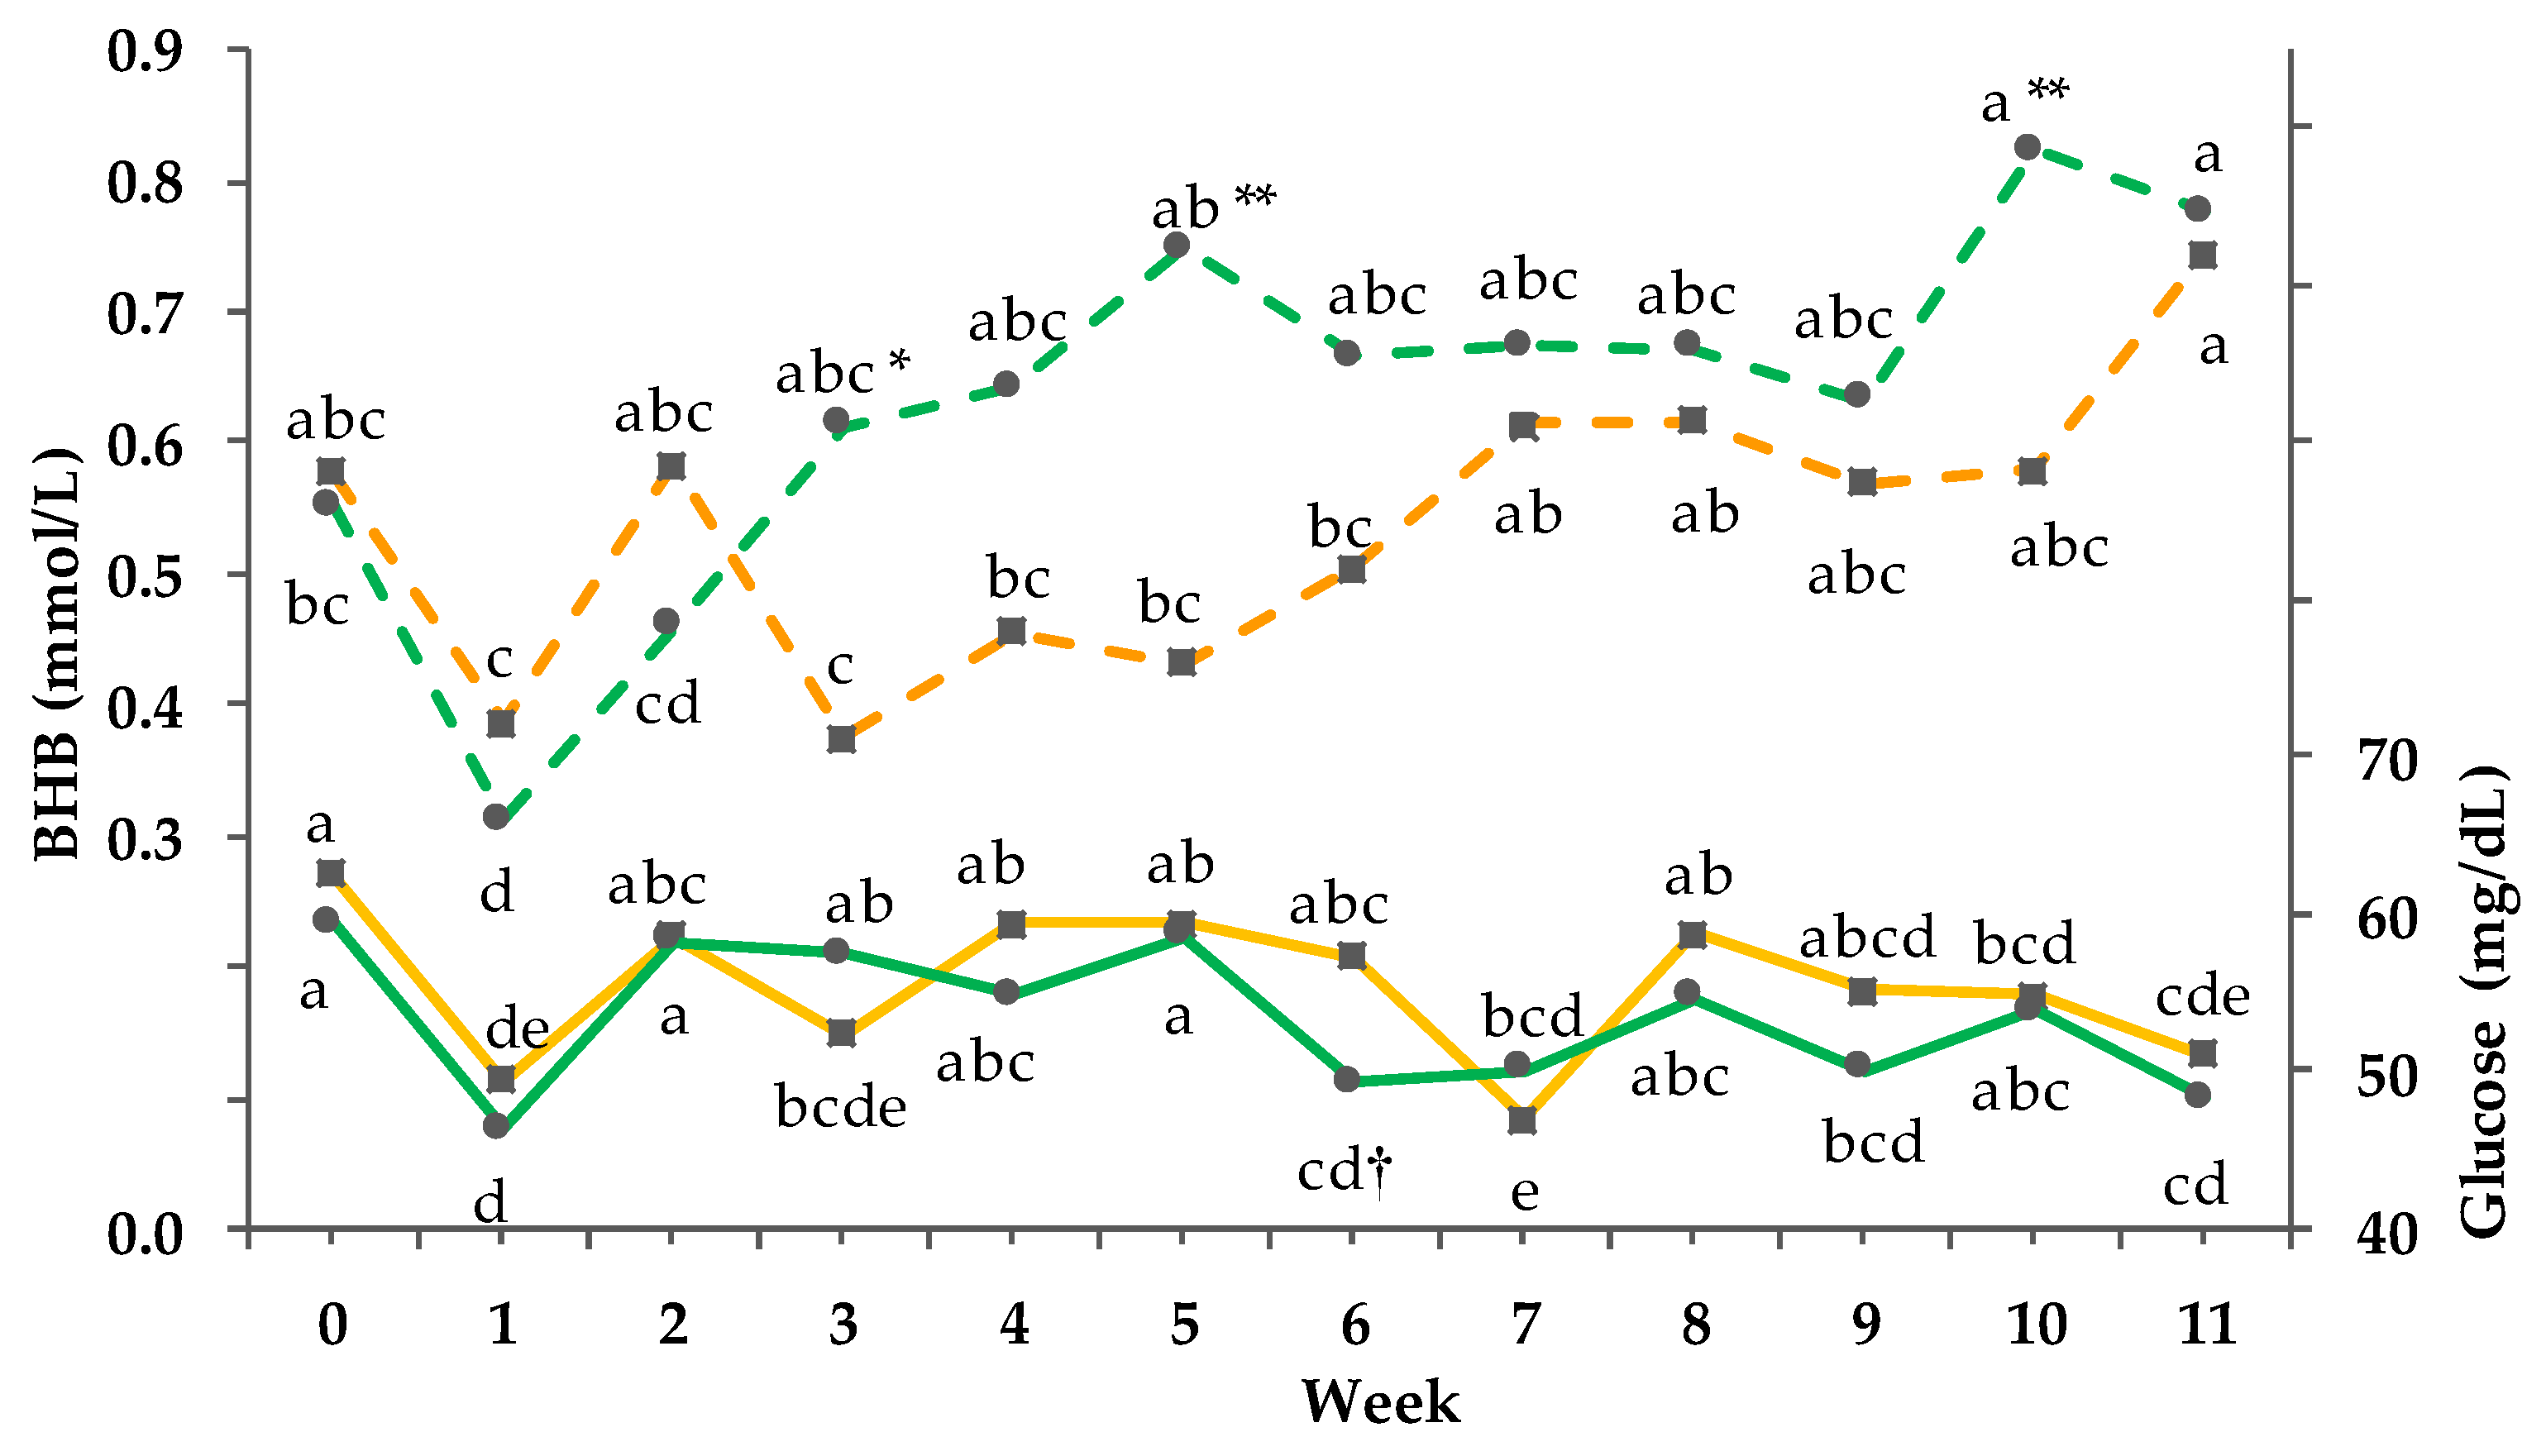
Figure 4.
Effect of a ration change from an indoor-based total mixed ration (TMR) to pasture on serum glucose (solid line, pooled SEM = 1.6) and beta-hydroxy-butyrate (BHB) (dashed line; pooled SEM = 0.04); ■ = confinement group (CG, n = 21; orange); ● = pasture group (PG, n = 22; green). Significance levels: glucose = group (G): p < 0.05, time (T): p < 0.001, GxT: p < 0.01; BHB = G: p < 0.001, T: p < 0.001, GxT: p < 0.001. Different symbols indicate significant differences between groups in particular week (** p ≤0.01; * p ≤ 0.05); different letters (a–e) indicate significant differences between weeks within particular groups (p ≤ 0.05). The CG stayed on a TMR-based diet during the entire trial, while the PG was slowly introduced to a pasture-based ration: week 0 and 1 = TMR, week 2 = TMR and 3 h pasture/day, week 3 and 4 = TMR and 12 h pasture/day, and week 5 to 11 = pasture and 4.5 kg DM concentrate cow/day.
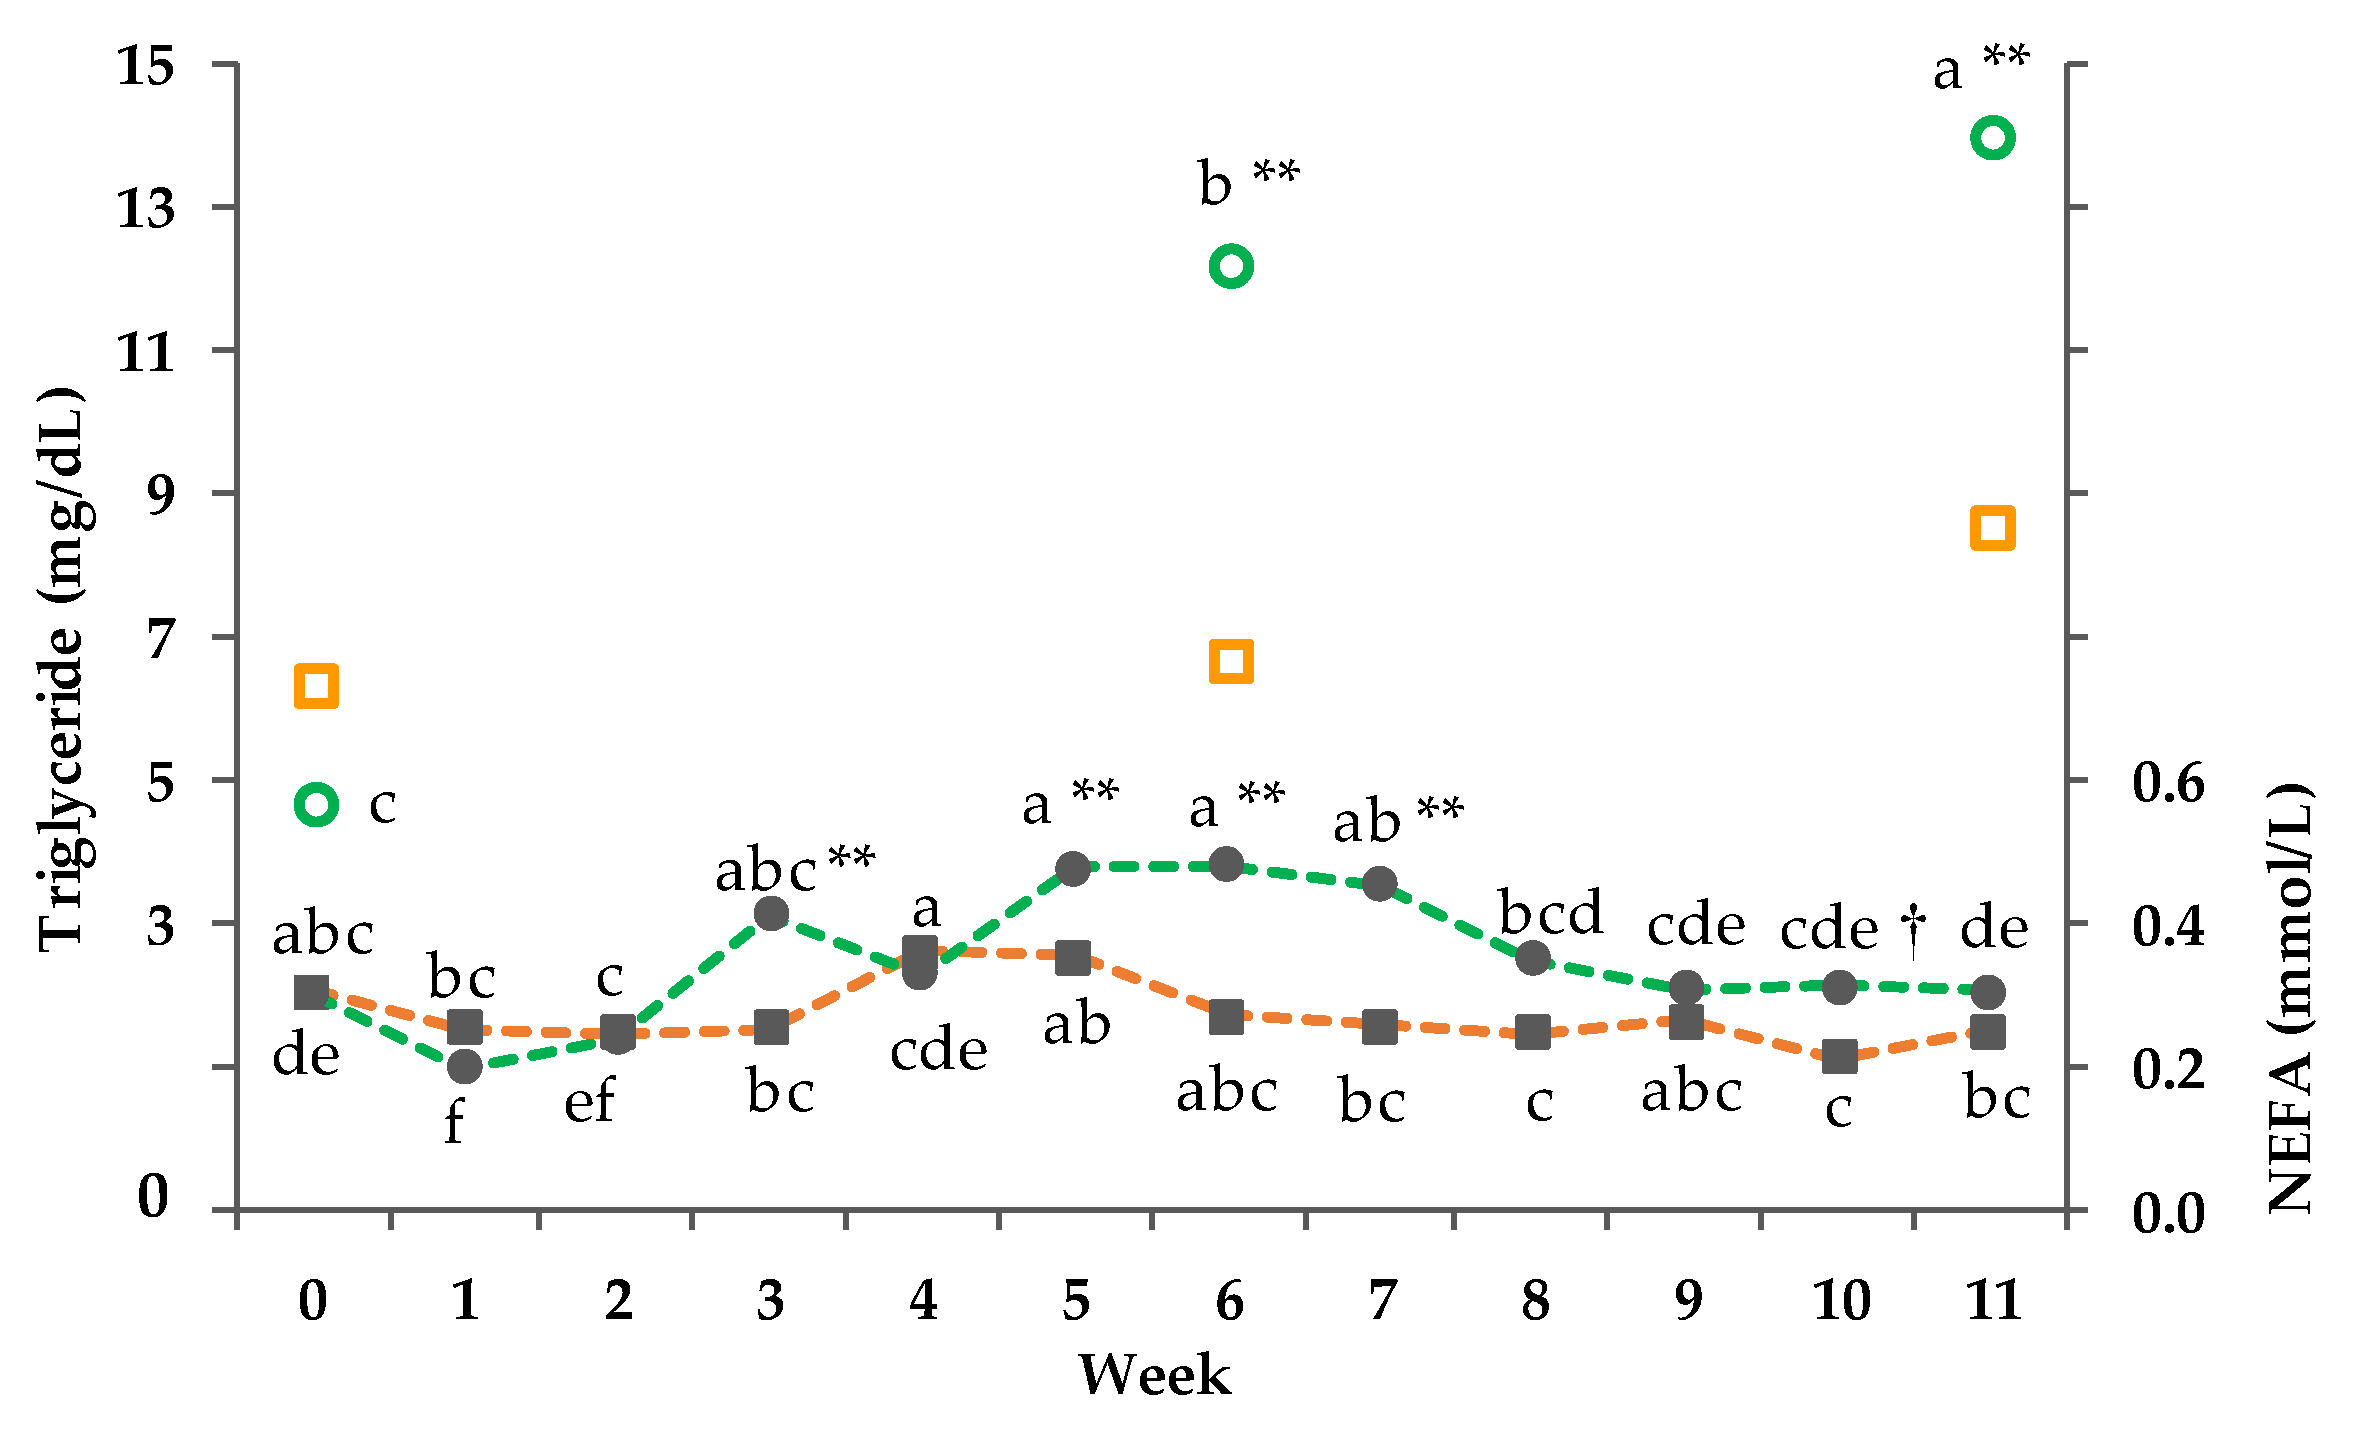
Figure 5.
Effect of a ration change from an indoor-based total mixed ration (TMR) to pasture on serum triglyceride (no line, pooled SEM = 11) and non-esterified fatty acids (NEFA) (dashed line; pooled SEM = 0.02); ■□ = confinement group (CG, n = 21; orange); ●○ = pasture group (PG, n = 22, green). Significance levels: triglyceride = group (G): p < 0.01, time (T): p < 0.001, GxT: p < 0.001, Week 0 was set as covariate; NEFA = G: p < 0.001, T: p < 0.001, GxT: p < 0.001. Different symbols indicate significant differences between groups in particular week (** p ≤0.01; † p ≤ 0.1); different letters (a–f) indicate significant differences between weeks within particular groups (p ≤ 0.05). The CG stayed on a TMR-based diet during the entire trial, while the PG was slowly introduced to a pasture-based ration: week 0 and 1 = TMR, week 2 = TMR and 3 h pasture/day, week 3 and 4 = TMR and 12 h pasture/day, and week 5 to 11 = pasture and 4.5 kg of DM concentrate/cow/day
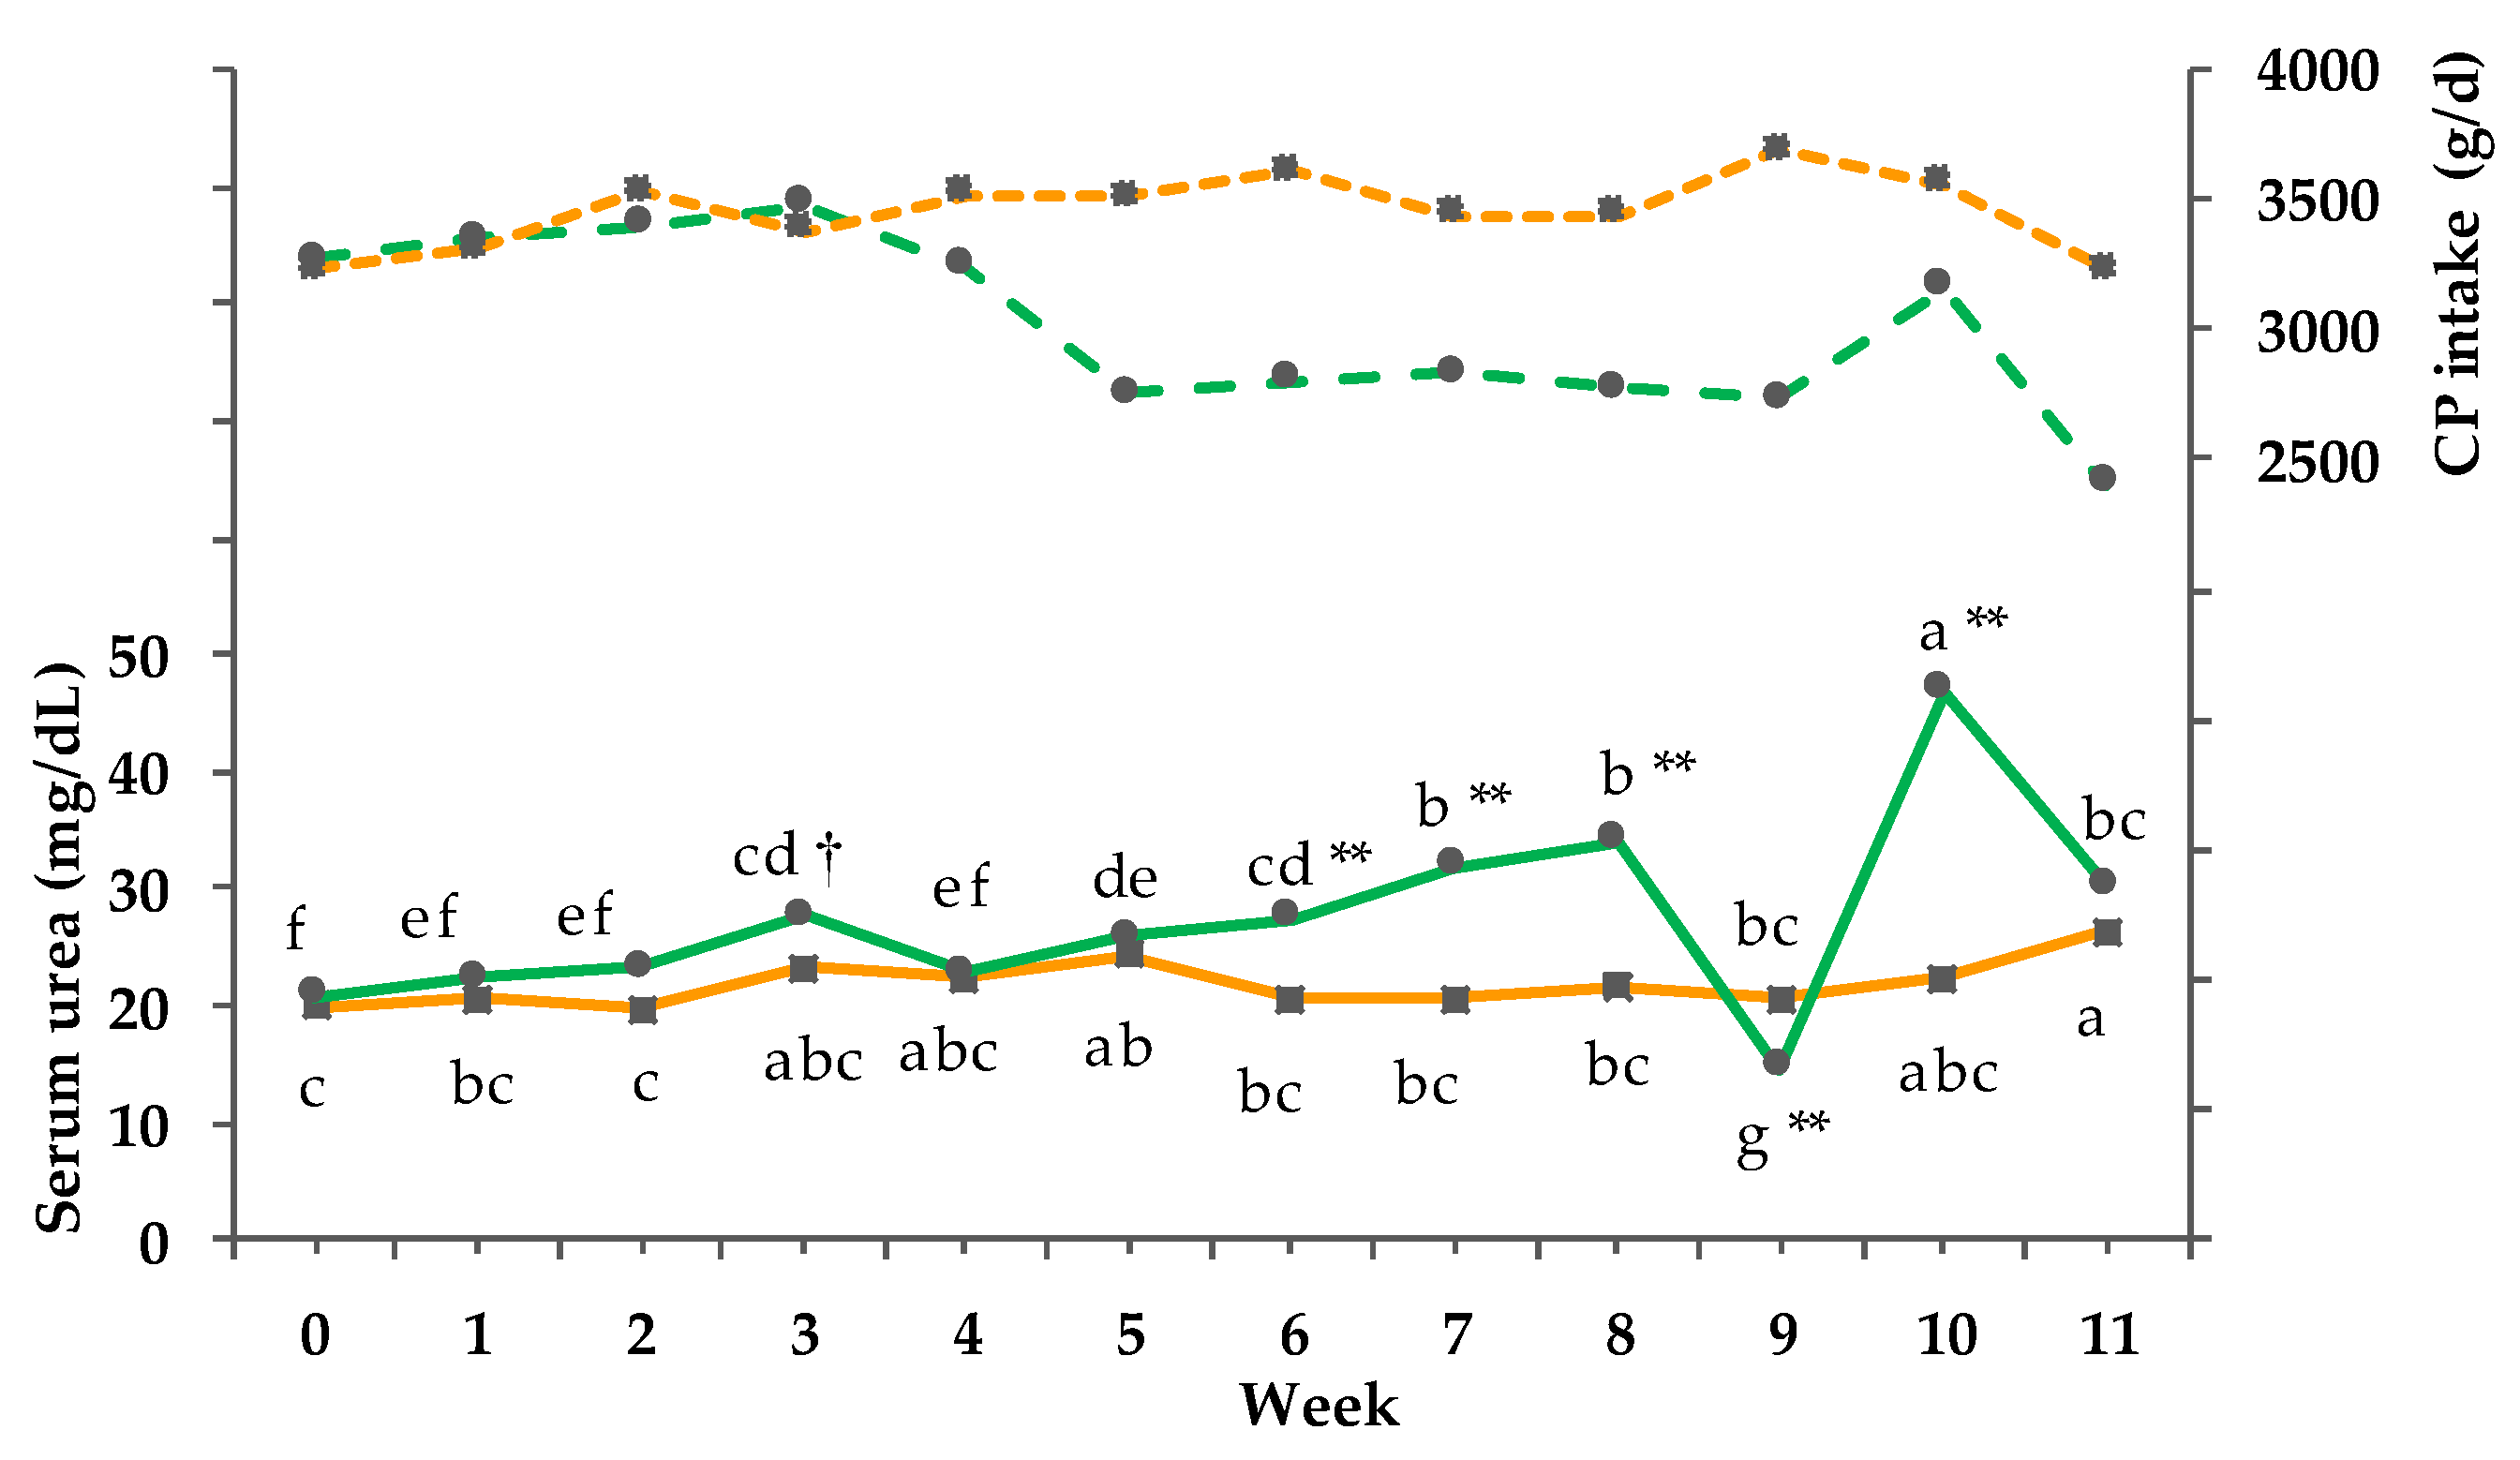
Figure 6.
Effect of a ration change from an indoor-based total mixed ration (TMR) to pasture on serum urea concentrations (solid line, pooled SEM = 0.90) and protein (CP) intake (dashed line); ■ = confinement group (CG, n = 21; orange); ● = pasture group (PG, n = 22; green). Significance levels: serum urea = group (G): p < 0.001, time (T): p < 0.001, GxT: p < 0.001. Different symbols indicate significant differences between groups in particular weeks (** p ≤ 0.01); different letters (a–g) indicate significant differences between weeks within particular groups (p ≤ 0.05). The CG stayed on a TMR-based diet during the entire trial, while the PG was slowly introduced to a pasture-based ration: week 0 and 1 = TMR, week 2 = TMR and 3 h pasture/day, week 3 and 4 = TMR and 12 h pasture/day, and week 5 to 11 = pasture and 4.5 kg DM concentrate cow/day.
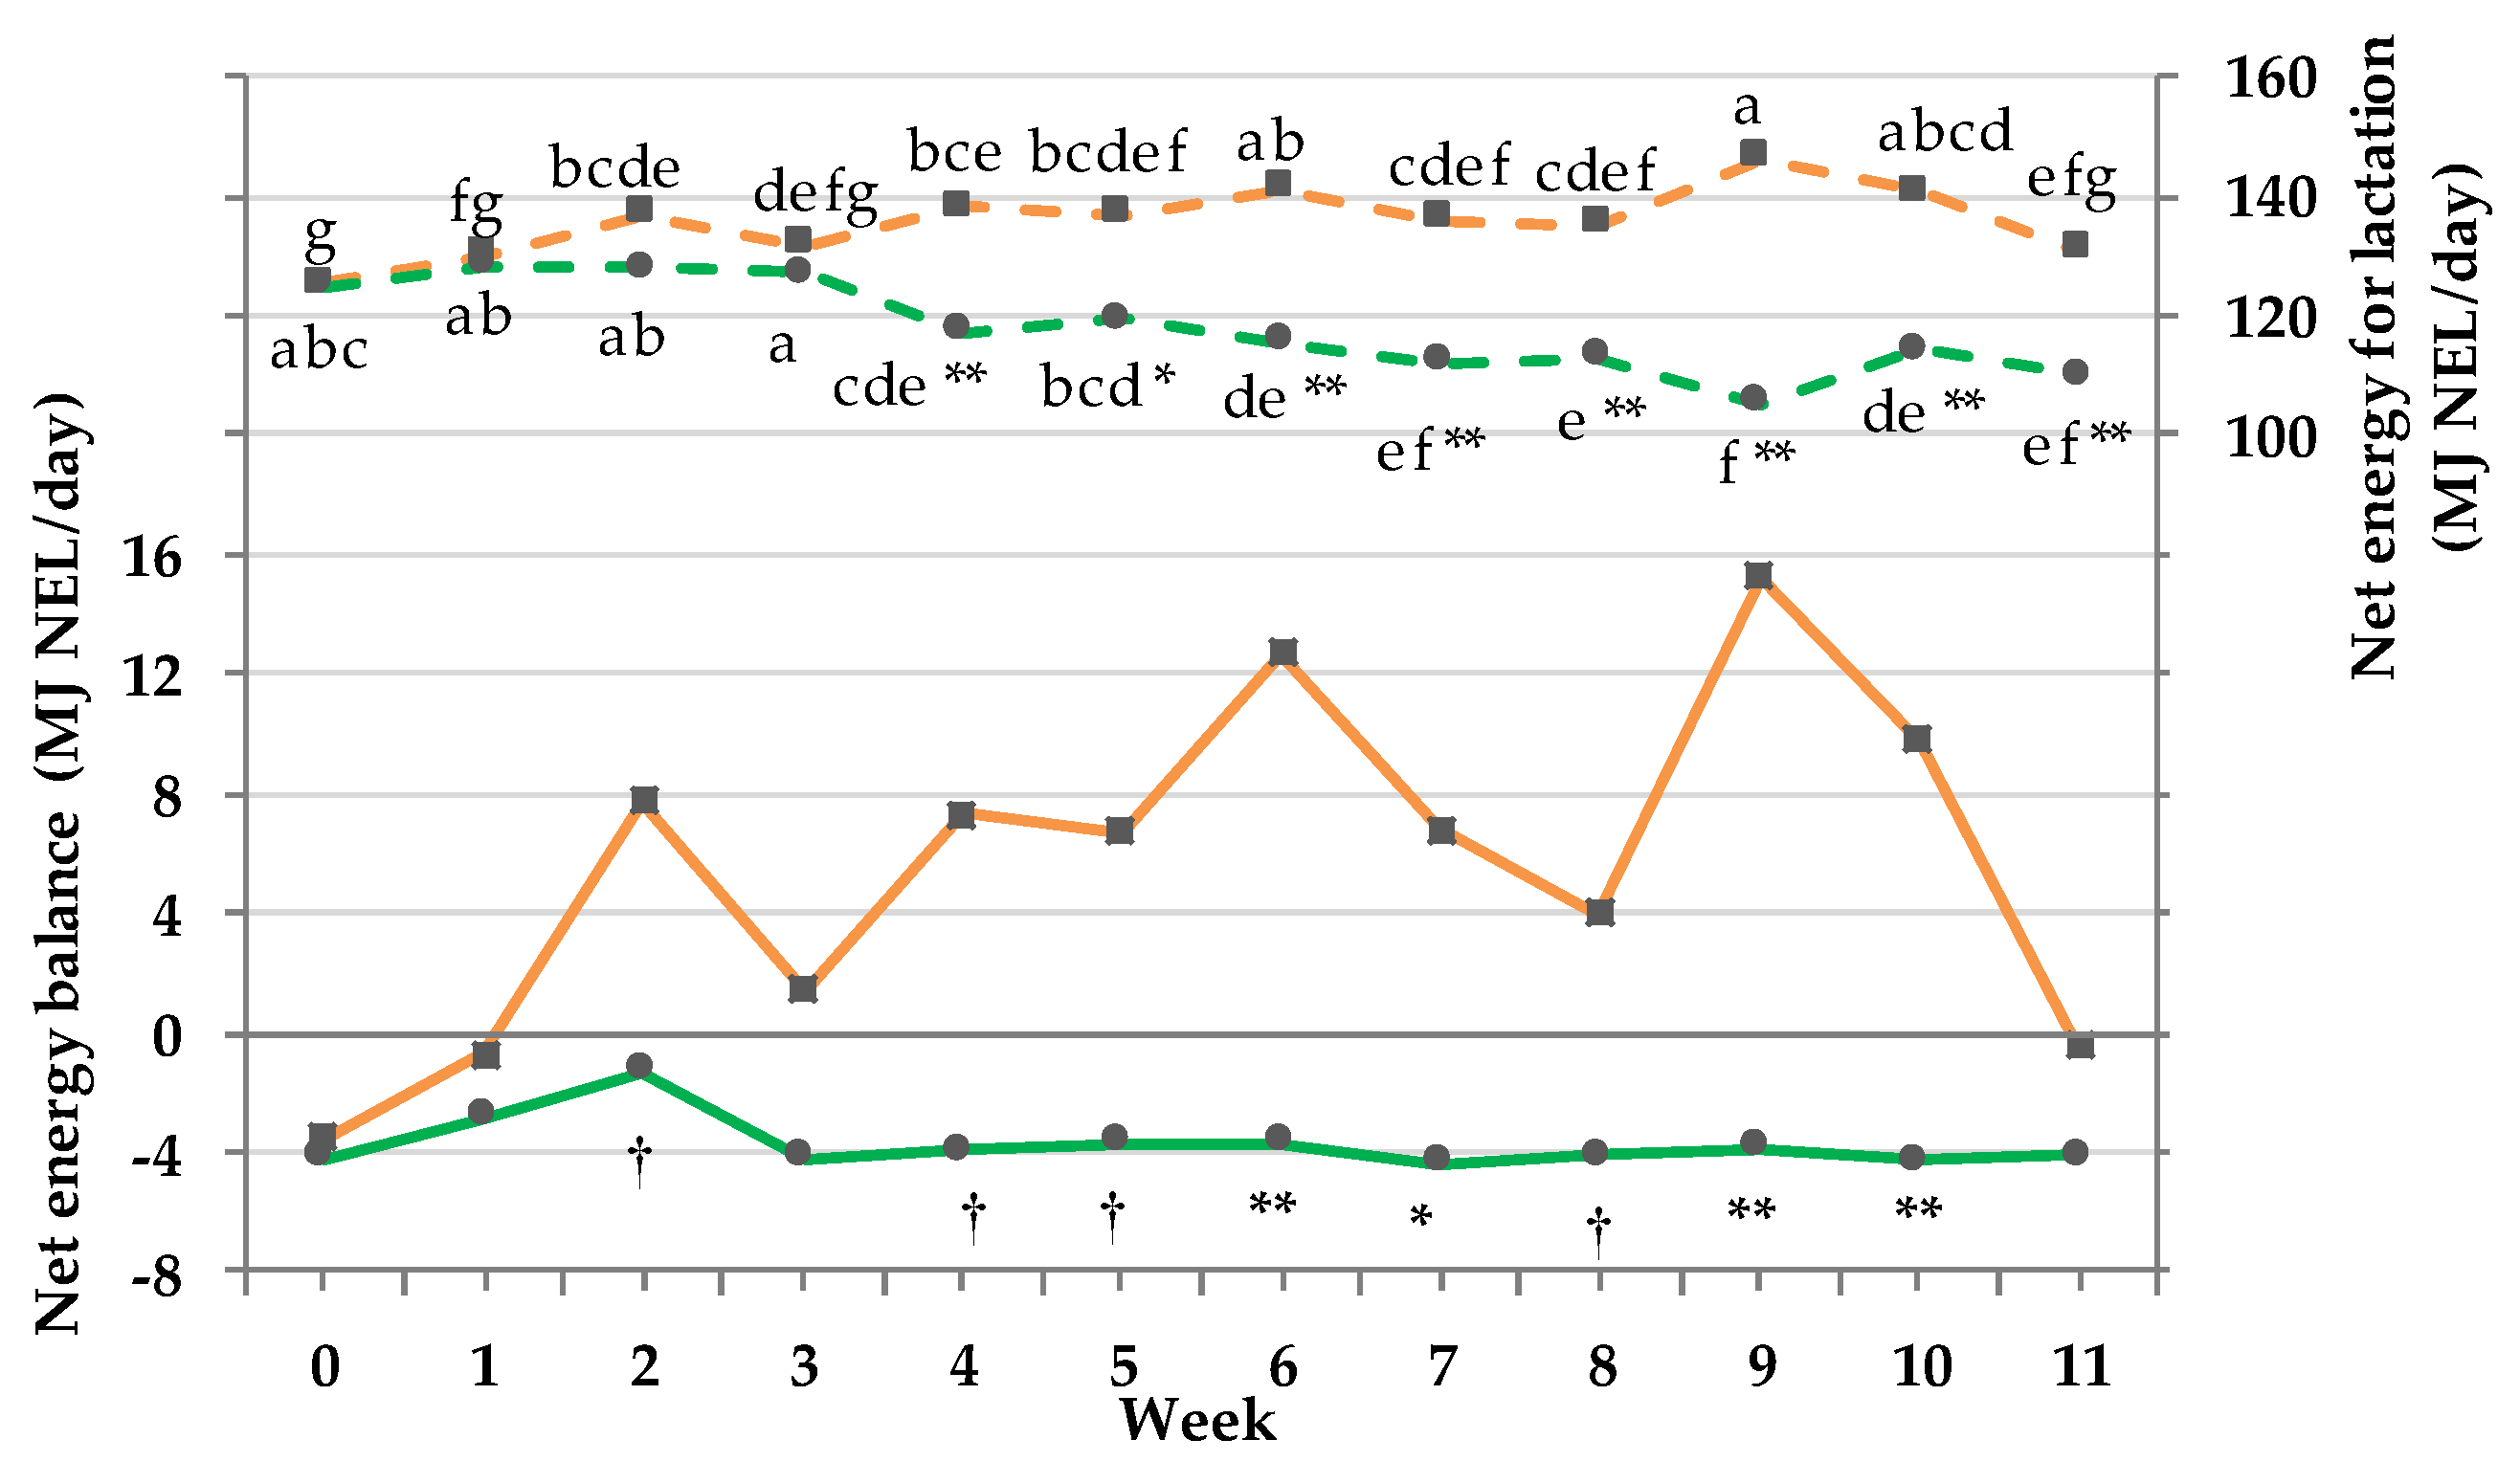
Figure 7.
Effect of a ration change from an indoor-based total mixed ration (TMR) to pasture on net energy balance (NEB: MJ NEL/day) and net energy of lactation intake (NEL: MJ/day). Dry matter intake (DMI) on pasture based on the calculation according to equations (1) and (2). Solid line = NEB, pooled SEM = 2.1 and short dashed line = NEL, pooled SEM = 2.6; ■ = confinement group (CG, n = 31; orange); ● = pasture group (PG, n = 26; green). Significance levels: NEB = group (G): p < 0.001, time (T): p <0.001, GxT: p <0.001; NEL = G: p <0.001, T: p <0.001, GxT: p <0.001. Different symbols indicate significant differences between groups in a particular week (** p ≤ 0.01; * p ≤ 0.05; † p ≤ 0.1); different letters (a–f) indicate significant differences between weeks within particular groups (p ≤ 0.05). The CG stayed on a TMR-based diet during the entire trial, while the PG was slowly introduced to a pasture-based ration: week 0 and 1 = TMR, week 2 = TMR and 3 h pasture/day, week 3 and 4 = TMR and 12 h pasture/day, and week 5 to 11 = pasture and 4.5 kg DM concentrate cow/day.
![Animals 08 00169 g007]()
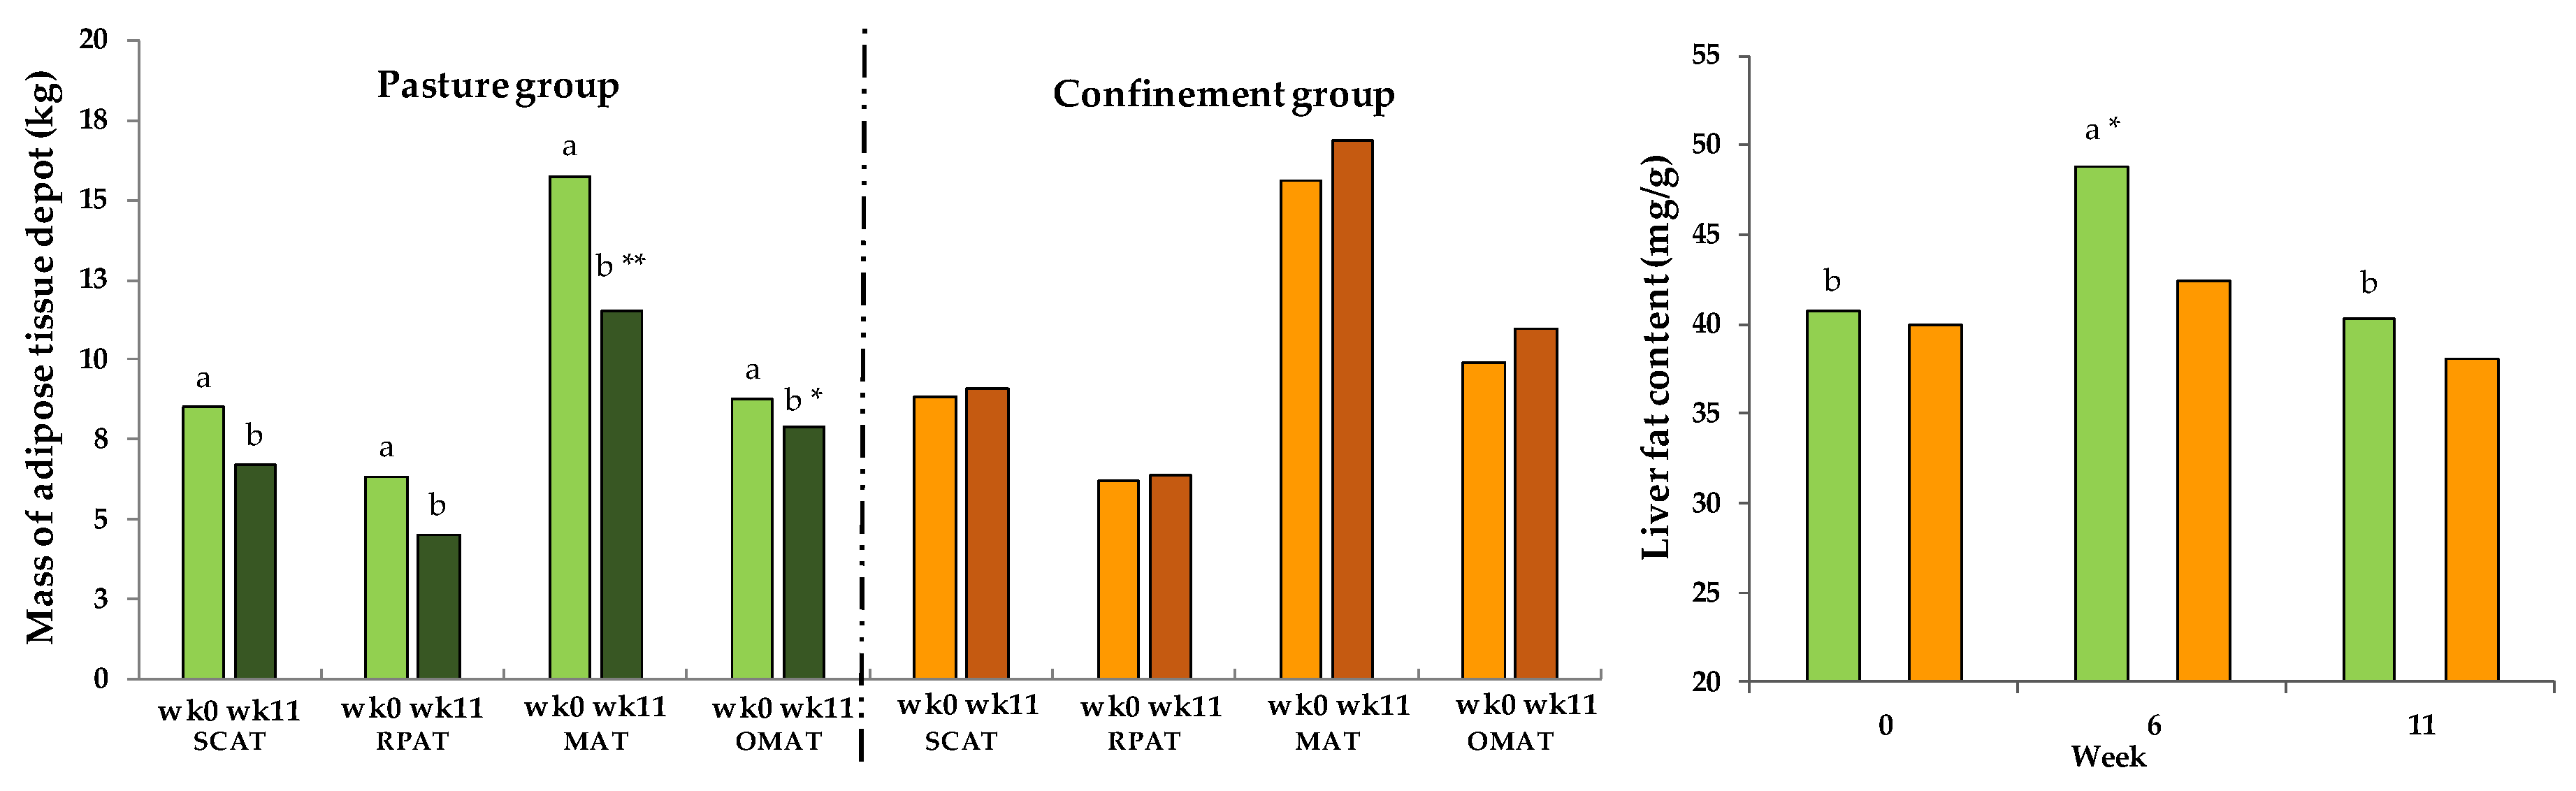
Figure 8.
Effect of a ration change from an indoor-based total mixed ration (TMR) to pasture on body fat depots, in week 0 and 11 (left diagram; pooled SEM subcutaneous adipose tissue (SCAT) = 0.73; SEM omental adipose tissue (OMAT) = 0.63; SEM retroperitoneal adipose tissue (RPAT) = 0.56; SEM mesenteric adipose tissue (MAT) = 0.88) and liver fat content (right diagram; pooled SEM = 1.7); confinement group (CG, n = 16; orange); pasture group (PG, n = 16; green). SCAT = subcutaneous adipose tissue, RPAT = retroperitoneal adipose tissue, MAT= mesenteric adipose tissue, OMAT = omental adipose tissue. Significance: SCAT = group (G): p < 0.186, time (T): p < 0.05, GxT: p < 0.01; RPAT = G: p < 0.209, T: p < 0.05, GxT: p < 0.01; MAT = G: p < 0.05, T: p < 0.1, GxT: p < 0.01; OMAT = G: p < 0.05, T: p < 0.05, GxT: p < 0.01; liver fat content = G: p < 0.1, T: p < 0.001, GxT: p < 0.05. Different symbols indicate significant differences between groups in a particular week (** p ≤ 0.01; * p ≤ 0.05); different letters (a,b) indicate significant differences between weeks within particular groups (p ≤ 0.05). The CG stayed on a TMR-based diet during the entire trial, while the PG was slowly introduced to a pasture-based ration: week 0 and 1 = TMR, week 2 = TMR and 3 h pasture/day, week 3 and 4 = TMR and 12 h pasture/day, and week 5 to 11 = pasture and 4.5 kg DM concentrate cow/day.
![Animals 08 00169 g008]()
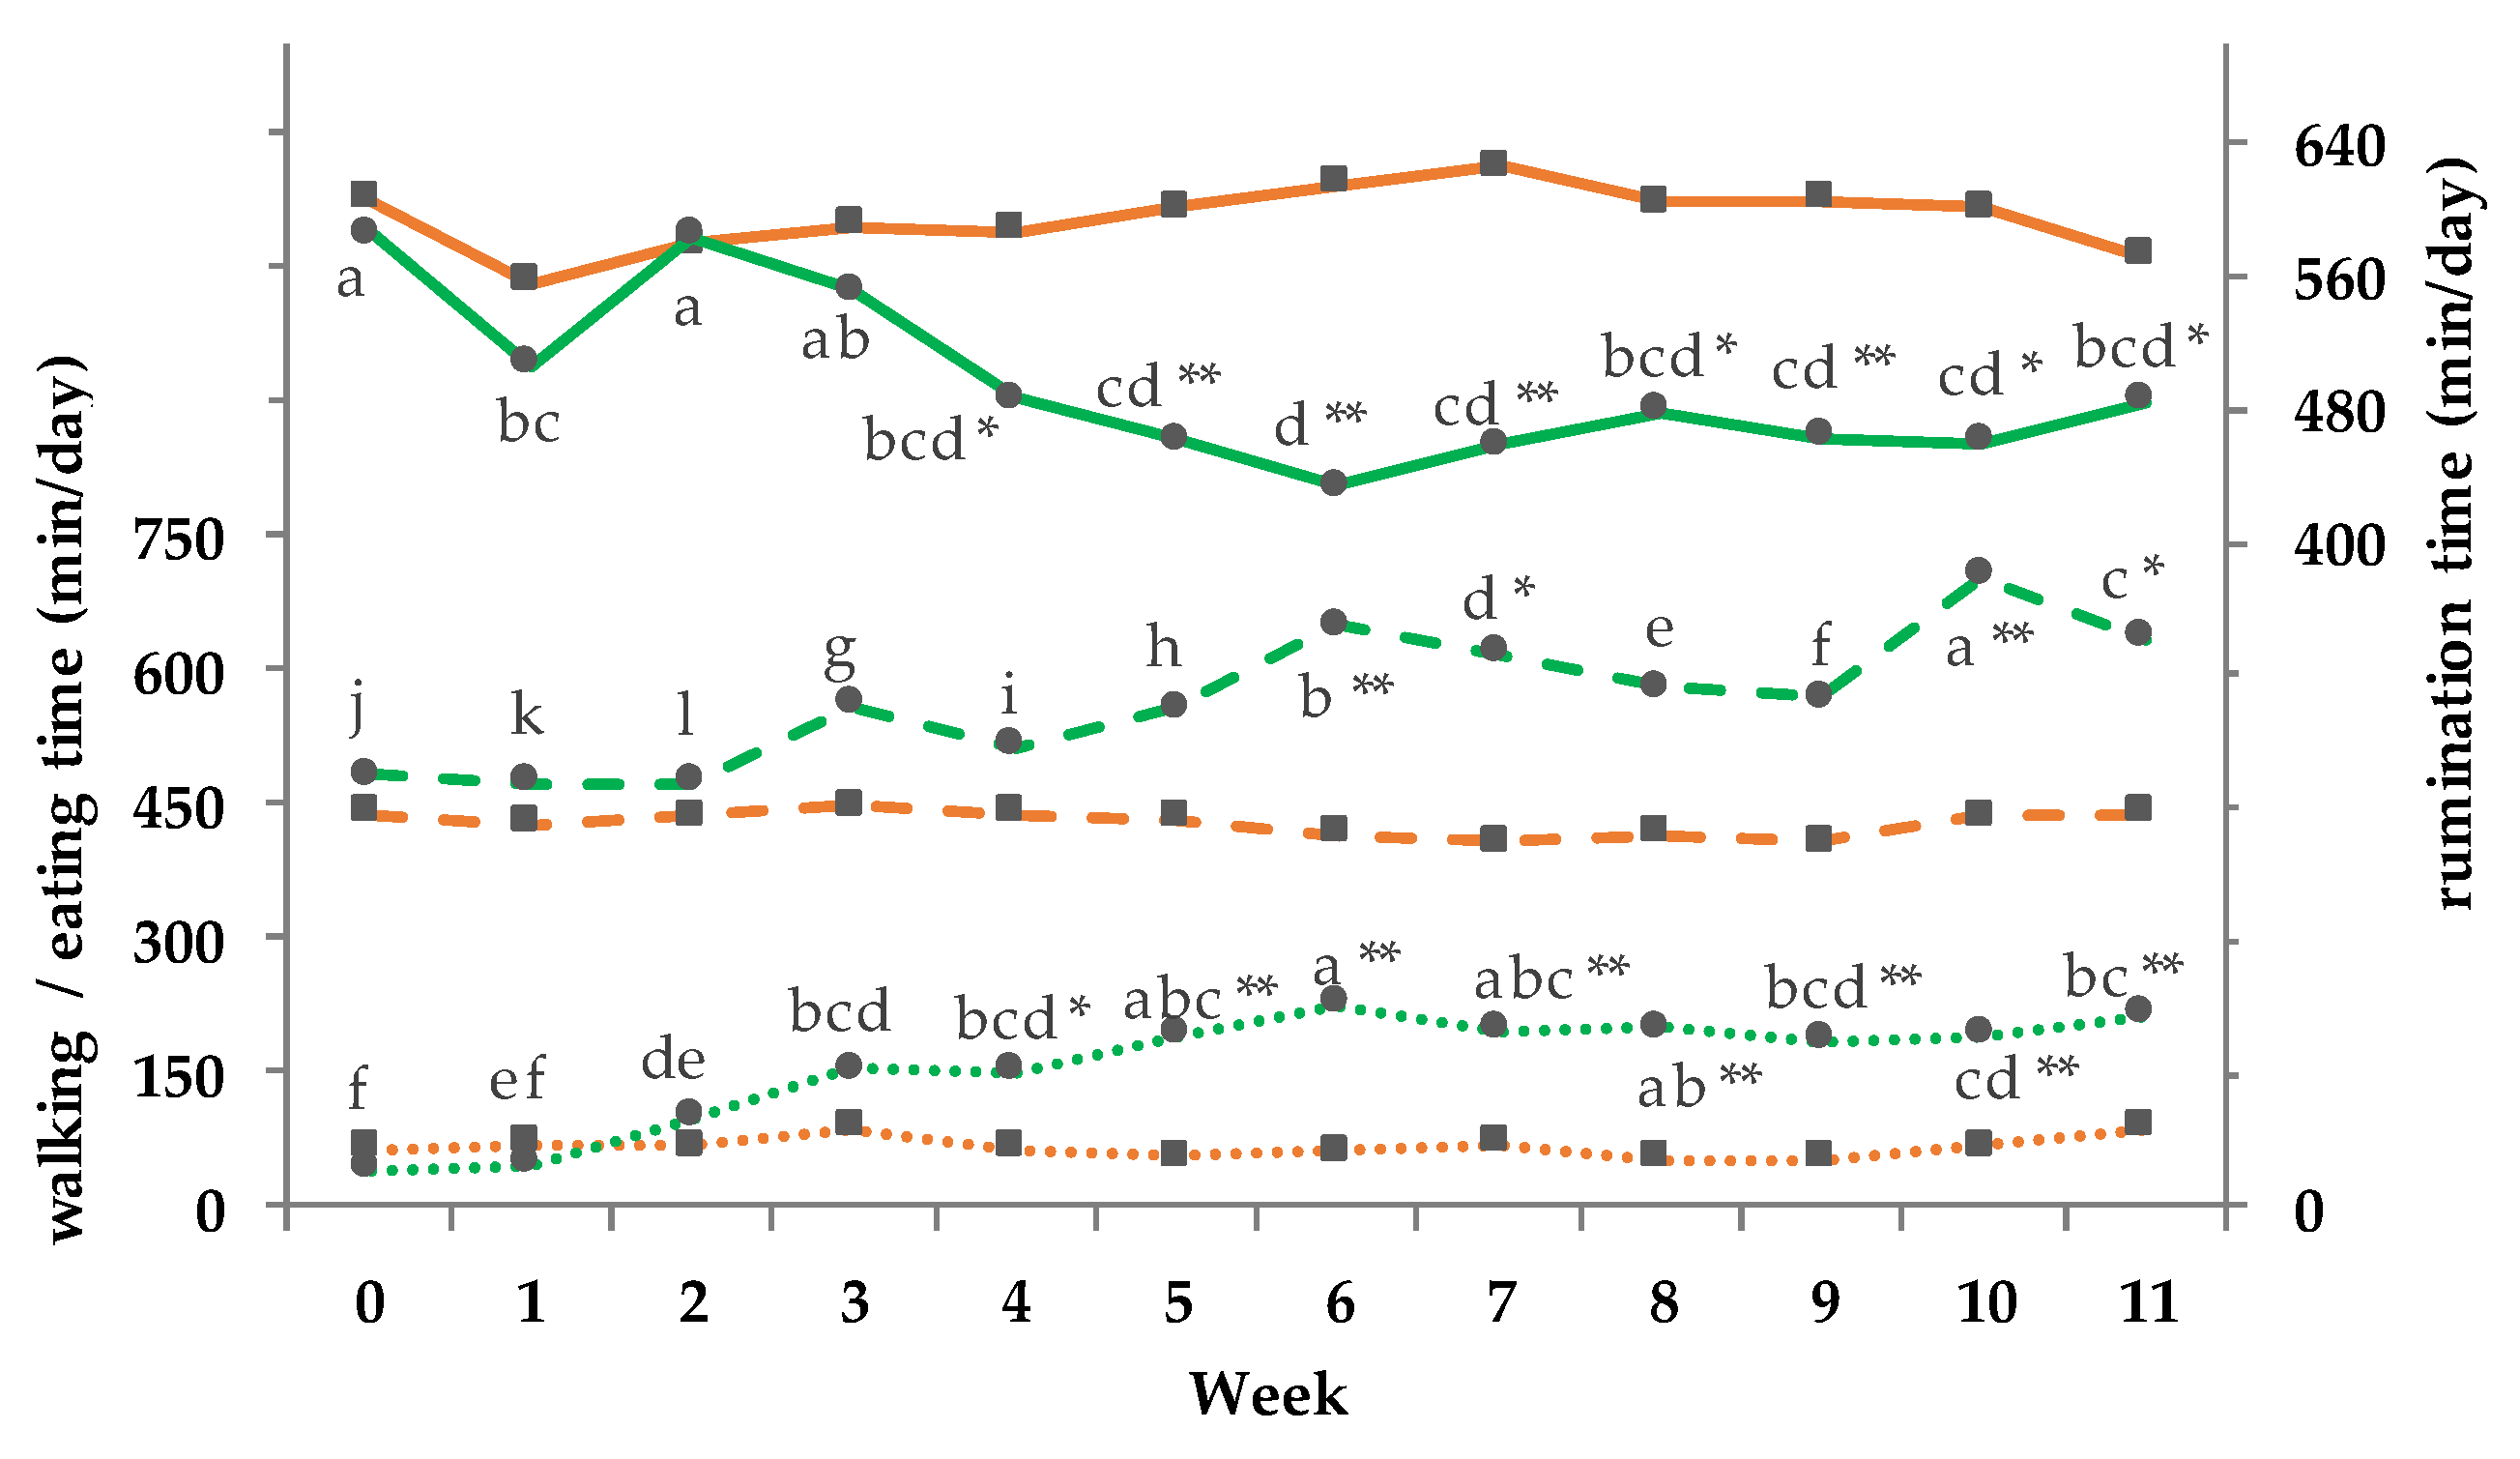
Figure 9.
Effect of ration from an indoor-based total mixed ration (TMR)to pasture on walking (pointed line; pooled SEM = 17), eating (dashed line; pooled SEM = 34), and rumination (solid line; pooled SEM = 30) time min/day; ■ = confinement group (CG, n = 5; orange); ● = pasture group (PG, n = 6; green). Significance levels: Walking time = group (G): p < 0.01, time (T): p < 0.05, GxT: p < 0.05; eating time = group (G): p < 0.001, time (T): p < 0.01, GxT: p < 0.01; rumination time = group (G): p < 0.001, time (T): p < 0.210, GxT: p < 0.05. Different symbols indicate significant differences between groups in a particular week (** p ≤ 0.01; * p ≤ 0.05); different letters (a–l) indicate significant differences between weeks within particular groups (p ≤ 0.05). The CG stayed on a TMR-based diet during the entire trial, while the PG was slowly introduced to a pasture-based ration: week 0 and 1 = TMR, week 2 = TMR and 3 h pasture/day, week 3 and 4 = TMR and 12 h pasture/day, and week 5 to 11 = pasture and 4.5 kg DM concentrate cow/day.
![Animals 08 00169 g009]()
Table 1.
Ingredients of concentrate.
Table 1.
Ingredients of concentrate.
| Ingredient (% DM) | Concentrate TMR CG | Concentrate TMR PG | Concentrate PG |
|---|
| Soyabean meal | 20.7 | 20.7 | - |
| Rapeseed meal | 14.0 | 14.0 | - |
| Wheat | 18.2 | 18.1 | 29.6 |
| Corn | 18.2 | 18.1 | 29.6 |
| Barley | 18.2 | 18.1 | 29.6 |
| Dried sugar beet pulp | 5.0 | 5.0 | - |
| Feed lime | 1.9 | 1.9 | - |
| Soyabean oil | 1.0 | 1.0 | 1.0 |
| MgO | - | 0.3 | 1.2 |
| Urea | 1.0 | 1.0 | - |
| NaCl | 0.3 | 0.3 | - |
| Mineral feed 1 | 1.5 | 1.5 | 9.0 |
Table 2.
Chemical composition of experimental diets.
Table 2.
Chemical composition of experimental diets.
| Item (g/kg of DM) | TMR | TMR | Concentrate | Pasture (per week) |
|---|
| CG | PG | PG |
|---|
| (Week 0 to 11) | (Week 0 to 4) | (Week 5 to 11) | 2 | 3 | 4 | 5 | 6 | 7 | 8 | 9 | 10 | 11 |
|---|
| DM (g/kg) | 465 | 477 | 899 | 196 | 217 | 198 | 164 | 147 | 183 | 145 | 147 | 167 | 172 |
| Ash | 66 | 6s6 | 108 | 80 | 82 | 85 | 90 | 105 | 90 | 105 | 102 | 93 | 105 |
| Cp | 157 | 159 | 93 | 213 | 199 | 188 | 178 | 168 | 201 | 168 | 198 | 209 | 155 |
| UCp | 152 | 151 | 148 | 154 | 153 | 142 | 143 | 131 | 150 | 126 | 142 | 143 | 133 |
| NEL (MJ/kg of DM) * | 6.8 | 6.8 | 7.6 | 6.9 | 6.8 | 6.4 | 6.3 | 5.7 | 6.5 | 5.6 | 6.1 | 6.1 | 5.9 |
| Sugar | 18 | 18 | 27 | 222 | 170 | 128 | 92 | 79 | 97 | 102 | 87 | 83 | 83 |
| Starch | 250 | 255 | 579 | - | - | - | - | - | - | - | - | - | - |
| RNB | 0.03 | −0.1 | −8.9 | 6.0 | 6.9 | 4.1 | 6.0 | 6.0 | 9.1 | 2.3 | 9.0 | 8.8 | 4.2 |
| CF | 184 | 184 | 31.5 | 157 | 189 | 211 | 254 | 262 | 238 | 249 | 242 | 236 | 271 |
| NDFOM | 363 | 363 | 124 | 377 | 433 | 472 | 509 | 514 | 462 | 479 | 472 | 468 | 521 |
| ADFOM | 206 | 203 | 42 | 174 | 208 | 233 | 278 | 288 | 255 | 277 | 270 | 261 | 300 |
| EE | 37 | 36 | 30 | 49 | 46 | 38 | 34 | 36 | 42 | 43 | 45 | 48 | 31 |
Table 3.
Grazing management conditions and sward intake per cow calculated by means of the n-alkane method and the exclosure cages, as well as according to Equations (1) and (2).
Table 3.
Grazing management conditions and sward intake per cow calculated by means of the n-alkane method and the exclosure cages, as well as according to Equations (1) and (2).
| Week | 0 | 1 | 2 | 3 | 4 | 5 | 6 | 7 | 8 | 9 | 10 | 11 | PSEM 3 | p-Value |
|---|
| Week of Paddock Rotation * | | | | 3–4 | 5–6.5 | 6.5–7.5 | 7.5–8.5 | 8.5–9.5 | 9.5–10.5 | 10.5–11 | Group (G) | Time (T) | GxT |
|---|
| CG/kg/day) | Water intake | 83 | 91 | 85 | 86 | 82 | 86 | 88 | 82 | 89 | 87 | 86 | 81 | 2.4 | <0.001 | <0.001 | <0.001 |
| PG (kg/day) | 80 | 76 | 67 | 46 | 31 | - | - | - | - | - | - | |
| CG (kg/day DMI) | TMR | 20.5 | 21.0 | 22.5 | 21.5 | 22.4 | 22.4 | 23.0 | 21.9 | 21.9 | 23.5 | 22.7 | 20.6 | 0.5 | <0.001 | <0.001 | <0.001 |
| PG (kg/day DMI) | TMR | 20.6 | 21.1 | 17.6 | 13.0 | 11.0 | | | | | | | | | | | |
| | PI 1 Alkane | | | | | | | 14.6 | 12.8 | | | | | | | | |
| PI 1 Alkane + concentrate | | | | | | | 19.1 | 17.3 | | | | | | | | |
| PI 1 according to equation (1) + (2) | | | 2.8 | 7.1 | 7.9 | 13.1 | 14.2 | 12.0 | 14.0 | 11.7 | 13.1 | 12.8 | 0.4 | <0.001 | <0.001 | <0.001 |
| PI 1 Heublein + TMR + concentrate 2 | | | 20.4 | 20.1 | 18.9 | 17.6 | 18.7 | 16.5 | 18.5 | 16.2 | 17.6 | 17.3 | 0.4 | <0.001 | <0.001 | <0.001 |
| PI1 exclosure cage * | | | | 15.8 ± 3.4 | 21.9 ± 2.4 | 15.3 ± 1.8 | 19.4 ± 7.4 | 18.5 ± 1.7 | 25.6 ± 7.5 | 20.0 ± 4.9 | | | | |
| PI 1 exclosure cage + concentrate 2,* | | | | | | 26.4 ± 2.4 | 19.8 ± 1.8 | 20.9 ± 7.4 | 22.9 ± 1.7 | 30.1 ± 7.5 | 24.5 ± 4.9 | | | | |
Table 4.
Effect of a ration change from an indoor-based total mixed ration (TMR) to pasture on blood cell count 1.
Table 4.
Effect of a ration change from an indoor-based total mixed ration (TMR) to pasture on blood cell count 1.
| Variale 1 | Group 2 | Week | PSEM 3 | p-Value |
|---|
| 0 | 1 | 2 | 3 | 4 | 5 | 6 | 7 | 8 | 9 | 10 | 11 | Group (G) | Time (T) | GxT |
|---|
| RBC | CG | 5.59 a | 5.41 ab | 5.41 ab | 5.45 ab | 5.50 ab | 5.44 ab | 5.45 ab | 5.42 ab | 5.42 ab | 5.38 ab | 5.26 b | 5.24 b | 0.1 | 0.114 | <0.001 | <0.001 |
| PG | 5.36 c | 5.36 c | 5.33 c | 5.54 bc | 5.73 ab | 5.71 ab | 5.87 a | 5.77 ab | 5.68 ab | 5.59 abc | 5.75 ab† | 5.54 bc |
| HGB | CG | 8.59 | 8.36 | 8.33 | 8.23 | 8.62 | 8.66 | 8.62 | 8.43 | 8.41 | 8.29 | 8.22 | 8.28 | 0.16 | <0.1 | <0.001 | <0.001 |
| PG | 8.21 f | 8.28 ef | 8.45 def | 8.54 def | 9.20 abc | 9.30 ab | 9.23 abc | 9.15 abc | 8.83 bcd | 8.77 cde | 9.05 abc† | 9.37 a** |
| HCT | CG | 25.0 | 24.2 | 24.2 | 24.3 | 24.6 | 24.4 | 24.4 | 24.3 | 24.5 | 24.3 | 23.7 | 23.8 | 0.5 | <0.05 | <0.001 | <0.001 |
| PG | 24.2 d | 24.3 cd | 24.2 d | 25.2 bcd | 26.2 ab | 26.3 ab | 26.7 a | 26.1 ab | 25.8 abc | 25.5 abcd | 26.0 ab† | 25.3 abcd |
| MCV | CG | 44.7 | 44.8 | 44.8 | 44.8 | 44.9 | 44.8 | 44.9 | 44.8 | 45.2 | 45.2 | 45.1 | 45.4 | 0.7 | 0.534 | <0.05 | <0.1 |
| PG | 45.4 b | 45.5 ab | 45.6 ab | 45.7 ab | 45.9 ab | 46.2 a | 45.6 ab | 45.5 ab | 45.6 ab | 45.8 ab | 45.4 ab | 45.8 ab |
| MCH | CG | 15.4 cd | 15.5 bcd | 15.4 cd | 15.2 def | 15.7 abc | 15.9 a | 15.8 ab | 15.6 abc | 15.5 bcd | 15.4 cde | 15.6 abc | 15.8 ab | 0.3 | 0.432 | <0.001 | <0.001 |
| PG | 15.4 e | 15.5 ef | 15.9 cd | 15.5 e | 16.1 bc | 16.3 b | 15.8 cde | 15.9 cd | 15.6 de | 15.7 de | 15.8 cde | 17.0 a | |
| MCHC | CG | 34.4 def | 34.6 cde | 34.5 cde | 33.8 f | 35.0 abc | 35.6 a | 35.3 ab | 34.7 bcd | 34.4 def | 34.1 ef | 34.7 cde | 34.3 def | 0.1 | <0.05 | <0.001 | <0.001 |
| PG | 33.9 f | 34.1 ef | 34.9 bc | 33.9 f | 35.2 bc | 35.4 b | 34.6 cde† | 35.0 bc | 34.3 def | 34.3 def | 34.8 cde | 36.9 a** |
| RDW | CG | 16.0 e | 16.1 ef | 16.1 def | 16.3 cdef | 16.3 bcdef | 16.5 abcdef | 16.7 abcdef | 16.8 abcde | 16.8 abc | 16.8 abcd | 17.0 ab | 17.1 a | 0.2 | 0.986 | <0.001 | 0.188 |
| PG | 16.2 b | 16.2 ab | 16.5 ab | 16.6 ab | 16.6 ab | 16.8 a | 16.7 ab | 16.7 ab | 16.8 ab | 16.6 ab | 16.7 ab | 16.7 ab |
| PDW | CG | 15.6 d | 15.6 d | 15.7 d | 15.6 def | 15.9 d | 15.9 d | 16.0 cde | 16.6 bcd | 18.5 a | 18.1 ab | 17.9 abc | 19.3 a | 0.4 | <0.05 | <0.001 | <0.01 |
| PG | 15.6 c | 15.9 c | 15.6 c | 15.6 cdef | 15.9 c | 16.2 c | 16.0 cde | 18.4 b | 19.6 ab | 20.4 a* | 18.4 b | 19.4 ab |
Table 5.
Effect of a ration change from an indoor-based total mixed ration (TMR) to pasture on blood clinical chemistry variables 1.
Table 5.
Effect of a ration change from an indoor-based total mixed ration (TMR) to pasture on blood clinical chemistry variables 1.
| Variable 1 | Group 2 | Week | PSEM 3 | p-Value |
|---|
| 0 | 6 | 11 | Group (G) | Time (T) | GxT |
|---|
| Albumin (g/L) | CG | 36.6 | 36.6 | 36.6 | 0.6 | 0.172 | 0.785 | 0.697 |
| PG | 35.4 | 35.9 | 35.9 |
| Total protein (g/L) | CG | 68.3 | 70.1 | 70.1 | 1.3 | <0.05 | <0.05 | 0.553 |
| PG | 68.1 | 71.0 | 72.5 |
| Cholesterol (mg/dL) | CG | 222.8 | 211.5 | 201.0 | 7.6 | <0.05 | <0.05 | 0.133 |
| PG | 212.2 | 214.7 | 206.1 |
| AST (IU/L) | CG | 82.8 | 77.3 | 74.8 | 5.3 | 0.381 | 0.355 | 0.257 |
| PG | 84.5 | 81.4 | 86.3 |
| γ-GT (IU/L) | CG | 42.2 | 39.6 | 39.4 | 3.7 | 0.285 | 0.285 | 0.494 |
| PG | 43.9 | 36.4 | 44.0 |
| Bilirubin (mg/dL) | CG | 0.37 | 0.36 | 0.35 | 0.01 | <0.01 | <0.01 | <0.001 |
| PG | 0.37 b | 0.42 a** | 0.36 b |
| GLDH (IU/L) | CG | 35.8 | 31.7 | 30.6 | 3.4 | 0.139 | 0.139 | 0.500 |
| PG | 32.9 | 28.1 | 37.0 |

 ,
, 


