Article

Comprehensive Gene Expression Profiling Analysis of Adipose Tissue in Male Individuals from Fat- and Thin-Tailed Sheep Breeds

1
Department of Animal Science, Faculty of Agriculture, University of Tabriz, Tabriz 51666-16471, Iran
2
Department of Animal Science, Faculty of Agriculture, Ege University, 35100 Izmir, Türkiye
3
Department of Veterinary Medicine, University of Bari Aldo Moro, 70010 Valenzano, Italy
*
Authors to whom correspondence should be addressed.
Animals 2023, 13(22), 3475; https://doi.org/10.3390/ani13223475
Submission received: 6 September 2023 / Revised: 5 November 2023 / Accepted: 6 November 2023 / Published: 10 November 2023
(This article belongs to the Special Issue New Tools for Monitoring Genetic Diversity in Animals)

Abstract

:

Simple Summary

For this paper, we investigated the differences in adipose tissue deposition between sheep breeds with fat and thin tails, relying on advanced techniques like meta-analyses and machine learning to analyze gene expression data. Our findings revealed key genes associated with fat metabolism, shedding light on the genetic factors influencing tail fat in sheep. Notably, three specific genes (POSTN, K35, and SETD4) were identified as significant biosignatures related to fat deposition. This innovative approach (combining data analysis and machine learning) enhances our understanding of how to optimize fat deposition in sheep breeds, which holds potential for more efficient animal breeding strategies and carcass fat reduction.

Abstract

It has been shown that tail fat content varies significantly among sheep breeds and plays a significant role in meat quality. Recently, significant efforts have been made to understand the physiological, biochemical, and genomic regulation of fat deposition in sheep tails in order to unravel the mechanisms underlying energy storage and adipose tissue lipid metabolism. RNA-seq has enabled us to provide a high-resolution snapshot of differential gene expression between fat- and thin-tailed sheep breeds. Therefore, three RNA-seq datasets were meta-analyzed for the current work to elucidate the transcriptome profile differences between them. Specifically, we identified hub genes, performed gene ontology (GO) analysis, carried out enrichment analyses of the Kyoto Encyclopedia of Genes and Genomes (KEGG) pathways, and validated hub genes using machine learning algorithms. This approach revealed a total of 136 meta-genes, 39 of which were not significant in any of the individual studies, indicating the higher statistical power of the meta-analysis. Furthermore, the results derived from the use of machine learning revealed POSTN, K35, SETD4, USP29, ANKRD37, RTN2, PRG4, and LRRC4C as substantial genes that were assigned a higher weight (0.7) than other meta-genes. Among the decision tree models, the Random Forest ones surpassed the others in adipose tissue predictive power fat deposition in fat- and thin-tailed breeds (accuracy > 0.85%). In this regard, combining meta-analyses and machine learning approaches allowed for the identification of three important genes (POSTN, K35, SETD4) related to lipid metabolism, and our findings could help animal breeding strategies optimize fat-tailed breeds’ tail sizes.

1. Introduction

Sheep are the leading meat and wool producers [1,2], with 20–25% of their world population being fat-tailed [3,4]. These sheep were first recorded on an Uruk III stone vessel about 5000 years ago [5]. These breeds are used in the different lamb production systems that are currently adopted around the world, reflecting different breeders’ economic conditions, consumers’ preferences, resources, and production aims. However, traditionally, sheep breeding is chiefly based on dairy breeds for both milk and meat production [2], with lamb being considered a high-quality product and even a delicacy in many countries [6].
In several breeds, artificial and natural selection have indirectly led to the development of adaptation to varying environmental conditions in different geographic regions. Within this spectrum, fat-tailed sheep are a noteworthy category of the world sheep population [7]. These sheep are primarily found in the Middle East, North and East Africa, and Central Asia. As highlighted by Xu et al. [8], fat tails serve as vital energy reserves that are crucial for survival in the wake of challenging conditions like droughts and food scarcity. This notion was further affirmed by Mwacharo et al. [9], who underscored that fat-tailed sheep predominate in the deserts and highlands of northern Africa, as well as in the semi-arid and arid regions of eastern and southern Africa.
The level of lipid storage in the carcass influences meat quality [10,11]. Moreover, fat affects many physical and chemical properties (e.g., color, water holding capacity) that are fundamental in the purchasing decision process [12,13,14,15]. Also, considering the increase in human living standards, people prefer tasty and healthy meat. Hence, increasing attention has been paid to provide leaner meat and to produce meat with intermuscular fat characterized by a lower saturation and higher unsaturation of fatty acids [16]. Adipose tissue is an important storage location for excess energy [10], with tail and subcutaneous fat being domestic animals’ major fat storage sites [11]. The number of sheep breeds that have evolved worldwide is very high, with many being found specifically in northern Africa, the Middle East, Central Asia, and Western China [17]. It is assumed that the first home sheep were thin, but over time, due to the need to store energy for harsh environmental conditions, fat-tailed breeds gradually appeared [18]. However, in modern sheep industry systems, thin-tailed breeds are more desirable, while tail tissue has lost its importance in fat-tailed sheep. There are several logical reasons behind this trend: 1. in modern sheep breeding systems, there is no need for energy from tail tissue because intensive or semi-intensive feeding systems are preferred; 2. feed efficiency is decreased due to the higher energy requirement of fat anabolism as compared to the generation of protein or other molecules 3. today, the health of consumers is threatened by the consumption of high-fat foods; 4. a large tail can cause problems for mating and animal welfare. Therefore, raising thin-tailed sheep is cost-effective for both producers and consumers, and one of the sheep industry’s primary goals is to study lean meat. In this context, disentangling the molecular mechanism of fat accumulation is critical to reduce its content in the carcass, as the manipulation of fat deposition is crucial to produce lean meat.
To date, various genomic- [19,20,21,22,23,24,25] and transcriptomic-based studies [26,27,28,29,30] have aimed to pinpoint the wide range of genes responsible for fat deposition. Most studies have addressed the mechanism of fat deposition in the tail of fat-tailed sheep breeds [3,24,31,32,33,34], with the majority of them focusing on one gene, especially Leptin (LEP) [35,36,37], Fatty Acid Banding Protein4 (FABP4) [38,39,40], Adiponectin, C1Q And Collagen Domain Containing (ADIPOQ) [11,30], and Stearoyl-CoA Desaturase (SCD) [41,42]. Nowadays, instead of examining single genes, the whole genome of animals can be examined using next-generation sequencing (NGS) technologies. Using this approach, the whole transcriptomes of single cells can be examined using RNA sequencing (RNA-Seq). This method makes it possible to measure the expression of countless genes simultaneously and gives us a lot of information about the genome, even if there is little consensus on the obtained results, with the differentially expressed genes (DEGs) of one study not being supported by the results of another. The observed differences in the identified DEGs among studies requires a meta-analysis to uncover the genes that are responsible for fat deposition. Indeed, this method, through the use of rigorous statistical tests, can disclose patterns hidden in individual studies and allows one to draw conclusions with a high degree of reliability. For this study, by employing meta-analysis and machine learning approaches, we re-analyzed data from three recently conducted whole transcriptome RNA-seq studies of Guangling Large-Tailed and Small-Tailed Han sheep [11], Lori-Bakhtiari (fat-tailed) and Zel (thin-tailed) sheep [43], and Ghezel (fat-tailed) and Zel (thin-tailed) sheep [29]. The primary purpose of the current study was to identify differential meta-genes in male individuals of fat- and thin-tailed sheep breeds as transcriptomic signatures of fat deposition.

2. Materials and Methods

An overview of the process followed in this study is shown in Figure 1.

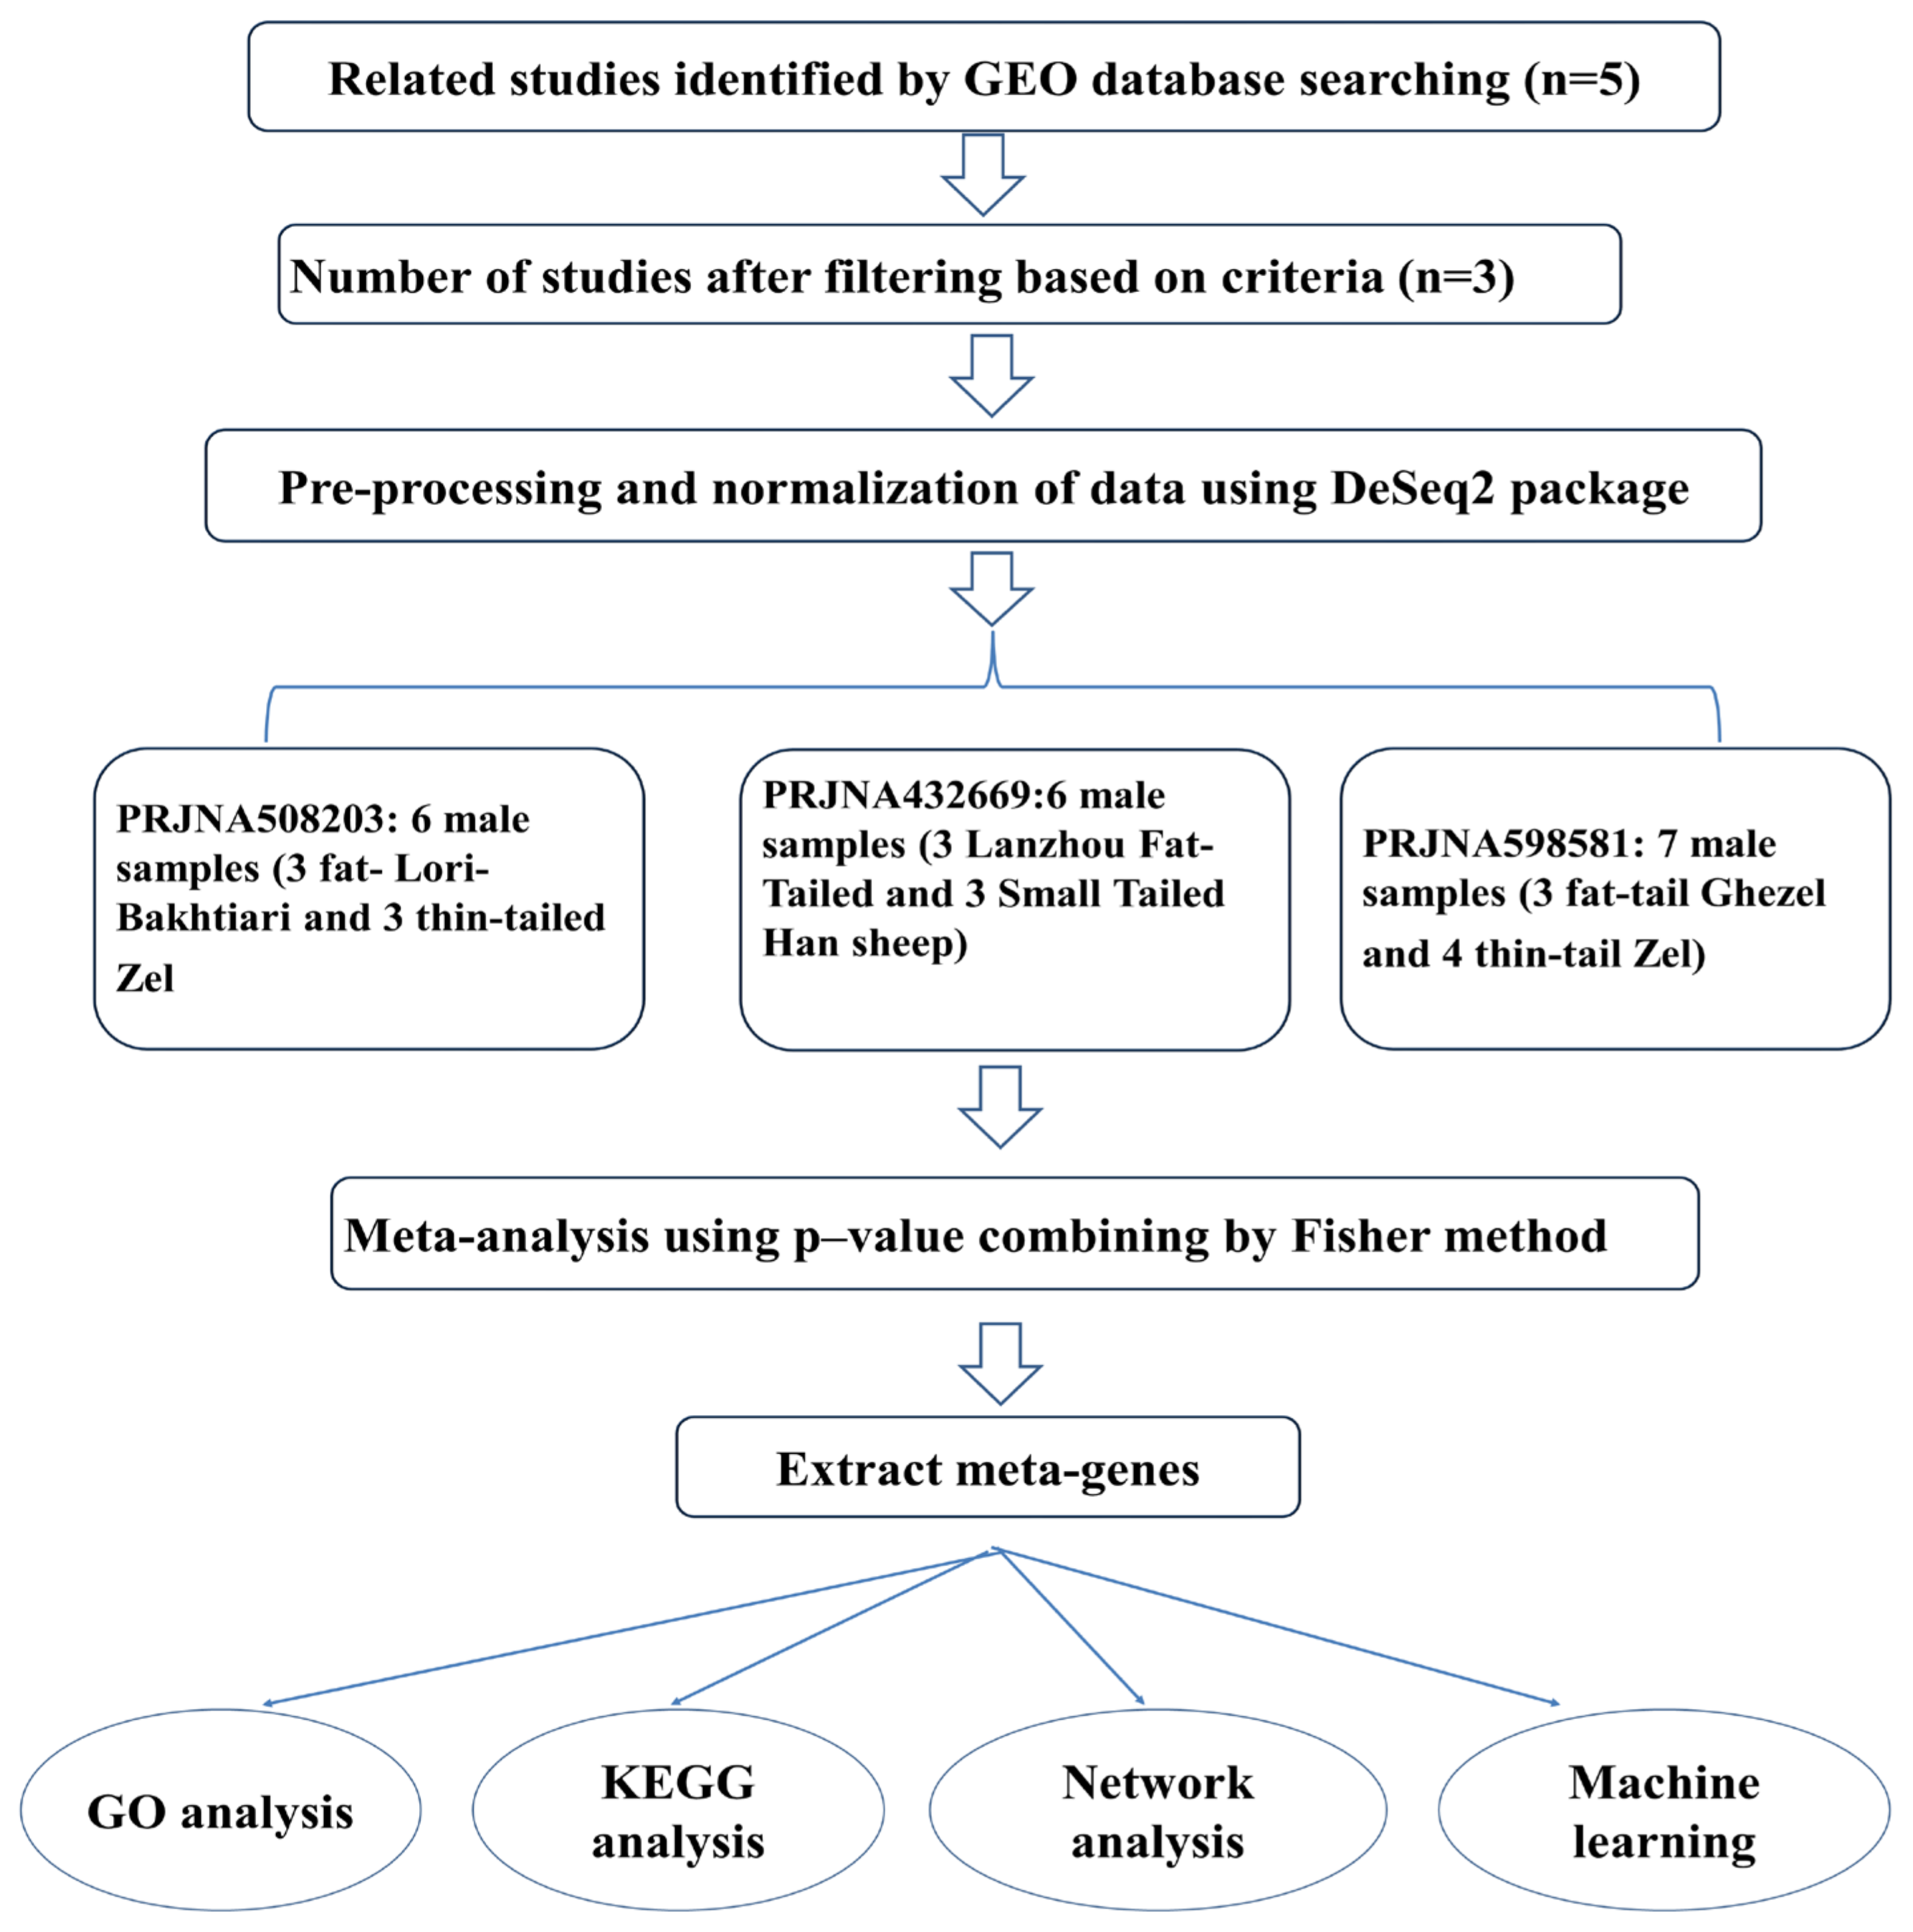
2.1. Dataset Collection

The keywords that were used were “Ovis aries”, “Fat-tailed”, “Thin-tailed”, “Fat deposition” and “Lipid metabolism”. We used PubMed Central (https://www.ncbi.nlm.nih.gov/pubmed accessed on 11 June 2021) and Google Scholar (https://scholar.google.com accessed on 11 June 2021). After identifying suitable RNA-seq studies of tail-fat deposition in the relevant fat- and thin-tailed sheep breeds, the related data were retrieved from either EMBL_EBI (https://www.ebi.ac.uk/arrayexpress accessed on 11 June 2021) or Gene Expression Omnibus (GEO) of NCBI (https://www.ncbi.nlm.nih.gov/gds accessed on 11 June 2021) databases. Two studies were excluded from our studies because the type of tissue examined or the type of RNA examined, or the sex of the samples were different. Finally, a set of sequencing data were collected from the fat tail tissue of male individuals from different sheep breeds.

2.2. Quality Control, Mapping, and Differential Gene Expression Analysis

Raw sequencing reads were subjected to quality control using FastQC (v0.11.5) [44] and trimmed using Trimmomatic software (v0.35); raw reads with adapter contamination and more than 10% of unknown bases, as well as with more than 50% of low-quality bases were trimmed out. Moreover, undesirable reads after trimming were filtered out [45]. The clean reads were mapped to the sheep reference genome v4.0 (ftp://ftp.ncbi.nlm.nih.gov/genomes/Ovis_aries/ accessed on 11 June 2021) using TopHat (v2.1.1) [46]. Sorted Binary Alignment Map (BAM) files were converted to Sequence Alignment Map (SAM) files, and count matrices were generated using htseq-count [47]. Then, the expression of the genes was normalized for library size and gene length to determine gene abundances using Fragment Per Kilo bases per Million (FPKM) [48], and the differentially expressed genes between the fat- and thin-tailed samples were identified using the DEseq2 package of R software [49]. For every dataset, each of these steps was carried out separately.

2.3. Meta-Analysis

The results of multiple scientific studies can be combined via a meta-analysis [50]. In addition to providing estimates of unknown effect sizes, meta-analyses can identify interesting and otherwise undetected relationships based on these results [51]. A set of p-values was computed for all three individual study datasets and later combined using the Fisher method of the meta RNAseq package [52]. Significance was set at p < 0.05. We named the final set of DEGs identified via our meta-analysis meta-genes.

2.4. GO Classification and KEGG Pathway Analysis

Gene ontology analysis is used to describe the function of genes in organisms. The Database for Annotation, Visualization, and Integrated Discovery (DAVID) (https://david.ncifcrf.gov/ accessed on 11 June 2021) was utilized to identify the category of meta-genes in the Gene Ontology (GO) based on Biological Processes (BP), Cellular Components (CC), and Molecular Functions (MF). Furthermore, the Kyoto Encyclopedia of Genes and Genomes (KEGG) pathway analysis tool (http://www.genome.jp/kegg/ accessed on 11 June 2021) was used to detect the metabolic pathways that are enriched by the meta-genes. For the enrichment analysis, terms with p < 0.05 generated using the modified Fisher Exact test were set as the cutoff thresholds.

2.5. Protein–Protein Network and Module Analysis

Protein functional interactions and their systematic properties help to provide context in molecular biology systems. The STRING database (http://string-db.org accessed on 11 June 2021) integrates protein–protein interactions that include direct (physical) and indirect (functional) interactions [53]. To predict protein–protein interactions, the identified meta-genes were imported into the STRING database (v11.0) [54]. The functional modules were detected via clustering using the K-means algorithm. Also, the Cytoscape plugin cytoHubba (v3.7.2) was utilized to identify hub genes using the Maximal Clique Centrality (MCC) method [55]. The PPI networks were constructed based on co-expression, neighborhood interactions, text mining, gene fusion, and databases as interaction sources. Functional modules were defined in the constructed networks by clustering the K-means algorithm into three modules [56].

2.6. Validation of Hub Genes Using Machine Learning Algorithms

Machine learning (ML) is a subset of artificial intelligence (AI) that uses algorithms to automatically learn insights and identify patterns from data to make better decisions. Decision Tree (DT) is one of the simplest and best models in machine learning, the main purpose of which is to predict the value of the target variable by using learning simple decision rules deduced from data features [57]. To assess the effectiveness of hub genes in distinguishing between fat-tailed and thin-tailed sheep, meta-genes and their corresponding expression values were identified and subjected to gene selection using seven different weighting algorithms. Normalized data were used for the attribute weighting algorithms (AWs). A range between 0 and 1 was considered for all weights, with values closer to 1 indicating important attributes for one meta-gene. These algorithms include Uncertainty, Relief, Gain Ratio, Information Gain, Gini Index, Chi-square, and Rule [58]. Only meta-genes with a weighting value greater than 0.7 were selected for DT construction using four criteria—Information Gain, Information Gain ratio, Gini index, and Accuracy—along with the leave-one-out cross-validation (LOOCV) method. During this process, the initial dataset was divided into training and testing sets. One sample at a time was removed from the initial dataset and added to the testing set, while all the others remained in the training set [59].

3. Results

3.1. Sequencing Data Collection

For this study, a total of approximately 200 Giga bases of RNA-seq from three datasets were utilized, comprising 19 samples in total. Each of the three datasets was sequenced using the Illumina HiSeq 2000 platform, and information pertaining to the three datasets is listed in Table 1.

3.2. Meta-Analysis of RNA-Seq Data

A total of 136 meta-genes were identified. Fisher’s method of differential analysis identified 20 meta-genes in PRJNA432669, 2 in PRJNA598581, and 75 in PRJA508203, along with 39 that had not been previously identified in the individual analyses.

3.3. Functional Enrichment Analysis of Meta-Genes

The top 10 BP terms are shown in Table 2.
The CC terms of “lipid droplet”, “Golgi lumen”, “endoplasmic reticulum lumen”, and MF terms of “lipoprotein lipase activity”, “dipeptidyl-peptidase activity”, “phospholipase activity”, “interleukin-17 receptor activity”, and “cAMP response element binding” were significantly enriched (p < 0.05). Several BP terms related to lipolysis, such as the “positive regulation of interleukin-1 beta secretion”, “positive regulation of interleukin-6 production”, “positive regulation of interleukin-8 production, “positive regulation of interleukin-10 production”, “regulation of interleukin-12 secretion”, “regulation of interleukin-13 secretion”, “positive regulation of interferon-gamma secretion”, and “positive regulation of tumor necrosis factor production” were enriched by meta-genes. The meta-genes were also mapped onto the KEGG pathway database to identify the pathways related to fat deposition (Figure 2).

3.4. Protein–Protein Interaction (PPI) Network and Module Analysis

The PPI network of meta-genes revealed that 88% of the identified meta-genes had considerable interaction with the primary functional modules based on the confidence score of the interaction (confidence score < 0.7). In contrast, other disconnected nodes had no interaction in PPI networks (Figure 3). Also, TNF Receptor Associated Factor 6 (TRAF6) and Collagen, type I, Alpha 1 (COL1A1) meta-genes were identified as hub genes in PPI networks’ green and red modules, respectively.

3.5. Feature Selection for Machine Learning

The meta-analysis resulted in the identification of 136 differentially expressed genes between the fat- and thin-tailed sheep breeds. Ten meta-genes, including Periostin (POSTN), Keratin 35 (K35), SET Domain Containing 4 (SETD4), Ubiquitin Specific Peptidase 29 (USP29), Ankyrin Repeat Domain 37 (ANKRD37), ENSOARG00000001454, Reticulon (RTN2), Proteoglycan (PRG4), and Leucine Rich Repeat Containing 4C (LRRC4C), were detected by the majority of the attribute weighting algorithms (with weight above 0.7) as the most informative genes. The top ten meta-genes in the discrimination of fat- and thin-tailed samples, confirmed by the majority of AWs (with an average weight above 0.7), are reported in Table 3. These meta-genes gained higher importance than the remaining meta-genes and were believed to be more effective in distinguishing the two breeds. According to Figure 4, a mean expression comparison between two types of breeds was carried out using a two-sample t-test. The expression of POSTN, K35, and SETD4 meta-genes showed significant differences between the two sheep breeds.
The performances of the eight decision tree models are presented in Table 4. According to Table 4, among the decision tree models, the Random Forest with accuracy criterion and the Random Forest with gain_ratio criterion models surpassed the others in predicting fat deposition in both fat- and thin-tailed sheep breeds. These models had higher accuracy (above 0.85%).
Also, the machine learning results show that the two meta-genes with the highest weight (K35 and SETD4) were down-regulated, and POSTN was up-regulated in the thin-tailed sheep breeds compared to the fat-tailed sheep breeds (Figure 5).

4. Discussion

The current study identified genes that are informative in terms of the tail fat deposition of fat-tailed sheep breeds through using, for the first time in the literature, a machine learning approach. “ERK1 and ERK2 cascade” and “stress-activated MAPK cascade” terms are related to lipid metabolism. The two extracellular signal-regulated kinases (ERKs), ERK1 and ERK2, are members of the mitogen-activated protein kinase (MAPK) pathway and participate in both cell differentiation and proliferation, as well as the regulation of lipolysis [60]. ERK activation leads to the fast stimulation of hormone-sensitive lipase (HSL) activity and contributes to increased lipolysis. Documented pieces of evidence show that, as a stimulator of lipolysis, catecholamines cannot only activate cAMP-dependent protein kinase (PKA) but also activate ERKs of the MAPK pathway [61]. Five genes were enriched in the “ERK1 and ERK2 cascade”, including Kinase Insert Domain Receptor (KDR) or Vascular Endothelial Growth Factor Receptor 2 (VEGFR2), Galectin-9 (LGALS9), TRAF6, Nucleotide Binding Oligomerization Domain Containing 2 (NOD2), and Vascular Endothelial Growth Factor Receptor 3 (VEGFR3). Three of them (i.e., KDR, NOD2, and LGALS9) are closely related to lipid metabolism. A recent study showed that the KDR gene protects mice from obesity via fat burning and progressing lipolysis and enhancing basal metabolic rate [62]. In addition, it has been shown that galectin-9 enhances the production of microglial Tumor Necrosis Factor (TNF), which is the main lipolytic factor [63]. NOD2 has also been shown to protect mice against diet-induced obesity and metabolic dysfunction, with obese mice lacking the NOD2 gene suffering from metabolic dysfunction, including blood lipids, hyperglycemia, and steatosis, and the mass of adipose tissue and large fat droplets in liver cells increases [64]. These results were consistent with those of a recent study on the difference in adipose tissue metabolic pathways in fat- and thin-tailed sheep breeds [34].
There is a direct connection between lipid metabolism and terms such as Interleukin-1 (IL-1) [65], Interleukin-6 (IL-6) [29], Interleukin-8 (IL-8) [66], Interleukin-10 (IL-10) [67], Interleukin-12 (IL-12) [68]. The “positive regulation of tumor necrosis” factor production is also one of the BP terms closely related to lipolysis. It has been reported that, in human adipocytes, TNF-α stimulates lipolysis via the elevation of intracellular cAMP, MAPK, and extracellular signal-related kinase (ERK) [69,70]. All the inflammatory pathways and the lipolytic ERK/MAPK/TNF pathways enhance lipolysis. In other words, these pathways improve pro-inflammatory cytokine expression and increase lipolytic activity. Finally, these results suggest that some essential lipolytic pathways (e.g., “MAPK signaling pathway” and “TNF signaling pathway”) and inflammatory pathways (e.g., “positive regulation of IL-1 secretion”, “positive regulation of IL-6 production”, “positive regulation of IL-8 production”, and “positive regulation of IL-10 production”) are active in thin-tailed sheep breeds. There have been reports that IL-1 and interferon-gamma (IFN) stimulate lipolysis in cultured adipocytes [71]. In addition, inflammatory cytokine IL-6 and IL-8 mRNA expressions are involved in lipopolysaccharide-induced lipolysis in human adipocytes [67]. Another study introduced IL-6 as a hub gene in the fat lipolysis of thin-tailed sheep breeds [29]. This gene is well known to be a lipolytic factor that stimulates fat lipolysis and fatty acid oxidation in humans [72,73], dairy cows [74], rats [75], mice [76,77], and sheep [29]. Thus, the up-regulation of the aforementioned genes in thin-tailed sheep might be closely related to lipolysis.
Our KEGG pathway analysis of the meta-genes revealed significant pathways (adjusted p-value < 0.05). Recent findings show that a set of pathways, such as lipid metabolism, extracellular matrix (ECM) remodeling, molecular transport, and inflammatory response, are enriched by a set of functional genes that maintain lipid homeostasis in response to extreme environments in tailed animals [34]. In the present study, some pathways, including “fatty acid degradation”, “NF-kappa B signaling pathway”, “NOD-like receptors”, and “Toll-like receptors”, were all related to fat metabolism as an inflammatory response. One of the significant terms in thin-tailed sheep breeds compared with fat-tailed sheep breeds is the “fatty acid degradation” pathway, the pathway known for the lipolysis of adipocytes. Another considerable term is “NF-kappa B signaling pathway”. NF-κB is important for TNF-α-induced lipolysis of adipose tissue. Tumor necrosis factor-α (TNF-α) increases lipolysis in adipose tissue via the MAPK pathway. Several meta-genes, including Myeloid Differentiation Primary Response 88 (MYD88), TGF-Beta Activated Kinase 1 (MAP3K7) Binding Protein 2 (TAB2), Interleukin-1 Receptor-associated Kinase 1 (IRAK1), Phospholipase C Gamma 2 (PLCG2), and TRAF6, were found to be enriched in the “NF-kappa B signaling pathway”, which is closely related to lipid metabolism.
“ECM-receptor interaction” is another significant pathway that is central to adipogenesis and fat tissue architecture [78]. Fat accumulation is an inflammatory condition related to increased extracellular matrix gene expression [34,79]. However, a direct connection between ECM gene expression and fat tissue inflammation has not been reported. In a recent study, transcriptome analysis of two broiler chickens showed that the extracellular matrix receptor interaction signaling pathway is crucial to chicken meat quality. This pathway might change intramuscular fat content, affecting broiler meat flavor [80]. In another study, comparative transcriptome analysis of three adipose tissues (i.e., subcutaneous, intramuscular, and omental adipose tissue) showed that the interactions between transmembrane receptors of fat cells and ECM components depend on depot-specific adipogenesis [81]. Cell adhesion receptors and ECM components interact with each other, creating a complex network. According to one study, cell surface receptors receive signals from the ECM that influence growth, survival, migration, differentiation, and proliferation in maintaining cell homeostasis [82]. All enriched meta-genes in this pathway are up-regulated in thin-tailed sheep breeds, possibly due to the interaction between ECM components. This result is in accordance with a recent study that showed that fat-tailed sheep are less responsive to seasonal changes in inflammation and fat cell size, ECM regeneration, and lipid metabolism, which indicates the improvement of homeostasis [34].
“NOD-like receptors” (NLR) and “Toll-like receptors” (TLR) are two pattern recognition receptors that have severe roles in the inflammation of adipocytes and the immune response [83]. Both of the mentioned KEGG pathways were significantly enriched in the current study. The activation of a sub-family of these receptors [84,85,86] has been shown to stimulate lipolysis from adipose tissue or adipocytes. Therefore, all these pathways maintain fat homeostasis in response to extreme environments in sheep breeds.
The meta-analysis results revealed 39 meta-genes that were insignificant in each of the individual studies, indicating the higher statistical power of the meta-analysis in the discovery of biosignatures. In addition, the results derived from using machine learning showed that three significant genes (POSTN, K35, and SETD4) gained higher weights (>0.8) than others, according to the AW algorithms. Interestingly, these meta-genes, along with other genes with a weight >0.8, are associated with lipid metabolism. The decision tree induced by the Random Forest Model shows that POSTN, K35, and SETD4 meta-genes directly affect lipid metabolism. Interestingly, the SETD4 gene is one of the 39 meta-genes that were insignificant in the individual studies. Currently, the role of the K35 gene in fat metabolism has not been identified, but two other genes have been shown to be related to fat metabolism. There have been reports that the SETD4 gene has considerable potential for tumorigenesis. It is thought that the SETD4 gene has proliferation potential in fat cells [87]. Thus, lipogenesis might be associated with the up-regulation of the SETD4 gene in fat-tailed sheep. Moreover, the loss of POSTN attenuates lipid metabolism in adipose tissue [88]. Among the decision tree models, both the Random Forest with accuracy criterion and the Random Forest with gain_ratio criterion models outperformed others in the prediction of fat deposition in sheep breeds. These high-performance models enabled us to detect the POSTN, K35, and SETD4 meta-genes as biosignatures or biomarkers for fat metabolism. Therefore, the combination of meta-analysis and machine learning approaches employed in the current study improved the power of discovering informative genes that may aid the progress of animal breeding strategies to optimize tail fat in fat-tailed breeds.

5. Conclusions

Fat deposition is a complex trait that requires comprehensive research to be elucidated. However, the integration of machine learning and meta-analyses approaches, as carried out for the current work, may help to better understand the most critical causal genes that can be exploited as strong biomarkers of fat deposition; in our study, three meta-genes, namely, POSTN, K35, and SETD4, were identified as strong biosignatures of fat deposition. Our findings may provide a base for strategies to optimize fat deposition in the tail of fat-tailed breeds, thus decreasing the fat content of carcasses.

Author Contributions

Conceptualization, S.F., K.H. and J.S.G.; methodology, K.H. and J.S.G.; software, S.F., K.H. and J.S.G.; validation, V.L., A.M. and V.P.; formal analysis, S.F. and K.H.; investigation, S.F., K.H. and J.S.G.; resources, J.S.G. and S.F.; data curation, S.F. and J.S.G.; writing—original draft preparation, S.F., K.H. and J.S.G.; writing—review and editing, A.M., V.P. and V.L.; visualization, V.P. and A.M.; supervision, V.P. and V.L.; project administration, S.F. and J.S.G.; funding acquisition, A.M. and V.P. All authors have read and agreed to the published version of the manuscript.

Funding

This study was carried out within the Agritech National Research Center via a grant from the European Union Next-GenerationEU (PIANO NAZIONALE DI RIPRESA E RESILIENZA (PNRR)—MISSIONE 4 COMPONENTE 2, INVESTIMENTO 1.4—D.D. 1032 17/06/2022, CN00000022). This manuscript reflects only the authors’ views and opinions; neither the European Union nor the European Commission can be considered responsible for them.

Institutional Review Board Statement

Not applicable.

Informed Consent Statement

Not applicable.

Data Availability Statement

All used data are publically available. The accession numbers have been reported in Table 1.

Acknowledgments

We are grateful to Mohammad Farhadian for his kind help. The authors express their sincere gratitude to Selim Esen for his valuable cooperation and technical assistance.

Conflicts of Interest

The authors declare no conflict of interest.

References

  1. Maggiolino, A.; Bragaglio, A.; Salzano, A.; Rufrano, D.; Claps, S.; Sepe, L.; Damiano, S.; Ciarcia, R.; Dinardo, F.R.; Hopkins, D.L.; et al. Dietary supplementation of suckling lambs with anthocyanins: Effects on growth, carcass, oxidative and meat quality traits. Anim. Feed Sci. Technol. 2021, 276, 114925. [Google Scholar] [CrossRef]
  2. De Palo, P.; Maggiolino, A.; Centoducati, P.; Calzaretti, G.; Ceci, E.; Tateo, A. An assessment of sire-breed effects on carcass and meat quality traits of lambs at the ages of 40 and 100 days from Comisana ewes crossed with Suffolk or Bergamasca rams. J. Anim. Prod. Sci. 2018, 58, 1794–1801. [Google Scholar] [CrossRef]
  3. Mohapatra, A.; Shinde, A. Fat-tailed sheep-an important sheep genetic resource for meat production in tropical countries: An overview. Indian. J. Small Rumin. 2018, 24, 1–17. [Google Scholar] [CrossRef]
  4. Zhou, G.; Wang, X.; Yuan, C.; Kang, D.; Xu, X.; Zhou, J.; Geng, R.; Yang, Y.; Yang, Z.; Chen, Y. Integrating miRNA and mRNA expression profiling uncovers miRNAs underlying fat deposition in sheep. BioMed Res. Int. 2017, 2017, 1857580. [Google Scholar] [CrossRef] [PubMed]
  5. Ryder, M.L. Sheep and Man; Gerald Duckworth & Co., Ltd.: London, UK, 1983. [Google Scholar]
  6. Vieira, C.; Fernández, A.M. Effect of ageing time on suckling lamb meat quality resulting from different carcass chilling regimes. Meat Sci. 2014, 96, 682–687. [Google Scholar] [CrossRef]
  7. Moradi, M.H.; Nejati-Javaremi, A.; Moradi-Shahrbabak, M.; Dodds, K.G.; McEwan, J.C. Genomic scan of selective sweeps in thin and fat tail sheep breeds for identifying of candidate regions associated with fat deposition. BMC Genet. 2012, 13, 10. [Google Scholar] [CrossRef] [PubMed]
  8. Xu, S.-S.; Ren, X.; Yang, G.-L.; Xie, X.-L.; Zhao, Y.-X.; Zhang, M.; Shen, Z.-Q.; Ren, Y.-L.; Gao, L.; Shen, M.; et al. Genome-wide association analysis identifies the genetic basis of fat deposition in the tails of sheep (Ovis aries). Anim. Genet. 2017, 48, 560–569. [Google Scholar] [CrossRef] [PubMed]
  9. Mwacharo, J.M.; Kim, E.-S.; Elbeltagy, A.R.; Aboul-Naga, A.M.; Rischkowsky, B.A.; Rothschild, M.F. Genomic footprints of dryland stress adaptation in Egyptian fat-tail sheep and their divergence from East African and western Asia cohorts. Sci. Rep. 2017, 7, 17647. [Google Scholar] [CrossRef]
  10. Braissant, O.; Foufelle, F.; Scotto, C.; Dauça, M.; Wahli, W. Differential expression of peroxisome proliferator-activated receptors (PPARs): Tissue distribution of PPAR-alpha,-beta, and-gamma in the adult rat. Endocrinology 1996, 137, 354–366. [Google Scholar] [CrossRef]
  11. Li, B.; Qiao, L.; An, L.; Wang, W.; Liu, J.; Ren, Y.; Pan, Y.; Jing, J.; Liu, W. Transcriptome analysis of adipose tissues from two fat-tailed sheep breeds reveals key genes involved in fat deposition. BMC Genom. 2018, 19, 338. [Google Scholar] [CrossRef]
  12. Quiñones, J.; Maggiolino, A.; Bravo, S.; Muñoz, E.; Lorenzo, J.M.; Cancino, D.; Díaz, R.; Saenz, C.; Sepúlveda, N.; De Palo, P. Effect of canola oil on meat quality and fatty acid profile of Araucano creole lambs during fattening period. Anim. Feed Sci. Technol. 2019, 248, 20–26. [Google Scholar] [CrossRef]
  13. De Palo, P.; Tateo, A.; Maggiolino, A.; Marino, R.; Ceci, E.; Nisi, A.; Lorenzo, J.M. Martina Franca donkey meat quality: Influence of slaughter age and suckling technique. Meat Sci. 2017, 134, 128–134. [Google Scholar] [CrossRef] [PubMed]
  14. Tateo, A.; Maggiolino, A.; Domínguez, R.; Lorenzo, J.M.; Dinardo, F.R.; Ceci, E.; Marino, R.; Della Malva, A.; Bragaglio, A.; De Palo, P. Volatile Organic Compounds, Oxidative and Sensory Patterns of Vacuum Aged Foal Meat. Animals 2020, 10, 1495. [Google Scholar] [CrossRef] [PubMed]
  15. Serrano, M.P.; Maggiolino, A.; Lorenzo, J.M.; De Palo, P.; García, A.; Landete-Castillejos, T.; Gambín, P.; Cappelli, J.; Domínguez, R.; Pérez-Barbería, F.J.; et al. Meat quality of farmed red deer fed a balanced diet: Effects of supplementation with copper bolus on different muscles. Animal 2019, 13, 888–896. [Google Scholar] [CrossRef]
  16. Dong, L.; Jin, Y.; Cui, H.; Yu, L.; Luo, Y.; Wang, S.; Wang, H. Effects of diet supplementation with rumen-protected betaine on carcass characteristics and fat deposition in growing lambs. Meat Sci. 2020, 166, 108154. [Google Scholar] [CrossRef] [PubMed]
  17. Pourlis, A.F. A review of morphological characteristics relating to the production and reproduction of fat-tailed sheep breeds. Trop. Anim. Health Prod. 2011, 43, 1267–1287. [Google Scholar] [CrossRef]
  18. Kalds, P.; Luo, Q.; Sun, K.; Zhou, S.; Chen, Y.; Wang, X. Trends towards revealing the genetic architecture of sheep tail patterning: Promising genes and investigatory pathways. Anim. Genet. 2021, 52, 799–812. [Google Scholar] [CrossRef]
  19. Ornaghi, M.G.; Guerrero, A.; Vital, A.C.P.; de Souza, K.A.; Passetti, R.A.C.; Mottin, C.; de Araújo Castilho, R.; Sañudo, C.; do Prado, I.N. Improvements in the quality of meat from beef cattle fed natural additives. Meat Sci. 2020, 163, 108059. [Google Scholar] [CrossRef]
  20. Luo, R.; Zhang, X.; Wang, L.; Zhang, L.; Li, G.; Zheng, Z. GLIS1, a potential candidate gene affect fat deposition in sheep tail. Mol. Biol. Rep. 2021, 48, 4925–4931. [Google Scholar] [CrossRef]
  21. Shao, J.; He, S.; Pan, X.; Yang, Z.; Nanaei, H.A.; Chen, L.; Li, R.; Wang, Y.; Gao, S.; Xu, H. Allele-specific expression reveals the phenotypic differences between thin-and fat-tailed sheep. J. Genet. Genom. 2020, 49, 583–586. [Google Scholar]
  22. Moioli, B.; Pilla, F.; Ciani, E. Signatures of selection identify loci associated with fat tail in sheep. J. Anim. Sci. 2015, 93, 4660–4669. [Google Scholar] [CrossRef] [PubMed]
  23. Wei, C.; Wang, H.; Liu, G.; Wu, M.; Cao, J.; Liu, Z.; Liu, R.; Zhao, F.; Zhang, L.; Lu, J. Genome-wide analysis reveals population structure and selection in Chinese indigenous sheep breeds. BMC Genom. 2015, 16, 194. [Google Scholar] [CrossRef]
  24. Dong, K.; Yang, M.; Han, J.; Ma, Q.; Han, J.; Song, Z.; Luosang, C.; Gorkhali, N.A.; Yang, B.; He, X. Genomic analysis of worldwide sheep breeds reveals PDGFD as a major target of fat-tail selection in sheep. BMC Genom. 2020, 21, 800. [Google Scholar] [CrossRef] [PubMed]
  25. Pan, Z.; Li, S.; Liu, Q.; Wang, Z.; Zhou, Z.; Di, R.; An, X.; Miao, B.; Wang, X.; Hu, W. Rapid evolution of a retro-transposable hotspot of ovine genome underlies the alteration of BMP2 expression and development of fat tails. BMC Genom. 2019, 20, 261. [Google Scholar] [CrossRef] [PubMed]
  26. Wang, X.; Zhou, G.; Xu, X.; Geng, R.; Zhou, J.; Yang, Y.; Yang, Z.; Chen, Y. Transcriptome profile analysis of adipose tissues from fat and short-tailed sheep. Gene 2014, 549, 252–257. [Google Scholar] [CrossRef]
  27. Ma, L.; Li, Z.; Cai, Y.; Xu, H.; Yang, R.; Lan, X. Genetic variants in fat-and short-tailed sheep from high-throughput RNA-sequencing data. Anim. Genet. 2018, 49, 483–487. [Google Scholar] [CrossRef]
  28. Bakhtiarizadeh, M.R.; Alamouti, A.A. RNA-Seq based genetic variant discovery provides new insights into controlling fat deposition in the tail of sheep. Sci. Rep. 2020, 10, 13525. [Google Scholar] [CrossRef]
  29. Farhadi, S.; Shodja Ghias, J.; Hasanpur, K.; Mohammadi, S.A.; Ebrahimie, E. Molecular mechanisms of fat deposition: IL-6 is a hub gene in fat lipolysis, comparing thin-tailed with fat-tailed sheep breeds. Arch. Anim. Breed. 2021, 64, 53–68. [Google Scholar] [CrossRef]
  30. Zhang, W.; Xu, M.; Wang, J.; Wang, S.; Wang, X.; Yang, J.; Gao, L.; Gan, S. Comparative transcriptome analysis of key genes and pathways activated in response to fat deposition in two sheep breeds with distinct tail phenotype. Front. Genet. 2021, 12, 639030. [Google Scholar] [CrossRef]
  31. Ibrahim, A.; Baliarti, E.; Budisatria, I.; Artama, W.T.; Widayanti, R.; Maharani, D.; Tavares, L.; Margawati, E.T. Genetic diversity and relationship among Indonesian local sheep breeds on Java Island based on mitochondrial cytochrome b gene sequences. J. Genet. Eng. Biotechnol. 2023, 21, 34. [Google Scholar] [CrossRef]
  32. Deribe, B.; Beyene, D.; Dagne, K.; Getachew, T.; Gizaw, S.; Abebe, A. Morphological diversity of northeastern fat-tailed and northwestern thin-tailed indigenous sheep breeds of Ethiopia. Heliyon 2021, 7, e07472. [Google Scholar] [CrossRef]
  33. Yazdani, H.; Gholizadeh, M.; Farhadi, A.; Moradi, M.H. Study of the copy number variation on the sex chromosome in some Iranian sheep breeds. Iran. J. Anim. Sci. 2023, 54, 253–266. [Google Scholar]
  34. Xu, Y.-X.; Wang, B.; Jing, J.-N.; Ma, R.; Luo, Y.-H.; Li, X.; Yan, Z.; Liu, Y.-J.; Gao, L.; Ren, Y.-L. Whole-body adipose tissue multi-omic analyses in sheep reveal molecular mechanisms underlying local adaptation to extreme environments. Commun. Biol. 2023, 6, 159. [Google Scholar] [CrossRef] [PubMed]
  35. Mohammadabadi, M.; Kord, M.; Nazari, M. Studying expression of leptin gene in different tissues of Kermani Sheep using Real Time PCR. Agric. Biotechnol. J. 2018, 10, 111–123. [Google Scholar]
  36. Krawczyńska, A.; Herman, A.P.; Antushevich, H.; Bochenek, J.; Wojtulewicz, K.; Zieba, D.A. The Effect of Leptin on the Blood Hormonal Profile (Cortisol, Insulin, Thyroid Hormones) of the Ewe in Acute Inflammation in Two Different Photoperiodical Conditions. Int. J. Mol. Sci. 2022, 23, 8109. [Google Scholar] [CrossRef]
  37. Picó, C.; Palou, M.; Pomar, C.A.; Rodríguez, A.M.; Palou, A. Leptin as a key regulator of the adipose organ. Rev. Endocr. Metab. Disord. 2022, 23, 13–30. [Google Scholar] [CrossRef]
  38. Zhang, X.; Liu, C.; Kong, Y.; Li, F.; Yue, X. Effects of intramuscular fat on meat quality and its regulation mechanism in Tan sheep. Front. Nutr. 2022, 9, 908355. [Google Scholar] [CrossRef]
  39. Ji, K.; Jiao, D.; Yang, G.; Degen, A.A.; Zhou, J.; Liu, H.; Wang, W.; Cong, H. Transcriptome analysis revealed potential genes involved in thermogenesis in muscle tissue in cold-exposed lambs. Front. Genet. 2022, 13, 1017458. [Google Scholar] [CrossRef]
  40. Zhang, Y.-M.; Erdene, K.; Zhao, Y.-B.; Li, C.-Q.; Wang, L.; Tian, F.; Ao, C.-J.; Jin, H. Role of white adipose tissue browning in cold seasonal acclimation in grazing Mongolian sheep (Ovis aries). J. Therm. Biol. 2022, 109, 103333. [Google Scholar] [CrossRef]
  41. Aali, M.; Moradi-Shahrbabak, H.; Moradi-Shahrbabak, M.; Sadeghi, M.; Kohram, H. Polymorphism in the SCD gene is associated with meat quality and fatty acid composition in Iranian fat-and thin-tailed sheep breeds. Livest. Sci. 2016, 188, 81–90. [Google Scholar] [CrossRef]
  42. Aali, M.; Shahrbabak, M.M.; Shahrbabak, H.M.; Sadeghi, M. Identifying novel SNPs and allelic sequences of the stearoyl-Coa desaturase gene (SCD) in fat-tailed and thin-tailed sheep breeds. Biochem. Genet. 2014, 52, 153–158. [Google Scholar] [CrossRef]
  43. Bakhtiarizadeh, M.R.; Salehi, A.; Alamouti, A.A.; Abdollahi-Arpanahi, R.; Salami, S.A. Deep transcriptome analysis using RNA-Seq suggests novel insights into molecular aspects of fat-tail metabolism in sheep. Sci. Rep. 2019, 9, 9203. [Google Scholar] [CrossRef]
  44. Andrews, S. FastQC: A quality control tool for high throughput sequence data. Anal. Biochem. 2010, 548, 38–43. [Google Scholar]
  45. Bolger, A.M.; Lohse, M.; Usadel, B. Trimmomatic: A flexible trimmer for Illumina sequence data. Bioinformatics 2014, 30, 2114–2120. [Google Scholar] [CrossRef] [PubMed]
  46. Trapnell, C.; Pachter, L.; Salzberg, S.L. TopHat: Discovering splice junctions with RNA-Seq. Bioinformatics 2009, 25, 1105–1111. [Google Scholar] [CrossRef] [PubMed]
  47. Anders, S.; Pyl, P.T. Wolfgang Huber HTSeq—A Python framework to work with high-throughput sequencing data. Bioinformatics 2015, 31, 166–169. [Google Scholar] [CrossRef]
  48. Mortazavi, A.; Williams, B.A.; McCue, K.; Schaeffer, L.; Wold, B. Mapping and quantifying mammalian transcriptomes by RNA-Seq. Nat. Methods 2008, 5, 621. [Google Scholar] [CrossRef] [PubMed]
  49. Love, M.; Anders, S.; Huber, W. Differential analysis of count data–the DESeq2 package. Genome Biol. 2014, 15, 10–1186. [Google Scholar]
  50. Adèr, H.J.; Mellenbergh, G.J. Research Methodology in the Social, Behavioural and Life Sciences: Designs, Models and Methods; Sage: London, UK, 1999. [Google Scholar]
  51. Conn, V.S.; Ruppar, T.M.; Phillips, L.J.; Chase, J.-A.D. Using meta-analyses for comparative effectiveness research. Nurs. Outlook 2012, 60, 182–190. [Google Scholar] [CrossRef]
  52. Rau, A.; Marot, G.; Jaffrézic, F. Differential meta-analysis of RNA-seq data from multiple studies. BMC Bioinform. 2014, 15, 91. [Google Scholar] [CrossRef]
  53. Szklarczyk, D.; Franceschini, A.; Wyder, S.; Forslund, K.; Heller, D.; Huerta-Cepas, J.; Simonovic, M.; Roth, A.; Santos, A.; Tsafou, K.P. STRING v10: Protein–protein interaction networks, integrated over the tree of life. Nucleic Acids Res. 2015, 43, D447–D452. [Google Scholar] [CrossRef]
  54. Szklarczyk, D.; Morris, J.H.; Cook, H.; Kuhn, M.; Wyder, S.; Simonovic, M.; Santos, A.; Doncheva, N.T.; Roth, A.; Bork, P. The STRING database in 2017: Quality-controlled protein–protein association networks, made broadly accessible. Nucleic Acids Res. 2016, 45, 362–368. [Google Scholar] [CrossRef]
  55. Chin, C.-H.; Chen, S.-H.; Wu, H.-H.; Ho, C.-W.; Ko, M.-T.; Lin, C.-Y. cytoHubba: Identifying hub objects and sub-networks from complex interactome. BMC Syst. Biol. 2014, 8, S11. [Google Scholar] [CrossRef]
  56. Le, V.-H.; Kim, S.-R. K-strings algorithm, a new approach based on Kmeans. In Proceedings of the 2015 Conference on Research in Adaptive and Convergent Systems, New York, NY, USA, 9–12 October 2015; pp. 15–20. [Google Scholar]
  57. Vabalas, A.; Gowen, E.; Poliakoff, E.; Casson, A.J. Machine learning algorithm validation with a limited sample size. PLoS ONE 2019, 14, e0224365. [Google Scholar] [CrossRef] [PubMed]
  58. Ebrahimie, E.; Ebrahimi, M.; Sarvestani, N.R.; Ebrahimi, M. Protein attributes contribute to halo-stability, bioinformatics approach. Saline Syst. 2011, 7, 1. [Google Scholar] [CrossRef]
  59. Farhadian, M.; Rafat, S.A.; Panahi, B.; Mayack, C. Weighted gene co-expression network analysis identifies modules and functionally enriched pathways in the lactation process. Sci. Rep. 2021, 11, 2367. [Google Scholar]
  60. Ikoma-Seki, K.; Nakamura, K.; Morishita, S.; Ono, T.; Sugiyama, K.; Nishino, H.; Hirano, H.; Murakoshi, M. Role of LRP1 and ERK and cAMP signaling pathways in lactoferrin-induced lipolysis in mature rat adipocytes. PLoS ONE 2015, 10, e0141378. [Google Scholar] [CrossRef] [PubMed]
  61. Carmen, G.-Y.; Víctor, S.-M. Signalling mechanisms regulating lipolysis. Cell. Signal. 2006, 18, 401–408. [Google Scholar] [CrossRef]
  62. Robciuc, M.R.; Kivelä, R.; Williams, I.M.; de Boer, J.F.; van Dijk, T.H.; Elamaa, H.; Tigistu-Sahle, F.; Molotkov, D.; Leppänen, V.-M.; Käkelä, R. VEGFB/VEGFR1-induced expansion of adipose vasculature counteracts obesity and related metabolic complications. Cell Metab. 2016, 23, 712–724. [Google Scholar] [CrossRef]
  63. Steelman, A.J.; Li, J. Astrocyte galectin-9 potentiates microglial TNF secretion. J. Neuroinflammation 2014, 11, 144. [Google Scholar] [CrossRef]
  64. Rodriguez-Nunez, I.; Caluag, T.; Kirby, K.; Rudick, C.N.; Dziarski, R.; Gupta, D. Nod2 and Nod2-regulated microbiota protect BALB/c mice from diet-induced obesity and metabolic dysfunction. Sci. Rep. 2017, 7, 548. [Google Scholar] [CrossRef]
  65. Matsuki, T.; Horai, R.; Sudo, K.; Iwakura, Y. IL-1 plays an important role in lipid metabolism by regulating insulin levels under physiological conditions. J. Exp. Med. 2003, 198, 877–888. [Google Scholar] [CrossRef]
  66. Bruun, J.M.; Pedersen, S.B.; Richelsen, B. Regulation of interleukin 8 production and gene expression in human adipose tissue in vitro. J. Clin. Endocrinol. Metab. 2001, 86, 1267–1273. [Google Scholar] [CrossRef]
  67. Acosta, J.R.; Tavira, B.; Douagi, I.; Kulyte, A.; Arner, P.; Ryden, M.; Laurencikiene, J. Human-specific function of IL-10 in adipose tissue linked to insulin resistance. J. Clin. Endocrinol. Metab. 2019, 104, 4552–4562. [Google Scholar] [CrossRef]
  68. Sari, A.; Dogan, S.; Nibali, L.; Koseoglu, S. Evaluation of IL-23p19/Ebi3 (IL-39) gingival crevicular fluid levels in periodontal health, gingivitis, and periodontitis. Clin. Oral. Investig. 2022, 26, 7209–7218. [Google Scholar] [CrossRef]
  69. Jurga, L.; Elisabet, A.N.m.; Andrea, D.; Lennart, B.; Erik, N.s.; Dominique, L.; Peter, A.; Mikael, R.n. NF-κB is important for TNF-α-induced lipolysis in human adipocytes. J. Lipid Res. 2007, 48, 1069–1077. [Google Scholar] [CrossRef]
  70. Zhang, H.H.; Halbleib, M.; Ahmad, F.; Manganiello, V.C.; Greenberg, A.S. Tumor necrosis factor-α stimulates lipolysis in differentiated human adipocytes through activation of extracellular signal-related kinase and elevation of intracellular cAMP. Diabetes 2002, 51, 2929–2935. [Google Scholar] [CrossRef]
  71. Feingold, K.R.; Doerrler, W.; Dinarello, C.A.; Fiers, W.; Grunfeld, C. Stimulation of lipolysis in cultured fat cells by tumor necrosis factor, interleukin-1, and the interferons is blocked by inhibition of prostaglandin synthesis. Endocrinology 1992, 130, 10–16. [Google Scholar] [CrossRef] [PubMed]
  72. Van Hall, G.; Steensberg, A.; Sacchetti, M.; Fischer, C.; Keller, C.; Schjerling, P.; Hiscock, N.; Møller, K.; Saltin, B.; Febbraio, M.A. Interleukin-6 stimulates lipolysis and fat oxidation in humans. J. Clin. Endocrinol. Metab. 2003, 88, 3005–3010. [Google Scholar] [CrossRef] [PubMed]
  73. Xu, Y.; Zhang, Y.; Ye, J. IL-6: A potential role in cardiac metabolic homeostasis. Int. J. Mol. Sci. 2018, 19, 2474. [Google Scholar] [CrossRef] [PubMed]
  74. Contreras, G.A.; Strieder-Barboza, C.; Raphael, W. Adipose tissue lipolysis and remodeling during the transition period of dairy cows. J. Anim. Sci. Biotechnol. 2017, 8, 41. [Google Scholar] [CrossRef]
  75. Nonogaki, K.; Fuller, G.M.; Fuentes, N.L.; Moser, A.H.; Staprans, I.; Grunfeld, C.; Feingold, K.R. Interleukin-6 stimulates hepatic triglyceride secretion in rats. Endocrinology 1995, 136, 2143–2149. [Google Scholar] [CrossRef]
  76. Ma, Y.; Gao, M.; Sun, H.; Liu, D. Interleukin-6 gene transfer reverses body weight gain and fatty liver in obese mice. Biochim. Biophys. Acta 2015, 1852, 1001–1011. [Google Scholar] [CrossRef]
  77. Han, J.; Meng, Q.; Shen, L.; Wu, G. Interleukin-6 induces fat loss in cancer cachexia by promoting white adipose tissue lipolysis and browning. Lipids Health Dis. 2018, 17, 14. [Google Scholar] [CrossRef]
  78. Mariman, E.C.; Wang, P. Adipocyte extracellular matrix composition, dynamics and role in obesity. Cell. Mol. Life Sci. 2010, 67, 1277–1292. [Google Scholar] [CrossRef]
  79. Adapala, V.J.; Adedokun, S.A.; Considine, R.V.; Ajuwon, K.M. Acute inflammation plays a limited role in the regulation of adipose tissue COL1A1 protein abundance. J. Nutr. Biochem. 2012, 23, 567–572. [Google Scholar] [CrossRef] [PubMed]
  80. San, J.; Du, Y.; Wu, G.; Xu, R.; Yang, J.; Hu, J. Transcriptome analysis identifies signaling pathways related to meat quality in broiler chickens–the extracellular matrix (ECM) receptor interaction signaling pathway. Poult. Sci. 2021, 100, 101135. [Google Scholar] [CrossRef] [PubMed]
  81. Lee, H.-J.; Jang, M.; Kim, H.; Kwak, W.; Park, W.; Hwang, J.Y.; Lee, C.-K.; Jang, G.W.; Park, M.N.; Kim, H.-C. Comparative transcriptome analysis of adipose tissues reveals that ECM-receptor interaction is involved in the depot-specific adipogenesis in cattle. PLoS ONE 2013, 8, e66267. [Google Scholar] [CrossRef]
  82. Rosso, F.; Giordano, A.; Barbarisi, M.; Barbarisi, A. From cell–ECM interactions to tissue engineering. J. Cell. Physiol. 2004, 199, 174–180. [Google Scholar] [CrossRef] [PubMed]
  83. Franchini, M.; Monnais, E.; Seboek, D.; Radimerski, T.; Zini, E.; Kaufmann, K.; Lutz, T.; Reusch, C.; Ackermann, M.; Muller, B. Insulin resistance and increased lipolysis in bone marrow derived adipocytes stimulated with agonists of Toll-like receptors. Horm. Metab. Res. 2010, 42, 703–709. [Google Scholar] [CrossRef]
  84. Suganami, T.; Tanimoto-Koyama, K.; Nishida, J.; Itoh, M.; Yuan, X.; Mizuarai, S.; Kotani, H.; Yamaoka, S.; Miyake, K.; Aoe, S. Role of the Toll-like receptor 4/NF-κB pathway in saturated fatty acid–induced inflammatory changes in the interaction between adipocytes and macrophages. Arterioscler. Thromb. Vasc. Biol. 2007, 27, 84–91. [Google Scholar] [CrossRef]
  85. Zu, L.; He, J.; Jiang, H.; Xu, C.; Pu, S.; Xu, G. Bacterial endotoxin stimulates adipose lipolysis via toll-like receptor 4 and extracellular signal-regulated kinase pathway. J. Biol. Chem. 2009, 284, 5915–5926. [Google Scholar] [CrossRef] [PubMed]
  86. Purohit, J.S.; Hu, P.; Chen, G.; Whelan, J.; Moustaid-Moussa, N.; Zhao, L. Activation of nucleotide oligomerization domain containing protein 1 induces lipolysis through NF-κB and the lipolytic PKA activation in 3T3-L1 adipocytes. Biochem. Cell Biol. 2013, 91, 428–434. [Google Scholar] [CrossRef] [PubMed]
  87. Ye, S.; Ding, Y.-F.; Jia, W.-H.; Liu, X.-L.; Feng, J.-Y.; Zhu, Q.; Cai, S.-L.; Yang, Y.-S.; Lu, Q.-Y.; Huang, X.-T. SET domain–containing protein 4 epigenetically controls breast cancer stem cell quiescence. Cancer Res. 2019, 79, 4729–4743. [Google Scholar] [CrossRef] [PubMed]
  88. Graja, A.; Garcia-Carrizo, F.; Jank, A.M.; Gohlke, S.; Ambrosi, T.H.; Jonas, W.; Ussar, S.; Kern, M.; Schürmann, A.; Aleksandrova, K. Loss of periostin occurs in aging adipose tissue of mice and its genetic ablation impairs adipose tissue lipid metabolism. Aging Cell 2018, 17, e12810. [Google Scholar] [CrossRef]
Figure 1. Flowchart of meta-analysis of the present study.
Animals 13 03475 g001
Figure 2. Top ten Kyoto Encyclopedia of Genes and Genomes (KEGG) pathways enriched by meta-genes.
Animals 13 03475 g002
Figure 3. Protein–protein interaction (PPI) network and functional module analysis of meta-genes.
Animals 13 03475 g003
Figure 4. Three meta-genes with attribute weighting above 0.8. A two-sample t-test was used for the mean comparisons.
Animals 13 03475 g004
Figure 5. Decision tree induced by the Random Forest algorithm with gain_ratio criterion and accuracy criterion in distinguishing the fat-tailed sheep breeds from the thin-tailed sheep breeds in three meta-genes with attribute weighting above 0.8.
Animals 13 03475 g005
Table 1. Summary information of three RNA-seq datasets sourced from sheep tail fat tissue.
GEO Accession NumberNumber of SamplesTissue SampleAge of Slaughter
(Month)
Read LengthReference
Thin-TailedFat-Tailed
PRJNA43266933Tail6150 bp[11]
PRJNA50820333Tail6150 bp[43]
PRJNA59858143Tail6150 bp[29]
Table 2. Top 10 Biological Process terms enriched by meta-genes.
Biological Process TermsAdjusted p-Value
Positive regulation of T cell cytokine production0.002
Extracellular matrix organization0.004
Stress-activated MAPK cascade0.008
ERK1 and ERK2 cascade0.008
Positive regulation of interleukin-10 production0.009
Positive regulation of interleukin-1 secretion0.016
Positive regulation of interleukin-6 production0.034
Positive regulation of interleukin-8 production0.036
Positive regulation of interferon-gamma (IFN)secretion0.04
Positive regulation of tumor necrosis factor (TNF) production0.04
Table 3. Top 10 out of the 136 meta-genes according to seven attribute weighting algorithms (AWs).
AttributeWeight_Info Gain RatioWeight_RuleWeight_Chi SquaredWeight_Gini IndexWeight_UncertaintyWeight_ReliefWeight_Info GainAverage_Weight
POSTN110.50.80.60.60.80.8
K350.80.90.60.60.710.60.8
SETD40.81.00.70.70.60.90.60.8
USP290.70.80.80.50.71.00.50.7
ANKRD370.70.90.80.50.70.90.50.7
ENSOARG000000014540.810.50.60.40.70.60.7
RTN20.710.60.50.60.80.50.7
PRG40.810.30.60.40.90.60.7
LRRC4C0.70.80.60.50.510.50.7
Table 4. Performances of machine learning models in the distinction of fat- and thin-tailed sheep breeds via ten-fold cross validation.
ModelAccuracy
Random Forest with accuracy criterion90% +/− 22.36%
Random Forest with gain_ratio criterion85% +/− 13.69%
Decision Tree with gain_ratio criterion58.33% +/− 37.27%
Decision Tree with accuracy criterion75% +/− 35.36%
Deep Learning with Tanh parameter85% +/− 22.36%
Deep Learning with Rectifier parameter75% +/− 25.00%
Deep Learning with Maxout parameter56.67% +/− 18.07%
Naïve Bayes78.33% +/− 21.73%
Disclaimer/Publisher’s Note: The statements, opinions and data contained in all publications are solely those of the individual author(s) and contributor(s) and not of MDPI and/or the editor(s). MDPI and/or the editor(s) disclaim responsibility for any injury to people or property resulting from any ideas, methods, instructions or products referred to in the content.

