Article

Effects of Protein Restriction and Subsequent Realimentation on Body Composition, Gut Microbiota and Metabolite Profiles in Weaned Piglets

1
Institute of Animal Nutrition, Northeast Agricultural University, Harbin 150030, China
2
Institute of Animal Science, Guangdong Academy of Agricultural Sciences, State Key Laboratory of Livestock and Poultry Breeding, Ministry of Agriculture Key Laboratory of Animal Nutrition and Feed Science in South China, Guangdong Provincial Key Laboratory of Animal Breeding and Nutrition, Maoming Branch, Guangdong Laboratory for Lingnan Modern Agriculture, Guangzhou 510640, China
*
Authors to whom correspondence should be addressed.
Animals 2021, 11(3), 686; https://doi.org/10.3390/ani11030686
Submission received: 3 January 2021 / Revised: 21 February 2021 / Accepted: 27 February 2021 / Published: 4 March 2021
(This article belongs to the Collection The Weaned Pig: Nutrition and Management)

Abstract

:

Simple Summary

Protein restriction strategies are often used in weaned piglets to reduce the incidence of intestinal disorders that are sensitive to dietary protein supply, but may lead to a decline in production performance. Subsequent protein realimentation can alleviate the detrimental effects of reduced dietary protein on growth. However, the effects of protein realimentation on the body composition, gut microbiota and metabolite profiles of piglets are poorly understood. The present study, combining comparative slaughter methods, microbiome and metabolome analyses, demonstrated that protein restriction and subsequent realimentation lead to compensatory growth and compensatory protein deposition in piglets, and contribute to animal intestinal health by altering the gut microbiota and metabolite profiles.

Abstract

The objective of this study was to evaluate the effects of protein restriction and subsequent protein realimentation on the body composition, gut microbiota and metabolite profiles of piglets. Fifty weaned piglets were randomly assigned to two treatments: a normal protein (NP) group (20% crude protein (CP)) or a low protein (LP) group (16% CP) with five animals per pen and five pens per group. Treatment diets were fed for 14 d during the protein restriction phase, and then all pigs were fed the same nursery diets with a normal CP level (19% CP) during the protein realimentation phase until they reached an average target body weight (BW) of 25 ± 0.15 kg. At day 14 and the end of the experiment, one piglet close to the average BW of each pen was slaughtered to determine body composition, microbial composition and microbial metabolites. Results showed that there was no difference (p > 0.05) in the experimental days to reach target BW between the LP and NP groups. The average daily gain (ADG) and gain:feed ratio (G:F) during the protein restriction phase as well as BW at day 14, were significantly decreased (p < 0.05) in the LP group compared with the NP group. However, there were no significant differences (p > 0.05) during the protein realimentation phase and the overall experiment. Similarly, piglets in the LP group showed a significantly decreased body protein content (p < 0.05) at day 14, but not (p > 0.05) at the end of the experiment. The relative abundance of Parabacteroides, Butyricicoccus, Olsenella, Succinivibrio and Pseudoramibacter were significantly increased (p < 0.05), while the relative abundance of Alloprevotella and Faecalicoccus were significantly decreased (p < 0.05) in the LP group at day 14. At the end of the experiment, the piglets in the LP group showed a higher (p < 0.05) colonic relative abundances of Parabacteroides, unidentified Christensenellaceae and Caproiciproducens, and a lower (p < 0.05) relative abundance of unidentified Prevotellaceae, Haemophilus, Marvinbryantia, Faecalibaculum, Neisseria and Dubosiella than those in the NP group. Metabolomics analyses indicated that tryptophan metabolism and vitamin metabolism were enriched in the LP group at day 14, and glycerophospholipid metabolism and fatty acid esters of hydroxy fatty acid metabolism were enriched at the end of the experiment. Moreover, Spearman’s correlation analysis demonstrated that the microbial composition was highly correlated with changes in colonic metabolites. Collectively, these results indicated that protein restriction and subsequent realimentation lead to compensatory growth and compensatory protein deposition in piglets and contribute to animal intestinal health by altering the gut microbiota and its metabolites.

1. Introduction

Weaning is a critical period in the life of a pig because it is often associated with a high incidence of intestinal disorders, such as post-weaning diarrhea, resulting in growth retardation or even death [1]. It is generally assumed that intestinal disorders of newly weaned piglets are sensitive to dietary crude protein (CP) intake, and the risk of intestinal disorders may be decreased by early protein restriction [2,3]. However, a deficient dietary CP supply can result in a reduction in piglet performance [4,5]. It has also been reported that animals can grow rapidly by being supplied with sufficient nutrients in the subsequent stage after previous malnutrition or artificial restriction, which is known as the concept of compensatory growth [6,7]. However, these studies were usually based on production traits such as body weight (BW) to evaluate treatment effects without considering carcass traits such as body composition. Protein nutrition is of paramount importance for muscle growth in pigs, especially in piglets, due to their tremendous capacity for rapid growth and body protein deposition [8]. Numerous studies have consistently reported that growing pigs and fattening pigs fed with low-protein diets had increased back-fat thickness and a reduced loin muscle area [9,10,11]. However, it is unclear whether protein restriction and subsequent protein realimentation have an effect on the body composition of piglets.
The gut microbiota plays an important role in regulating the digestion and absorption of nutrients and maintaining the homeostasis of the intestinal environment [12]. It has been reported that nutrient modulation alters host physiology and metabolism through interaction with the gut microbiota and numerous bioactive bacterial metabolites [13,14]. However, the effect of protein restriction and subsequent protein realimentation on gut microbiota and bacterial metabolites in weaned piglets remains unclear.
Therefore, the current study investigated the effects of protein restriction and subsequent protein realimentation on body composition, gut microbiota and microbial metabolites in piglets by using a comparative slaughter method, and a 16S rDNA sequencing strategy and combined this with the liquid chromatograph-mass spectrometry (LC-MS) technique.

2. Materials and Methods

The experimental protocols and procedures performed in this study were approved by the Animal Care and Use Committee at Guangdong Academy of Agricultural Sciences (authorization number GAASIAS-2016-017).

2.1. Animals and Experimental Design

Fifty weaned piglets (21 days of age; 6.39 ± 0.02 kg BW; Duroc × Landrace × Yorkshire) were randomly assigned to 2 treatments: a normal protein group (NP, 20% CP) or a low protein group (LP, 16% CP) with 5 animals per pen and 5 pens (3 pens with 3 barrows and 2 gilts, 2 pens with 2 barrows and 3 gilts) per group. Crystalline amino acids (AA) were supplemented to ensure that the amount of standardized ileal digestible (SID) AA to meet or exceed the National Research Council (NRC) recommendations [15]. Treatment diets were formulated to contain similar net energy (NE) contents and were fed to piglets for 14 d. After the restriction phase, all piglets were fed the same nursery diets with a normal CP level of 19% during the realimentation phase until they reached an average target BW of 25 ± 0.15 kg. Ingredient composition and nutrient composition of the diets are presented in Table 1.
Piglets were housed in a nursery facility (2.20 × 1.50 m2), which had a hard plastic fully slatted floor, a multi-hole stainless feeder, and a single bowl drinker. Pigs had free access to feed and water throughout the experiment period.

2.2. Sample Collection

Piglets were individually weighed at the beginning of the experiment and at the end of each period to calculate average daily gain (ADG), average daily feed intake (ADFI) and gain:feed ratio (G:F), and were checked daily for the occurrence of diarrhea during the experimental period. At day 14 of the experiment and the day when pigs had an average target BW of 25 ± 0.15 kg, after collecting blood samples from the anterior vena cava, one piglet close to the average BW of each pen (3 barrows and 2 gilts per group) was anesthetized with sodium pentobarbital and was slaughtered after an overnight fast. Serum from each sample was harvested by centrifugation at 3000× g for 15 min at 4 °C and then stored at −80 °C for further analysis. Slaughter procedures were performed according to the previous study [16]. The digesta from the colon was immediately collected and frozen in liquid nitrogen, and then stored at −80 °C for bacterial DNA isolation and metabolite analysis. In order to obtain the empty body of a piglet for body composition measurement, the remaining digesta from the stomach and intestines were washed, and the contents from the bladder and gallbladder were removed, then were then patted dry. All carcasses were stored at −20 °C until further processing. The frozen carcass was cut into small blocks in a double-shaft crusher (L-SP380, LiWill Co. Ltd., Zhengzhou, China), then ground in a grinder with an 18-mm die (SG-130, Yusheng Co., Xingtai, China) and finally ground using an ultrafine grinding mill (GN-130, Yusheng Co., Xingtai, China). The ground carcass was mixed in a mixer for homogenization, and then approximately 2.5 kg of subsample was taken for chemical analysis using a quartering procedure.

2.3. Chemical Analyses

The whole body carcass samples were analyzed in duplicate for dry matter, ash, CP and crude fat according to the methods of AOAC [17]. The CP content was estimated by multiplying the total nitrogen content determined using a Kjeltec 8400 analyzer (FOSS Analytical AB, höganäs, Sweden) by 6.25. Crude fat was determined using an automatic extractor analyzer (XT 15i, Ankom Technology Co., Macedon, NY, USA).

2.4. Serum Biochemical Parameters

Serum total protein, albumin, urea, glucose, triglyceride and creatinine were determined using a Selectra Pro XL automatic biochemical analyzer (Vital Scientific, Dieren, The Netherlands) and commercial kits (BioSino Bio-Technology & Science Inc., Beijing, China).

2.5. DNA Extraction and 16S rRNA Amplification

Total genome DNA from each sample of colonic digesta was extracted using the QIAamp PowerFecal DNA Kit (Qiagen, Hilden, Germany) according to the manufacturer’s protocol. The DNA concentration of each sample was quantified using a Nanodrop 2000 spectrophotometer (Thermo Fisher Scientific, Waltham, MA, USA). The V3-V4 region of all bacterial 16S rRNA genes were amplified with the universal forward primer 338F (50-ACTCCTRCGGGAGGCAGCAG-30) and the reverse primer 806R (50-GGACTACCVGGGTATCTAAT-30). Polymerase chain reaction (PCR) amplicons were purified using the Qiagen Gel Extraction Kit (Qiagen, Hilden, Germany) according to the manufacturer’s recommendations. Sequencing libraries were generated using TruSeq® DNA PCR-Free Sample Preparation Kit (Illumina, San Diego, CA, USA) following manufacturer’s recommendations and index codes were added. The library quality was then assessed on the Qubit@ 2.0 Fluorometer and Agilent Bioanalyzer 2100 system. Finally, the library was sequenced on an Illumina NovaSeq platform and 250 bp paired-end reads were generated. Bioinformatics analysis was performed as described previously [18].

2.6. Microbial Metabolite Analysis

The concentrations of short-chain fatty acids (SCFAs) from each sample in the colon were determined by gas chromatograph (7890B-7000D, Agilent Technologies, Santa Clara, CA, USA) according to the method described in a previous study [19]. Briefly, 0.1 g of colonic digesta was mixed with 2 mL of 25% metaphosphoric acid solution and vortexed to homogenize. The mixture was extracted with 2 mL diethyl ether for 10 min and then centrifuged at 4000× g for 10 min at 4 °C. The supernatant was put through a 0.22 μm filter and then injected for analysis. Helium was used as the carrier gas with a flow rate of 1mL/min without a spilt and the column HP-INNOWAX (25 m × 0.20 mm × 0.40 μm) was used to separate the composition. The column temperature was programmed as followed: the initial temperature was 100 °C held for 5min, then increased to 150 °C at 5 °C/min, and finally increased to 240 °C at 30 °C/min and held for 30 min. The transfer line and ion source temperature were kept at 250 °C and 200 °C, respectively. The detector was operated in an electron impact ionization mode (electron energy 70 eV) using a full scan and a single ion monitoring mode. In addition, an external standard calibration curve was used to determine the concentration of SCFAs in each sample.
To analyze the metabolite profiles, 0.1 g of colonic digesta was grounded with liquid nitrogen and the homogenate was resuspended with prechilled 80% methanol and 0.1% formic acid by well vortexing. The homogenate was incubated on ice for 5 min and then centrifuged at 15,000 rpm for 5 min at 4 °C. The supernatant was diluted with LC-MS grade water to a final concentration containing 53% methanol and was then centrifuged at 15,000× g for 10 min at 4 °C. Finally, the supernatant was injected into the LC-MS/MS system analysis. LC-MS/MS analyses were performed using a Vanquish UHPLC system (Thermo Fisher) coupled with an Orbitrap Q Exactive series mass spectrometer (Thermo Fisher). Samples were injected onto an Hypersil Gold column (100 × 2.1 mm2, 1.9 μm) using a 16-min linear gradient at a flow rate of 0.2 mL/min. The eluents for the positive polarity mode were eluent A (0.1% formic acid) and eluent B (methanol). The eluents for the negative polarity mode were eluent A (5 mM ammonium acetate, pH 9.0) and eluent B (methanol). The solvent gradient was set as follows: 2% B, 1.5 min; 2–100% B, 12.0 min; 100% B, 14.0 min; 100–2% B, 14.1 min; 2% B, 17 min. A Q Exactive series mass spectrometer was operated in positive/negative polarity mode with spray voltage of 3.2 kV, capillary temperature of 320 °C, sheath gas flow rate of 35 arb and aux gas flow rate of 10 arb. The raw UHPLC-MS/MS data files were processed using the Compound Discoverer 3.1 (CD3.1, Thermo Fisher Scientific Waltham, MA, USA) to perform peak alignment, peak picking, and quantitation for each metabolite. The main parameters were set as follows: retention time tolerance, 0.2 min; actual mass tolerance, 5 ppm; signal intensity tolerance, 30%; signal/noise ratio, 3; and minimum intensity, 100,000. After normalization to the total spectral intensity, the discriminated metabolites were selected based on variable importance in the projection (VIP) value from the partial least squares discriminant analysis (PLS-DA) using metaX. Metabolites with VIP > 1 and p < 0.05 and fold change (FC) ≥ 1.20 or ≤ 0.83 were considered statistically significant.

2.7. Statistical Analysis

Statistical analyses were performed using SAS 9.4 (SAS Institute Inc., Cary, NC, USA). Before comparing the differences between the groups, the normal distribution of the variables was assessed with the Shapiro–Wilk test. The variables accorded with normal distribution were analyzed by Student’s t-test, while those accorded with non-normal distribution were analyzed by Wilcoxon test. Statistical significance was declared at p < 0.05 and tendencies declared at 0.05 < p < 0.10. Data are presented as means ± SEM.

3. Results

3.1. Growth Performance

The ADG and G:F during the restriction phase as well as BW at day 14 were significantly decreased (p < 0.05) in the LP group compared with the NP group (Table 2). However, no significant differences (p > 0.05) were observed between the two groups for ADG and ADFI and G:F during the realimentation phase and the overall experiment. Besides, there was no difference (p > 0.05) in the experimental days to reach target BW between the two groups. Piglets in the LP group tended to have lower (p < 0.10) diarrhea incidence during the restriction phase and the whole experiment period.

3.2. Body Composition

Compared with the NP group, the LP group showed a significantly decreased body protein content (p < 0.05) at day 14, but not at the end of the experiment (Table 3). Piglets in the LP group showed a higher body lipid content both at day 14 and the end of the experiment than those in the NP group, but there was no statistical significance (p > 0.05). No differences (p > 0.05) were observed in the body water and ash content of piglets between the two groups at day 14 and the end of the experiment.

3.3. Serum Biochemical Parameters

At day 14, piglets in the LP group had lower (p < 0.05) concentrations of serum albumin and urea, and tended to have lower (p < 0.10) serum total protein concentration than those in the NP group (Table 4). At the end of the experiment, no differences (p > 0.05) were detected in serum biochemical parameters between the two groups.

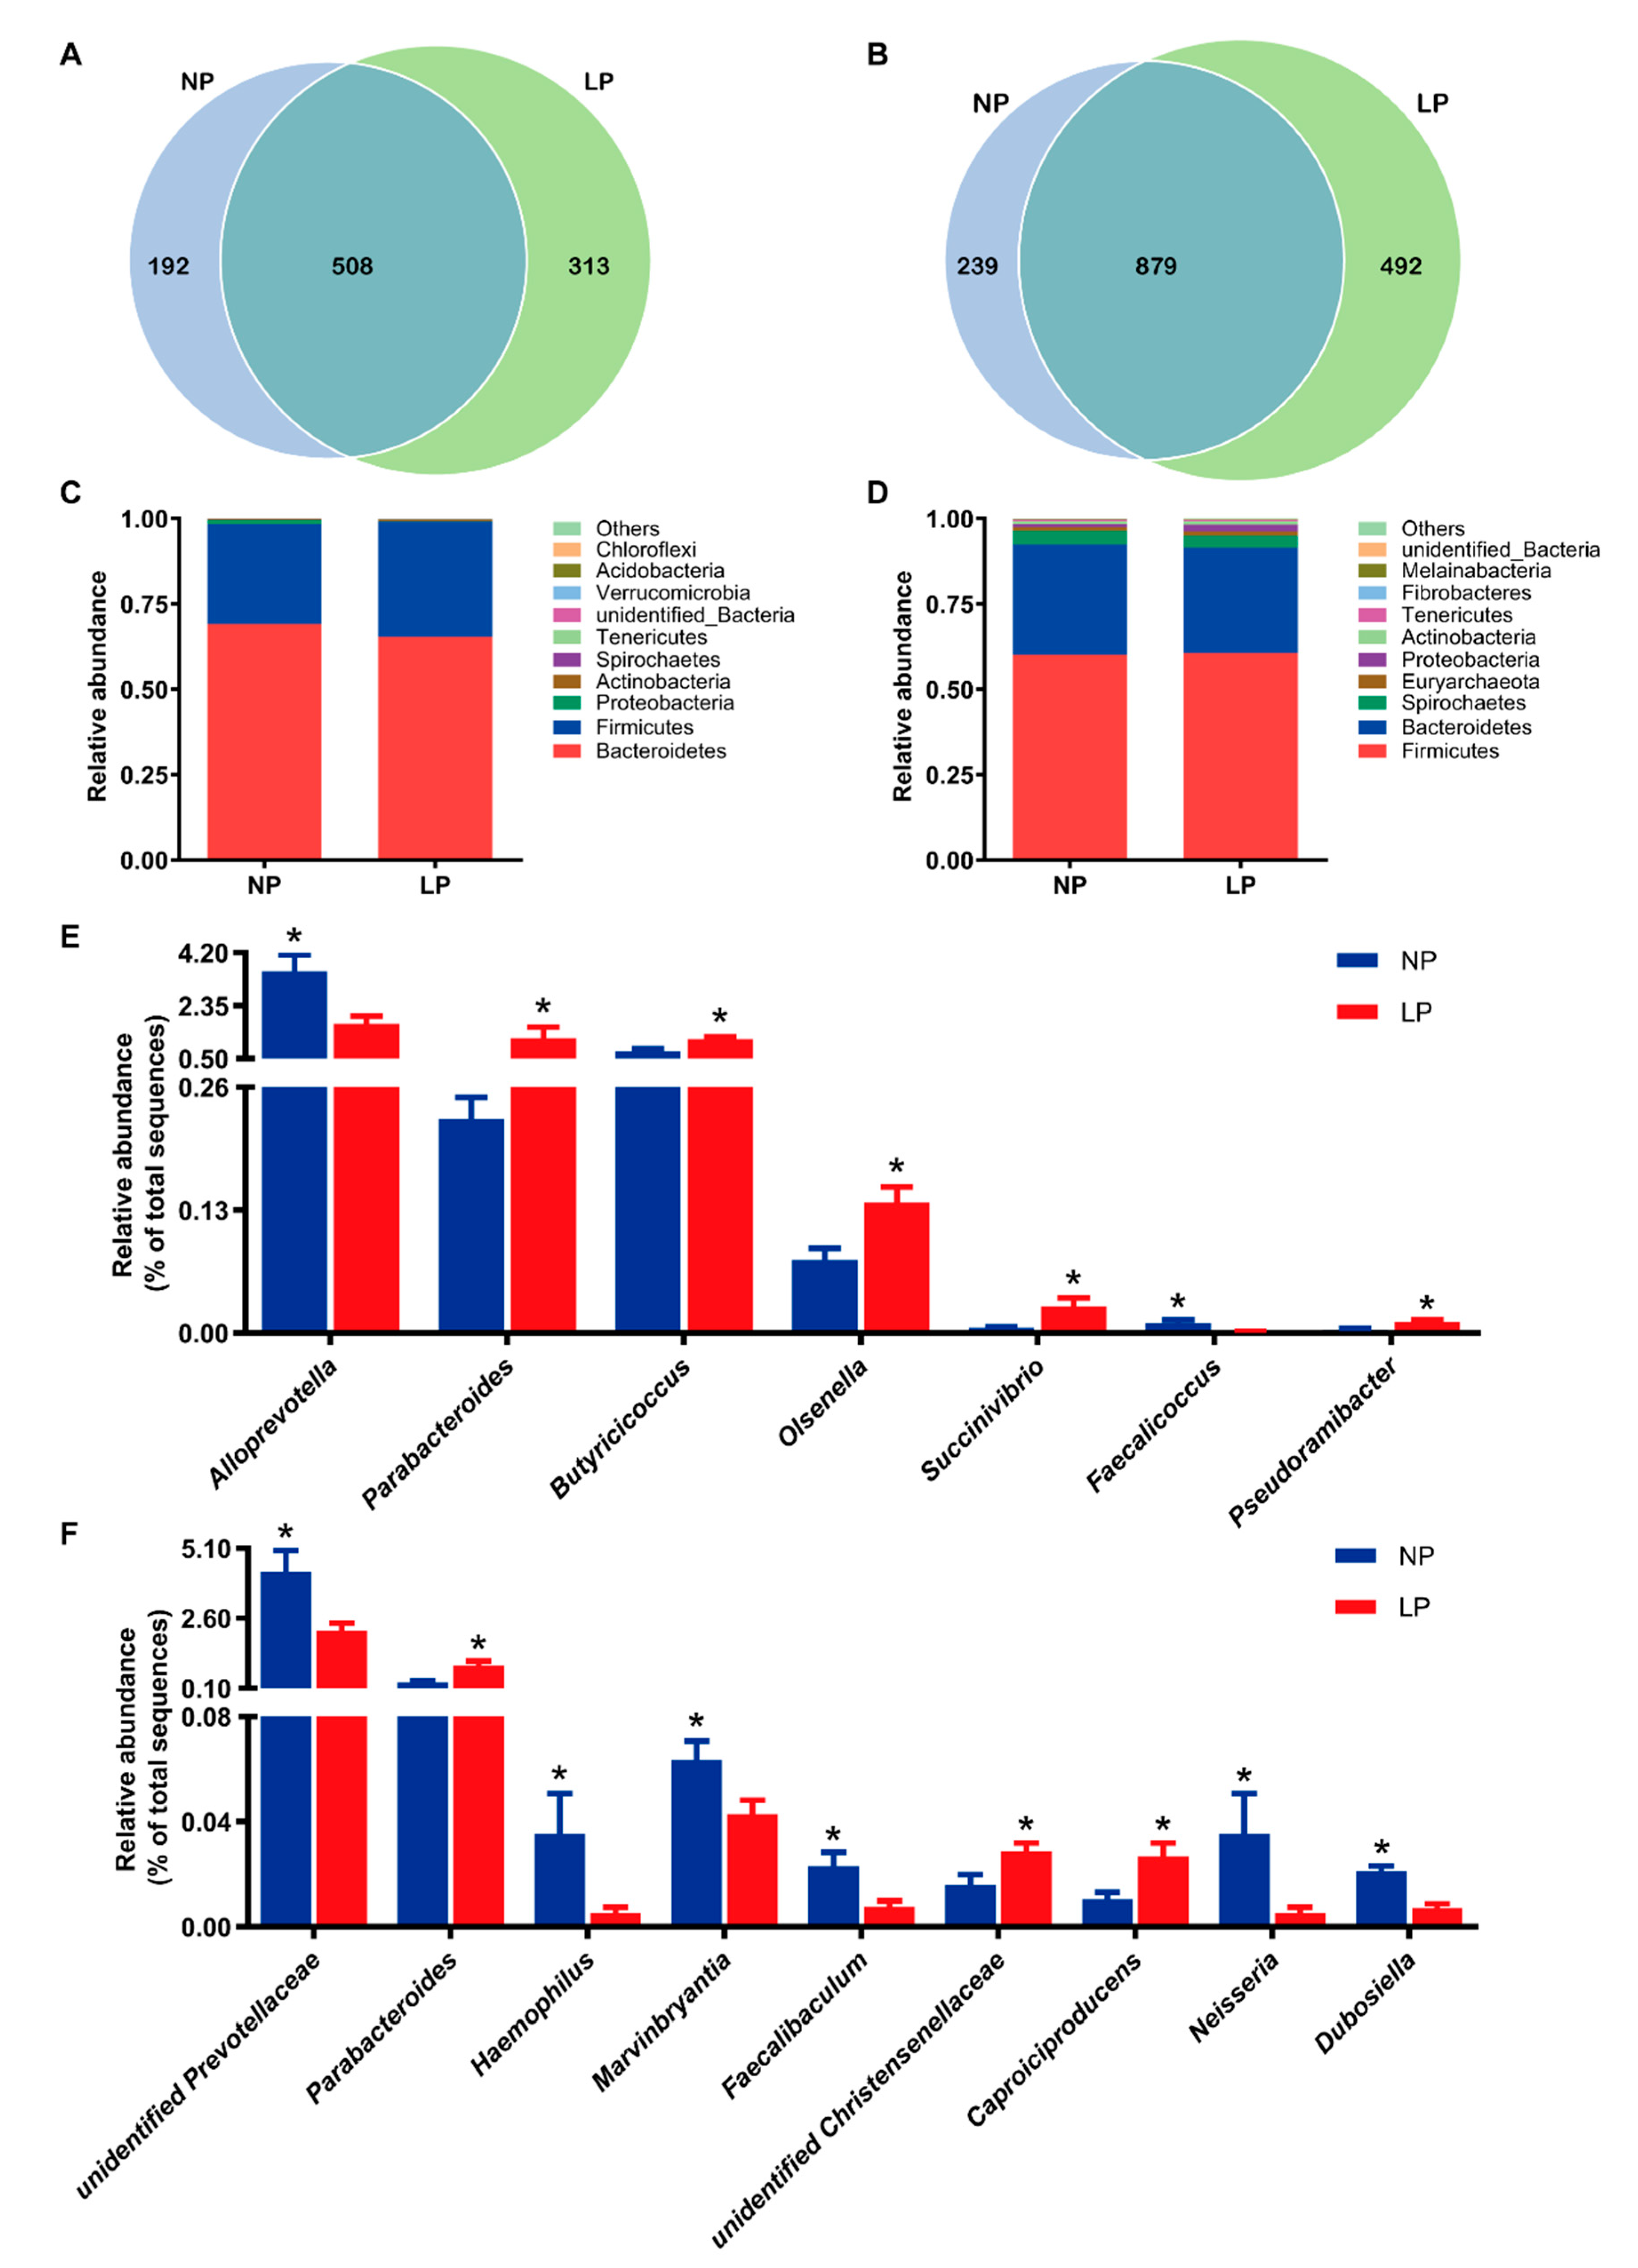
3.4. Colonic Bacterial Community Structure

Compared with the NP group, the LP group had higher observed species, ACE and Chao1 indexes, which were not statistically significant at day 14 (p > 0.05), but were statistically significant (p < 0.05) at the end of the experiment (Table 5).
At day 14, there were 192 and 313 unique operational taxonomic units (OUTs) in the NP and LP group, respectively, and a total of 508 shared OTUs in the two groups (Figure 1A). At the end of the experiment, 239 and 492 unique OTUs were identified in the NP and LP group, respectively, and 879 shared OTUs between the groups (Figure 1B). The composition of top 10 phylum at day 14 and the end of the experiment were shown in Figure 1C,D, respectively. Bacteroidetes and Firmicutes were the two dominant bacteria, accounting for 69.1 and 29.2% in the NP group, and 65.4 and 33.7% in the LP group at day 14, respectively, and accounting for 32.3 and 60.0% in the NP group, and 30.9 and 60.6% in the LP group at the end of the experiment, respectively. Compared with the NP group, increases in the ratio of Firmicutes to Bacteroidetes were observed in the LP group both at day 14 (0.52 and 0.43, respectively) and the end of the experiment (2.02 and 1.87, respectively), but was not statistically significant (p > 0.05). At the genus level, compared with the NP group, the relative abundance of Parabacteroides, Butyricicoccus, Olsenella, Succinivibrio and Pseudoramibacter were significantly increased (p < 0.05) in the LP group, and the relative abundance of Alloprevotella and Faecalicoccus were significantly decreased (p < 0.05) at day 14 (Figure 1E). At the end of the experiment, the piglets in the LP group showed a higher (p < 0.05) colonic relative abundances of Parabacteroides, unidentified Christensenellaceae and Caproiciproducens, and a lower (p < 0.05) relative abundance of unidentified Prevotellaceae, Haemophilus, Marvinbryantia, Faecalibaculum, Neisseria and Dubosiella than those in the NP group (Figure 1F).

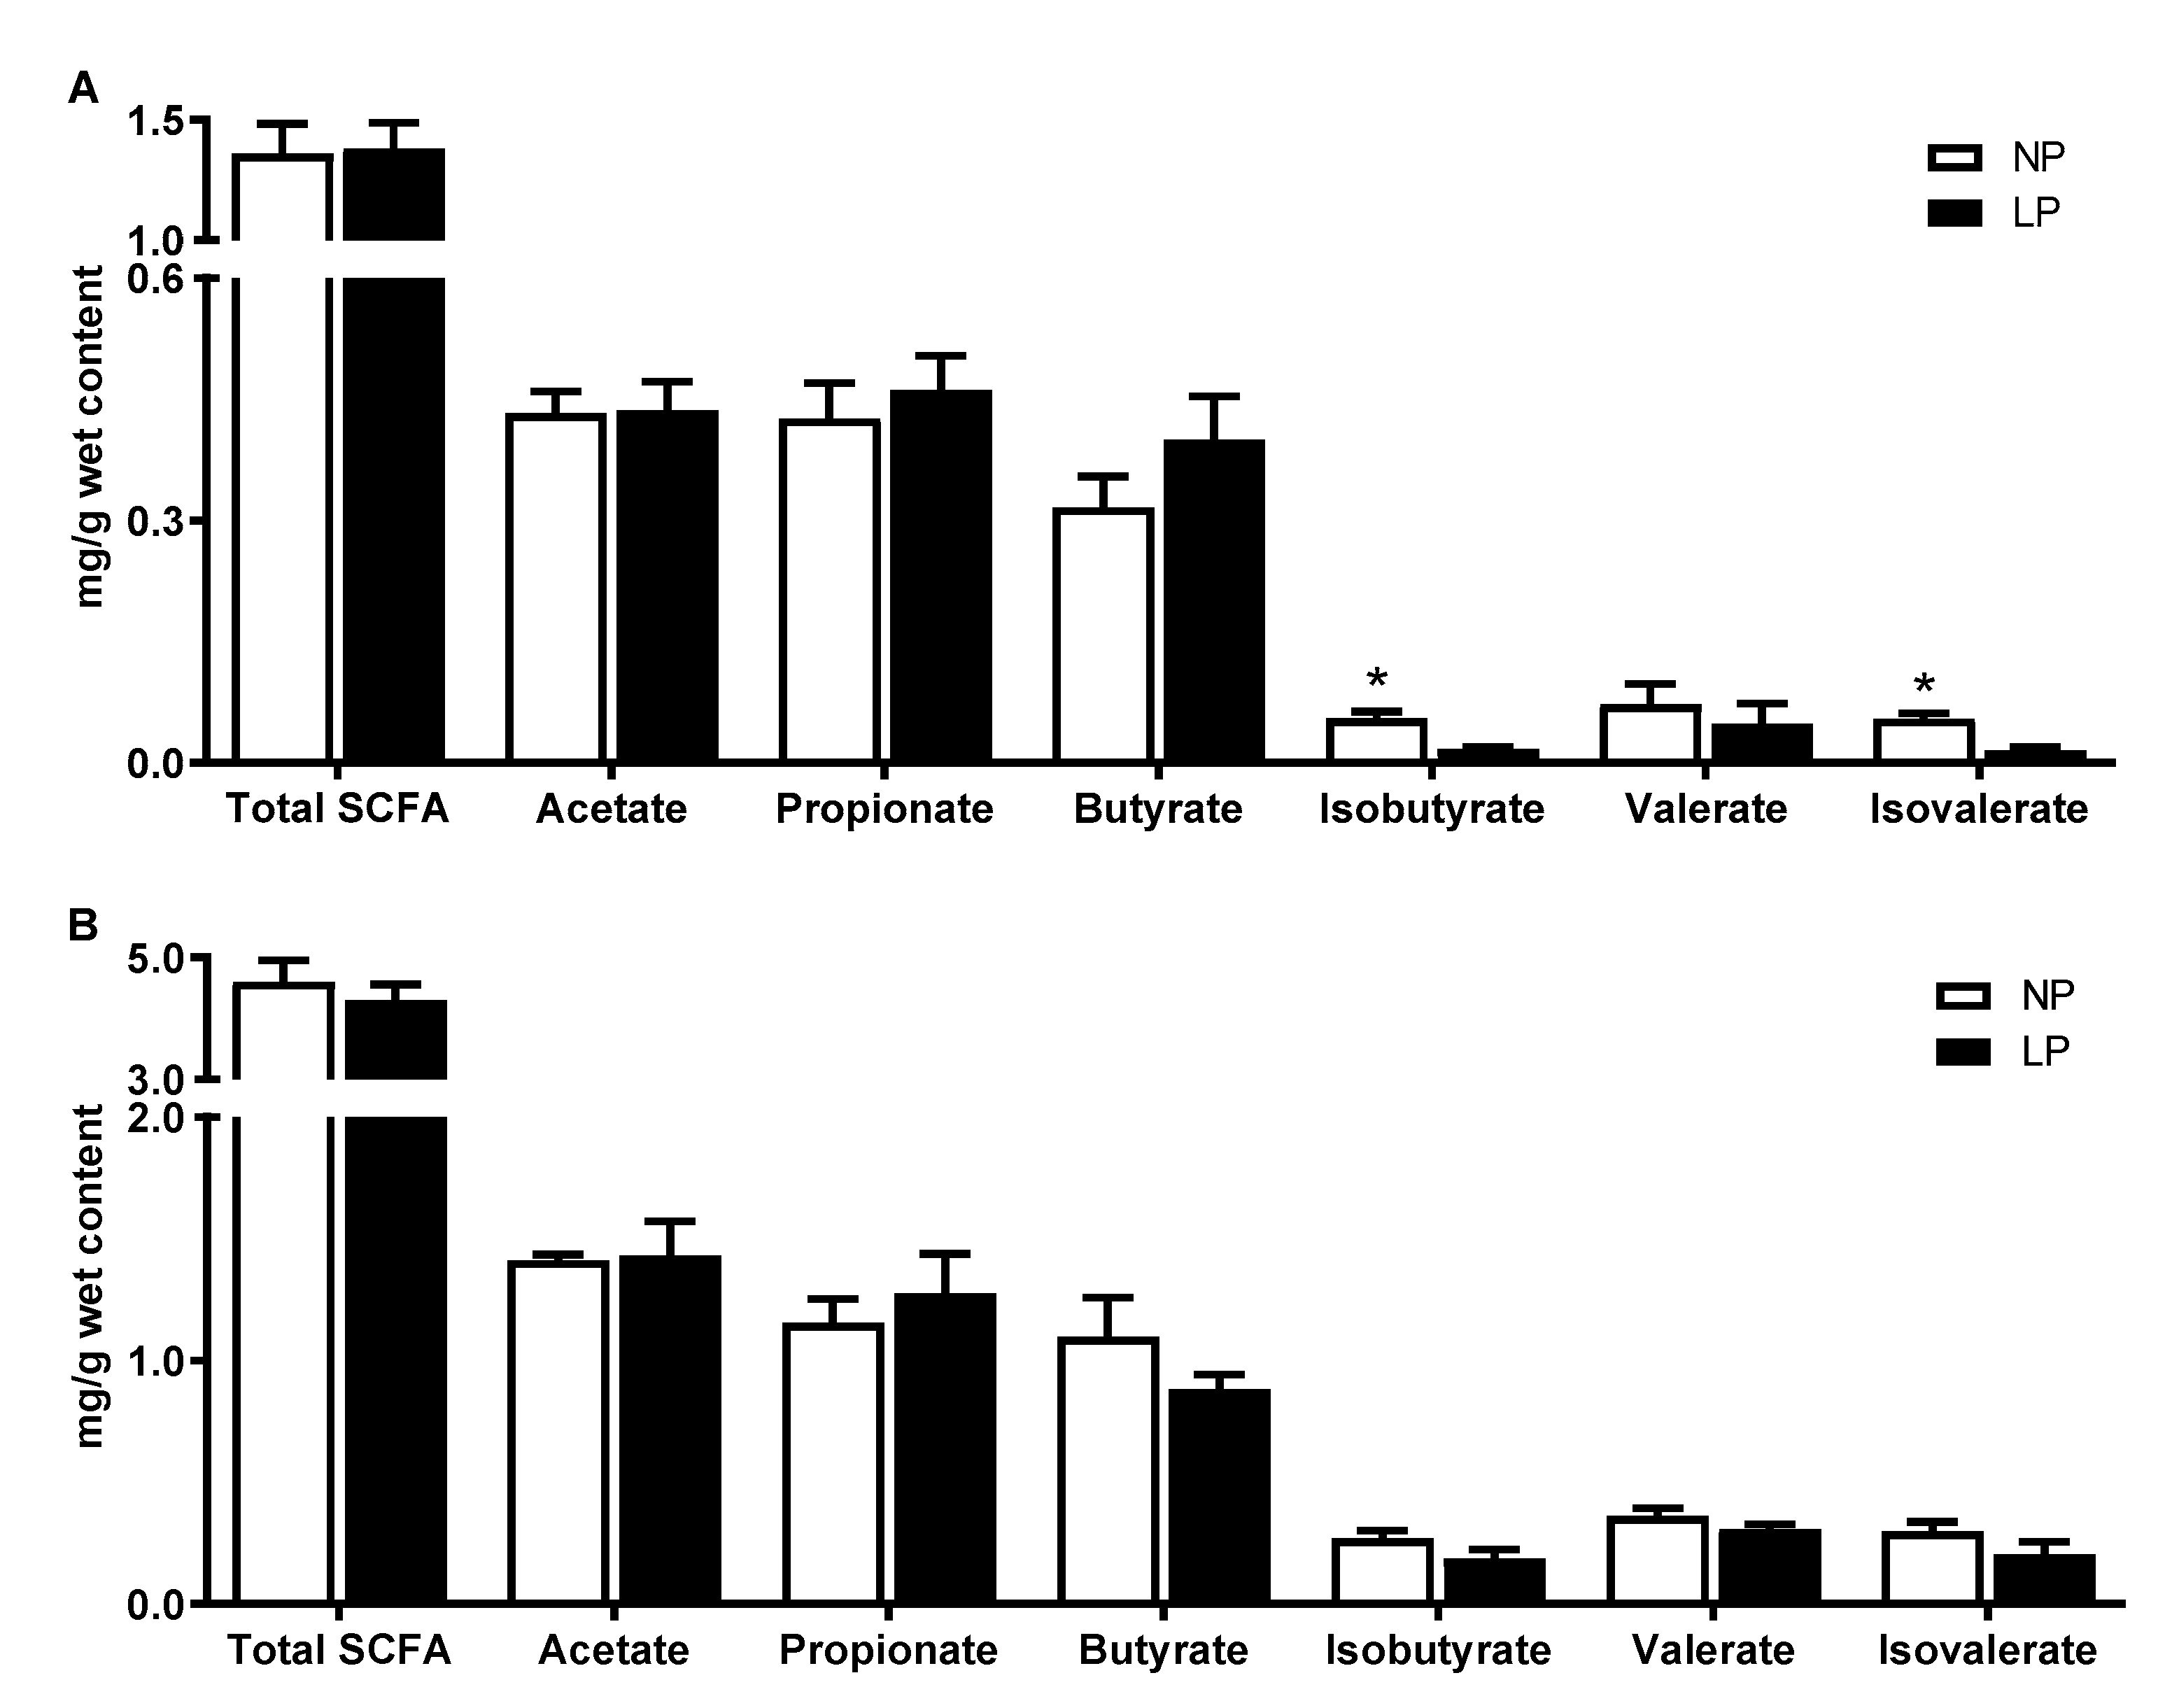
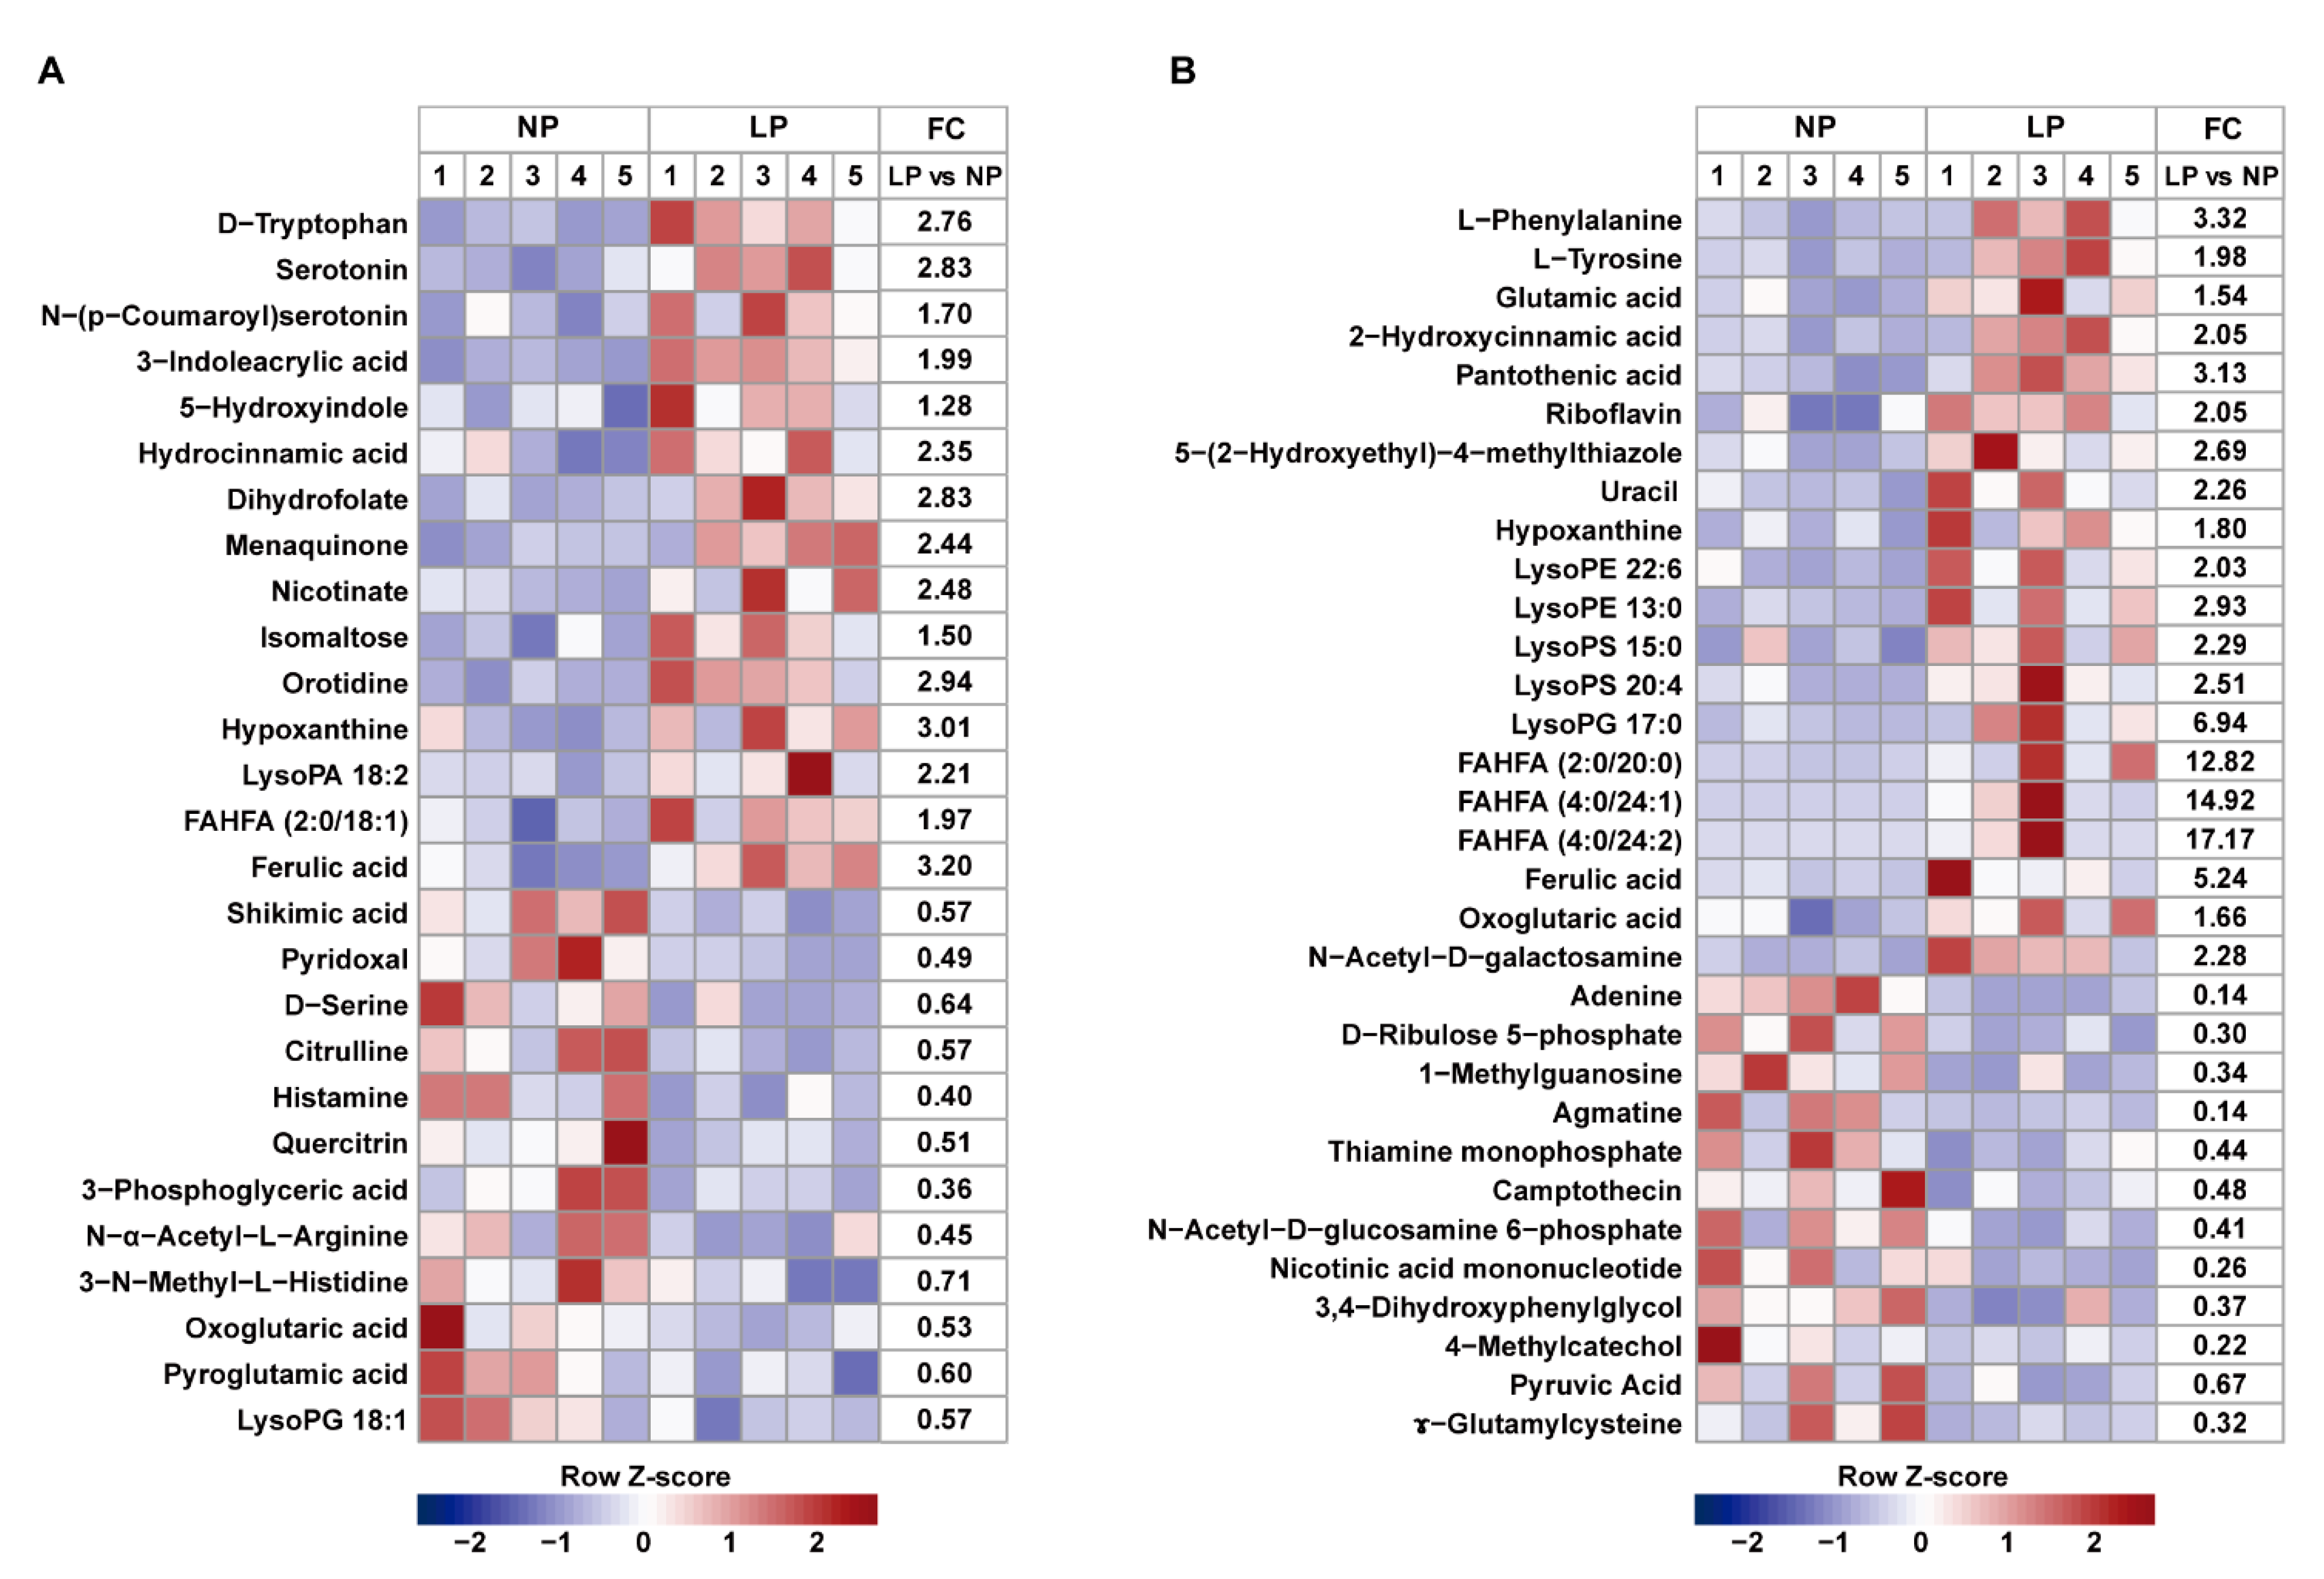
3.5. Metabolite Profiles in the Colonic Digesta

For SCFAs, at day 14, piglets in the LP group had lower (p < 0.05) isobutyrate and isovalerate concentrations compared with the NP group (Figure 2A). At the end of the experiment, the concentrations of SCFAs in colonic digesta did not show a significant statistical difference between the two groups (p > 0.05; Figure 2B).
Other metabolites in colonic digesta were further analyzed by LC-MS. At day 14 and the end of the experiment, 27 and 32 metabolites were identified with PLS-DA model VIP > 1 and p < 0.05 and fold change (FC) ≥ 1.20 or ≤0.83, respectively. These differentiated metabolites mainly included amino acids, lipids, carbohydrates, nucleotides, and others (Figure 3A,B). Compared with the NP group, there were 15 up-regulated metabolites and 12 down-regulated metabolites at day 14, and 20 up-regulated metabolites and 12 down-regulated metabolites at the end of the experiment in the LP group, respectively. Further metabolic pathways showed that during the protein restriction phase, the compounds involved in tryptophan metabolism, such as D-tryptophan, serotonin and 3-indoleacrylic acid, and the compounds involved in vitamin metabolism, such as dihydrofolate, menaquinone and nicotinate, were significantly increased, and the compounds involved in histidine metabolism, such as histamine and 3-N-methyl-L-histidine were significantly decreased in the LP group. During the protein realimentation phase, glycerophospholipid metabolism was mainly affected by LP diet, which was characterized by an increase in the concentrations of lysophosphatidylethanolamine (LysoPE 13:0 and LysoPE 22:6), lysophosphatidylserine (LysoPS 15:0 and LysoPS 20:4) and lysophosphatidylglycerol (LysoPG 17:0) compared with the NP diet. Fatty acid esters of hydroxy fatty acids (FAHFAs) metabolism was also altered, as reflected by the increased levels of FAHFA (2:0/20:0), FAHFA (4:0/24:1) and FAHFA (4:0/24:2) in the LP group.

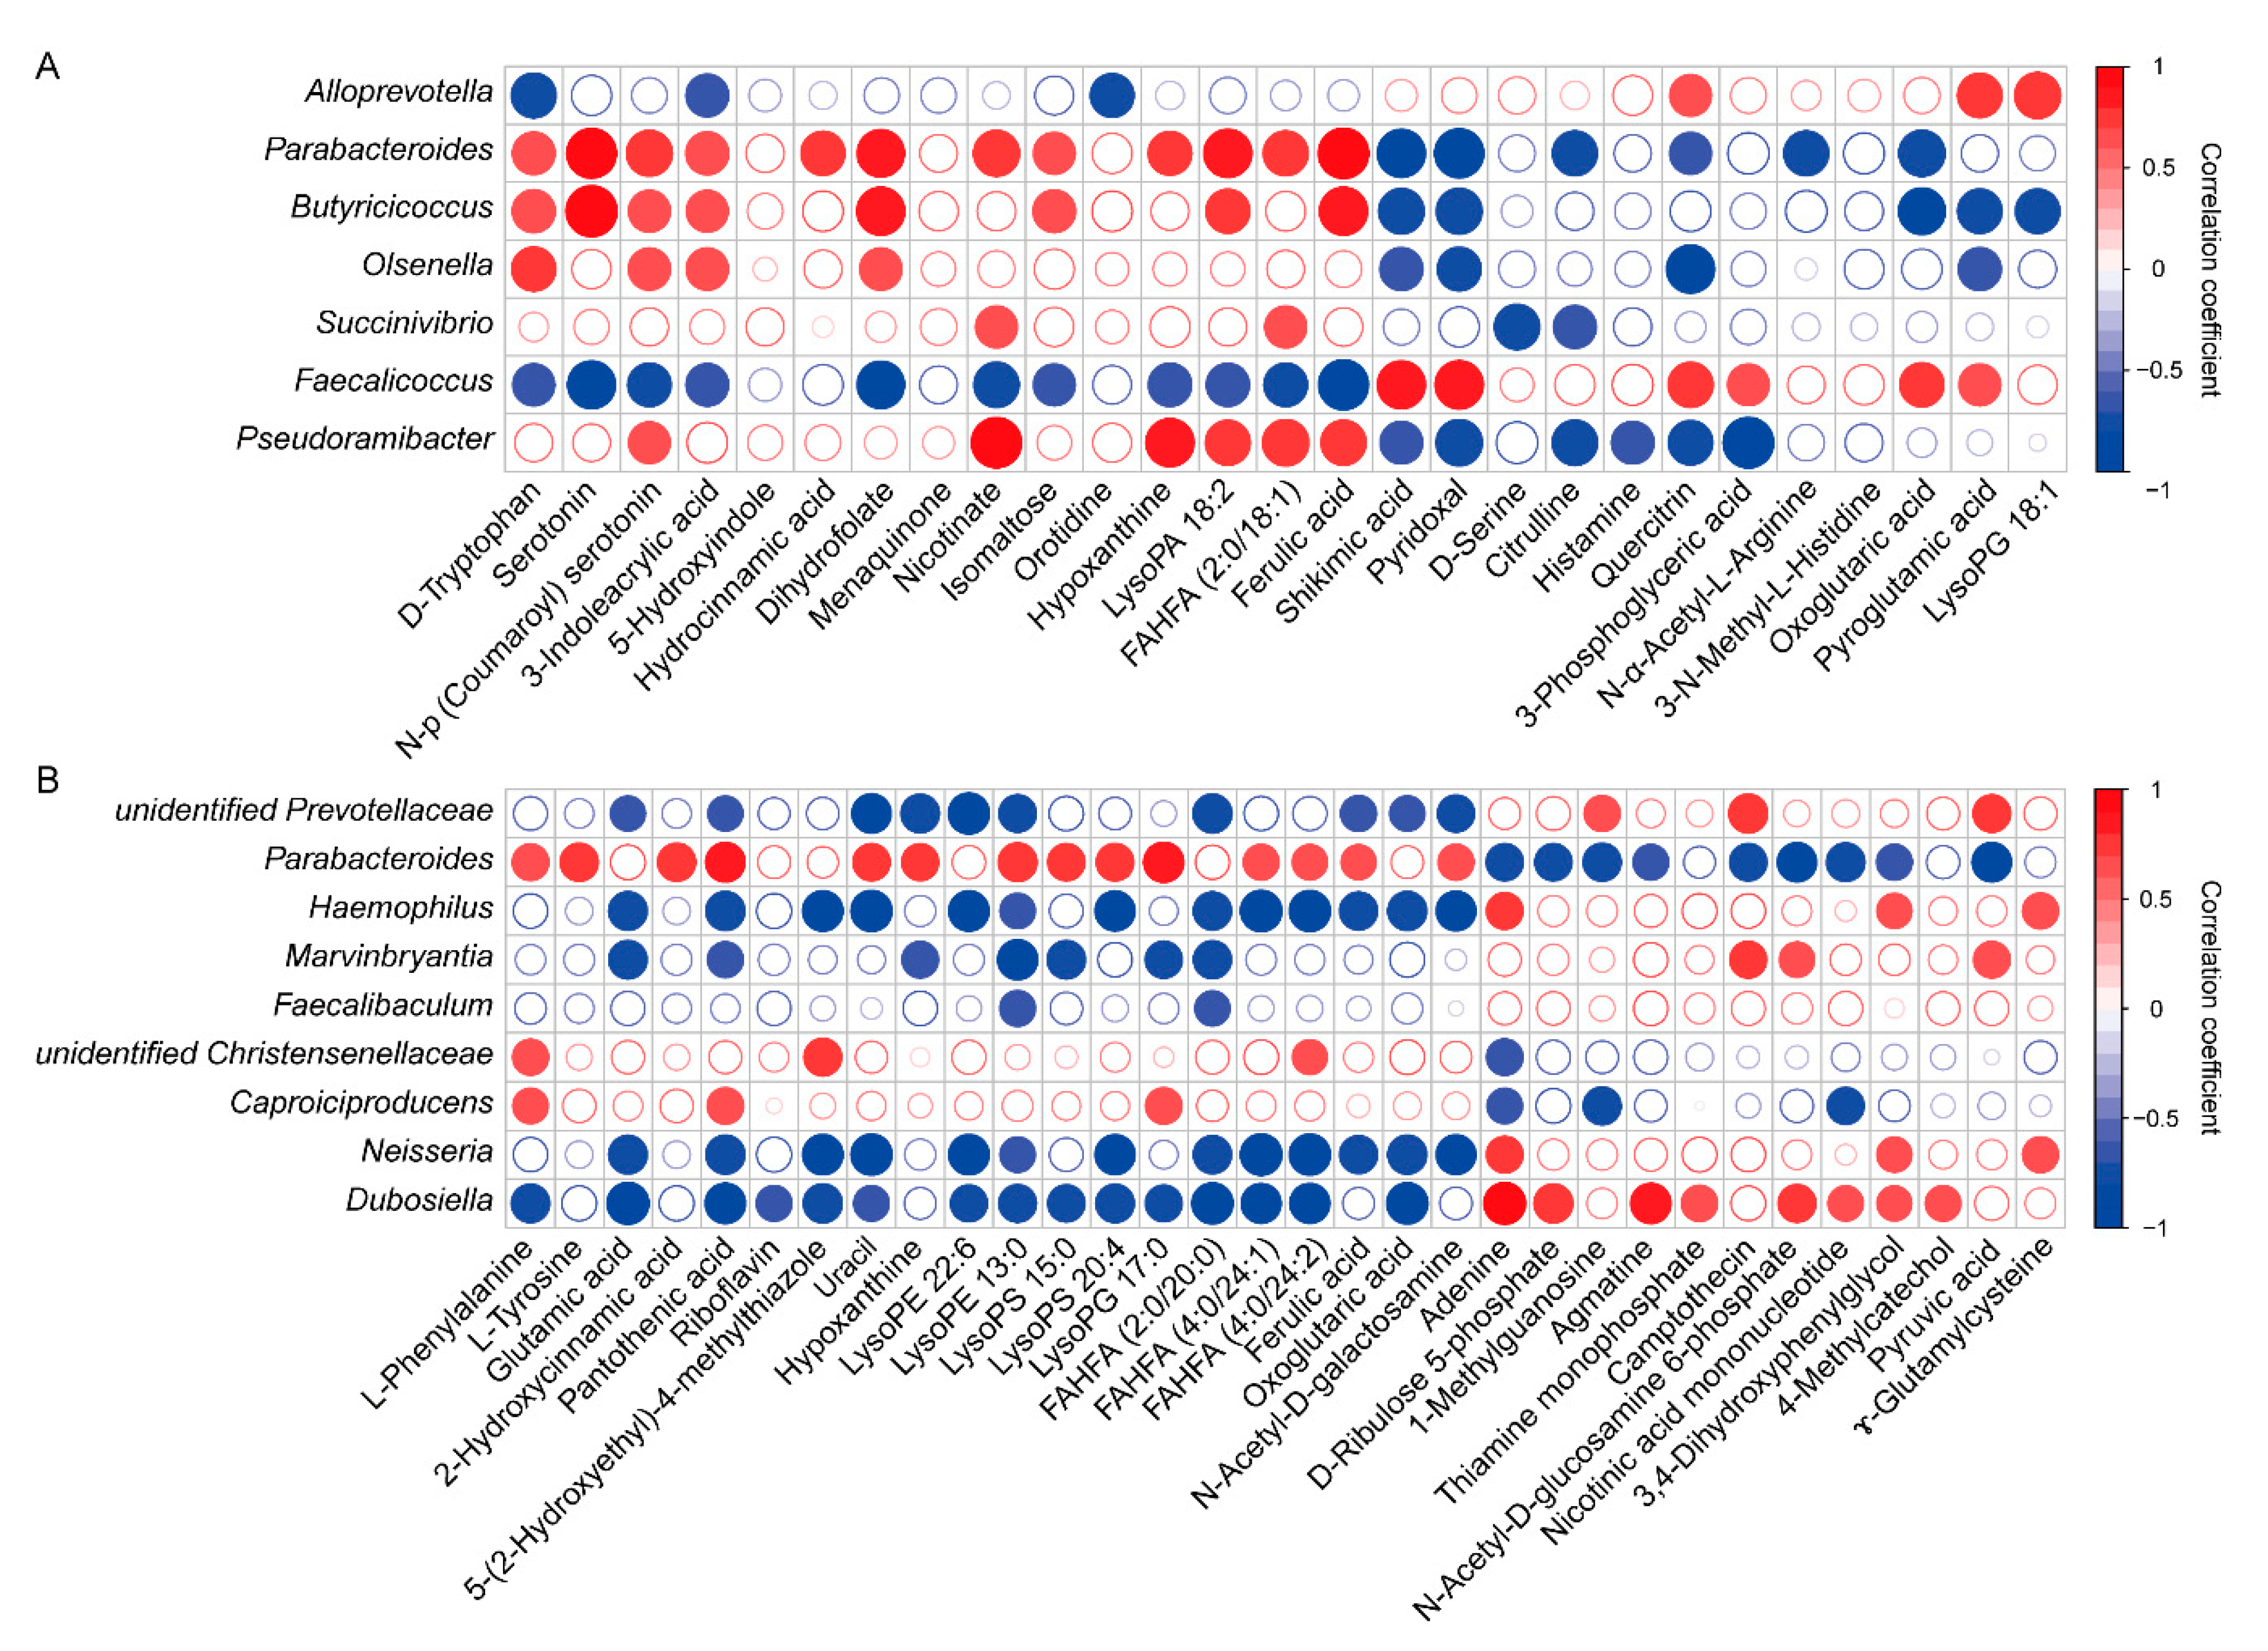
3.6. Correlation between Microbiota Community and Metabolites

A Spearman’s correlation analysis was used to explore the correlations between the colonic microbiota and their metabolite profiles (Figure 4A,B). The results showed that during the protein restriction phase, the relative abundances of Parabacteroides, Butyricicoccus and Olsenella were positively correlated with D-tryptophan, N-(p-coumaroyl) serotonin, 3-indoleacrylic acid and dihydrofolate, while they were negatively correlated with shikimic acid and pyridoxal. The relative abundances of Alloprevotella and Faecalicoccus had a negative correlation with D-tryptophan and 3-indoleacrylic acid, but a positive correlation with quercitrin and pyroglutamic acid. The concentrations of citrulline and histamine showed a negative correlation with the relative abundance of Pseudoramibacter. During the protein realimentation phase, the relative abundances of unidentified Prevotellaceae and Marvinbryantia were positively correlated with camptothecin and pyruvic acid, while they were negatively correlated with glutamic acid, pantothenic acid, hypoxanthine, LysoPE 13:0 and FAHFA (2:0/20:0). The relative abundances of Haemophilus, Neisseria and Dubosiella were positively correlated with adenine, 3,4-dihydroxyphenylglycol, while they were negatively correlated with glutamic acid, pantothenic acid, 5-(2-hydroxyethyl)-4-methylthiazole, uracil, LysoPE 22:6, LysoPE 13:0, LysoPS 20:4, FAHFA (2:0/20:0), FAHFA (4:0/24:1), FAHFA (4:0/24:2) and oxoglutaric acid. The relative abundances of Parabacteroides and Caproiciproducens were positively correlated with L-phenylalanine, pantothenic acid and LysoPG 17:0, while they were negatively correlated with adenine, 1-methylguanosine and nicotinic acid mononucleotide.

4. Discussion

It is generally assumed that protein restriction decreases the risk of post-weaning diarrhea, which may be due to the decrease of microbial fermentation of undigested protein in the gastrointestinal tract [20]. Kil and Stein [21] suggested that dietary CP levels in piglets should be reduced to below 18% during the immediate post-weaning period when in-feed antibiotic was not used. However, a deficient dietary CP supply can result in a reduction in piglet performance because CP supply is essential for animal growth and body protein deposition. Research has shown that protein restriction and subsequent realimentation can reduce diarrhea incidence in weaned piglets without negatively affecting their ultimate growth performance [6]. Similarly, in the present study, piglets in the LP group tended to have lower diarrhea incidence during the restriction phase and the whole experiment period. Compared with the NP group, the decreased growth performance of piglets in the LP group was observed during the restriction phase, but not during the protein realimentation phase and the overall experiment. Additionally, there was no difference in the experimental days to reach target BW between the LP and NP groups. Collectively, these results indicated that piglets in the LP group had a moderate ability for compensatory growth. It should be noted that the ability for compensatory gain depends upon the extent, timing and duration of nutrient restriction [22,23]. Piglets in the LP group had a lower body protein content in the protein restriction phase, which was consistent with other studies [24,25]. A reduction in dietary CP content suppressed protein synthesis in the liver, pancreas, kidney, and longissimus muscle of piglets, which may be due to decreased AA availability and inhibition of mammalian target of rapamycin signaling pathway [26]. However, no differences were observed in the chemical body composition at the end of the experiment between the LP and NP groups, indicating that the compensatory protein growth occurred. Similarly, previous studies found that nutritional history during the growing period had a compensatory effect on subsequent protein deposition during the finishing period [27,28].
Serum biochemical parameters reflect the body metabolism of piglets. An increase in serum total protein and albumin concentration was considered to be related to the age and rapid growth of piglets [29]. Serum urea can be used as an indicator to reflect the protein quality of diet and the nitrogen intake of animals and a response parameter to determine the protein requirement of animals [30]. Serum triglyceride concentration is a useful criterion for evaluating lipometabolic status [31]. Creatinine is the catabolite of creatine phosphate in muscles and can be used as a measure of muscle turnover [32]. In the present study, piglets in the LP group had lower urea concentrations that exhibited higher nitrogen utilization efficiency, which was consistent with previous studies [33,34]. However, there was no difference when the dietary CP level was adjusted to normal during the realimentation phase.
Gut microbiota and its fermentation metabolites play an important role in human and animal health. Diet is one of the main factors that affect the intestinal bacterial community [35]. In the present study, Firmicutes and Bacteroidetes constituted the two predominant phyla both at day 14 and the end of the experiment, which was consistent with another study [36]. In addition, age-related changes in the relative abundance of Firmicutes and Bacteroides were observed. As the animals aged, the relative abundance of Firmicutes increased, while the relative abundance of Bacteroidetes decreased. These changes in microbiome development were in agreement with other studies [37,38]. Evidence suggests that the increased ratio of Firmicutes to Bacteroidetes is an indicator of promoting lipid accumulation [39]. Compared with the NP group, increases in the ratio of Firmicutes to Bacteroidetes were observed in the LP group both at day 14 and the end of the experiment, which was consistent with the higher body lipid content in the LP group in these two phases, although the differences in these variables did not reach a significant level. In this study, we found that LP diet increased the relative abundance of several SCFA-producing bacteria including Parabacteroides, Butyricicoccus, Olsenella and Pseudoramibacter during the restriction phase, which can stimulate intestinal epithelial cells growth and protect the gut barrier [40,41,42]. The relative abundance of Succinivibrio was also significantly increased in the LP group, and Succinivibrio might be involved in starch, hemicellulose, and xylan degradation [43]. Meanwhile, piglets in the LP group had lower abundances of Alloprevotella and Faecalicoccus, which were considered as harmful bacteria. Previous studies showed that an increase in the abundance of Alloprevotella was associated with weight loss and inflammation [44,45,46]. Faecalicoccus was identified as an important feature to classify Crohn’s disease (a chronic and progressive inflammatory bowel disease) and healthy subjects, and its abundance in disease cohorts was significantly increased [47]. During the realimentation phase, the piglets in the LP group had higher abundances of beneficial bacteria such as Parabacteroides, unidentified Christensenellaceae and Caproiciproducens; however, they had lower harmful bacteria such as unidentified Prevotellaceae, Marvinbryantia, Neisseria and Dubosiella than those in the NP group. For example, Christensenellaceae is emerging as an important player in human health due to its role in protein and fiber fermentation [48]. Caproiciproducens is known as caproic acid-producing bacterium and its products can inhibit pathogenic bacteria and enhance animal immunity [49]. Evidence has shown that low fermentation of nitrogenous compounds can lead to a low abundance of Prevotellaceae [50]. Marvinbryantia is a pro-inflammatory bacterium with a negative correlation with antioxidant capacity [51,52]. Dorea is linked with gut inflammation, such as Crohn’s disease [53,54]. Neisseria, a Gram-negative aerobic cocci, can produce acids from diverse sugars and some of its species are pathogenic [55]. Dubosiella was associated with obesity-related microbial dysbiosis and was negatively associated with fecal SCFAs [56]. Collectively, these findings suggested that protein restriction and subsequent realimentation can lead to a healthier pattern of colonic bacterial community, which may be beneficial to the gut health of weaned piglets.
SCFA, mainly composed of acetate, propionate and butyrate, are the main products of carbohydrate fermentation by bacteria in the gut. SCFA not only has a trophic effect on intestinal epithelium, but also creates a slightly acidic environment to prevent the growth of acid-sensitive harmful bacteria such as pathogenic Salmonella and Escherichia coli [57]. As mentioned earlier, during the restriction phase, LP diet increased the relative abundance of several SCFA-producing bacteria such as Parabacteroides, Butyricicoccus and Olsenella, resulting in an increase in the concentrations of SCFA, but did not reach a significant level. Isobutyrate and isovalerate, as branched-chain fatty acids, originate exclusively from valine and leucine fermentation by gut microbiota, respectively, and can serve as a good marker of protein breakdown in the gut [58]. Piglets in the LP group had lower concentrations of isobutyrate and isovalerate in the colonic content during the restriction phase than those in the NP group, indicating that LP diet decreased the microbial fermentation of undigested protein in the gastrointestinal tract. Further metabolomics showed that LP diet mainly increased the compounds involved in tryptophan metabolism, such as D-tryptophan, serotonin, N-(p-Coumaroyl)serotonin, 3-indoleacrylic acid and 5-hydroxyindole in the restriction phase. These compounds are mainly produced by gut microbiota through the action of tryptophan hydroxylases and decarboxylases, or tryptophanases, and are beneficial to the regulation of host immune and metabolic homeostasis [59]. For example, D-tryptophan has been identified as an immunomodulatory probiotic substance that mediates Th2 cells to produce cytokines and chemokines, and promotes the proliferation of intestinal Treg cells [60]. Serotonin, an important gastrointestinal signaling molecule in the intestine, plays a beneficial role in establishing a healthy microenvironment in the intestine through modulation of cytokine levels [61]. Additionally, most of the indole derivatives are aryl hydrocarbon receptor (AhR) agonists, and AhR activation is essential for modulating metabolism and immune function [62]. The decreased concentrations of citrulline and histamine in the present study suggested that LP diet could prevent inflammatory response in the gastrointestinal tract [63,64]. During the protein realimentation phase, piglets in the LP group had increased concentrations of phenylalanine, tyrosine and glutamic acid. They are important precursors of neurotransmitters and signal transduction proteins and could participate in epithelial crosstalk and gut microbiota-mediated regulation of the host central nervous system [65]. A previous study indicated that one of the reasons for the weaning stress-induced gut microbiota dysbiosis might be due to the suppression of the phenylalanine metabolism, which then affected the piglet health through the microbiota–brain–gut axis [66]. It was also found that the compounds involved in glycerophospholipid metabolism and FAHFA metabolism were up-regulated in the LP group during the realimentation phase. Glycerophospholipids could strengthen the intestinal barrier and may have significant health implications at both enteric and somatic level [67,68,69]. FAHFAs, which are a novel class of endogenous bioactive lipids with health benefits and were first identified in mammalian white adipose tissue in 2014, are formed by esterification between the hydroxyl group of a hydroxy fatty acid and the carboxyl group of a fatty acid [70]. Among FAHFAs, the family of palmitic acid esters of hydroxy stearic acids (PAHSAs) are well studied, which have a wide range of anti-inflammatory and anti-diabetic effects [70,71,72]. In addition to PAHSAs, only a limited number of studies have focused on other FAHFAs [73]. Several previous studies have shown that polyunsaturated FAHFAs exert immunomodulatory effects [74,75]. Recently, several new short chain FAHFAs (SFAHFAs) of acetic acid or propanoic acid esterified long chain hydroxy fatty acids were identified in the large intestine of mice and levels of SFAHFAs tended to be decreased in mice fed with a high-fat diet compared with those fed with a normal diet [76]. Intestinal microbiota has been proposed to be an important endogenous source of vitamins, especially of the K and B groups [77]. In the present study, piglets in the LP group had higher concentrations of menadione, dihydrofolic acid and nicotinic acid at day 14, and pantothenic acid, riboflavin and 4-methyl-5-thiazoleethanol at the end of the experiment. From the host perspective, these compounds can act as vitamins with nutritional/physiological properties. In addition, they are known to play an important role in regulating immune homeostasis, which has been discussed in detail elsewhere [78,79,80]. Overall, these results indicated that the LP diet may have more metabolites that play a role in animal growth and gut health during the protein restriction and the subsequent realimentation phase.

5. Conclusions

The present study demonstrated that protein restriction and subsequent realimentation lead to compensatory growth and compensatory protein deposition in piglets, and contribute to animal intestinal health by altering the gut microbiota and metabolite profiles. These findings may provide new insights into the application of nutritional strategy to maintain animal and human gut health.

Author Contributions

Conceptualization, Z.J. and L.H.; methodology, L.W. and L.H.; software, Y.Q. and Y.X.; validation, X.W.; formal analysis, Z.L. and Z.W.; data curation, X.Y.; writing—original draft preparation, L.H.; writing—review and editing, Y.Q., H.X., and H.Y.; supervision, Z.J. and L.W. All authors have read and agreed to the published version of the manuscript.

Funding

This research was funded by National Key Research and Development Program of China (2018YFD0501100), Discipline team construction projects of the 13th Five-year Plan (R2018PY-JC001), the China Agriculture Research System (CARS-35), the Project of Swine Innovation Team in Guangdong Modern Agricultural Research System (2020KJ126), the Science and Technology Program of Guangdong Academy of Agricultural Sciences (202009JG).

Institutional Review Board Statement

The study was conducted according to the guidelines of the Declaration of Helsinki, and approved by the Animal Care and Use Committee of Guangdong Academy of Agricultural Sciences (authorization number GAASIAS-2016-017).

Informed Consent Statement

Not applicable.

Data Availability Statement

The data presented in this study are available on reasonable request from the corresponding author.

Conflicts of Interest

The authors declare no conflict of interest.

References

  1. Pluske, J.R.; Hampson, D.J.; Williams, I.H. Factors influencing the structure and function of the small intestine in the weaned pig: A review. Livest. Prod. Sci. 1997, 51, 215–236. [Google Scholar] [CrossRef]
  2. Wellock, I.J.; Fortomaris, P.D.; Houdijk, J.G.M.; Kyriazakis, I. The effect of dietary protein supply on the performance and risk of post-weaning enteric disorders in newly weaned pigs. Anim. Sci. 2006, 82, 327–335. [Google Scholar] [CrossRef]
  3. Wellock, I.J.; Fortomaris, P.D.; Houdijk, J.G.M.; Kyriazakis, I. Effects of dietary protein supply, weaning age and experimental enterotoxigenic Escherichia coli infection on newly weaned pigs: Health. Animal 2008, 2, 834–842. [Google Scholar] [CrossRef]
  4. Nyachoti, C.M.; Omogbenigun, F.O.; Rademacher, M.; Blank, G. Performance responses and indicators of gastrointestinal health in early-weaned pigs fed low-protein amino acid-supplemented diets. J. Anim. Sci. 2006, 84, 125–134. [Google Scholar] [CrossRef]
  5. Yu, D.; Zhu, W.; Hang, S. Effects of Long-Term Dietary Protein Restriction on Intestinal Morphology, Digestive Enzymes, Gut Hormones, and Colonic Microbiota in Pigs. Animals 2019, 9, 180. [Google Scholar] [CrossRef] [PubMed] [Green Version]
  6. Shi, Q.; Zhu, Y.; Wang, J.; Yang, H.; Wang, J.; Zhu, W. Protein restriction and succedent realimentation affecting ileal morphology, ileal microbial composition and metabolites in weaned piglets. Animal 2019, 13, 2463–2472. [Google Scholar] [CrossRef] [PubMed]
  7. Zhao, X.; Fu, H.Y.; Qiu, S.N.; Teng, T.; Bai, G.D.; Ju, D.X.; Sun, Y.C.; Shi, B.M. Effects of early protein restriction on the growth performance and gut development of pigs fed diets with or without antibiotic. Animal 2020, 14, 1392–1401. [Google Scholar] [CrossRef] [PubMed]
  8. Pluske, J.R.; Dividich, J.L.; Verstegen, M.W.A. Weaning the Pig: Concepts and Consequences; Wageningen Academic Publishers: Wageningen, The Netherlands, 2003. [Google Scholar]
  9. Hinson, R.; Schinckel, A.; Radcliffe, J.; Allee, G.; Sutton, A.; Richert, B. Effect of feeding reduced crude protein and phosphorus diets on weaning-finishing pig growth performance, carcass characteristics, and bone characteristics. J. Anim. Sci. 2008, 87, 1502–1517. [Google Scholar] [CrossRef] [Green Version]
  10. Smith, J.W.; O’Quinn, P.R.; Goodband, R.D.; Tokach, M.D.; Nelssen, J.L. Effects of Low-Protein, Amino Acid-Fortified Diets Formulated on a Net Energy Basis on Growth Performance and Carcass Characteristics of Finishing Pigs. J. Appl. Anim. Res. 1999, 15, 1–16. [Google Scholar] [CrossRef] [Green Version]
  11. Morazán, H.; Alvarez-Rodriguez, J.; Seradj, A.R.; Balcells, J.; Babot, D. Trade-offs among growth performance, nutrient digestion and carcass traits when feeding low protein and/or high neutral-detergent fiber diets to growing-finishing pigs. Anim. Feed Sci. Technol. 2015, 207, 168–180. [Google Scholar] [CrossRef]
  12. Qiu, Y.; Liu, S.; Hou, L.; Li, K.; Wang, L.; Gao, K.; Yang, X.; Jiang, Z. Supplemental Choline Modulates Growth Performance and Gut Inflammation by Altering the Gut Microbiota and Lipid Metabolism in Weaned Piglets. J. Nutr. 2021, 151, 20–29. [Google Scholar] [CrossRef] [PubMed]
  13. Yin, J.; Li, Y.; Han, H.; Liu, Z.J.; Zeng, X.; Li, T.; Yin, Y. Long-Term Effects of Lysine Concentration on Growth Performance, Intestinal Microbiome, and Metabolic Profiles in a Pig model. Food Funct. 2018, 9, 4153–4163. [Google Scholar] [CrossRef] [PubMed]
  14. Yu, M.; Li, Z.; Chen, W.; Rong, T.; Wang, G.; Ma, X. Microbiome-Metabolomics Analysis Investigating the Impacts of Dietary Starch Types on the Composition and Metabolism of Colonic Microbiota in Finishing Pigs. Front. Microbiol. 2019, 10, 1143. [Google Scholar] [CrossRef] [Green Version]
  15. NRC. Nutrient Requirements of Swine, 11th ed.; National Academies Press: Washington, DC, USA, 2012. [Google Scholar]
  16. Jones, C.K.; Gabler, N.K.; Main, R.G.; Patience, J.F. Characterizing growth and carcass composition differences in pigs with varying weaning weights and postweaning performance. J. Anim. Sci. 2012, 90, 4072–4080. [Google Scholar] [CrossRef] [Green Version]
  17. AOAC. Official Methods of Analysis, 17th ed.; Association of Official Analytical Chemists: Arlington, VA, USA, 2000. [Google Scholar]
  18. Xiong, Y.; Yi, H.; Wu, Q.; Jiang, Z.; Wang, L. Effects of acute heat stress on intestinal microbiota in grow-finishing pigs, and associations with feed intake and serum profile. J. Appl. Microbiol. 2020, 128, 840–852. [Google Scholar] [CrossRef]
  19. Sun, Z.; Li, J.; Dai, Y.; Wang, W.; Shi, R.; Wang, Z.; Ding, P.; Lu, Q.; Jiang, H.; Pei, W.; et al. Indigo Naturalis Alleviates Dextran Sulfate Sodium-Induced Colitis in Rats via Altering Gut Microbiota. Front. Microbiol. 2020, 11, 731. [Google Scholar] [CrossRef] [PubMed]
  20. Heo, J.M.; Kim, J.C.; Hansen, C.F.; Mullan, B.P.; Hampson, D.J.; Pluske, J.R. Feeding a diet with decreased protein content reduces indices of protein fermentation and the incidence of postweaning diarrhea in weaned pigs challenged with an enterotoxigenic strain of Escherichia coli. J. Anim. Sci. 2009, 87, 2833–2843. [Google Scholar] [CrossRef] [Green Version]
  21. Kil, D.Y.; Stein, H.H. Invited Review: Management and feeding strategies to ameliorate the impact of removing antibiotic growth promoters from diets fed to weanling pigs. Can. J. Anim. Sci. 2010, 90, 447–460. [Google Scholar] [CrossRef]
  22. Chaosap, C.; Parr, T.; Wiseman, J. Effect of compensatory growth on performance, carcass composition and plasma IGF-1 in grower finisher pigs. Animal 2011, 5, 749–756. [Google Scholar] [CrossRef] [PubMed] [Green Version]
  23. Lebret, B.; Heyer, A.; Gondret, F.; Louveau, I. The response of various muscle types to a restriction -re-alimentation feeding strategy in growing pigs. Animal 2007, 1, 849–857. [Google Scholar] [CrossRef] [Green Version]
  24. Conde-Aguilera, J.; Aguinaga, M.A.; Lara, L.; Aguilera, J.; Nieto, R. Carcass traits and organ weights of 10–25-kg body weight Iberian pigs fed diets with different protein-to-energy ratio. Anim. Feed Sci. Technol. 2011, 164, 116–124. [Google Scholar] [CrossRef]
  25. Ruiz-Ascacibar, I.; Stoll, P.; Kreuzer, M.; Boillat, V.; Spring, P.; Bee, G. Impact of amino acid and CP restriction from 20 to 140 kg BW on performance and dynamics in empty body protein and lipid deposition of entire male, castrated and female pigs. Animal 2016, 11, 394–404. [Google Scholar] [CrossRef] [PubMed] [Green Version]
  26. Deng, D.; Yao, K.; Chu, W.; Li, T.; Huang, R.; Yin, Y.; Liu, Z.; Zhang, J.; Wu, G. Impaired translation initiation activation and reduced protein synthesis in weaned piglets fed a low-protein diet. J. Nutr. Biochem. 2009, 20, 544–552. [Google Scholar] [CrossRef]
  27. Drouillard, J.; Britton, R.; Bauer, M.; Gramlich, S.; Wester, T.; Ferrell, C. Growth, body composition, and visceral organ mass and metabolism in lambs during and after metabolizable protein or net energy restrictions. J. Anim. Sci. 1991, 69, 3357–3375. [Google Scholar] [CrossRef] [PubMed] [Green Version]
  28. Bikker, P.; Verstegen, M.; Kemp, B.; Bosch, M. Performance and Body Composition of Finishing Gilts (45 to 85 Kilograms) as Affected by Energy Intake and Nutrition in Earlier Life: I. Growth of the Body and Body Components. J. Anim. Sci. 1996, 74, 806–816. [Google Scholar] [CrossRef] [Green Version]
  29. de Meer, K.; Smolders, H.C.; Meesterburrie, J.; de Sain-van der Velden, M.; Voorbij, H.A.; Okken, A.; Reijngoud, D.J.; Kulik, W. A single food bolus stimulates albumin synthesis in growing piglets. J. Pediatr. Gastroenterol. Nutr. 2000, 31, 251–257. [Google Scholar] [CrossRef] [PubMed]
  30. Pedersen, C.; Boisen, S. Studies on the Response Time for Plasma Urea Nitrogen as a Rapid Measure for Dietary Protein Quality in Pigs. Acta Agric. Scand. A Anim. 2001, 51, 209–216. [Google Scholar] [CrossRef]
  31. Wang, J.H.; Wu, C.C.; Feng, J. Effect of dietary antibacterial peptide and zinc-methionine on performance and serum biochemical parameters in piglets. Czech J. Anim. Sci. 2011, 56, 30–36. [Google Scholar] [CrossRef] [Green Version]
  32. Millet, S.; Aluwe, M.; De Boever, J.; De Witte, B.; Douidah, L.; Van den Broeke, A.; Leen, F.; De Cuyper, C.; Ampe, B.; De Campeneere, S. The effect of crude protein reduction on performance and nitrogen metabolism in piglets (four to nine weeks of age) fed two dietary lysine levels. J. Anim. Sci. 2018, 96, 3824–3836. [Google Scholar] [CrossRef]
  33. Wu, Y.; Jiang, Z.; Zheng, C.; Wang, L.; Zhu, C.; Yang, X.; Wen, X.; Ma, X. Effects of protein sources and levels in antibiotic-free diets on diarrhea, intestinal morphology, and expression of tight junctions in weaned piglets. Anim. Nutr. 2015, 1, 170–176. [Google Scholar] [CrossRef]
  34. Fang, L.H.; Jin, Y.H.; Do, S.H.; Hong, J.S.; Kim, B.O.; Han, T.H.; Kim, Y.Y. Effects of dietary energy and crude protein levels on growth performance, blood profiles, and nutrient digestibility in weaning pigs. Asian-Australas. J. Anim. Sci. 2019, 32, 556–563. [Google Scholar]
  35. Ijaz, M.U.; Ahmed, M.I.; Zou, X.; Hussain, M.; Zhang, M.; Zhao, F.; Xu, X.; Zhou, G.; Li, C. Beef, Casein, and Soy Proteins Differentially Affect Lipid Metabolism, Triglycerides Accumulation and Gut Microbiota of High-Fat Diet-Fed C57BL/6J Mice. Front. Microbiol. 2018, 9, 2200. [Google Scholar] [CrossRef] [PubMed]
  36. Wang, X.; Tsai, T.; Deng, F.; Wei, X.; Chai, J.; Knapp, J.; Apple, J.; Maxwell, C.V.; Lee, J.A.; Li, Y.; et al. Longitudinal investigation of the swine gut microbiome from birth to market reveals stage and growth performance associated bacteria. Microbiome 2019, 7, 109. [Google Scholar] [CrossRef] [Green Version]
  37. Choudhury, R.; Middelkoop, A.; Bolhuis, J.E.; Kleerebezem, M. Legitimate and Reliable Determination of the Age-Related Intestinal Microbiome in Young Piglets; Rectal Swabs and Fecal Samples Provide Comparable Insights. Front. Microbiol. 2019, 10, 1886. [Google Scholar] [CrossRef] [Green Version]
  38. Lu, D.; Tiezzi, F.; Schillebeeckx, C.; McNulty, N.P.; Schwab, C.; Shull, C.; Maltecca, C. Host contributes to longitudinal diversity of fecal microbiota in swine selected for lean growth. Microbiome 2018, 6, 4. [Google Scholar] [CrossRef] [PubMed] [Green Version]
  39. Wang, X.X.; Pan, Q.; Ma, F.; Li, P.J.; Xu, B.C.; Chen, C.G. Amelioration of Growth Performance, Lipid Accumulation, and Intestinal Health in Mice by a Cooked Mixture of Lean Meat and Resistant Starch. Mol. Nutr. Food Res. 2019, 63, e1801364. [Google Scholar] [CrossRef]
  40. Hou, Q.; Kwok, L.Y.; Zheng, Y.; Wang, L.; Guo, Z.; Zhang, J.; Huang, W.; Wang, Y.; Leng, L.; Li, H.; et al. Differential fecal microbiota are retained in broiler chicken lines divergently selected for fatness traits. Sci. Rep. 2016, 6, 37376. [Google Scholar] [CrossRef] [PubMed] [Green Version]
  41. Kong, C.; Gao, R.; Yan, X.; Huang, L.; Qin, H. Probiotics improve gut microbiota dysbiosis in obese mice fed a high-fat or high-sucrose diet. Nutrition 2019, 60, 175–184. [Google Scholar] [CrossRef]
  42. Kong, F.; Gao, Y.; Tang, M.; Fu, T.; Diao, Q.; Bi, Y.; Tu, Y. Effects of dietary rumen-protected Lys levels on rumen fermentation and bacterial community composition in Holstein heifers. Appl. Microbiol. Biotechnol. 2020, 104, 6623–6634. [Google Scholar] [CrossRef] [PubMed]
  43. Filippo, C.; Di Paola, M.; Ramazzotti, M.; Albanese, D.; Pieraccini, G.; Banci, E.; Miglietta, F.; Cavalieri, D.; Lionetti, P. Diet, Environments, and Gut Microbiota. A Preliminary Investigation in Children Living in Rural and Urban Burkina Faso and Italy. Front. Microbiol. 2017, 8, 1979. [Google Scholar] [CrossRef] [Green Version]
  44. Zhou, L.; Xiao, X.; Zhang, Q.; Zheng, J.; Li, M.; Wang, X.; Deng, M.; Zhai, X.; Liu, J. Gut microbiota might be a crucial factor in deciphering the metabolic benefits of perinatal genistein consumption in dams and adult female offspring. Food Funct. 2019, 10, 4505–4521. [Google Scholar] [CrossRef] [Green Version]
  45. Louis, S.; Tappu, R.M.; Damms-Machado, A.; Huson, D.H.; Bischoff, S.C. Characterization of the Gut Microbial Community of Obese Patients Following a Weight-Loss Intervention Using Whole Metagenome Shotgun Sequencing. PLoS ONE 2016, 11, e0149564. [Google Scholar] [CrossRef]
  46. Kang, Y.; Li, Y.; Du, Y.; Guo, L.; Chen, M.; Huang, X.; Yang, F.; Hong, J.; Kong, X. Konjaku flour reduces obesity in mice by modulating the composition of the gut microbiota. Int. J. Obes. 2019, 43, 1631–1643. [Google Scholar] [CrossRef]
  47. Forbes, J.D.; Chen, C.Y.; Knox, N.C.; Marrie, R.A.; El-Gabalawy, H.; de Kievit, T.; Alfa, M.; Bernstein, C.N.; Van Domselaar, G. A comparative study of the gut microbiota in immune-mediated inflammatory diseases-does a common dysbiosis exist? Microbiome 2018, 6, 221. [Google Scholar] [CrossRef]
  48. Waters, J.L.; Ley, R.E. The human gut bacteria Christensenellaceae are widespread, heritable, and associated with health. BMC Biol. 2019, 17, 83. [Google Scholar] [CrossRef]
  49. Zhang, W.J.; Su, W.W.; Li, P.B.; Rao, H.Y.; Lin, Q.W.; Zeng, X.; Chen, T.B.; Yan, Z.H.; Liu, H.; Yao, H.L. Naoxintong Capsule Inhibits the Development of Cardiovascular Pathological Changes in Bama Minipig Through Improving Gut Microbiota. Front. Pharmacol. 2019, 10, 1128. [Google Scholar] [CrossRef] [PubMed] [Green Version]
  50. Zhao, Y.; Tian, G.; Chen, D.; Zheng, P.; Yu, J.; He, J.; Mao, X.; Huang, Z.; Luo, Y.; Luo, J.; et al. Dietary protein levels and amino acid supplementation patterns alter the composition and functions of colonic microbiota in pigs. Anim. Nutr. 2020, 6, 143–151. [Google Scholar] [CrossRef]
  51. Wang, Y.; Xie, Q.; Sun, S.; Huang, B.; Zhang, Y.; Xu, Y.; Zhang, S.; Xiang, H. Probiotics-fermented Massa Medicata Fermentata ameliorates weaning stress in piglets related to improving intestinal homeostasis. Appl. Microbiol. Biotechnol. 2018, 102, 10713–10727. [Google Scholar] [CrossRef] [PubMed]
  52. Wang, H.; Hu, C.; Cheng, C.; Cui, J.; Ji, Y.; Hao, X.; Li, Q.; Ren, W.; Deng, B.; Yin, Y.; et al. Unraveling the association of fecal microbiota and oxidative stress with stillbirth rate of sows. Theriogenology 2019, 136, 131–137. [Google Scholar] [CrossRef]
  53. Shahi, S.K.; Freedman, S.N.; Mangalam, A.K. Gut microbiome in multiple sclerosis: The players involved and the roles they play. Gut Microbes 2017, 8, 607–615. [Google Scholar] [CrossRef] [PubMed]
  54. Rajilić-Stojanović, M.; Biagi, E.; Heilig, H.G.; Kajander, K.; Kekkonen, R.A.; Tims, S.; de Vos, W.M. Global and deep molecular analysis of microbiota signatures in fecal samples from patients with irritable bowel syndrome. Gastroenterology 2011, 141, 1792–1801. [Google Scholar] [CrossRef]
  55. Marri, P.R.; Paniscus, M.; Weyand, N.J.; Rendón, M.A.; Calton, C.M.; Hernández, D.R.; Higashi, D.L.; Sodergren, E.; Weinstock, G.M.; Rounsley, S.D.; et al. Genome sequencing reveals widespread virulence gene exchange among human Neisseria species. PLoS ONE 2010, 5, e11835. [Google Scholar] [CrossRef] [PubMed]
  56. Qiu, X.; Macchietto, M.G.; Liu, X.; Lu, Y.; Ma, Y.; Guo, H.; Saqui-Salces, M.; Bernlohr, D.A.; Chen, C.; Shen, S.; et al. Identification of gut microbiota and microbial metabolites regulated by an antimicrobial peptide lipocalin 2 in high fat diet-induced obesity. Int. J. Obes. 2021, 45, 143–154. [Google Scholar] [CrossRef] [PubMed]
  57. Rist, V.T.; Weiss, E.; Eklund, M.; Mosenthin, R. Impact of dietary protein on microbiota composition and activity in the gastrointestinal tract of piglets in relation to gut health: A review. Animal 2013, 7, 1067–1078. [Google Scholar] [CrossRef] [PubMed] [Green Version]
  58. Dai, Z.L.; Wu, G.; Zhu, W.Y. Amino acid metabolism in intestinal bacteria: Links between gut ecology and host health. Front. Biosci. 2011, 16, 1768–1786. [Google Scholar] [CrossRef] [PubMed] [Green Version]
  59. Yano, J.M.; Yu, K.; Donaldson, G.P.; Shastri, G.G.; Ann, P.; Ma, L.; Nagler, C.R.; Ismagilov, R.F.; Mazmanian, S.K.; Hsiao, E.Y. Indigenous bacteria from the gut microbiota regulate host serotonin biosynthesis. Cell 2015, 161, 264–276. [Google Scholar] [CrossRef] [Green Version]
  60. Kepert, I.; Fonseca, J.; Müller, C.; Milger, K.; Hochwind, K.; Kostric, M.; Fedoseeva, M.; Ohnmacht, C.; Dehmel, S.; Nathan, P.; et al. D-tryptophan from probiotic bacteria influences the gut microbiome and allergic airway disease. J. Allergy Clin. Immunol. 2017, 139, 1525–1535. [Google Scholar] [CrossRef] [Green Version]
  61. Dong, Y.; Wang, Z.; Qin, Z.; Cao, J.; Chen, Y. Role of serotonin in the intestinal mucosal epithelium barrier in weaning mice undergoing stress-induced diarrhea. J. Mol. Histol. 2018, 49, 85–97. [Google Scholar] [CrossRef]
  62. Zhang, J.; Zhu, S.; Ma, N.; Johnston, L.J.; Wu, C.; Ma, X. Metabolites of microbiota response to tryptophan and intestinal mucosal immunity: A therapeutic target to control intestinal inflammation. Med. Res. Rev. 2020. [Google Scholar] [CrossRef] [PubMed]
  63. Bosch, S.; El Manouni El Hassani, S.; Brizzio Brentar, M.; Ayada, I.; Bakkali, A.; Jansen, E.E.W.; Struys, E.A.; Benninga, M.A.; de Boer, N.K.H.; de Meij, T.G.J. Fecal Amino Acid Profiles Exceed Accuracy of Serum Amino Acids in Diagnosing Pediatric Inflammatory Bowel Disease. J. Pediatr. Gastroenterol. Nutr. 2020, 71, 371–375. [Google Scholar] [CrossRef]
  64. Grosheva, I.; Zheng, D.; Levy, M.; Polansky, O.; Lichtenstein, A.; Golani, O.; Dori-Bachash, M.; Moresi, C.; Shapiro, H.; Del Mare-Roumani, S.; et al. High-Throughput Screen Identifies Host and Microbiota Regulators of Intestinal Barrier Function. Gastroenterology 2020, 159, 1807–1823. [Google Scholar] [CrossRef]
  65. Collins, S.M.; Surette, M.; Bercik, P. The interplay between the intestinal microbiota and the brain. Nat. Rev. Microbiol. 2012, 10, 735–742. [Google Scholar] [CrossRef]
  66. Li, Y.; Guo, Y.; Wen, Z.; Jiang, X.; Ma, X.; Han, X. Weaning Stress Perturbs Gut Microbiome and Its Metabolic Profile in Piglets. Sci. Rep. 2018, 8, 18068. [Google Scholar] [CrossRef] [PubMed] [Green Version]
  67. Turroni, S.; Fiori, J.; Rampelli, S.; Schnorr, S.L.; Consolandi, C.; Barone, M.; Biagi, E.; Fanelli, F.; Mezzullo, M.; Crittenden, A.N.; et al. Fecal metabolome of the Hadza hunter-gatherers: A host-microbiome integrative view. Sci. Rep. 2016, 6, 32826. [Google Scholar] [CrossRef]
  68. Turroni, S.; Brigidi, P.; Cavalli, A.; Candela, M. Microbiota-Host Transgenomic Metabolism, Bioactive Molecules from the Inside. J. Med. Chem. 2018, 61, 47–61. [Google Scholar] [CrossRef] [PubMed]
  69. Tan, S.; Ge, W.; Wang, J.; Liu, W.; Zhao, Y.; Shen, W.; Li, L. Zearalenone-induced aberration in the composition of the gut microbiome and function impacts the ovary reserve. Chemosphere 2020, 244, 125493. [Google Scholar] [CrossRef]
  70. Yore, M.M.; Syed, I.; Moraes-Vieira, P.M.; Zhang, T.; Herman, M.A.; Homan, E.A.; Patel, R.T.; Lee, J.; Chen, S.; Peroni, O.D.; et al. Discovery of a class of endogenous mammalian lipids with anti-diabetic and anti-inflammatory effects. Cell 2014, 159, 318–332. [Google Scholar] [CrossRef] [Green Version]
  71. Lee, J.; Moraes-Vieira, P.M.; Castoldi, A.; Aryal, P.; Yee, E.U.; Vickers, C.; Parnas, O.; Donaldson, C.J.; Saghatelian, A.; Kahn, B.B. Branched Fatty Acid Esters of Hydroxy Fatty Acids (FAHFAs) Protect against Colitis by Regulating Gut Innate and Adaptive Immune Responses. J. Biol. Chem. 2016, 291, 22207–22217. [Google Scholar] [CrossRef] [Green Version]
  72. Syed, I.; Rubin de Celis, M.F.; Mohan, J.F.; Moraes-Vieira, P.M.; Vijayakumar, A.; Nelson, A.T.; Siegel, D.; Saghatelian, A.; Mathis, D.; Kahn, B.B. PAHSAs attenuate immune responses and promote β cell survival in autoimmune diabetic mice. J. Clin. Investig. 2019, 129, 3717–3731. [Google Scholar] [CrossRef] [Green Version]
  73. Brejchova, K.; Balas, L.; Paluchova, V.; Brezinova, M.; Durand, T.; Kuda, O. Understanding FAHFAs: From structure to metabolic regulation. Prog. Lipid Res. 2020, 79, 101053. [Google Scholar] [CrossRef] [PubMed]
  74. Kuda, O.; Brezinova, M.; Rombaldova, M.; Slavikova, B.; Posta, M.; Beier, P.; Janovska, P.; Veleba, J.; Kopecky, J., Jr.; Kudova, E.; et al. Docosahexaenoic Acid-Derived Fatty Acid Esters of Hydroxy Fatty Acids (FAHFAs) With Anti-inflammatory Properties. Diabetes 2016, 65, 2580–2590. [Google Scholar] [CrossRef] [PubMed] [Green Version]
  75. Paluchova, V.; Vik, A.; Cajka, T.; Brezinova, M.; Brejchova, K.; Bugajev, V.; Draberova, L.; Draber, P.; Buresova, J.; Kroupova, P.; et al. Triacylglycerol-Rich Oils of Marine Origin are Optimal Nutrients for Induction of Polyunsaturated Docosahexaenoic Acid Ester of Hydroxy Linoleic Acid (13-DHAHLA) with Anti-Inflammatory Properties in Mice. Mol. Nutr. Food Res. 2020, 64, e1901238. [Google Scholar] [CrossRef] [PubMed]
  76. Gowda, S.G.B.; Liang, C.; Gowda, D.; Hou, F.; Kawakami, K.; Fukiya, S.; Yokota, A.; Chiba, H.; Hui, S.P. Identification of short-chain fatty acid esters of hydroxy fatty acids (SFAHFAs) in a murine model by nontargeted analysis using ultra-high-performance liquid chromatography/linear ion trap quadrupole-Orbitrap mass spectrometry. Rapid Commun. Mass Spectrom. 2020, 34, e8831. [Google Scholar] [CrossRef]
  77. LeBlanc, J.G.; Milani, C.; de Giori, G.S.; Sesma, F.; van Sinderen, D.; Ventura, M. Bacteria as vitamin suppliers to their host: A gut microbiota perspective. Curr. Opin. Biotechnol. 2013, 24, 160–168. [Google Scholar] [CrossRef]
  78. Digby, J.E.; Martinez, F.; Jefferson, A.; Ruparelia, N.; Chai, J.; Wamil, M.; Greaves, D.R.; Choudhury, R.P. Anti-inflammatory effects of nicotinic acid in human monocytes are mediated by GPR109A dependent mechanisms. Arterioscler. Thromb. Vasc. Biol. 2012, 32, 669–676. [Google Scholar] [CrossRef] [Green Version]
  79. Kunisawa, J.; Hashimoto, E.; Ishikawa, I.; Kiyono, H. A pivotal role of vitamin B9 in the maintenance of regulatory T cells in vitro and in vivo. PLoS ONE 2012, 7, e32094. [Google Scholar] [CrossRef] [Green Version]
  80. Brestoff, J.R.; Artis, D. Commensal bacteria at the interface of host metabolism and the immune system. Nat. Immunol. 2013, 14, 676–684. [Google Scholar] [CrossRef] [PubMed] [Green Version]
Figure 1. Effects of protein restriction and realimentation on the gut microbiota in the colonic digesta of piglets. Venn diagram showing the unique and shared OTUs between groups at day 14 (A) and the end of the experiment (B). Stacked bar chart depicting the relative abundance of top 10 phylum between groups at day 14 (C) and the end of the experiment (D). Bar chart showing the significantly changed bacteria genera between groups at day 14 (E) and the end of the experiment (F). * p-value < 0.05. NP, normal protein group. LP, low protein group.
Animals 11 00686 g001
Figure 2. Effects of protein restriction and realimentation on SCFAs in colonic digesta of piglets at day 14 (A) and the end of the experiment (B). NP, normal protein group. LP, low protein group. * p-value < 0.05.
Animals 11 00686 g002
Figure 3. Effects of protein restriction and realimentation on colon metabolic profiles of piglets. Heatmap for the differentiated metabolites with VIP >1 and p < 0.05 and fold change (FC) ≥ 1.20 or ≤0.83 at day 14 (A) and the end of the experiment (B). Metabolites peak area were Z score transformed. Each sample is visualized in a single column and each metabolite is represented by a single row. The relative metabolite level is depicted according to the color scale. Red color indicates upregulation, and blue color indicates downregulation. NP, normal protein group. LP, low protein group.
Animals 11 00686 g003
Figure 4. Correlation between the colonic microbiota (at the genera level) and metabolites during the protein restriction (A) and realimentation phase (B). The circle border color is based on the Spearman correlation coefficient distribution, and its size is based on the correlation coefficient value. The red-filled circle represents a significant positive correlation (p < 0.05), the blue-filled circle represents a significant negative correlation (p < 0.05) and the white-filled circle represents no significant correlation (p > 0.05).
Animals 11 00686 g004
Table 1. Ingredient and nutrient composition of experimental diets in piglets (% as-fed basis).
ItemRestriction Phase
d 0 to 14
Realimentation Phase
d 15 to 25 kg of BW
NP-20%LP-16%NP-19%
Ingredients, %
Corn34.9445.0868.43
Expanded corn10.0010.00
Expanded soybean8.004.00
Soybean meal, enzyme treated10.007.9210.00
Soybean meal3.20 14.46
Fish meal3.202.002.00
Whey protein concentrate3.202.00
Whey powder15.0015.00
Yeast extract2.002.00
Soybean hulls2.002.00
Soybean oil1.001.001.00
Sucrose2.502.50
Salt0.200.200.35
Dicalcium phosphate1.051.470.55
Limestone 0.93
Calcium Citrate0.900.88
L-Lys HCl0.590.990.47
DL-Met0.100.180.06
L-Thr0.190.370.12
L-Trp0.020.090.01
L-Val0.110.32
L-Ile 0.20
Phytase0.020.020.02
Zinc oxide0.180.18
Choline chloride0.200.200.20
Titanium dioxide0.400.400.40
Premix 11.001.001.00
Total100.00100.00100.00
Calculated nutrient composition 2, %
NE 3, MJ/kg10.8210.9210.50
SID 4 Lys1.411.411.23
SID 4 Met0.410.410.36
SID 4 Thr0.830.830.73
SID 4 Trp0.230.230.20
SID 4 Val0.890.890.78
SID 4 Ile0.730.720.71
Calcium0.820.820.75
Total phosphorus0.720.720.61
Analyzed nutrient composition, %
CP 520.0916.3319.35
1 Provided, per kilogram of diet, 12 400 IU vitamin A, 2 800 IU vitamin D3, 30 mg vitamin E, 5 mg vitamin K3, 3 mg thiamin, 10 mg riboflavin, 40 mg niacin, 8 mg pyridoxine, 40 μg vitamin B12, 0.08 mg biotin, 15 mg pantothenic acid, 1 mg folic acid, 80 mg Zn, 120 mg Fe, 70 mg Mn, 16 mg Cu, 0.7 mg I, 0.48 mg Se. 2 Values were calculated according to NRC [15]. 3 NE, net energy. 4 SID, standardized ileal digestible. 5 CP, crude protein.
Table 2. Effects of protein restriction and realimentation on the growth performance of piglets 1.
ItemNPLPSEMp-Value
Restriction phase (day 0 to 14)
Initial BW, kg6.396.380.020.861
ADG, g32426118.10.041
ADFI, g41837217.00.093
G:F0.770.700.020.022
Diarrhea incidence, %2.000.290.550.060
BW at end of phase, kg10.910.00.260.043
Realimentation phase (day 15 to target BW)
ADG, g5245437.90.153
ADFI, g85988810.10.086
G:F0.610.610.011.000
Diarrhea incidence, %5.332.611.210.151
Final BW, kg24.925.10.230.579
Overall (day 0 to target BW)
ADG, g4554529.50.814
ADFI, g7087188.20.413
G:F0.640.630.010.283
Diarrhea incidence, %3.761.560.820.095
Days on experiment40.841.50.810.537
1 BW, body weight. ADG, average daily gain. ADFI, average daily feed intake. G:F, gain:feed. NP, normal protein group. LP, low protein group.
Table 3. Effects of protein restriction and realimentation on the chemical body composition of piglets 1.
ItemNPLPSEMp-Value
Day 14 of the experiment
Water, g/kg7097084.30.845
Protein, g/kg1631571.80.034
Lipid, g/kg90.197.34.240.261
Ash, g/kg31.031.41.400.846
End of the experiment
Water, g/kg6946894.60.427
Protein, g/kg1681661.60.451
Lipid, g/kg1071136.50.523
Ash, g/kg28.227.11.460.622
1 NP, normal protein group. LP, low protein group.
Table 4. Effects of protein restriction and realimentation on the serum biochemical parameters of piglets 1.
ItemNPLPSEMp-Value
Day 14 of the experiment
Total protein, g/L51.246.11.790.085
Albumin, g/L29.623.81.310.017
Urea, mmol/L2.821.660.250.018
Glucose, mmol/L7.576.480.550.203
Triglyceride, mmol/L0.490.500.050.845
Creatinine, μmol/L71.361.85.300.245
End of the experiment
Total protein, g/L56.854.81.480.357
Albumin, g/L31.829.01.080.104
Urea, mmol/L3.974.500.580.543
Glucose, mmol/L4.464.040.580.621
Triglyceride, mmol/L0.480.490.040.908
Creatinine, μmol/L83.283.95.330.919
1 NP, normal protein group. LP, low protein group.
Table 5. Effects of protein restriction and realimentation on the alpha-diversity of colonic microbiota of piglets 1.
ItemNPLPSEMp-Value
Day 14 of the experiment
Observed species37742030.30.345
ACE42746025.10.385
Chao150359137.00.143
Shannon5.275.250.180.951
Simpson0.920.920.010.872
End of the experiment
Observed species63670616.60.017
ACE65672918.60.025
Chao164371417.60.022
Shannon6.286.280.140.996
Simpson0.960.960.010.681
1 NP, normal protein group. LP, low protein group.
Publisher’s Note: MDPI stays neutral with regard to jurisdictional claims in published maps and institutional affiliations.

