Article

Effect of a Phytogenic Water Additive on Growth Performance, Blood Metabolites and Gene Expression of Amino Acid Transporters in Nursery Pigs Fed with Low-Protein/High-Carbohydrate Diets

Department of Animal and Food Sciences, Oklahoma State University, Stillwater, OK 74078, USA
*
Author to whom correspondence should be addressed.
Animals 2021, 11(2), 555; https://doi.org/10.3390/ani11020555
Submission received: 30 December 2020 / Revised: 13 February 2021 / Accepted: 16 February 2021 / Published: 20 February 2021

Abstract

:

Simple Summary

Low-protein (LP) diets can be potentially used to reduce the excretion of nitrogenous compounds and feed cost in commercial swine production; however, new strategies are required to be developed to improve the growth performance of pigs receiving these diets. Little is known about the effect of phytogenic additives on the performance of pigs fed with LP diets and the underlying factors involved. The objective of this study was to assess the effect of a phytogenic water additive (PWA) on growth performance, nutrient digestibility, blood metabolites, plasma amino acid (AA) concentration, and gut and skeletal muscle AA transporters in nursery pigs fed with LP diets. Supplemental PWA increased the concentration of circulating essential AA, reduced the transcript of some of the AA transporters in the small intestine and skeletal muscle, improved growth performance when the dietary protein was adequate, and increased muscle lean%, but reduced muscle fat% when the dietary protein was deficient. The used PWA in this study had differential effects on blood calcium and its digestibility depending on the level of dietary protein. This study suggests that PWA can be used for improving the meat composition in protein-restricted pigs, but PWA improves growth performance only when dietary protein is adequate.

Abstract

The objective of this study was to investigate the effect of a phytogenic water additive (PWA) on growth performance and underlying factors involved in pigs fed with low-protein (LP)/high-carbohydrate diets. Forty-eight weaned barrows were allotted to six treatments for 4 weeks: CON-NS, control (CON) diet-no PWA; CON-LS, CON diet-low dose PWA (4 mL/L); CON-HS, CON diet-high dose PWA (8 mL/L); LP-NS, LP diet-no PWA; LP-LS, LP diet-low dose PWA; LP-HS, LP diet-high dose PWA. Relative to CON-NS, pigs fed with CON-HS had increased average daily gain, body weight and serum calcium (Ca) and phosphorous (P) and had decreased mRNA abundance of solute carrier family 7 member 11 and solute carrier family 6 member 19 in jejunum. Compared to LP-NS, pigs fed with LP-HS had increased muscle lean%, decreased muscle fat%, decreased serum Ca and increased serum P. Compared to their NS counterparts, CON-LS, CON-HS, and LP-LS increased the concentration of plasma essential AA and those fed with CON-HS and LP-HS tended to reduce the abundance of the solute carrier family 7 member 1 transcript in skeletal muscle. Thus, PWA improved the performance of weaned pigs fed with protein-adequate diets likely through increased blood essential AA and affected the muscle composition when dietary protein was deficient.

1. Introduction

The intensive swine production in developed countries has raised environmental and sustainable agriculture concerns associated with the excretion of large amounts of waste including nitrogen (N) or nitrogen-containing compounds [1,2]. Therefore, new strategies need to be developed to reduce N excretion from the swine industry to the environment. Low-protein (LP) diets are used to reduce N excretion and other toxic nitrogenous compounds in the swine industry [3,4,5]. These diets have also been reported to reduce feed cost and alleviate the incidence of diarrhea in early weaning pigs [6,7]. A slight reduction in dietary crude protein (CP), i.e., <25%, along with supplementing limiting amino acids (AA, i.e., lysine, methionine, tryptophan, and threonine) do not appear to have a negative impact on the performance of pigs [3,5,8,9]. However, in order to justify the use of LP diets at larger scales in commercial swine production, additional research is needed to further improve the growth performance of pigs fed with LP diets.
Phytogenic additives are substances originated from plants. These compounds have received increasing attention lately for use in swine and poultry production due to their positive effects on animal production and health [10,11,12,13,14,15]. Improvement in growth performance was observed when adequate-protein diets were supplemented with phytogenic additives such as Chinese herbal powder in early weaned piglets [16] and herb extract mixture (buckwheat, thyme, curcuma, black pepper, and ginger) in growing pigs [17]. Little is known about whether supplemental phytogenic additives have beneficial effects on the growth performance of pigs fed with LP diets. Manzanilla et al. (2009) showed that supplementing a plant extract mixture to a LP diet (18% CP) in weaned pigs had differential positive or negative effects on various variables measured [18]. In turn, Abousekken et al. (2015) reported that adding Moringa oleifera leaf extract to drinking water of broilers fed with LP diet (100 mL/L water) improved growth performance parameters such as weight gain and feed conversion ratio [19]. However, others showed that supplementing a plant extract YGF251 to a diet with very low protein content (14% and 12.5% CP) did not affect the growth performance of growing pigs [20]. Given the very low protein content of the diet used in the former study by Lei et al. (2019) [20] and the marginal effects of feed additives, it appears that the beneficial effects of the plant extract used were not fully explored in that study.
The improved performance in pigs fed with standard protein diets supplemented with phytogenic additives has been linked with improved feed intake and palatability [17,21], immune function [22,23] and blood total antioxidant capacity [24]. Further, phytogenic additives have been reported to enhance intestinal development, ecosystem and microbiota, and nutrient digestibility in pigs fed with standard protein diets [17,23,24,25,26,27]. Data on the mechanisms by which phytogenic additives may influence the growth of pigs fed with LP diets are scarce. Little is known about the effect of phytogenic additives on nutrient digestibility when pigs are offered LP diets. This is particularly important as LP diets have been shown to induce a negative effect on the digestibility of nutrients such as phosphorous (P) in monogastrics [28,29]. Xue et al. (2017) showed that ileal-digested P was decreased when the dietary protein content was reduced in growing pigs [28]. In a different study, Xue et al. (2016) reported a reduced total tract retention of P in broiler chickens fed with diets with low protein content [29]. Further, we previously showed that the concentrations of important blood essential AA such as isoleucine, valine, phenylalanine, tyrosine and tryptophan were decreased in pigs fed with LP diets [30,31], which can influence animal health and growth performance.
There is evidence that nutrient composition can alter intestinal AA transporter expression in pigs fed with LP diets [32]. Reyer et al. (2017) reported that incubating jejunal cells with a combination of essential oils and saponins at medium and high doses stimulated solute carrier family 15 member 1 (SLC15A1) recruitment to the cytoplasmic membrane in growing broilers [33]. Little is understood about whether phytogenic additives can change the concentration of blood AA as well as the expression of AA transporters in the gut and skeletal muscle of pigs fed with LP diets. We hypothesized that supplementing LP diets with a phytogenic additive would improve the growth performance of pigs through alterations in nutrient digestibility, blood metabolites and AA profile, the expression of intestinal and skeletal muscle AA transporters and blood antioxidant capacity. Therefore, the objective of this study was to investigate the effect of a phytogenic water additive (PWA) on growth performance, nutrient digestibility, blood metabolites, AA profile and total antioxidant capacity, and gene expression of AA transporters in the gut and skeletal muscle of nursery pigs fed with low-protein/high-carbohydrate diets.

2. Materials and Methods

2.1. Animals, Housing, and Diets

All experimental procedures were performed in accordance with the Oklahoma State University Animal Care and Use Committee and were approved by this committee (Animal Care and Use Protocol # AG-18-6). Forty-eight weanling (three weeks old; 6.3 ± 1.2 kg body weight) crossbred barrows (Duroc sire line and Large White X Landrace dam) were used in this study (Seaboard, Hennessey, OK, USA). Upon arrival, pigs were group-housed and acclimated to the environment in a facility with controlled temperature, lighting, and ventilation. The animal facility’s temperature was set at 31 °C in the first week and then was reduced weekly by 1 °C.
Following 2 weeks of adaptation, all pigs (total n = 48) were weight matched (9.02 ± 0.17 kg), individually housed, and randomly allotted to one of the 6 dietary treatments (n = 8/treatment) in a completely randomized design with 3 × 2 factorial arrangements with the factors of PWA supplement (0, 4 and 8 mL/L of water) and dietary protein content (control and LP) for 4 weeks. Treatments included (1) control (CON) diet with no PWA supplement (CON-NS), (2) CON diet with a low dose of PWA supplement (4 mL/L of water) (CON-LS), (3) CON diet with a high dose of PWA supplement (8 mL/L of water) (CON-HS), (4) LP diet with no PWA supplement (LP-NS), (5) LP diet with a low dose of PWA supplement (4 mL/L of water) (LP-LS) and (6) LP diet with a high dose of PWA supplement (8 mL/L of water) (LP-HS). The used doses for PWA (Herbanimals®, Oklahoma City, OK, USA) were based on guidelines provided by Herbanimals Supplement LLC (Oklahoma City, OK, USA) and the route of administration was based on previous study [34]. The ingredients of PWA (Herbanimals®) used in the current study include 4.83% Pandanus amaryllifolius Roxb, 24.15% Phyllanthus niruri, 4.83% Amomum cardamomum, 13.04% Zingiber zerumbet, 14.49% Apium Graveolens, 14.49% Anethum Graveolens, 4.83% Ocimum americanum, 4.83% Cinnamomum burmannii Blume, 4.83% Myristica fragrans Houtt and 9.66% Zingiber officinale roscoe. The ingredients and analyzed composition of Herbanimals® for vitamins and minerals are given in Table S1.
Phase feeding was applied according to the recommendations of the nutrient requirement of swine [35]. Nursery phase 1 (N1) diet was fed for 1 week (days 1–7 of study), nursery phase 2 (N2) diet was fed for 2 weeks (days 8–21 of study) and nursery phase 3 (N3) diet was offered for 3 weeks (days 22–42 of study) (Table 1). To achieve the desired CP levels and maintain the energy content consistent between the CON and LP diets, the amount of soybean meal as the primary source of protein was decreased, and corn as the major source of carbohydrate was increased in LP diets. Therefore, LP diets, as expected, had a higher carbohydrate content than CON diets (Table 1). LP diets were supplemented with limiting AA (i.e., lysine, methionine, threonine, and tryptophan) at levels equal to the CON diet. All diets contained 0.5% chromium oxide as an indigestible marker for apparent total tract digestibility tests. All pigs had free access to feed and water throughout this study.

2.2. Growth Performance

The individual feed and water intakes were recorded daily and body weight was measured weekly. The average daily gain (ADG), average daily feed intake (ADFI), cumulative feed intake (CFI), weight gain to feed intake ratio (G:F), and weight gain to protein intake ratio (G:P) were computed by using the individual feed intake and body weight records and analyzed dietary protein concentration. The weekly body weight gain (BWG), cumulative feed intake (CFI), cumulative protein intake (CPI), and G:F and G:P ratios were calculated for 4 weeks of data collected.

2.3. Feed and Fecal Samples Collection

Approximately 500 g feed samples were collected after mixing each diet and stored at −20 °C until analysis. Fecal samples were collected at week 6 of this study following transferring the pigs to metabolic crates for 24 h, where they had free access to feed and water. Following collection, the fecal samples were stored at −20 °C until analysis.

2.4. Blood and Tissue Samples Collection

At the end of this study, blood samples were drawn from the jugular vein of all pigs in the supine position in 10 mL sterile dry and 3 mL sterile sodium heparin-coated tubes (BD, Franklin Lakes, NJ, USA) for collection of serum and plasma, respectively. Blood samples were placed on ice after collection, transferred to the laboratory, and centrifuged at 4 °C for 10 min and at 2000× g to collect the serum or plasma. The collected serum and plasma were stored at −80 °C until further analysis. After blood collection, all pigs were euthanized via CO2 asphyxiation, and skeletal muscle (i.e., Biceps femoris) and jejunum samples were collected. Tissue samples were rinsed with distilled water after dissection, snap-frozen in liquid nitrogen, and stored at −80 °C until later processing. Separate muscle samples were collected (~150 g) and stored at −20 °C for lean and fat content analysis.

2.5. Feed and Fecal Samples Composition Analysis

As we previously described [36], feed samples were analyzed by ServiTech Laboratories (Dodge City, KS, USA) for dry matter, crude fiber, calcium (Ca), P, N, and chromium using official methods of analysis of AOAC [37]. Fecal samples were analyzed by ServiTech Laboratories (Dodge City, KS, USA) for Ca, P, N, and chromium using the methods indicated above for analysis of feed samples.

2.6. Plasma Nitrogen-Containing Compounds Analysis

Plasma samples were analyzed for nitrogen-containing compounds using a LI-BASED Hitachi 8900 (Hitachi High-Technologies Corporation, Tokyo, Japan) as previously described [38] at Molecular Structure Facility, Proteomics Core (UC Davis Genome Center, Davis, CA, USA). Briefly, plasma samples were thawed at room temperature, acidified to 2% sulfosalicylic acid and incubated for 15 min at room temperature. Samples were then stored at −20 °C overnight. The following day, the samples were thawed and diluted with Li sample diluent (Pickering Labs, Mountain View, CA, USA) containing 100 nmol/mL AE-Cys, before injection (50 μL). The ion-exchange chromatography using a HITACHI L-8900 Amino Acid Analyzer (Hitachi High-Technologies Corporation, Tokyo, Japan) with a post-column ninhydrin reaction was used to separate free AA. Column and buffers were provided by Hitachi (Tarrytown, NY, USA), and ninhydrin was provided by Wako Chemicals (Richmond, CA, USA). The AA standards (Sigma-Aldrich, St. Louis, MO, USA) were used for the calibration of the Amino Acid Analyzer. Absorbances were measured at both 570 and 440 nm after the reaction with ninhydrin to regulate the response factor for each AA and to quantify AA concentrations relative to the known AA and related compound standards (0.5 μmole/mL in 0.2 N lithium citrate, pH 2.2 containing 0.1% phenol and 2% thiodiglycol). The internal standard (AE-Cys, Sigma #A2636) was included due to variations in injection volume that might be caused by the autosampler.

2.7. Muscle Composition Analysis

Muscle samples collected from each pig were scanned by dual-energy X-ray absorptiometry (DEXA; Hologic, Discovery QDR Series, Bedford, MA, USA) to determine the lean and fat content using the rodent’s calibration feature.

2.8. Serum Metabolites Analysis

The concentrations of Ca, P, alkaline phosphatase (ALP), and blood urea nitrogen (BUN) were measured in serum samples (>300 µL) using an automated chemistry analyzer system (CLC 480/BioLis24i, Carolina Liquid Chemistries Corp., Brea, CA, USA). After calibration of the equipment (Catalogue # BL-442600, Multi-Analyte calibrator for Synchron CX/LX), the reagents of Ca (Product #BL251), P (Product #BL218), ALP (Product #BL206), and BUN (Product #BL252) were used to quantify the concentration of these parameters in serum. The absorbances of Ca and P were recorded at 660 and 340 nm, respectively. The absorbances of BUN and ALP were measured at 405 nm.

2.9. RNA Isolation and RT-qPCR Analysis

Total RNA extraction, reverse transcription, and quantitative PCR were performed as we described previously [39]. Approximately 300 mg of skeletal muscle and jejunum tissues were grounded using a mortar and pestle and liquid nitrogen. The ground samples then were homogenized with 1 mL Qiazol (Qiagen, Catalogue #74106, Germantown, MD, USA). The RNA was isolated using RNeasy® mini kit (Qiagen, Catalogue #74106, Germantown, MD, USA). The isolated RNA concentration was quantified and the ratio of absorbance at 260 nm and 280 nm was recorded using a Nanodrop ND-1000 spectrophotometer (Thermo Fisher, Waltham, MA, USA). The 260/280 nm absorption ratios for all RNA samples were 1.7–2.0. RNA samples were DNAse treated (Thermo Fisher, Waltham, MA, USA) and used for complementary DNA (cDNA) synthesis. cDNA was synthesized in a 20 μL reaction volume using 5 μL of DNase-treated RNA (1.25 μg), 4 μL of 5× first-strand buffer, 2 μL of random primers (3 μg/μL), 2 μL of deoxyribonucleotide triphosphate (dNTP) mix [2.5 mM], 2 μL of dithiothreitol (DTT) (0.1 M), 1 μL of RNaseOUT (40 U/μL), 1 μL of superscript II reverse transcriptase (200 U/μL), and 3 μL of RNase/DNase-free water (Thermo Fisher Scientific Waltham, MA) using the following program: 22 °C for 5 min, 42 °C for 30 min, 85 °C for 5 min, and terminated at 4 °C in a thermocycler (T100TM Thermal Cycler, Bio-Rad, Hercules, CA, USA). The primers’ sequences were obtained from previous publications as listed in Table 2 [40,41,42,43]. Using a 96-well plate, the real-time quantitative PCR (qPCR) was performed using a CFX96 real-time PCR detection system (Bio-Rad, Hercules, CA, USA). The PCR was performed in a 25 μL total volume reaction, with 2 μL of the first-strand cDNA, 12.5 μL of SYBR Green master mix (Applied Biosystems Inc., Waltham, MA, USA), 0.2 μL of F, 0.2 μL of R sequences of each primer (100 mM), and 10.1 μL of RNase/DNase-free water (Thermo Fisher Scientific, Waltham, MA, USA). The qPCR program used was: denaturation at 50 °C for 2 min and 95 °C for 10 min, 40 cycles amplification at 95 °C for 15 s and 60 °C for 1 min; then a melt curve program: 95 °C for 15 s, 60 °C for 1 min, and 95 °C for 15 s. Finally, the 2−∆∆CT method [44] was used for the calculation of the mRNA abundance of target genes that were normalized to β-actin mRNA abundance as a housekeeping gene.

2.10. Total Antioxidant Capacity

Total antioxidant capacity (TAC) of serum was analyzed using a TAC kit (ab65329, Abcam, Cambridge, MA, USA) following the manufacturer’s instructions. Briefly, after preparing all the reagents to work concentrations, 100 μL of standards solution, 5 μL of serum samples, 5 μL of protein masks, and 90 μL of water were added to each well of a 96-well plate in duplicate. The plate was placed on a plate shaker in the dark for 1.5 h at room temperature to reduce the added 100 μL of Cu2+. After the reduction of Cu2+, the solution was chelated with a colorimetric probe, and absorbance was measured at 570 nm using an Epoch microplate reader spectrophotometer (BioTek® instrument, Inc., Winooski, VT, USA). The intra-assay coefficient of variation (CV) was 6.55%.

2.11. Apparent Fecal Digestibility of Nutrients

As we previously described [36], apparent fecal digestibility (AFD) of Ca, P, and N was calculated using the index method with chromium as an external marker. The following equation was used to calculate the AFD of nutrients: 100 − (100 × (marker concentration in feed/marker concentration in feces) × (nutrient concentration in feces/nutrient concentration in feed).

2.12. Statistical Analysis

As we previously described [36] using Al-Therapy Statistics (https://www.ai-therapy.com/psychology-statistics/sample-size-calculator (accessed on 3 July 2018)) and data from our previous study [30], we measured the sample size before starting this study. Our power analysis showed that when 8 pigs/dietary group is used, a 7.90 kg difference in body weight between two groups (SD: control diet = 4.27 kg, low-protein diet = 4.26 kg) can be detected with 93% power (α = 0.05; effect size = 1.852). The ADG, ADFI, final body weight, average daily water intake (ADWI), average daily protein intake (ADPI), G:F and G:P ratios, AFD of nutrients, blood metabolites, DEXA, TAC, and gene expression data were analyzed using two-way ANOVA including the main effects of protein, PWA and protein × PWA in the model (SPSS®, IMB SPSS Statistics version 23, Armonk, NY, USA). The difference between the means of treatments for all parameters was separated using pairwise Student’s t-test corrected by the Benjamini–Hochberg procedure [45] with 0.1 false discovery for 5 comparisons, i.e., CON-NS vs. CON-LS, CON-NS vs. CON-HS, CON-NS vs. LP-NS, LP-NS vs. LP-LS, LP-NS vs. LP-HS. The daily feed intake, weekly body weight, and weekly growth performance data were analyzed with a linear mixed model of SPSS® (IMB SPSS Statistics version 23, Armonk, NY, USA), with the effect of protein, PWA, time, protein × PWA, protein × time, PWA × time and protein × PWA × time as fixed and the pig as a random variable included in the model. Based on the smallest values of fit statistics for the corrected Akaike Information Criterion (AIC) and the Bayesian Information Criterion (BIC), the covariance structure of the repeated measurements model for daily feed intake, and weekly body weight and CPI were autoregressive and for weekly BWG, CFI, CWI, G:F and G:P were heterogeneous autoregressive. p ≤ 0.05 and 0.05 < p ≤ 0.1 were considered to declare significant difference and trends, respectively.

3. Results

3.1. Growth Performance

The initial BW was not different among groups (9.02 ± 0.17 kg; Table 3). There was a significant effect of dietary protein (p < 0.05) on final BW and ADG, with LP pigs having lower final BW (24.37 vs. 26.83 kg) and ADG (0.55 vs. 0.63 kg) than CON pigs (Table 3). However, there were no differences between LP-NS and CON-NS pigs on final BW and ADG. The effect of protein × PWA on final BW and ADG tended to be significant (p < 0.1; Table 3). While there were no differences in ADG and final BW of pigs fed with LP-NS, LP-LS, and LP-HS, pigs in CON-HS had 19% higher ADG and tended to have 15% higher final BW compared to those fed CON-NS (Table 3; Figure S1A). When the data were analyzed on a weekly basis, there was a significant protein effect on BWG, with LP pigs having lower BWG than CON counterparts during the first (3.60 vs. 4.10 kg) and second week (3.53 vs. 4.13 kg) of the study (p < 0.01; Table 4). No differences in BWG were detected among treatments during the first three weeks, but pigs fed CON-HS had 34% higher (p < 0.05) BWG than those fed with CON-NS at week 4 (Table 4).
The effects of protein, PWA, and protein × PWA on ADFI and ADWI were not significant (Table 3). There was an overall significant effect of time (p < 0.01) on FI, with pigs fed with CON-HS tending to have a 70% higher feed intake compared to those fed with CON-NS on day 5 (Figure S1B). Cumulative feed intake did not change among groups during the entire study (Table 4). When CPI was assessed on a weekly basis, there was a significant effect of protein during all four weeks of this study, with LP pigs having a lower CPI than CON pigs (0.57 vs. 0.88, 0.92 vs. 1.31, 1.26 vs. 1.71, 1.53 vs. 2.11 kg for weeks 1 to 4, respectively). Additionally, the effect of PWA on CPI was significant in the second week of study with a dose-dependent increase in CPI (0.99, 1.42, and 1.22 kg for NS, LS, and HS, respectively). There was a significant effect of protein × PWA on CPI during week 4 of this study, suggesting that PWA improved the CPI only with a standard level of dietary protein (Table 4). During weeks 2 and 3, pigs fed LP-NS tended to have 30% and 28% less CPI than those fed with CON-NS, respectively, while pigs from the CON-HS group tended to have a 20% higher CPI during the second week compared to CON-NS pigs. Additionally, pigs fed LP-HS tended to have a 26% higher CPI than those fed with LN-NS during the second week of this study. Pigs in the LP-LS group had 27% higher ADWI than pigs fed with LP-NS (Table 3). When water intake was analyzed weekly, there was a significant effect of protein on CWI during week 2 of this study with LP pigs having a lower water intake than CON (18.30 vs. 24.13 L) (Table 4). Pigs fed with LP-NS consumed 48% less water during the second week compared to those fed with CON-NS. Pigs fed with LP-HS consumed 83% more water compared to animals fed with LP-NS during the second week of this study. On week 4, LP-LS pigs tended to consume 47% more water than LP-NS.
There was a significant effect of protein (p < 0.05) on G:F and G:P ratios (Table 3). Relative to CON, LP pigs had lower G:F (0.62 vs. 0.70) and greater G:P ratios (3.59 vs. 2.96). However, no differences in G:F ratio were detected when CON-NS and LP-NS pigs were compared. Pigs fed with LP-NS diet had a 29% higher G:P than the CON-NS group. There was a significant protein effect on G:F ratio (p < 0.05) on week 1, with LP pigs having a lower G:F ratio compared to CON pigs (0.51 vs. 0.78). Additionally, the effect of PWA on G:F ratio was significant (p < 0.05) in week 1 and 2, with a dose-dependent increase on G:F ratio during the first week (0.50, 0.59, and 0.83) and a decrease in G:F ratio during the second week (0.77, 0.76 and 0.62) for NS, LS, and HS, respectively (Table 4). A significant protein effect (p < 0.05) was detected on weekly G:P ratio during weeks 2, 3, and 4, with a higher G:P ratio in pigs fed with LP diets than those fed with CON diets (3.88 vs. 3.31, 3.63 vs. 2.94 and 3.60 vs. 3.01, for weeks 2, 3 and 4, respectively). The effect of PWA on the G:P ratio in weeks 1 and 2 was significant. During week 1, increasing the levels of PWA, increased the G:P ratio (2.40, 2.76, and 3.72 for NS, LS, and HS, respectively). Pigs fed with LP-HS had a 57% increase and a 22% decrease in the G:P ratio compared to those fed with LP-NS, during the first and third week of this study, respectively. Pigs fed with LP-NS had a 43% and 32% greater G:P ratio than those fed with CON-NS during the third and fourth weeks of study, respectively (Table 4).

3.2. Muscle Fat and Lean Content

Muscle lean% and fat% are shown in Table 3. There was a significant effect of protein, PWA, and protein × PWA (p < 0.01) on muscle lean% and fat%. Pigs in the LP group had higher muscle lean% (85.1%) and lower fat% (13.9%) than those in the CON group (81.5% and 17.8% for lean and fat%, respectively). Supplementing diets with PWA dose-dependently increased muscle lean% (81.5%, 82.0%, and 86.6% for NS, LS, and HS, respectively) and decreased muscle fat% (17.9%, 17.1% and 12.7% for NS, LS, and HS, respectively). While there was no difference in muscle lean% and fat% of pigs in CON-LS, CON-HS, and CON-NS, pigs fed with LP-HS had 13% more lean and 55% less fat compared to those fed with LP-NS (Table 3).

3.3. Plasma Nitrogen-Containing Compounds

Plasma nitrogen-containing compounds are shown in Table 5. There was a significant effect of protein (p < 0.05) on the majority of plasma AA concentration. Overall, pigs fed LP diets had a lower concentration of plasma leucine, isoleucine, phenylalanine, histidine, arginine, valine, tyrosine, proline, and creatinine, and had higher plasma lysine, methionine, tryptophan, threonine, alanine, and glutamic acids than those fed with CON diets. Pigs fed with LP-NS had lower plasma valine, isoleucine, histidine and 3, methylhistidine, and higher lysine, serine, glycine, sarcosine, and alanine than CON-NS pigs (p < 0.05). Overall, pigs in the HS group had a higher concentration of methionine, tryptophan, leucine, isoleucine, valine, phenylalanine, arginine, serine, glutamine, and tyrosine compared to LS and NS groups. Pigs fed CON-HS had a higher plasma concentration of valine, isoleucine, leucine, phenylalanine, tryptophan, lysine, histidine, arginine, serine, glycine, alanine, tyrosine, asparagine, proline, and sarcosine and lower glutamic acid, aspartic acid, and taurine than CON-NS. Moreover, the plasma concentration of leucine, serine, glycine, proline, sarcosine, and alanine was higher, and methionine and lysine tended to be higher in pigs fed with CON-LS than those fed with CON-NS. Pigs fed with LP-LS had a higher (p < 0.05) plasma valine, histidine, and alanine and tended to have a higher plasma leucine, isoleucine, phenylalanine, and ornithine compared to those fed with LP-NS. The plasma concentration of histidine, serine, glutamic acid, taurine, and ammonia were lower and lysine and proline tended to be lower in the LP-HS group when compared to LP-NS (p < 0.05).

3.4. Apparent Fecal Digestibility of Calcium, Phosphorus, and Nitrogen

Pigs fed with CON-LS and CON-HS tended to have a lower AFD of Ca compared to those fed with CON-NS (Figure 1A). Additionally, pigs fed with LP-HS tended to have a higher AFD of Ca compared to pigs fed with LP-NS (Figure 1A). There were no differences in AFD of P (Figure 1B) and N (Figure 1C) across dietary groups.

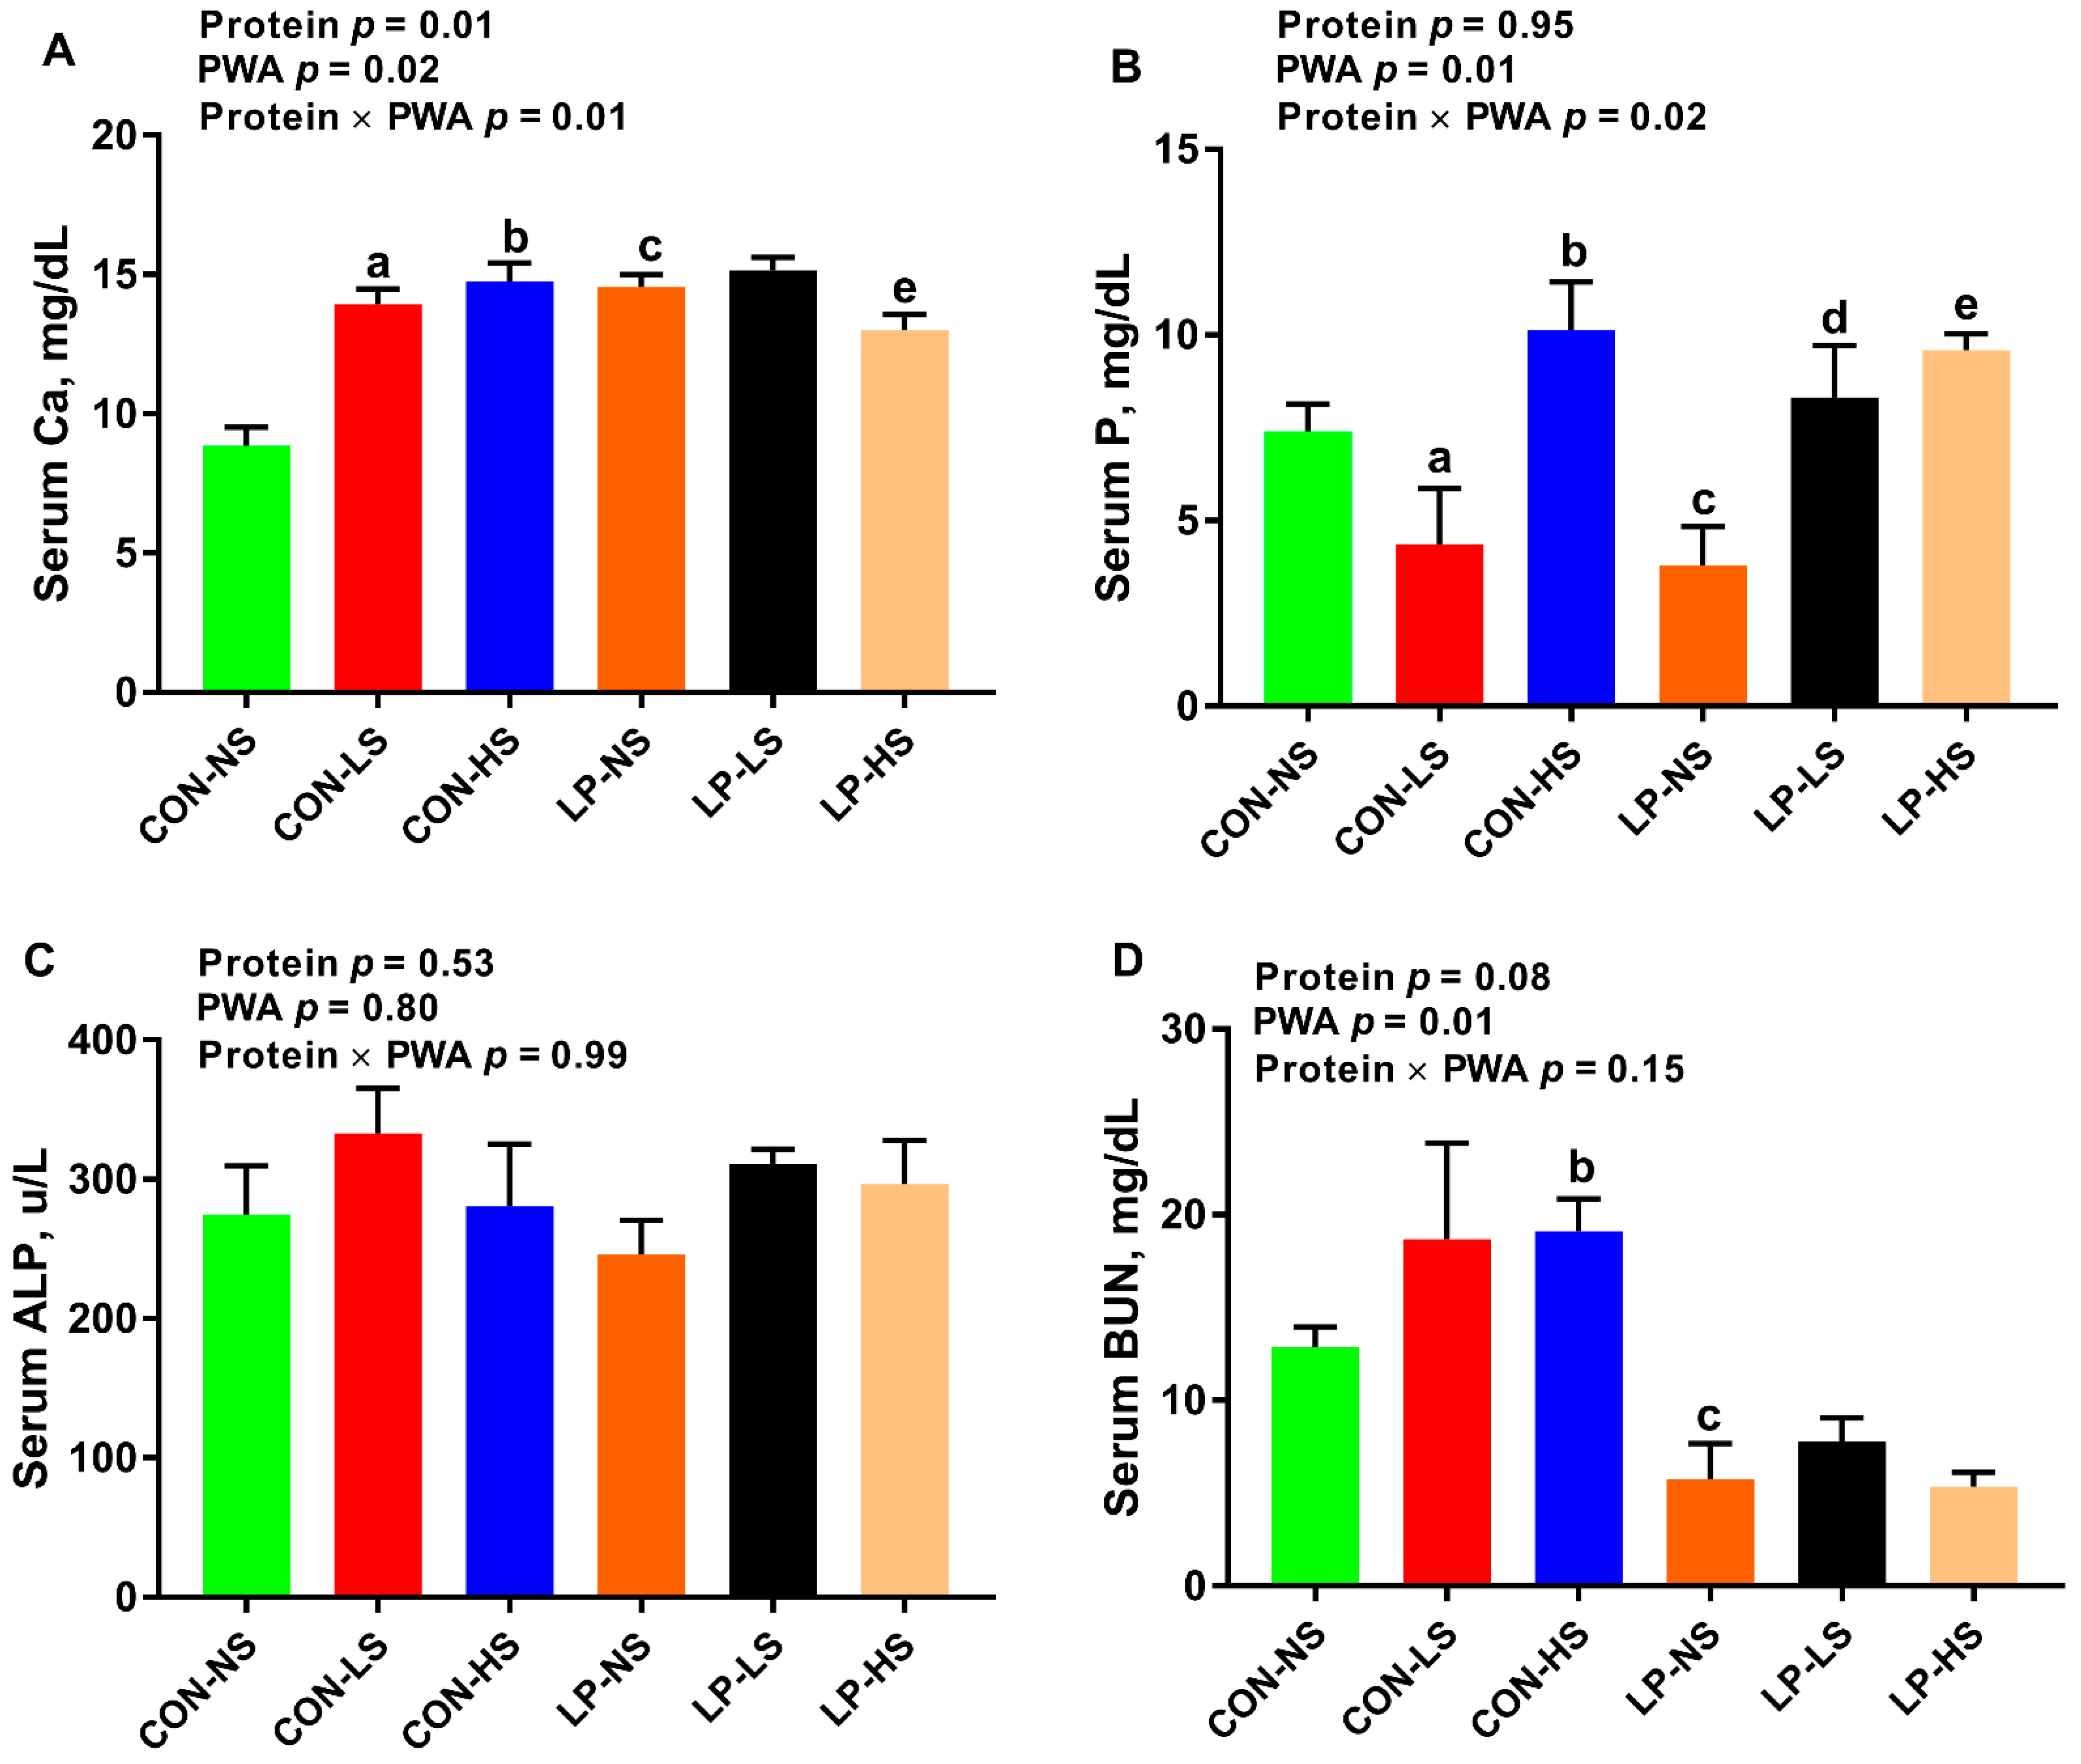
3.5. Serum Calcium, Phosphorus, and Alkaline Phosphatase and Blood Urea Nitrogen

There was a significant effect of protein, PWA and protein × PWA on serum Ca concentration (p < 0.05; Figure 2A). The serum Ca of pigs fed with LP was higher than CON pigs (14.14 vs. 12.50 mg/dL, respectively). The serum Ca concentration for pigs fed with NS, LS and HS were 12.08, 14.57 and 13.30 mg/dL, respectively. Pigs fed with CON-LS, CON-HS and LP-NS had higher serum Ca than animals fed with CON-NS. In addition, LP-HS pigs had a lower serum Ca compared to LP-NS ones (Figure 2A). The effect of PWA and protein × PWA on serum P was significant (p < 0.05; Figure 2B). Supplementation of PWA dose-dependently increased the serum P concentration (5.59, 6.03, and 9.72 mg/dL for NS, LS, and HS, respectively). Pigs fed with CON-HS had a higher (p < 0.05) serum P compared to those fed with CON-NS, but pigs in CON-LS group had lower serum P compared to those in CON-NS group (Figure 2B). Additionally, pigs fed LP-LS and LP-HS had an increased serum P compared to those fed with LP-NS (p < 0.05; Figure 2B). Alkaline phosphatase was used as a marker of bone turnover in the current study. No differences in serum ALP concentration were observed across groups (Figure 2C). The effect of protein on BUN tended to be significant (p = 0.08) with a decrease in serum BUN of LP compared to CON pigs (6.78 and 15.75 mg/dL, respectively) (Figure 2D). Pigs fed with CON-HS had a higher serum BUN compared to those fed with CON-NS. Additionally, pigs fed with LP-NS had a lower serum BUN compared to pigs fed with CON-NS (Figure 2D).

3.6. The mRNA Abundance of Amino Acid Transporters in the Jejunum and Skeletal Muscle

The effect of PWA and protein × PWA on mRNA abundance of solute carrier family 7 member 11 (SLC7A11) and solute carrier family 6 member 19 (SLC6A19) in the jejunum (Figure 3B,C) was significant. The relative mRNA abundance of SLC7A11 was 0.88, 0.76, and 0.61 for NS, LS, and HS, respectively. Further, the effect of PWA on solute carrier family 7 member 8 (SLC7A8) was significant (p < 0.05), with the relative mRNA abundance of 0.86, 0.81, and 0.56 for NS, LS, and HS, respectively (Figure 3G). Relative to CON-NS, the abundance of the SLC7A11 transcript was decreased (p < 0.05) in the jejunum of CON-LS, CON-HS, and LP-NS (Figure 3B). Pigs fed with CON-HS had a decreased mRNA abundance of SLC6A19 compared to those fed with CON-NS (Figure 3C). Pigs fed with LP-LS had an increased transcript of SLC6A19 compared to the LP-NS group (Figure 3C). No differences were seen among the treatments for the abundance of the transcript of solute carrier family 15 member 1 (SLC15A1), solute carrier family 3 member 1 (SLC3A1), solute carrier family 7 member 1 (SLC7A1), and solute carrier family 7 member 9 (SLC7A9) (Figure 3A,D–F) in the jejunum.
The effect of PWA on the mRNA abundance of SLC7A8, SLC3A1, SLC7A1, and SLC7A11 in skeletal muscle was significant (Figure 4B,D–F). The relative mRNA abundance for SLC7A8 were 1.14, 0.80 and 0.54, for SLC3A1 were 0.73, 0.87 and 0.37, for SLC7A1 were 1.07, 0.90, and 0.45 and for SLC7A11 were 1.32, 0.75 and 0.54 for NS, LS and HS, respectively. Pigs fed with CON-HS tended to have a lower SLC7A1 gene expression compared to those fed with CON-NS (Figure 4E). Additionally, pigs fed with LP-HS tended to decrease the abundance of the transcript of SLC7A1 compared to LP-NS (Figure 4E). No differences in the mRNA abundance of SLC15A1 and SLC6A19 among dietary treatments were observed in skeletal muscle (Figure 4A,C).

3.7. Serum Total Antioxidant Capacity

No differences in serum TAC were observed among dietary treatments, although the effect of protein × PWA on TAC was significant (Figure S2).

4. Discussion

The objective of this study was to assess the effect of a PWA on growth performance of nursery pigs fed with low-protein/high-carbohydrate or standard protein diets and the factors involved in this process. Our study revealed several important findings: (1) overall, supplemental PWA increased the ADG and tended to improve BW in CON-HS, but not in LP pigs, suggestive of a positive effect of PWA on growth performance when dietary protein is adequate; (2) regardless of dietary protein content, supplementing PWA increased muscle lean% and decreased muscle fat%, but this effect was significant when PWA was supplemented to LP diets at high dose (LP-HS), but not to CON diets, indicative of a promising effect of PWA on muscle composition when dietary protein is deficient; (3) supplementing CON pigs with a low or high dose of PWA increased the concentration of the majority of plasma essential AA and in LP pigs, a low dose of PWA (LP-LS) recovered the reduced AA levels such as branched-chain AA, phenylalanine, and histidine suggestive of improved digestion and absorption of proteins and AA by PWA; (4) supplementing LP pigs with PWA at high dose (LP-HS) reduced serum Ca concentration while supplementing CON pigs with both low and high doses of PWA increased the serum Ca concentration and decreased the AFD of Ca; (5) CON and LP pigs supplemented with a high dose of PWA had higher serum P concentration; (6) supplementing CON pigs, but not LP pigs, with a high dose of PWA decreased the mRNA abundance of SLC7A11 and SLC6A19 in the jejunum and supplementing both CON and LP pigs with a high dose of PWA tended to reduce the abundance of the SLC7A1 transcript in skeletal muscle. In summary, supplemental PWA improved growth performance when the dietary protein was adequate and the muscle composition when dietary protein was deficient, improved plasma AA profile, and produced differential effects on blood Ca and its digestibility depending on the level of dietary protein.
Little is known about whether supplemental phytogenic additives would improve the growth performance and meat composition of pigs fed with LP diets. Supplementation of PWA improved the ADG and body weight of pigs when diets contained recommended amounts of protein in the current study. Similarly, previous studies have shown a beneficial effect of phytogenic additives on growth performance in early weaned [16] and growing pigs [17] when diets with standard protein levels were fed. In the current study, PWA did not improve the performance of pigs fed with low-protein/high-carbohydrate diets. Likewise, others showed that supplementing very low-protein diets with a plant extract YGF251 did not influence the growth performance of growing pigs [20]. In the present study, the beneficial effects of PWA in pigs fed with CON diet could be due to the increased concentration of blood essential AA that may contribute to improving the growth of pigs, within their genetic potential. Others have reported an enhanced nutrient digestibility in response to supplemental phytogenic additives when pigs are fed with adequate-protein diets [18,24,25,26]. In parallel with our data, an increased serum Ca and other minerals were reported in broiler chicks following herbal extract supplementation [46]. In the current study, the concentration of blood Ca was dramatically increased in experimental diets up to ~15 mg/dL. It has been shown that most animals show systemic hypercalcemia signs when the concentration of Ca is greater than 15 mg/dL [47]. In another study, the concentration of Ca was increased to similar levels seen in our study with no clinical signs of illness when pigs were fed with calcium-replete and P-deficient diets [48]. Similarly, no clinical signs of hypercalcemia were observed in our animals. Hypercalcemia induced renal vasoconstriction, which is characterized by reduced renal blood flow and glomerular filtration rate was shown to occur in dogs with blood Ca concentration higher than 20 mg/dL [47]. Given the subclinical levels of blood Ca and no clinical signs of hypercalcemia in animals in the current study, no failure in kidney function was assumed in our animals. Further, the blood ALP as a marker of bone turnover did not change across dietary groups in the present study. Additional research will be needed to determine the effect of PWA on bone parameters such as bone ash, mineral contents and density. The reduced AFD of Ca in CON pigs supplemented with PWA is likely due to a negative feedback loop that inhibits the release of parathyroid hormone and vitamin D3 and Ca absorption when blood Ca is rising. Little is known about the effect of phytogenic additives on nutrient digestibility when pigs are offered LP diets. We observed a differential response of PWA on blood Ca and P concentration in the current study. Further research is warranted to elucidate the interaction of the dietary protein with PWA on nutrient digestibility. The data on the effect of PWA on muscle composition and its interaction with dietary protein are scarce. Our study showed that regardless of dietary protein content, supplementing PWA increased the lean% and decreased the fat% in the muscle in a dose-dependent manner but this effect was significant when PWA was supplemented to low-protein/high-carbohydrate diet at a high dose. In a recent study, treating porcine primary muscle cell lines with natural phytogenic compounds from fruit peel increased the expression of genes involved in muscle development, and in live animals, these compounds decreased back fat thickness [49]. The data from this study provide evidence that a novel PWA could be used to improve the growth performance and meat composition of nursery pigs. Whether or not the used PWA in the current study could potentially alter back fat thickness or the whole body composition of the carcass, additional research is required to answer that question. While our data show improvement in blood AA profile and increased Ca and P concentration following PWA supplementation, the mode of action of the PWA used in the present study on growth performance and muscle composition has not been fully explored and further studies are needed to better understand the pathways involved.
The positive effects of phytogenic additives on the growth performance of pigs have been linked with the beneficial effects of these additives on eating behavior [17,21], immune function [22,23], antioxidant capacity [24], and intestinal development, ecosystem, and nutrient digestibility [18,24,25,26]. However, less attention has been paid towards the changes in circulating AA while blood AA profile is highly associated with animal health and growth [50]. In the current study, regardless of the level of dietary protein, supplementing PWA improved the plasma AA concentration. More specifically, supplementing CON pigs with a low or high dose of PWA and LP pigs with a low dose of PWA improved the majority of plasma essential AA concentration. Similarly, others reported an increase in serum AA concentration when a phytogenic additive was added to a diet of weaned pigs fed with standard protein diets [51]. In support of data obtained in the present study, an increase in ileal AA digestibility was reported in weaned pigs supplemented with herbal extract, and that improvement was attributed to the positive effect of phytogenic additives on enhancing the functions of digestive enzymes in the gut [14,52]. The improved performance of pigs fed with an adequate-protein diet supplemented with PWA in the current study might be due to the increased concentration of essential AA in blood. Due to the complexity of the composition of herbal extracts containing a wide variety of compounds such as flavonoids, fatty acids, and protein, it remains to be determined whether a group of active compounds or a single chemical moiety of phytogenic additives is stimulating the increased blood AA concentration.
Amino acids are sensed and transported by specific AA transporters [53,54]. It is known that nutrient composition can alter intestinal AA transporter expression in pigs fed protein-deficient diets [32], but little is known about interactive effects of dietary protein and phytogenic additives on dynamics of these transporters in the gut and skeletal muscle. Supplementing CON pigs with a high dose of PWA decreased the abundance of the SLC7A11 and SLC6A19 transcripts in the jejunum and supplementing both CON and LP pigs with a high dose of PWA reduced the abundance of the SLC7A1 transcript in skeletal muscle. In contrast, others showed that incubating jejunal cells with the combination of essential oils and saponins at medium and high doses stimulated solute carrier family 15 member 1 (SLC15A1) recruitment to the cytoplasmic membrane in growing broilers [33]. These controversial results on the effect of PWA on the expression of AA transporters might be due to the differences in the composition and the dose of PWA used. SLC7A11 is a cystine/glutamate exchanger [55] and is specifically involved in the cysteine and glutamate transport system. The downregulation of jejunal SLC7A11 in the CON-HS group is likely contributing to the reduced plasma glutamic acid concentration in this group. SLC6A19 is the major neutral AA transporter in the small intestine and kidney [56]. Given the increased concentration of neutral AA including alanine, asparagine, glycine, isoleucine, leucine, phenylalanine, serine, proline, threonine, tryptophan, tyrosine, and valine in the CON-HS group, the reduced mRNA abundance of SLC6A19 in the jejunum is suggestive of a feedback regulatory mechanism in this process. A feedback regulatory mechanism has been described between cycling AA pool and expression of intestinal AA transporters [57]. Although the role of SLC71 is not very well known in skeletal muscle [58], there is evidence that accounts for arginine uptake [59,60]. The reduced expression of SLC7A1 in skeletal muscle of CON-HS and LP-HS groups and hence decreased uptake of arginine by skeletal muscle may contribute to the greater concentration of arginine in the circulation for these groups. The role of other basic and acidic transporters in the small intestine that contribute to improved AA profile in pigs supplemented with phytogenic additives requires further investigation.

5. Conclusions

Little research has been conducted to explore the interaction of phytogenic additives and dietary protein on growth performance and related underlying factors in young pigs. Overall, supplemental PWA (8 mL/L) increased the concentration of plasma essential AA and reduced the abundance of the transcript for some of the AA transporters in the small intestine and skeletal muscle, improved growth performance when the dietary protein content was adequate and increased muscle lean%, and reduced muscle fat% when the dietary protein was deficient. Depending on the level of dietary protein, supplementation of PWA had differential effects on plasma Ca concentration and its digestibility. Altogether, although the supplemental PWA used in this study failed to improve the growth performance of nursery pigs fed with LP diets, this additive improved the performance of pigs fed with standard protein diets likely through improved blood AA profile and had beneficial effects on muscle composition when dietary protein was deficient. Further research is warranted to elucidate the mechanisms controlling the interactive effects of dietary protein with phytogenic additives on nutrient digestibility and AA transport system. Since phytogenic additives contain a wide variety of bioactive compounds, further investigation is required to understand what active compound(s) of these additives is mediating their beneficial effects.

Supplementary Materials

The following are available online at https://www.mdpi.com/2076-2615/11/2/555/s1, Table S1: Ingredients and chemical composition of the phytogenic water additive used in this study; Figure S1: Body weight and feed intake of nursery pigs fed with two levels of dietary protein and three levels of a phytogenic water additive; Figure S2: Serum total antioxidant capacity of nursery pigs fed with two levels of dietary protein and three levels of a phytogenic water additive.

Author Contributions

Conceptualization, A.P.; methodology, C.N.S., M.H., J.S., J.B., J.B.-K. and A.P.; software, C.N.S.; validation, C.N.S. and A.P.; formal analysis, C.N.S.; investigation, C.N.S., and A.P.; resources, A.P.; data curation, C.N.S. and A.P.; writing—original draft preparation, C.N.S.; writing—review and editing, C.N.S., M.H., and A.P.; visualization, C.N.S. and A.P.; supervision, A.P.; project administration, A.P.; funding acquisition, A.P. All authors have read and agreed to the published version of the manuscript.

Funding

This research was funded by Herbanimals Supplement LLC and Animal Health and Production and Animal Products: Improved Nutritional Performance, Growth, and Lactation of Animals grant no. 2018-67016-27471/project accession no. 1014892, grant no. 2021-67016-33399/project accession no. 1024334 and by Hatch project accession no. 1012889 from the USDA National Institute of Food and Agriculture and by research assistantship funds from the Department of Animal and Food Sciences and Oklahoma Agricultural Experiment Station (Oklahoma State University).

Institutional Review Board Statement

The study was conducted according to the guidelines of the Declaration of Helsinki, and approved by the Institutional Review Board (or Ethics Committee) of Oklahoma State University (protocol code: AG-18-6; date of approval: 4/11/2018).

Data Availability Statement

All relevant data is listed in the manuscript.

Acknowledgments

Evonik Animal Nutrition donated some of the amino acids used in this study.

Conflicts of Interest

All authors declare no potential conflict of interests.

References

  1. Aarnink, A.J.A.; Verstegen, M.W.A. Nutrition, Key Factor to Reduce Environmental Load from Pig Production. Livest. Sci. 2007, 109, 194–203. [Google Scholar] [CrossRef]
  2. Jongbloed, A.W.; Lenis, N.P. Environmental Concerns about Animal Manure. J. Anim. Sci. 1998, 76, 2641–2648. [Google Scholar] [CrossRef]
  3. Shriver, J.A.; Carter, S.D.; Sutton, A.L.; Richert, B.T.; Senne, B.W.; Pettey, L.A. Effects of Adding Fiber Sources to Reduced-Crude Protein, Amino Acid-Supplemented Diets on Nitrogen Excretion, Growth Performance, and Carcass Traits of Finishing Pigs. J. Anim. Sci. 2003, 81, 492–502. [Google Scholar] [CrossRef] [Green Version]
  4. Heo, J.-M.; Kim, J.-C.; Hansen, C.F.; Mullan, B.P.; Hampson, D.J.; Pluske, J.R. Effects of Feeding Low Protein Diets to Piglets on Plasma Urea Nitrogen, Faecal Ammonia Nitrogen, the Incidence of Diarrhoea and Performance after Weaning. Arch. Anim. Nutr. 2008, 62, 343–358. [Google Scholar] [CrossRef]
  5. Le Bellego, L.; Noblet, J. Performance and Utilization of Dietary Energy and Amino Acids in Piglets Fed Low Protein Diets. Livest. Prod. Sci. 2002, 76, 45–58. [Google Scholar] [CrossRef]
  6. Ball, R.O.; Aherne, F.X. Influence of dietary nutrient density, level of feed intake and weaning age on young pigs. II. Apparent nutrient Digestibility and Incidence and Severity of Diarrhea. Can. J. Anim. Sci. 1987, 67, 1105–1115. [Google Scholar] [CrossRef]
  7. Yue, L.Y.; Qiao, S.Y. Effects of Low-Protein Diets Supplemented with Crystalline Amino Acids on Performance and Intestinal Development in Piglets over the First 2 Weeks after Weaning. Livest. Sci. 2008, 115, 144–152. [Google Scholar] [CrossRef]
  8. Kerr, B.J.; Yen, J.T.; Nienaber, J.A.; Easter, R.A. Influences of dietary protein level, amino acid supplementation and environmental temperature on performance, body composition, organ weights and total heat production of growing pigs. J. Anim. Sci. 2003, 81, 1998–2007. [Google Scholar] [CrossRef] [PubMed] [Green Version]
  9. Madrid, J.; Martínez, S.; López, C.; Orengo, J.; López, M.J.; Hernández, F. Effects of low protein diets on growth performance, carcass traits and ammonia emission of barrows and gilts. Anim. Prod. Sci. 2013, 53, 146–153. [Google Scholar] [CrossRef]
  10. Bartoš, P.; Dolan, A.; Smutný, L.; Šístková, M.; Celjak, I.; Šoch, M.; Havelka, Z. Effects of Phytogenic Feed Additives on Growth Performance and on Ammonia and Greenhouse Gases Emissions in Growing-Finishing Pigs. Anim. Feed Sci. Technol. 2016, 212, 143–148. [Google Scholar] [CrossRef]
  11. Karásková, K.; Suchý, P.; Straková, E. Current Use of Phytogenic Feed Additives in Animal Nutrition: A Review. Czech J. Anim. Sci. 2015, 60, 521–530. [Google Scholar] [CrossRef] [Green Version]
  12. Papatsiros, V.G.; Tzika, E.D.; Tassis, P.D.; Kantas, D.; Filippopoulos, L.C.; Papaioannou, D.S. Greek Experience of the Use of Phytogenic Feed Additives in Organic Pig Farming. J. Cell Anim. Biol. 2011, 5, 320–323. [Google Scholar] [CrossRef] [Green Version]
  13. Zeng, Z.; Zhang, S.; Wang, H.; Piao, X. Essential Oil and Aromatic Plants as Feed Additives in Non-Ruminant Nutrition: A Review. J. Anim. Sci. Biotech. 2015, 6, 1–10. [Google Scholar] [CrossRef] [PubMed] [Green Version]
  14. Windisch, W.; Schedle, K.; Plitzner, C.; Kroismayr, A. Use of Phytogenic Products as Feed Additives for Swine and Poultry. J. Anim. Sci. 2008, 86 (Suppl. 14), E140–E148. [Google Scholar] [CrossRef]
  15. Krauze, M.; Abramowicz, K.; Ognik, K. The Effect of Addition of Probiotic Bacteria (Bacillus subtilis or Enterococcus faecium) or Phytobiotic Containing Cinnamon Oil to Drinking Water on the Heath and Performance of Broiler Chickens. Ann. Anim. Sci. 2020, 20, 191–205. [Google Scholar] [CrossRef] [Green Version]
  16. Kong, X.F.; Wu, G.Y.; Liao, Y.P.; Hou, Z.P.; Liu, H.J.; Yin, F.G.; Li, T.J.; Huang, R.L.; Zhang, Y.M.; Deng, D.; et al. Effects of Chinese Herbal Ultra-Fine Powder as a Dietary Additive on Growth Performance, Serum Metabolites and Intestinal Health in Early-Weaned Piglets. Livest. Sci. 2007, 108, 272–275. [Google Scholar] [CrossRef]
  17. Yan, L.; Meng, Q.W.; Kim, I.H. The Effect of an Herb Extract Mixture on Growth Performance, Nutrient Digestibility, Blood Characteristics and Fecal Noxious Gas Content in Growing Pigs. Livest. Sci. 2011, 141, 143–147. [Google Scholar] [CrossRef]
  18. Manzanilla, E.G.; Pérez, J.F.; Martín, M.; Blandón, J.C.; Baucells, F.; Kamel, C.; Gasa, J. Dietary Protein Modifies Effect of Plant Extracts in the Intestinal Ecosystem of the Pig at Weaning. J. Anim. Sci. 2009, 87, 2029–2037. [Google Scholar] [CrossRef] [PubMed] [Green Version]
  19. Abousekken, M. Performance, Immune Response and Carcass Quality of Broilers Fed Low Protein Diets Contained Either Moringa oleifera Leaves Meal or Its Extract. J. Am. Sci. 2015, 11, 153–164. [Google Scholar]
  20. Lei, X.J.; Lee, S.I.; Kim, I.H. Effects of Different Levels of Dietary Protein with or without Plant Extract YGF251 on Growth Performance, Nutrient Digestibility, Blood Profiles, Fecal Microbial Shedding, and Fecal Gas Emission in Growing Pigs. Anim. Sci. J. 2019, 90, 547–553. [Google Scholar] [CrossRef] [PubMed]
  21. Wenk, C. Herbs and Botanicals as Feed Additives in Monogastric Animals. Asian Australas. J. Anim. Sci. 2003, 16, 282–289. [Google Scholar] [CrossRef]
  22. Nofrarias, M.; Manzanilla, E.G.; Pujols, J.; Gibert, X.; Majo, N.; Segalés, J.; Gasa, J. Effects of spray-dried porcine plasma and plant extracts on intestinal morphology and on leukocyte cell subsets of weaned pigs. J. Anim. Sci. 2006, 84, 2735–2742. [Google Scholar] [CrossRef]
  23. Manzanilla, E.G.; Nofrarías, M.; Anguita, M.; Castillo, M.; Perez, J.F.; Martín-Orúe, S.M.; Kamel, C.; Gasa, J. Effects of Butyrate, Avilamycin, and a Plant Extract Combination on the Intestinal Equilibrium of Early-Weaned Pigs. J. Anim. Sci. 2006, 84, 2743–2751. [Google Scholar] [CrossRef]
  24. Li, P.; Piao, X.; Ru, Y.; Han, X.; Xue, L.; Zhang, H. Effects of Adding Essential Oil to the Diet of Weaned Pigs on Performance, Nutrient Utilization, Immune Response and Intestinal Health. Asian Australas. J. Anim. Sci. 2012, 25, 1617–1626. [Google Scholar] [CrossRef] [Green Version]
  25. Yan, L.; Wang, J.P.; Kim, H.J.; Meng, Q.W.; Ao, X.; Hong, S.M.; Kim, I.H. Influence of Essential Oil Supplementation and Diets with Different Nutrient Densities on Growth Performance, Nutrient Digestibility, Blood Characteristics, Meat Quality and Fecal Noxious Gas Content in Grower-Finisher Pigs. Livest. Sci. 2010, 128, 115–122. [Google Scholar] [CrossRef]
  26. Diao, H.; Zheng, P.; Yu, B.; He, J.; Mao, X.; Yu, J.; Chen, D. Effects of Benzoic Acid and Thymol on Growth Performance and Gut Characteristics of Weaned Piglets. Asian Australas. J. Anim. Sci. 2015, 28, 827–839. [Google Scholar] [CrossRef] [Green Version]
  27. Sánchez, C.J.; Martínez-Miró, S.; Ariza, J.J.; Madrid, J.; Orengo, J.; Aguinaga, M.A.; Baños, A.; Hernández, F. Effect of Alliaceae Extract Supplementation on Performance and Intestinal Microbiota of Growing-Finishing Pig. Animals 2020, 10, 1557. [Google Scholar] [CrossRef] [PubMed]
  28. Xue, P.C.; Ragland, D.; Adeola, O. Influence of Dietary Crude Protein and Phosphorus on Ileal Digestion of Phosphorus and Amino Acids in Growing Pigs. J. Anim. Sci. 2017, 95, 2071–2079. [Google Scholar] [CrossRef]
  29. Xue, P.C.; Ajuwon, K.M.; Adeola, O. Phosphorus and Nitrogen Utilization Responses of Broiler Chickens to Dietary Crude Protein and Phosphorus Levels. Poult. Sci. 2016, 95, 2615–2623. [Google Scholar] [CrossRef]
  30. Spring, S.; Premathilake, H.; DeSilva, U.; Shili, C.; Carter, S.; Pezeshki, A. Low Protein-High Carbohydrate Diets Alter Energy Balance, Gut Microbiota Composition and Blood Metabolomics Profile in Young Pigs. Sci. Rep. 2020, 10. [Google Scholar] [CrossRef]
  31. Spring, S.; Premathilake, H.; Bradway, C.; Shili, C.; DeSilva, U.; Carter, S.; Pezeshki, A. Effect of Very Low-Protein Diets Supplemented with Branched-Chain Amino Acids on Energy Balance, Plasma Metabolomics and Fecal Microbiome of Pigs. Sci. Rep. 2020, 10. [Google Scholar] [CrossRef]
  32. Zhang, S.; Qiao, S.; Ren, M.; Zeng, X.; Ma, X.; Wu, Z.; Thacker, P.; Wu, G. Supplementation with Branched-Chain Amino Acids to a Low-Protein Diet Regulates Intestinal Expression of Amino Acid and Peptide Transporters in Weanling Pigs. Amino Acids 2013, 45, 1191–1205. [Google Scholar] [CrossRef]
  33. Reyer, H.; Zentek, J.; Männer, K.; Youssef, I.M.; Aumiller, T.; Weghuber, J.; Wimmers, K.; Mueller, A.S. Possible Molecular Mechanisms by Which an Essential Oil Blend from Star Anise, Rosemary, Thyme, and Oregano and Saponins Increase the Performance and Ileal Protein Digestibility of Growing Broilers. J. Agric. Food Chem. 2017, 65, 6821–6830. [Google Scholar] [CrossRef]
  34. Omar, J.A.; Hejazi, A.; Badran, R. Performance of broilers supplemented with natural herb extract. J. Anim. Sci. 2016, 6, 68–74. [Google Scholar] [CrossRef] [Green Version]
  35. National Research Council. Nutrient Requirements of Swine: Eleventh Revised Edition; The National Academies Press: Washington, DC, USA, 2012. [Google Scholar]
  36. Shili, C.N.; Broomhead, J.N.; Spring, S.C.; Lanahan, M.B.; Pezeshki, A. A Novel Corn-Expressed Phytase Improves Daily Weight Gain, Protein Efficiency Ratio and Nutrients Digestibility and Alters Fecal Microbiota in Pigs Fed with Very Low Protein Diets. Animals 2020, 10, 1926. [Google Scholar] [CrossRef]
  37. Horwitz, W. Official Methods of Analysis of AOAC International. Volume I, Agricultural Chemicals, Contaminants, Drugs/Edited by William Horwitz; AOAC International: Gaithersburg, MD, USA, 2010. [Google Scholar]
  38. Cooper, C.; Packer, N.; Williams, K. Amino Acid Analysis Protocols; Springer Science & Business Media: Totowa, NJ, USA, 2001; Volume 159. [Google Scholar]
  39. Pezeshki, A.; Muench, G.P.; Chelikani, P.K. Short Communication: Expression of Peptide YY, Proglucagon, Neuropeptide Y Receptor Y2, and Glucagon-like Peptide-1 Receptor in Bovine Peripheral Tissues. J. Dairy Sci. 2012, 95, 5089–5094. [Google Scholar] [CrossRef] [PubMed]
  40. Thongsong, B.; Wiyaporn, M.; Kalandakanond-Thongsong, S. Blood Glucose, Amino Acid Profiles and Nutrient Transporter Gene Expressions in the Small Intestine of Low and Normal Birthweight Piglets during the Early Suckling Period. Vet. J. 2019, 247, 1–7. [Google Scholar] [CrossRef]
  41. Wang, H.; Ji, Y.; Wu, G.; Sun, K.; Sun, Y.; Li, W.; Wang, B.; He, B.; Zhang, Q.; Dai, Z.; et al. L-Tryptophan Activates Mammalian Target of Rapamycin and Enhances Expression of Tight Junction Proteins in Intestinal Porcine Epithelial Cells. J. Nutr. 2015, 145, 1156–1162. [Google Scholar] [CrossRef] [Green Version]
  42. Vigors, S.; Sweeney, T.; O’Shea, C.J.; Browne, J.A.; O’Doherty, J.V. Improvements in Growth Performance, Bone Mineral Status and Nutrient Digestibility in Pigs Following the Dietary Inclusion of Phytase Are Accompanied by Modifications in Intestinal Nutrient Transporter Gene Expression. Br. J. Nutr. 2014, 112, 688–697. [Google Scholar] [CrossRef] [Green Version]
  43. Yin, J.; Liu, M.; Ren, W.; Duan, J.; Yang, G.; Zhao, Y.; Fang, R.; Chen, L.; Li, T.; Yin, Y. Effects of Dietary Supplementation with Glutamate and Aspartate on Diquat-Induced Oxidative Stress in Piglets. PLoS ONE 2015, 10, e0122893. [Google Scholar] [CrossRef] [Green Version]
  44. Schmittgen, T.D.; Livak, K.J. Analyzing Real-Time PCR Data by the Comparative CT Method. Nat. Protoc. 2008, 3, 1101–1108. [Google Scholar] [CrossRef]
  45. Benjamini, Y.; Hochberg, Y. Controlling the False Discovery Rate: A Practical and Powerful Approach to Multiple Testing. J. R. Stat. Soc. Ser. B 1995, 57, 289–300. [Google Scholar] [CrossRef]
  46. Safdar, K.; Muhammad, K.; Naz, R. Effect of Herbal Extracts on Serum Minerals, Lipid Profile and Anti-NDV-HI Antibody Levels of Vaccinated Broiler Chicks. Pak. J. Zool. 2016, 48, 1715–1719. [Google Scholar]
  47. Schenck, P.A.; Chew, D.J.; Nagode, L.A.; Rosol, T. Disorders of Calcium: Hypercalcemia and Hypocalcemia. Fluid Electrolyte Acid Base Disord. Small Anim. Pract. 2006, 4, 122–194. [Google Scholar] [CrossRef]
  48. Hagemoser, W.A.; Goff, J.P.; Sanderson, T.P.; Haynes, J.S. Osteopenic Disease in Growing Pigs: Diagnostic Methods Using Serum and Urine Calcium and Phosphorus Values, Parathormone Assay, and Bone Analysis. J. Vet. Diagn. Investig. 2000, 12, 524–534. [Google Scholar] [CrossRef] [Green Version]
  49. Kim, Y.-J.; Kim, J.-H.; Kim, J.-W.; Kim, S.-H.; Eun, J.-S.; Hong, S.-M. PSVIII-17 In Vitro and in Vivo Investigations of Effects of Natural Phytogenic Compounds on Muscle Cell Gene Expressions and Growth Performance and Carcass Composition of Finishing Pigs. J. Anim. Sci. 2019, 97 (Suppl. 3), 303–304. [Google Scholar] [CrossRef]
  50. Wu, G.; Bazer, F.W.; Dai, Z.; Li, D.; Wang, J.; Wu, Z. Amino Acid Nutrition in Animals: Protein Synthesis and Beyond. Annu. Rev. Anim. Biosci. 2014, 2, 387–417. [Google Scholar] [CrossRef]
  51. Kong, X.; Wu, G.; Yin, Y. Roles of Phytochemicals in Amino Acid Nutrition. Front. Biosci. 2011, 3, 372–384. [Google Scholar]
  52. Lan, R.X.; Li, T.S.; Kim, I.H. Effects of Essential Oils Supplementation in Different Nutrient Densities on Growth Performance, Nutrient Digestibility, Blood Characteristics and Fecal Microbial Shedding in Weaning Pigs. Anim. Feed Sci. Technol. 2016, 214, 77–85. [Google Scholar] [CrossRef]
  53. Kanai, Y.; Hediger, M.A. The Glutamate and Neutral Amino Acid Transporter Family: Physiological and Pharmacological Implications. Eur. J. Pharmacol. 2003, 479, 237–247. [Google Scholar] [CrossRef]
  54. Burckhardt, B.C.; Burckhardt, G. Interaction of Excitatory Amino Acid Transporters 1–3 (EAAT1, EAAT2, EAAT3) with N-Carbamoylglutamate and N-Acetylglutamate. Cell. Physiol. Biochem. 2017, 43, 1907–1916. [Google Scholar] [CrossRef] [PubMed] [Green Version]
  55. Lim, J.C.; Donaldson, P.J. Focus on Molecules: The Cystine/Glutamate Exchanger (System x(c)(−)). Exp. Eye Res. 2011, 92, 162–163. [Google Scholar] [CrossRef] [PubMed]
  56. Bröer, A.; Klingel, K.; Kowalczuk, S.; Rasko, J.E.J.; Cavanaugh, J.; Bröer, S. Molecular Cloning of Mouse Amino Acid Transport System B0, a Neutral Amino Acid Transporter Related to Hartnup Disorder. J. Biol. Chem. 2004, 279, 24467–24476. [Google Scholar] [CrossRef] [PubMed] [Green Version]
  57. Yin, J.; Ren, W.; Duan, J.; Wu, L.; Chen, S.; Li, T.; Yin, Y.; Wu, G. Dietary Arginine Supplementation Enhances Intestinal Expression of SLC7A7 and SLC7A1 and Ameliorates Growth Depression in Mycotoxin-Challenged Pigs. Amino Acids 2014, 46, 883–892. [Google Scholar] [CrossRef] [PubMed]
  58. Drummond, M.J.; Fry, C.S.; Glynn, E.L.; Timmerman, K.L.; Dickinson, J.M.; Walker, D.K.; Gundermann, D.M.; Volpi, E.; Rasmussen, B.B. Skeletal Muscle Amino Acid Transporter Expression Is Increased in Young and Older Adults Following Resistance Exercise. J. Appl. Physiol. 2011, 111, 135–142. [Google Scholar] [CrossRef] [Green Version]
  59. Hyde, R.; Taylor, P.M.; Hundal, H.S. Amino Acid Transporters: Roles in Amino Acid Sensing and Signalling in Animal Cells. Biochem. J. 2003, 373, 1–18. [Google Scholar] [CrossRef] [Green Version]
  60. Verrey, F.; Closs, E.I.; Wagner, C.A.; Palacin, M.; Endou, H.; Kanai, Y. CATs and HATs: The SLC7 Family of Amino Acid Transporters. Pflug. Arch. 2004, 447, 532–542. [Google Scholar] [CrossRef] [Green Version]
Figure 1. Apparent fecal digestibility (AFD) of (A) calcium (Ca), (B) phosphorus (P) and (C) nitrogen (N) of nursery pigs fed with two levels of dietary protein and three levels of a phytogenic water additive (PWA). CON-NS: control diet with no PWA supplemented, CON-LS: control diet with a low dose of PWA (4 mL/L of water) supplemented, CON-HS: control diet with a high dose of PWA (8 mL/L of water) supplemented, LP-NS: low-protein diet with no PWA added, LP-LS: low-protein diet with a low dose of PWA (4 mL/L of water) added and LP-HS: low-protein diet with a high dose of PWA (8 mL/L of water) added. *$# Among groups, values with a common superscript symbol tend to be different (0.05 < p ≤ 0.1). Values are the means ± SEM. n = 8/dietary group.
Animals 11 00555 g001
Figure 2. Serum (A) calcium (Ca), (B) phosphorus (P), (C) alkaline phosphatase (ALP) and (D) blood urea nitrogen (BUN) of nursery pigs fed with two levels of dietary protein and three levels of a phytogenic water additive (PWA). CON-NS: control diet with no PWA supplemented, CON-LS: control diet with a low dose of PWA (4 mL/L of water) supplemented, CON-HS: control diet with a high dose of PWA (8 mL/L of water) supplemented, LP-NS: low-protein diet with no PWA added, LP-LS: low-protein diet with a low dose of PWA (4 mL/L of water) added and LP-HS: low-protein diet with a high dose of PWA (8 mL/L of water) added. a p ≤ 0.05 CON-NS vs. CON-LS, b p ≤ 0.05 CON-NS vs. CON-HS, c p ≤ 0.05 CON-NS vs. LP-NS, d p ≤ 0.05 LP-NS vs. LP-LS, and e p ≤ 0.05 LP-NS vs. LP-HS. Values are the means ± SEM. n = 7–8 for each dietary group.
Animals 11 00555 g002
Figure 3. Relative mRNA abundance of (A) solute carrier family 15 member 1 (SLC15A1), (B) solute carrier family 7 member 11 (SLC7A11), (C) solute carrier family 6 member 19 (SLC6A19), (D) solute carrier family 3 member 1 (SLC3A1), (E) solute carrier family 7, member 1 (SLC7A1), (F) solute carrier family 7 member 9 (SLC7A9), and (G) solute carrier family 7 member 8 (SLC7A8) in the jejunum of nursery pigs fed with two levels of dietary protein and three levels of a phytogenic water additive (PWA). CON-NS: control diet with no PWA supplemented, CON-LS: control diet with a low dose of PWA (4 mL/L of water) supplemented, CON-HS: control diet with a high dose of PWA (8 mL/L of water) supplemented, LP-NS: low-protein diet with no PWA added, LP-LS: low-protein diet with a low dose of PWA (4 mL/L of water) added and LP-HS: low-protein diet with a high dose of PWA (8 mL/L of water) added. a p ≤ 0.05 CON-NS vs. CON-LS, b p ≤ 0.05 CON-NS vs. CON-HS, c p ≤ 0.05 CON-NS vs. LP-NS, d p ≤ 0.05 LP-NS vs. LP-LS. Values are the means ± SEM. n = 8 for each dietary group.
Animals 11 00555 g003
Figure 4. Relative mRNA abundance of (A) solute carrier family 15 member 1 (SLC15A1), (B) solute carrier family 7 member 8 (SLC7A8), (C) solute carrier family 6 member 19 (SLC6A19), (D) solute carrier family 3 member 1 (SLC3A1), (E) solute carrier family 7, member 1 (SLC7A1), and (F) solute carrier family 7 member 11 (SLC7A11) in the skeletal muscle of nursery pigs fed with two levels of dietary protein and three levels of a phytogenic water additive (PWA). CON-NS: control diet with no PWA supplemented, CON-LS: control diet with a low dose of PWA (4 mL/L of water) supplemented, CON-HS: control diet with a high dose of PWA (8 mL/L of water) supplemented, LP-NS: low-protein diet with no PWA added, LP-LS: low-protein diet with a low dose of PWA (4 mL/L of water) added and LP-HS: low-protein diet with a high dose of PWA (8 mL/L of water) added. *# Among groups, values with a common superscript symbol tend to be different (0.05 < p ≤ 0.1). Values are the means ± SEM. n = 8 for each dietary group.
Animals 11 00555 g004
Table 1. Ingredients and chemical composition of experimental diets (as-fed basis).
Diets 1
N1N2N3
CONLPCONLP
Ingredients, %
Corn, yellow dent 232.2145.0464.7257.0673.49
Soybean meal, 47.5% CP 215.0036.2213.9438.3919.95
Fish meal, menhaden 26.004.904.982.072.11
Whey, dried 225.005.875.97--
Lactose 27.00----
Corn starch 2-5.875.97--
Plasma spray-dried 26.00----
Soy protein concentrate 22.20----
Soybean oil 24.00----
Dicalcium phosphate 20.670.760.850.991.15
Limestone 20.450.540.670.620.68
Nursery vitamin premix 30.050.190.190.180.20
Salt 20.500.490.500.570.52
Chromium oxide 2-0.500.500.500.52
Trace mineral premix 40.060.070.060.070.08
Selplex 20.05----
Choline Cl 20.03----
Zinc oxide, 72% Zn 20.35----
L-Lysine, sulfate 20.17-1.12-0.88
DL-Methionine 20.18-0.14-0.08
L-Threonine 20.07-0.28-0.22
L-Tryptophan 2--0.13-0.10
Calculated Chemical Composition 5
Dry matter, %92.3490.7290.7289.6689.60
ME, Mcal/kg3.523.403.403.303.32
Crude protein, %22.9924.7117.0324.2617.83
Crude fiber, %1.392.312.012.642.39
Crude fat, % 6.683.363.463.573.66
Nitrogen, % 3.653.952.723.882.85
Calcium, %0.890.800.800.700.70
Phosphorous, %0.790.710.630.680.62
Available phosphorous, %0.590.400.400.320.33
SID Lysine, % 1.541.351.351.241.23
SID Threonine, % 0.970.840.800.800.76
SID Methionine, %0.510.380.410.360.35
SID Tryptophan, %0.270.270.280.270.27
Analyzed Chemical Composition 6
Dry matter, %90.1089.0087.0091.3087.40
Crude protein, %22.7024.7017.3023.0017.70
Carbohydrate, % kcal45.3370.2179.9877.7986.10
Crude fiber, %1.302.001.603.502.10
Calcium, %0.850.810.820.800.85
Phosphorus, %0.750.650.560.700.61
Nitrogen, %3.603.902.803.682.80
1 CON: standard protein diet; LP: low-protein diet, N1: nursery phase 1, fed for one week of study (from d 1 to 7); N2: nursery phase 2, fed for two weeks of study (from day 8 to 21; 7–11 kg body weight); N3: nursery phase 3, fed for three weeks of study (from day 22 to 42; 11–25 kg body weight). 2 Corn, fish meal, soybean meal, whey, lactose, corn starch, plasma spray-dried, soy protein concentrate, soybean oil, dicalcium phosphate, limestone, salt, and choline chloride (Cl) were obtained from Nutra Blend, LLC (Neosho, MO, USA). DL-methionine (99%) (MetAMINO®) and L-lysine, sulfate (Biolys®) were obtained from Evonik (Kennesaw, GA, USA). L-threonine (98.5%) and L-tryptophan (98%) were obtained from Ajinomoto (Overland Park, KS, USA). Chromium oxide was purchased from Fisher Scientific (Bartlesville, OK, USA). Selplex was obtained from Alltech (Lexington, KY, USA). 3 Vitamins premix was purchased from Nutra Blend, LLC (Neosho, MO, USA). Vitamins premix contained: vitamin A, 1,650,000 IU/kg; vitamin D3, 660,000 IU/kg; vitamin E, 17,600 IU/kg; vitamin B12, 13.2 mg/kg; vitamin K (menadione), 1320 mg/kg; niacin, 19,800 mg/kg; D-pantothenic acid, 11,000 mg/kg; riboflavin, 3300 mg/kg; phytase, 300,000 FYT/kg. 4 Trace minerals premix was purchased from Nutra Blend, LLC (Neosho, MO, USA). Trace minerals premix contained: iron, 73,000 ppm; zinc, 73,000 ppm; manganese, 22,000 ppm; copper, 11,000 ppm; iodine, 198 ppm; selenium, 198 ppm. 5 Values were calculated using National Swine Nutrition Guide (NSNG; V 2.0). 6 Diets were analyzed by ServiTech (Dodge City, KS, USA). The carbohydrate (% kcal of gross energy) was calculated from the estimated caloric value of carbohydrates at 4 kcal/g.
Table 2. Primer sequences, forward (F) and reverse (R), location on the template, amplicon size (bp), and GenBank accession numbers for both target and reference genes for reverse transcription-quantitative real-time polymerase chain reaction (RT-qPCR).
Genes 1Sequence (5′ → 3′)Location on TemplateAmplicon Length (bp)GenBank Accession Number
SLC15A1F: AGCATCTTCTTCATCGTGGTCAA
R: GTCTTGAACTTCCCCAGCCA
43–65
229–248
206NM_214347.1
SLC7A9F: ATCGGTCTGGCGTTTTAT
R: GGATCTAGCACCCTGTCA
816–833
943–960
145XM_021093176.1
SLC7A8F: TTTCCAGGAACCTGACATCG
R: ACATTGCAGTGACATAAGCG
576–595
756–775
200XM_003128550.6
SLC6A19F: CACAACAACTGCGAGAAGGA
R: CCGTTGATAAGCGTCAGGAT
1101–1120
1236–1255
155XM_003359855.4
SLC3A1F: TTTCCGCAATCCTGATGTTC
R: GGGTCTTATTCACTTGGGTC
1107–1126
1233–1252
146NM_001123042.1
SLC7A11F: CGGCTCCTGGGAAATTTCTC
R: ACCATTCATGGAGCCAAAGC
1297–1316
1349–1368
72XM_021101587.1
SLC7A1F: TCTCATCCTAACGGGACTTTTAACTC
R: GACCAGAACGTTGATACACGTGAA
2525–2550
2586–2609
85XM_021065165.1
β-ActinF: CTGCGGCATCCACGAAACT
R: AGGGCCGTGATCTCCTTCTG
944–962
1071–1090
147XM_021086047.1
1SLC15A1: solute carrier family 15 member 1 [40], SLC7A9: solute carrier family 7 member 9 [40], SLC7A8: solute carrier family 7 member 8 [40], SLC6A19: solute carrier family 6 member 19 [41], SLC3A1: solute carrier family 3 member 1 [41], SLC7A11: solute carrier family 7 member 11 [41], SLC7A1: solute carrier family 7 member 1 [42], and β-actin: beta-actin [43]. F: forward (sense) primer; R: reverse (antisense) primer.
Table 3. Growth performance and muscle fat and lean content of nursery pigs fed with two levels of dietary protein and three levels of a phytogenic water additive.
Diets 1SEM 2p-Value
ParametersCON-NSCON-LSCON-HSLP-NSLP-LSLP-HSProteinPWA 3Protein × PWA
Initial BW 4, kg8.829.109.639.058.768.760.170.360.780.46
Final BW 4, kg25.34 *26.0829.09 *24.8925.0023.250.560.020.720.09
ADG 4, kg/d0.590.600.70 b0.570.580.520.010.010.750.07
ADFI 4, kg/d0.860.950.970.840.910.860.020.230.300.69
ADWI 4, L/d3.092.984.172.783.54 d2.980.170.350.310.12
G:F 4, kg/kg0.690.630.720.670.620.610.010.010.970.72
G:P 4, kg/kg2.972.833.093.83 c3.583.380.090.010.330.12
Muscle lean%82.8383.3586.0078.5880.3288.7 e0.860.010.010.01
Muscle fat%16.6216.0613.5120.8513.339.41 e0.820.010.010.01
1 CON-NS: control diet with no phytogenic water additive (PWA) supplemented, CON-LS: control diet with a low dose of PWA (4 mL/L of water) supplemented, CON-HS: control diet with a high dose of PWA (8 mL/L of water) supplemented, LP-NS: low-protein diet with no PWA added, LP-LS: low-protein diet with a low dose of PWA (4 mL/L of water) added and LP-HS: low-protein diet with a high dose of PWA (8 mL/L of water) added. Values are the means. n = 8/diet. 2 SEM: standard error of the mean. 3 PWA: phytogenic water additive. 4 BW: body weight; ADG: average daily gain; ADFI: average daily feed intake; ADWI: average daily water intake; G:F: gain:feed ratio; G:P: gain:protein ratio. b p ≤ 0.05 CON-NS vs. CON-HS, c p ≤ 0.05 CON-NS vs. LP-NS, d p ≤ 0.05 LP-NS vs. LP-LS, and e p ≤ 0.05 LP-NS vs. LP-HS. * Within a row, values with a common superscript symbol tend to be different (0.05 < p ≤ 0.1).
Table 4. Weekly growth performance of nursery pigs fed with two levels of dietary protein and three levels of a phytogenic water additive.
Diets 1SEM 2p-Value
ParametersCON-NSCON-LSCON-HSLP-NSLP-LSLP-HSProteinPWA 3Protein × PWA
BWG 4, kg
Wk 11.982.322.971.361.242.770.120.040.470.18
Wk 2 4.054.244.203.334.133.220.130.030.190.41
Wk 35.014.804.914.965.093.900.180.390.470.20
Wk 45.485.887.37 b6.225.774.750.210.140.770.03
CFI 4, kg
Wk1 3.353.633.762.973.103.820.140.320.190.69
Wk 25.115.836.174.615.335.800.190.210.040.98
Wk 37.307.727.386.797.836.850.220.490.340.80
Wk 48.288.929.679.339.497.860.250.890.720.05
CPI 4, kg
Wk1 0.830.900.930.510.540.660.030.010.260.84
Wk 21.17 *#1.341.41 #0.81 *$0.941.02 $0.040.010.040.97
Wk 31.67 *1.771.691.20 *1.381.210.050.010.380.89
Wk 41.892.182.251.621.641.330.060.010.420.03
CWI 4, L
Wk 1 12.3115.9514.4512.4210.9013.950.920.340.730.46
Wk 224.1923.1825.0212.54 c19.5222.93 e1.500.050.300.36
Wk 325.5122.9030.7126.0929.9823.651.550.960.930.20
Wk 430.0426.4334.9426.13 *38.39 *24.721.850.810.630.04
G:F 4, kg/kg
Wk 1 0.590.640.790.460.400.730.050.010.030.60
Wk 20.790.720.680.730.770.570.020.550.010.31
Wk 30.690.620.660.730.660.570.020.540.130.15
Wk 40.660.630.760.670.610.600.010.160.540.38
G:P 4, kg/kg
Wk 1 2.392.583.192.672.304.20 e0.200.940.030.14
Wk 23.463.162.984.114.393.160.100.020.010.22
Wk 33.002.712.914.13 c3.693.22 e0.090.010.060.16
Wk 42.902.703.283.84 c3.523.570.070.010.560.27
1 CON-NS: control diet with no phytogenic water additive (PWA) supplemented, CON-LS: control diet with a low dose of PWA (4 mL/L of water) supplemented, CON-HS: control diet with a high dose of PWA (8 mL/L of water) supplemented, LP-NS: low-protein diet with no PWA added, LP-LS: low-protein diet with a low dose of PWA (4 mL/L of water) added and LP-HS: low-protein diet with a high dose of PWA (8 mL/L of water) added. The p-values for the overall model effect of protein, PWA, week, protein × PWA, protein × week, PWA × week and protein × PWA ×week for BWG were 0.01, 0.61, 0.01,0.07, 0.85, 0.48, and 0.12, for CFI were 0.35, 0.31, 0.01, 0.68, 0.86, 0.19, and 0.05, for CPI were 1.00, 0.94, 0.01, 0.01, 0.09, 0.11, and 0.01, for CWI were 0.26, 0.18, 0.01, 0.20, 0.39, 0.57and 0.06, for G:F were 0.05, 0.87, 0.26, 0.42, 0.01, 0.01 and 0.57, and for G:P were 0.66, 0.52, 0.01, 0.07, 0.42, 0.01 and 0.01, respectively. Values are the means. n = 8/diet. 2 SEM: standard error of the mean. 3 PWA: phytogenic water additive. 4 BWG: body weight gain (weekly); CFI: cumulative feed intake; CPI: cumulative protein intake CWI: cumulative water intake; G:F: gain: feed; G:P: gain: protein. b p ≤ 0.05 CON-NS vs. CON-HS, c p ≤ 0.05 CON-NS vs. LP-NS, and e p ≤ 0.05 LP-NS vs. LP-HS. *#$ Within a row, values with a common superscript symbol tend to be different (0.05 < p ≤ 0.1).
Table 5. The concentration (nmol/mL) of plasma nitrogen-containing compounds of nursery pigs fed with two levels of dietary protein and three levels of a phytogenic water additive.
ItemDiets 1SEM 2p-Value
CON-NSCON-LSCON-HSLP-NSLP-LSLP-HSProteinPWAProtein × PWA
Valine343.7372.7518.0 b130.1 c246.6 d86.526.30.010.010.01
Methionine41.2 *59.8 *68.664.572.373.03.20.020.040.41
Threonine328.3 $*388.4460.0 $631.5 *660.2590.728.90.010.100.26
Isoleucine171.9190.6301.3 b100.4 c#121.7 #75.913.40.010.010.01
Leucine268.9314.1 a428.6 b255.9 #294.7 #214.312.90.010.010.01
Phenylalanine126.4 *146.2194.7 b100.8 *#118.8 #89.06.60.010.010.01
Tryptophan55.870.4109.4 b81.293.7112.84.90.020.010.42
Lysine189.6 *267.6 *353.6 b529.0 c*618.3365.7 *29.00.010.090.01
Histidine136.3137.3182.2 b74.2 c95.3 d50.4 e8.00.010.280.01
Arginine39.7105.2393.8 b63.879.4124.611.90.010.010.01
Aspartic acid79.276.741.67 b58.378.630.174.60.160.010.42
Serine307.4382.4 a401.3 b395.7 c420.5285.6 e11.90.840.020.01
Glutamic acid444.0485.8261.6 b499.9594.9330.3 e24.90.030.010.81
Glutamine632.8683.9840.5770.4892.4862.829.90.060.050.64
Glycine1420.11772.4 a1701.3 b2168.0 c2027.71887.354.50.010.450.01
Alanine778.4917.4 a989.1 b1054.4 c1262.6 d915.534.00.010.010.01
Tyrosine167.3199.6305.1 b159.2181.9129.9 10.50.010.030.01
Asparagine169.3208.7291.9 b164.0181.4150.111.90.010.100.02
Proline457.2528.6 a676.9 b505.6 #538.3396.8 #17.60.010.070.01
Ammonia367.3452.7245.3403.1424.0232.1 e19.10.620.010.25
Creatinine115.6131.1161.7112.9129.881.76.20.010.430.01
Taurine266.7281.0141.4 b273.8357.396.4 e19.10.270.010.01
Sarcosine50.766.1 a62.7 b73.6 c80.974.02.20.010.020.31
3,methylhistidine10.910.212.56.71 c7.66.80.40.010.420.08
1,methylhistidine58.470.367.356.757.960.23.00.260.630.78
Ethanolamine38.147.125.029.420.317.93.00.010.010.26
Carnosine31.929.730.422.723.119.21.70.010.810.84
Hydroxylysine11.514.614.19.69.812.50.50.010.030.24
Citrulline74.589.696.470.175.879.12.70.020.040.53
Ornithine352.8 $360.5285.5 $251.5 #311.4 #125.217.20.010.010.16
α-aminobutyric acid 35.641.013.439.634.017.73.10.930.010.63
1 CON-NS: control diet with no phytogenic water additive (PWA) supplemented, CON-LS: control diet with a low dose of PWA (4 mL/L of water) supplemented, CON-HS: control diet with a high dose of PWA (8 mL/L of water) supplemented, LP-NS: low-protein diet with no PWA added, LP-LS: low-protein diet with a low dose of PWA (4 mL/L of water) added and LP-HS: low-protein diet with a high dose of PWA (8 mL/L of water) added. Values are the means. n = 6/diet. 2 SEM: Standard error of the mean. a p ≤ 0.05 CON-NS vs. CON-LS, b p ≤ 0.05 CON-NS vs. CON-HS, c p ≤ 0.05 CON-NS vs. LP-NS, d p ≤ 0.05 LP-NS vs. LP-LS, and e p ≤ 0.05 LP-NS vs. LP-HS. *#$ Within a row, values with a common superscript symbol tend to be different (0.05 < p ≤ 0.1).
Publisher’s Note: MDPI stays neutral with regard to jurisdictional claims in published maps and institutional affiliations.

