
A Validated RP-HPLC Method for the Simultaneous Detection and Quantification of Pyridoxine and Terizidone in Pharmaceutical Formulations


Abstract
:1. Introduction
2. Materials and Methods
2.1. Reagents
2.2. HPLC Instrumentation and Chromatographic Conditions
2.3. Preparation of Standard Stock and Working Solutions
2.4. Method Validation
2.4.1. Linearity
2.4.2. Accuracy
2.4.3. Precision
2.4.4. Limit of Detection (LOD) and Limit of Quantification (LOQ)
2.4.5. Specificity
2.4.6. Robustness
2.4.7. Solution Stability
3. Results
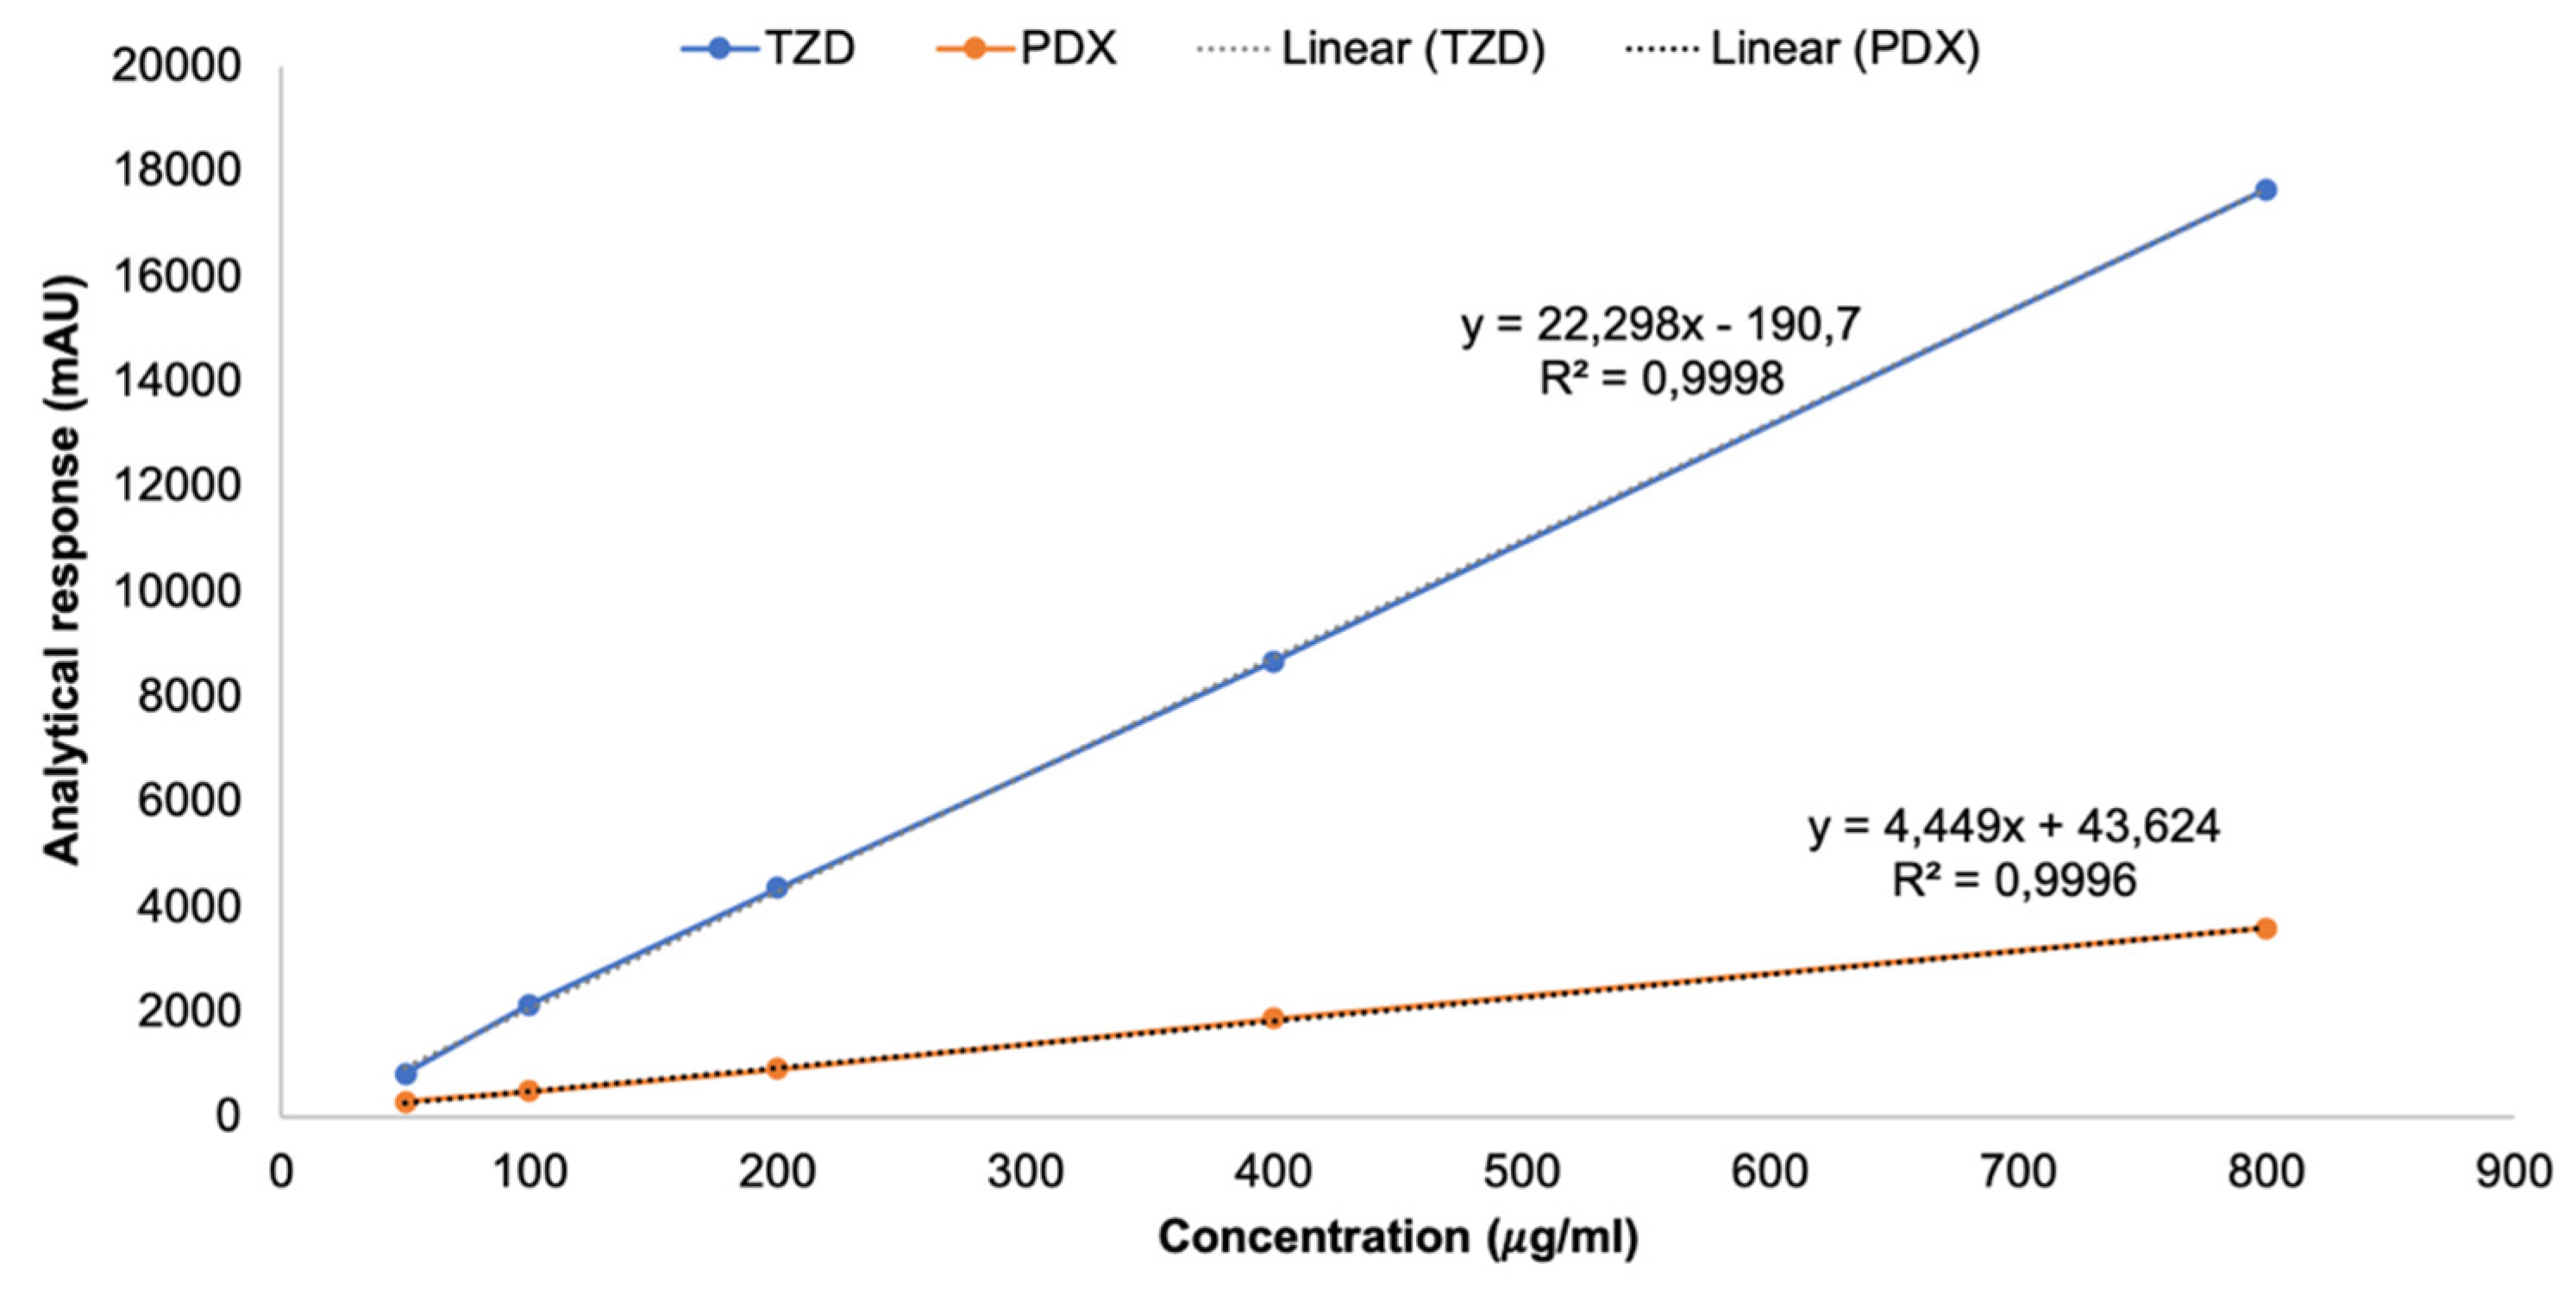
3.1. Linearity
3.2. Accuracy
3.3. Precision
3.4. Limit of Detection (LOD) and Limit of Quantification (LOQ)
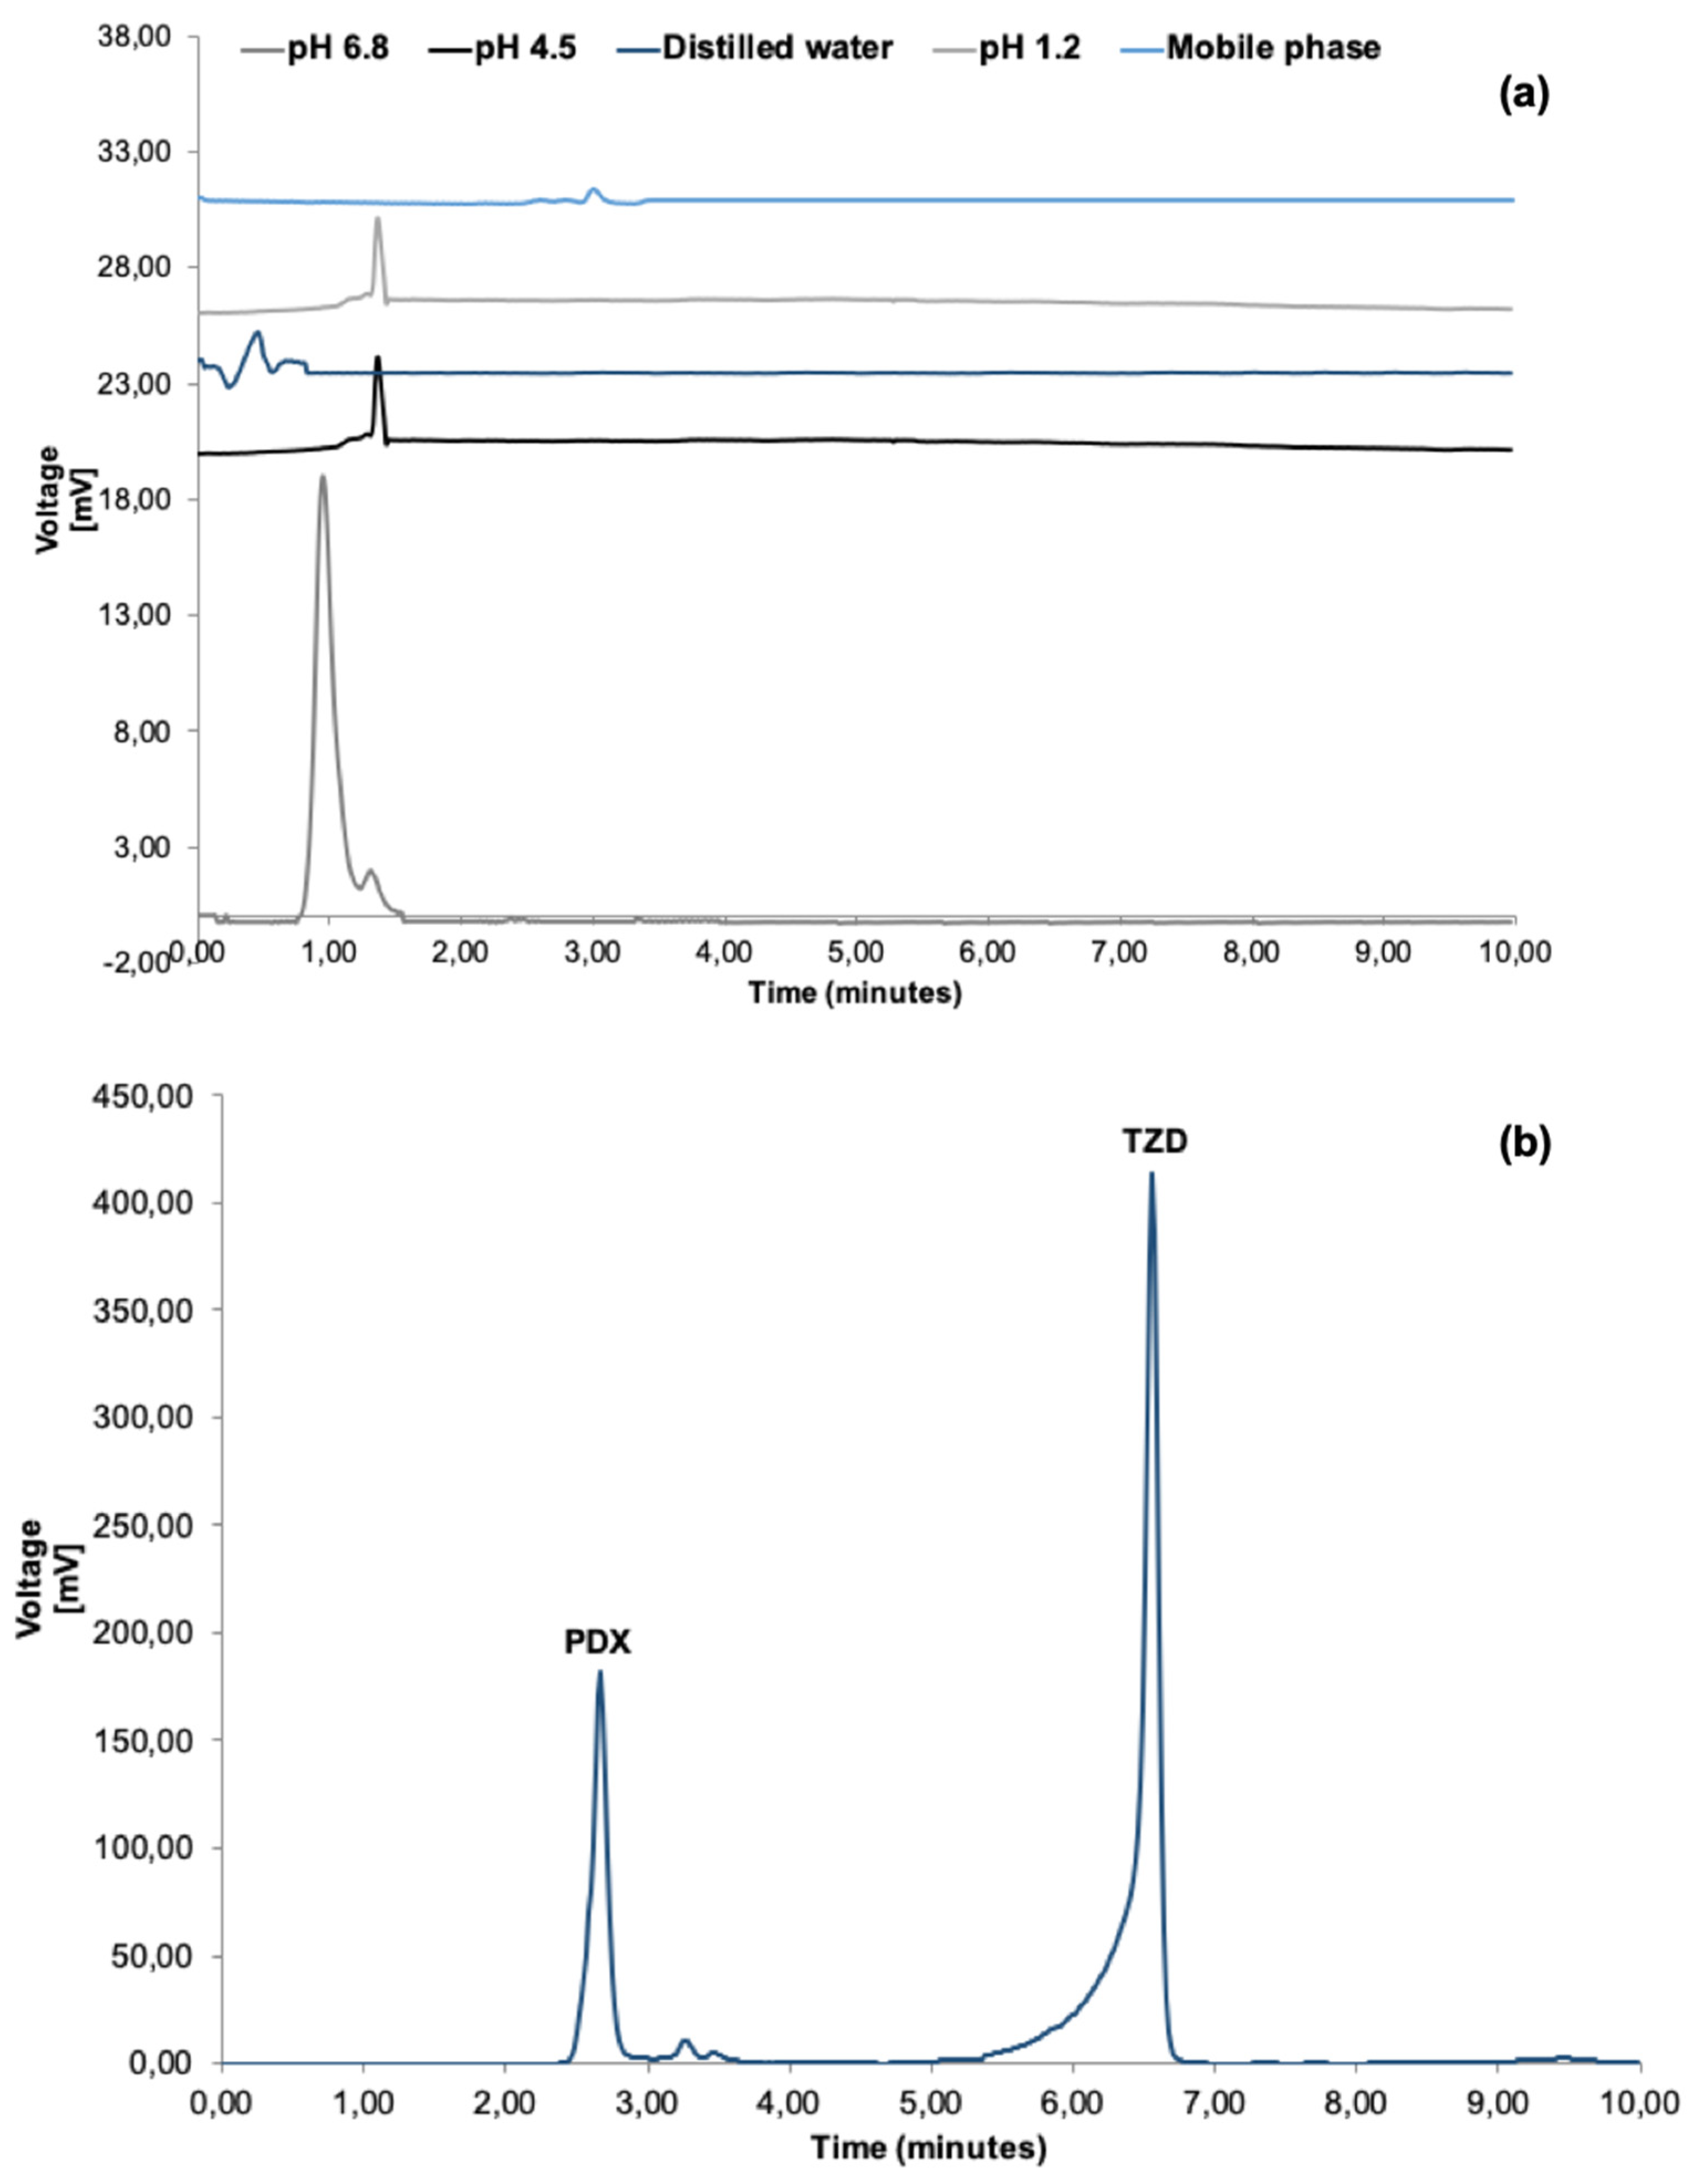
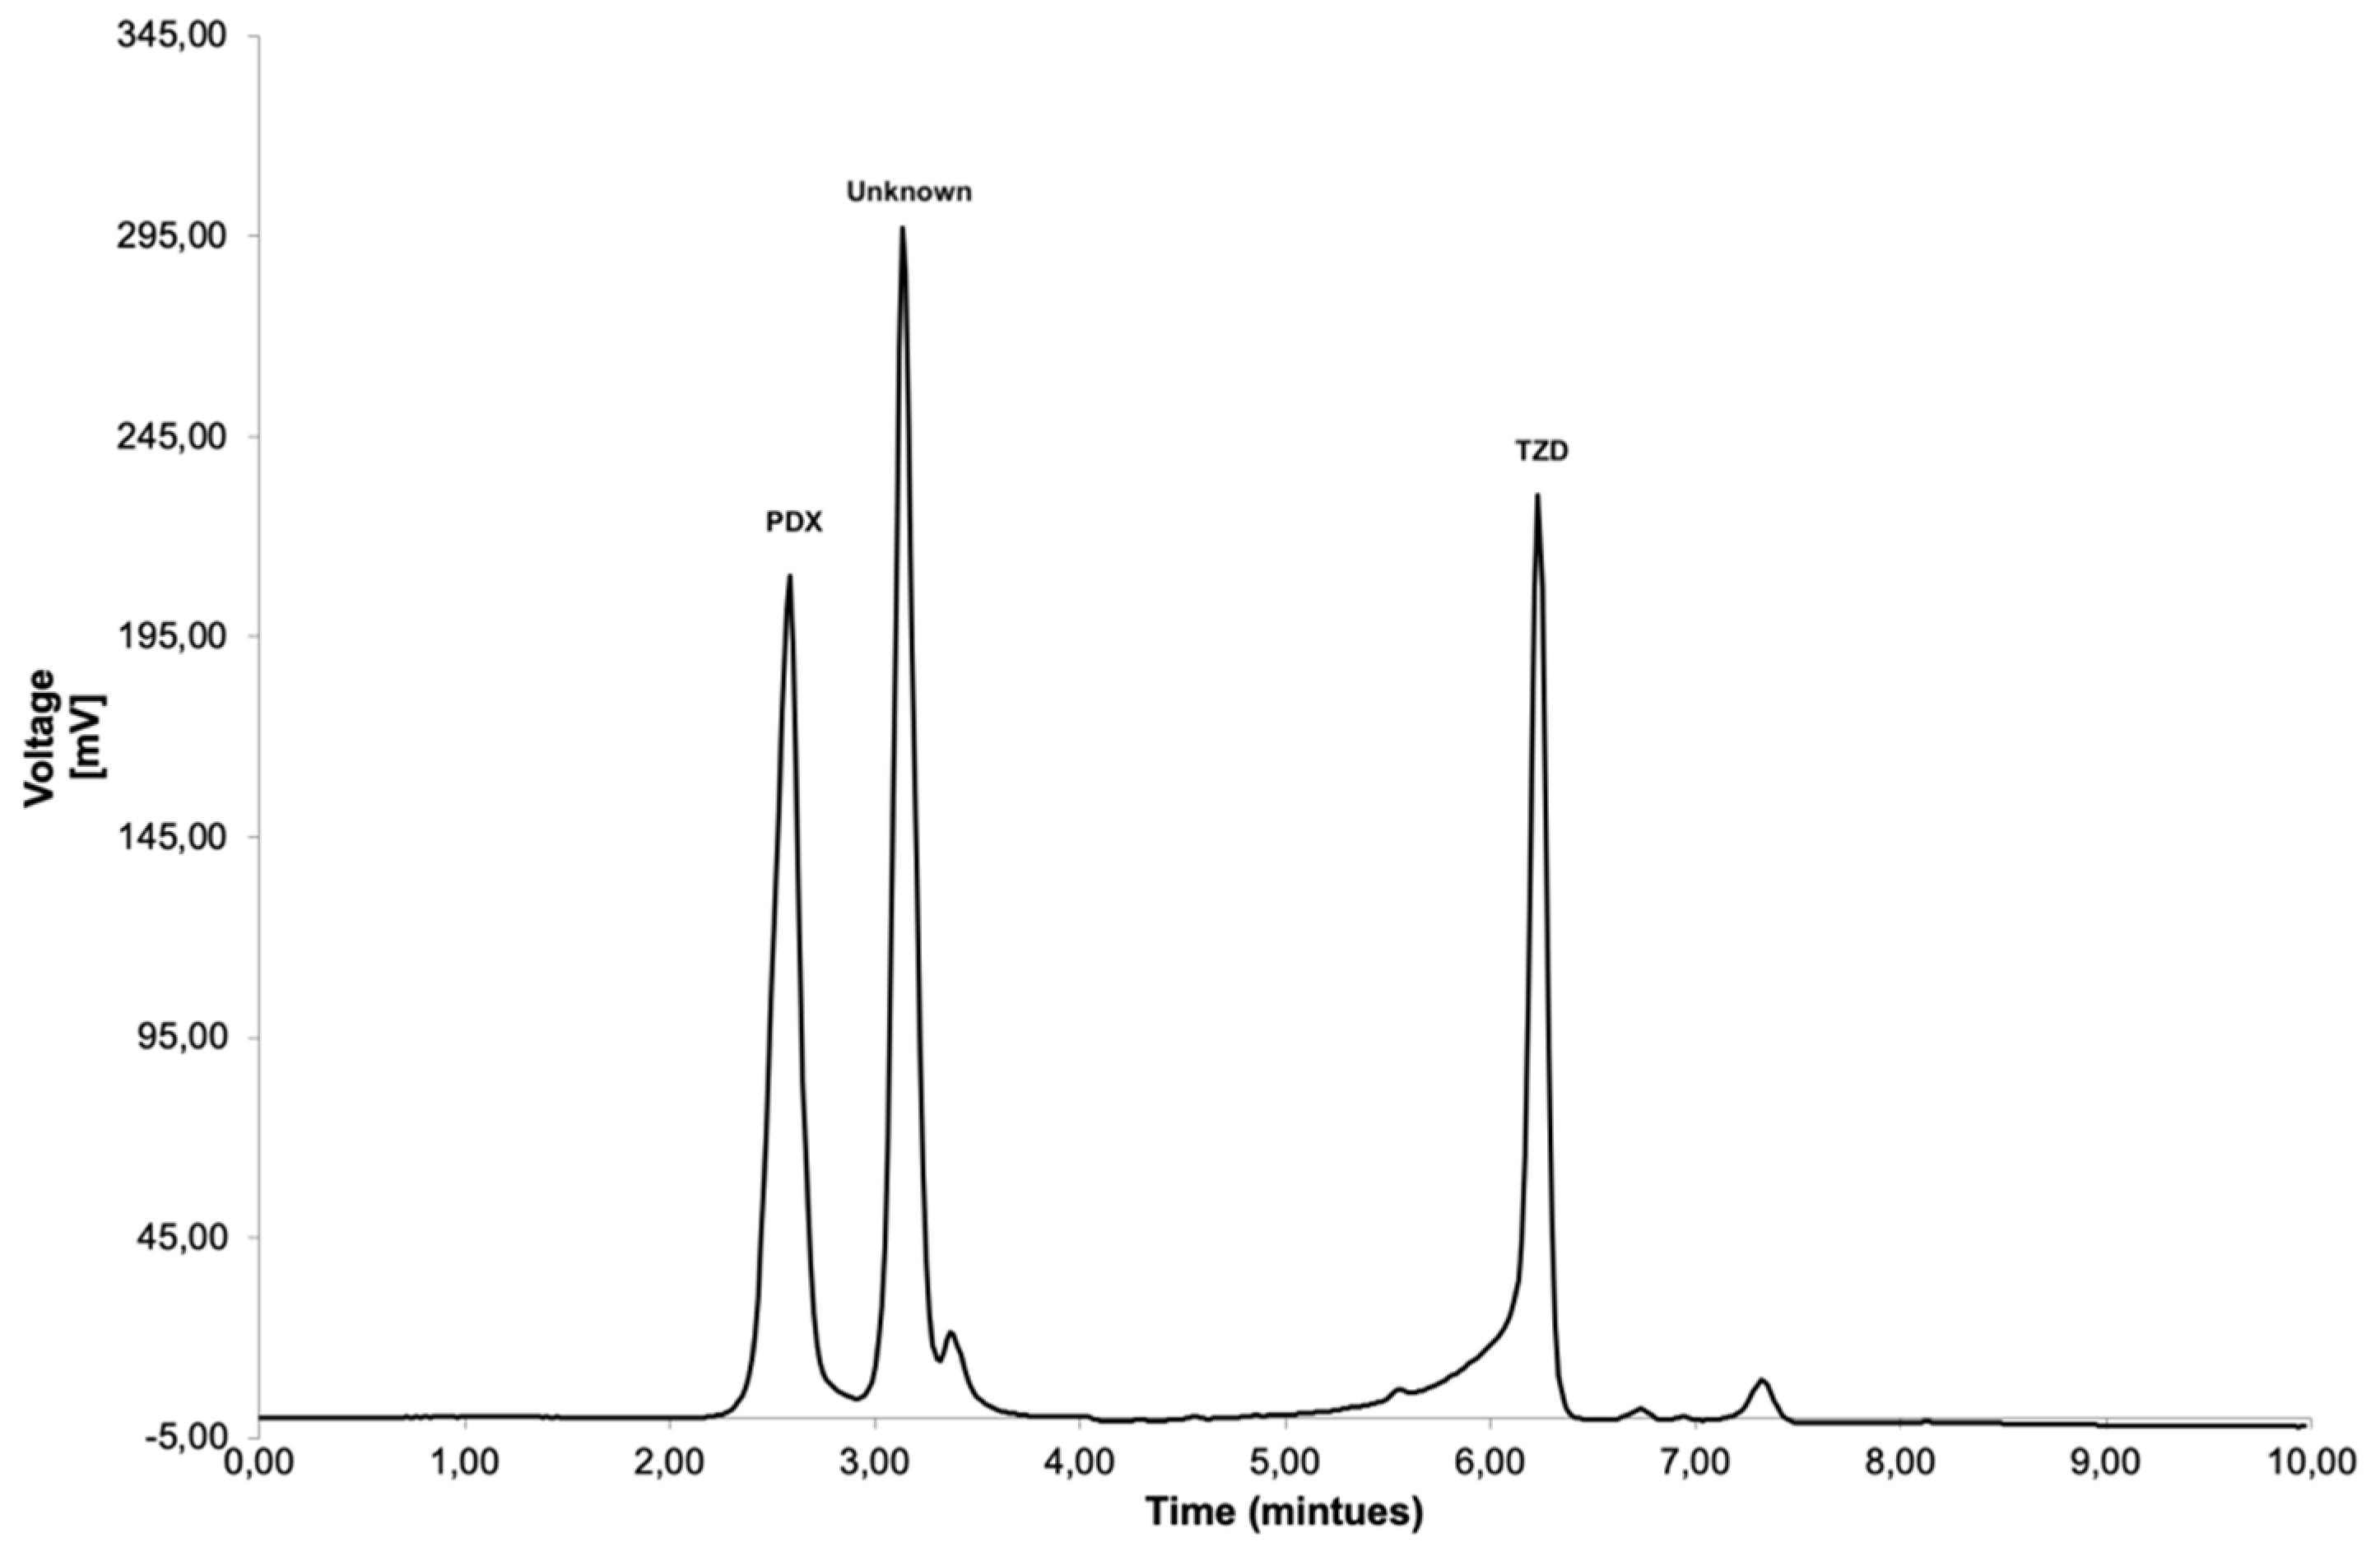
3.5. Specificity
3.6. Robustness
3.7. Solution Stability
4. Discussion
Author Contributions
Funding
Institutional Review Board Statement
Informed Consent Statement
Data Availability Statement
Conflicts of Interest
References
- Wells, B.G.; Dipiro, J.T.; Schwinghammer, T.L.; Dipiro, C. Pharmacotheraphy Handbook, 9th ed.; McGraw-Hill Education: New York, NY, USA, 2015; pp. 476–489. [Google Scholar]
- World Health Organization. Global Tuberculosis Report 2021. Available online: https://www.who.int/teams/global-tuberculosis-programme/tb-reports/global-tuberculosis-report-2021 (accessed on 21 October 2021).
- Riccardi, N.; Canetti, D.; Rodari, P.; Besozzi, G.; Saderi, L.; Dettori, M.; Codesca, L.R.; Sotgiu, G. Tuberculosis and pharmacological interactions: A narrative review. CRPHAR 2021, 2, 100007. [Google Scholar] [CrossRef]
- Huynh, J.; Thwaites, G.; Marais, B.J.; Schaaf, H.S. Tuberculosis treatment in children: The changing landscape. Paediatr. Respir. Rev 2020, 36, 33–43. [Google Scholar] [CrossRef] [PubMed]
- Bernstein, A.L.; Dinesen, J.S. Effect of pharmacologic doses of vitamin B6 on carpal tunnel syndrome, electroencephalographic results, and pain. J. Am. Coll. Nutr 1989, 12, 73–76. [Google Scholar] [CrossRef] [PubMed]
- Leklem, J.E. Vitamin B6. In Modern Nutrition in Health and Disease, 9th ed.; Shils, M.E., Olson, J.A., Shike, M., Ross, A.C., Eds.; Williams and Wilkins: Philadelphia, PA, USA, 1999; pp. 413–421. [Google Scholar]
- Van der Watt, J.; Harrison, T.; Benatar, M.; Heckmann, J. Polyneuropathy, anti-tuberculosis treatment and the role of pyridoxine in the HIV/AIDS era: A systematic review. Int. J. Tuberc. Lung Dis. 2011, 15, 722–728. [Google Scholar] [CrossRef] [PubMed]
- Court, R.; Centner, C.M.; Chirehwa, M.; Wiesner, L.; Denti, P.; de Vries, N.; Harding, J.; Gumbo, T.; Maartens, G.; McIlleron, H. Neuropsychiatric toxicity and cycloserine concentrations during treatment for multidrug-resistant tuberculosis. IJID 2021, 105, 688–694. [Google Scholar] [CrossRef] [PubMed]
- Mulubwa, M.; Mugabo, P. Analysis of terizidone in plasma using HPLC-UV method and its application in a pharmacokinetic study of patients with drug-resistant tuberculosis. Biomed. Chromatogr. 2018, 32, e4325. [Google Scholar] [CrossRef] [PubMed]
- Gandhi, S.V.; Shevale, V.P.; Choudhari, G.B. Development and validation of a stability indicating RP-HPLC method for the determination of terizidone. IAJPS 2018, 05, 1353–1361. [Google Scholar]
- Vanavi, P.J.; Rajput, S.J. Impurity profiling of first line anti-TB drug—Terizidone using chromatographic and related techniques. Int. J. Pharm 2021, 13, 83–95. [Google Scholar]
- National Center for Biotechnology Information. Available online: https://pubchem.ncbi.nlm.nih.gov/compound/Terizidone (accessed on 21 October 2021).
- National Center for Biotechnology Information. Available online: https://pubchem.ncbi.nlm.nih.gov/compound/Pyridoxine-hydrochloride (accessed on 21 October 2021).
- International Conference of Harmonisation. Available online: https://www.gmp-compliance.org/guidemgr/files/Q2(R1).pdf (accessed on 21 September 2021).
- LoBrutto, R.; Patel, T. Method validation. In HPLC for Pharmaceutical Scientists, 1st ed.; Kazakevich, Y., LoBrutto, R., Eds.; John Wiley and Sons: Hoboken, NJ, USA, 2007; pp. 455–502. [Google Scholar]
- Harris, R.S. General discussion on the stability of nutrients. In Nutritional Evaluation of Food Processing; Karmas, E., Harris, R., Eds.; Springer: Dordrecht, The Netherlands, 1988; pp. 3–5. [Google Scholar]
- Aboul-Enein, H.Y.; Loutfy, M.A. Pyridoxine hydrochloride. In Analytical Profiles of Drug Substances; Florey, K., Ed.; Academic Press: New York, NY, USA, 1984; pp. 447–486. [Google Scholar]


| Expected Concentration (μg/mL) | TZD | PDX | ||
|---|---|---|---|---|
| % Recovery | Concentration (μg/mL) | % Recovery | Concentration (μg/mL) | |
| 50.00 | 92.04 | 46.48 ± 0.05 | 102.04 | 51.53 ± 0.05 |
| 104.00 | 101.74 | 105.81 ± 0.77 | 98.04 | 101.96 ± 0.54 |
| 202.10 | 100.25 | 202.61 ± 0.87 | 100.37 | 202.85 ± 2.56 |
| 312.00 | 99.55 | 310.60 ± 0.25 | 98.62 | 307.69 ± 0.60 |
| 404.00 | 99.77 | 403.07 ± 0.54 | 97.23 | 392.81 ± 0.16 |
| Concentration (μg/mL) (n = 12) | TZD Peak Area | Peak Area (Average ± %RSD) | PDX Peak Area | Peak Area (Average ± %RSD) |
|---|---|---|---|---|
| 101.00 | 2420.34 | 2408.78 ± 0.09 | 793.77 | 795.86 ± 0.22 |
| 2378.18 | 795.69 | |||
| 2427.83 | 798.12 | |||
| 208.00 | 4824.74 | 4823.49 ± 0.04 | 1615.32 | 1619.26 ± 0.26 |
| 4820.50 | 1616.09 | |||
| 4822.94 | 1622.28 | |||
| 4826.31 | 1616.42 | |||
| 4823.83 | 1626.20 | |||
| 4822.63 | 1620.67 | |||
| 303.00 | 7023.60 | 7032.03 ± 0.11 | 2449.71 | 2454.94 ± 0.16 |
| 7039.47 | 2459.21 | |||
| 7033.03 | 2455.89 |
| Concentration (μg/mL) (n = 9) | Day 1 dongyuan% Recovery | Day 2 dongyuan% Recovery | Day 3 dongyuan% Recovery |
|---|---|---|---|
| 104.00 | 102.40 | 98.53 | 102.64 |
| 100.62 | 97.19 | 101.23 | |
| 100.62 | 100.85 | 101.33 | |
| Mean | 101.21 | 98.86 | 101.73 |
| %RSD | 0.83 | 1.53 | 0.63 |
| 208.00 | 98.53 | 98.05 | 99.34 |
| 97.48 | 98.11 | 99.37 | |
| 98.05 | 98.08 | 99.26 | |
| Mean | 98.02 | 98.08 | 99.32 |
| %RSD | 0.44 | 0.02 | 0.05 |
| 303.00 | 99.51 | 101.89 | 100.44 |
| 100.06 | 102.33 | 100.98 | |
| 98.98 | 101.67 | 100.51 | |
| Mean | 99.52 | 101.96 | 100.64 |
| %RSD | 0.44 | 0.27 | 0.24 |
| Concentration (μg/mL) (n = 9) | Day 1 dongyuan% Recovery | Day 2 dongyuan% Recovery | Day 3 dongyuan% Recovery |
|---|---|---|---|
| 102.00 | 97.09 | 103.63 | 100.31 |
| 98.72 | 102.64 | 98.95 | |
| 98.98 | 102.14 | 100.55 | |
| Mean | 98.26 | 102.80 | 99.94 |
| %RSD | 0.85 | 0.60 | 0.70 |
| 209.00 | 102.12 | 98.09 | 100.23 |
| 102.35 | 98.06 | 100.78 | |
| 102.14 | 98.56 | 101.02 | |
| Mean | 102.28 | 98.24 | 100.71 |
| %RSD | 0.11 | 0.23 | 0.29 |
| 301.00 | 100.06 | 101.51 | 99.77 |
| 100.17 | 100.67 | 99.04 | |
| 100.99 | 100.86 | 99.81 | |
| Mean | 100.41 | 101.01 | 99.54 |
| %RSD | 0.41 | 0.35 | 0.36 |
| Wavelength (nm) | PDX (mAU) | TZD (mAU) |
|---|---|---|
| 230 | 383.57 | 4808.23 |
| 250 | 1606.21 | 2157.37 |
| 260 (chosen wavelength) | 738.15 | 4627.39 |
| 280 | 237.31 | 4834.05 |
| Conditions | 5 °C | 25 °C | 60 °C | Photolysis | Acid Hydrolysis | Alkaline Hydrolysis | Oxidation |
|---|---|---|---|---|---|---|---|
| PDX (% Purity ± %RSD) | |||||||
| 0 h | 100.00 ± 0.26 | 100.00 ± 0.26 | 100.00 ± 0.26 | 100.00 ± 0.26 | 100.00 ± 0.26 | 100.00 ± 0.26 | 100.00 ± 0.26 |
| 24 h | 98.08 ± 0.03 | 94.87 ± 0.61 | 34.94 ± 0.33 | 1.81 ± 0.00 | 100.02 ± 0.77 | 70.84 ± 0.17 | 94.15 ± 0.18 |
| 48 h | 95.13 ± 0.76 | 90.41 ± 0.06 | 0.00 ± 0.00 | 0.00 ± 0.00 | 93.75 ± 0.96 | 64.91 ± 1.29 | 80.95 ± 1.03 |
| TZD (% Purity) | |||||||
| 0 h | 100.00 ± 0.66 | 100.00 ± 0.66 | 100.00 ± 0.66 | 100.00 ± 0.66 | 100.00 ± 0.66 | 100.00 ± 0.66 | 100.00 ± 0.66 |
| 24 h | 97.50 ± 0.53 | 97.43 ± 0.34 | 127.67 ± 2.34 | 0.00 ± 0.00 | 99.86 ± 0.45 | 101.97 ± 0.17 | 100.39 ± 0.46 |
| 48 h | 97.59 ± 1.09 | 97.58 ± 0.63 | 72.76 | 0.00 ± 0.00 | 99.56 ± 0.43 | 100.63 ± 0.09 | 99.94 ± 0.31 |
Publisher’s Note: MDPI stays neutral with regard to jurisdictional claims in published maps and institutional affiliations. |
© 2021 by the authors. Licensee MDPI, Basel, Switzerland. This article is an open access article distributed under the terms and conditions of the Creative Commons Attribution (CC BY) license (https://creativecommons.org/licenses/by/4.0/).
Share and Cite
Musafili, N.Y.; Samsodien, H.; Aucamp, M.E. A Validated RP-HPLC Method for the Simultaneous Detection and Quantification of Pyridoxine and Terizidone in Pharmaceutical Formulations. Analytica 2021, 2, 206-216. https://doi.org/10.3390/analytica2040018
Musafili NY, Samsodien H, Aucamp ME. A Validated RP-HPLC Method for the Simultaneous Detection and Quantification of Pyridoxine and Terizidone in Pharmaceutical Formulations. Analytica. 2021; 2(4):206-216. https://doi.org/10.3390/analytica2040018
Chicago/Turabian StyleMusafili, Ngabo Yves, Halima Samsodien, and Marique Elizabeth Aucamp. 2021. "A Validated RP-HPLC Method for the Simultaneous Detection and Quantification of Pyridoxine and Terizidone in Pharmaceutical Formulations" Analytica 2, no. 4: 206-216. https://doi.org/10.3390/analytica2040018