The Effect of Different Organic Fertilizers on Yield and Soil and Crop Nutrient Concentrations


Department of Sustainable Agriculture Sciences, Rothamsted Research, West Common, Harpenden, Herts AL5 2JQ, UK
*
Author to whom correspondence should be addressed.
Agronomy 2019, 9(12), 776; https://doi.org/10.3390/agronomy9120776
Submission received: 30 October 2019
/
Revised: 13 November 2019
/
Accepted: 18 November 2019
/
Published: 20 November 2019
(This article belongs to the Section Soil and Plant Nutrition)
Abstract
:At present, organic fertilizers are not widely used in intensive arable agriculture, and not much is known about their effects on crop nutrition. In a field experiment at Rothamsted, UK, anaerobic digestate (AD), compost, farmyard manure (FYM), straw, and mixes of amendment + straw, were applied at: 1, 1.75, 2.5 or 3.5 t carbon ha−1, with all plots receiving the same input of mineral fertilizer. After five seasons of application, plots receiving non-straw amendments had greater straw and grain yield of 28% and 18% respectively, and plots receiving the highest amendment rate had a 37% higher straw and 23% higher grain yield, compared to control plots. Whereas, the straw-only amendment did not increase yield compared to the control. The concentrations of secondary and micro nutrients in the crop, particularly P, Ca, and S in the straw, and P and Fe in the grain, were significantly greater in the crop receiving non-straw amendment compared to the control. Interestingly K, Fe, and Zn were greater in the crop straw treated with the straw-only amendment. Therefore ‘biomass dilution’ of secondary and micro nutrients did not occur in the higher-yielding amended plots after five seasons, and organic fertilizers would improve the quality of high-yielding, intensively produced crops. The study also demonstrates that portable x-ray fluorescence (pXRF) could be a reliable, cost-effective tool for screening potential organic fertilizers.
1. Introduction
Mineral fertilizers, particularly nitrogen, phosphorus, and potassium (NPK), are widely used in intensive arable farming, but at present organic fertilizers are not common. In 2017, organic fertilizers in the form of manure or slurry were applied to 25% of the area of arable crops in the UK. Across all farm types, cattle slurry (49%) accounts for the greatest source of organic fertilizer, followed by farmyard manure (FYM, 38%), biosolids (treated sewage sludge), and industrial wastes (including compost, brewery effluents, and paper waste), each accounting for ~2% of the organic fertilizer applied [1]. On-farm processing of waste using anaerobic digestion is carried out by 5.4% of farms [2]. Furthermore, crop straw is removed from 73% of UK farms, which removes 10% more P and 50% more K compared to the removal of grain alone [3].
Recycling organic waste as a crop fertilizer, as opposed to its disposal at landfill, would reduce greenhouse gas emissions [4,5]. In the EU in 2017, 26% of MSW (municipal solid waste/ bio-waste) was landfilled, 30% was recycled, and a further 17% was composted [6]. This is an increase in recycling and composting of 195% and 205% respectively, since 1995 and the adoption of the European Landfill Directive [7]. In the UK, there has been a reduction in methane emissions from landfills of 74% over the period 1990–2013 [8], and in the EU a reduction in CO2 emissions from landfills of over 56% since 2001 [9], which is predominantly explained by the recycling of biodegradable materials. The use of organic fertilizers would also contribute to carbon sequestration [10,11,12]. Model predictions using data from the Askov long-term agricultural trials suggest an increase in carbon storage after conversion to organic farming of 10–40 g C m−2 y−1 in the first 50 years [12]. Furthermore, use of locally produced organic fertilizers would reduce the energy costs associated with the production and transport of mineral fertilizers.
Soil organic carbon (SOC) is an important indicator of soil health, particularly with regard to soil fertility for crops, because it has numerous benefits: improving soil structure through soil particle aggregation enabling better root access, increased water infiltration and retention, increased nutrient bioavailability due to SOM (soil organic matter) decomposition, and more exchange sites for mineral nutrients increasing the soil’s cation exchange capacity. In a non-fertilized soil, SOM may provide 90% of plant available N, 80% of plant available P, and 50% of plant available S, as well as micro nutrients [13]. The Hoosfield experiment at Rothamsted, UK, shows that over the past 40 years a greater barley yield was reached with the manure only treatment compared with the mineral fertilizer only treatment [14]. Similar benefits of manure were reported from other long-term field trials; in rice-wheat systems in India [15]; in wheat-fallow experiments in Columbia, USA [16]; and in a winter wheat-maize rotation in China [17]. Yet, a meta-analysis of long-term trials in Europe [18,19], in particular of the Askov trials in Denmark, showed that when the FYM amendment was balanced with the mineral fertilizer to have the same NPK rates applied, the mineral fertilizer treatment gave slightly greater yields than the fertilizer + manure treatments after 10 years [18]. The latter studies suggest that it may specifically be the added nutrient benefit of organic matter rather than an improvement in soil health generally which improves yield over treatments with mineral fertilizer alone.
High input agricultural systems that supply only major nutrients to the crop may suffer from a lack of secondary nutrients (e.g., Ca, Mg, and S) and micro nutrients (e.g., Fe, Cu, and Zn), which can impact yield and nutritional quality of harvested products [20,21]. Furthermore, modern high-yielding varieties that grow larger and faster may not acquire secondary and micro nutrients at a sufficient rate—a ‘genetic dilution effect’ [22]. For example, archived wheat grains grown on the Rothamsted long-term Broadbalk wheat experiment showed a 19% reduction in Mg concentration from 1138 to 924 mg kg−1 in modern high yielding varieties grown since 1968 compared with older varieties [23], and similar observations in durum wheat have been made [24]. Significant declines in micro nutrient concentrations in UK vegetable and fruit produce from the 1980s compared with the 1930s have also been found [25]. This ‘yield dilution effect’ has been seen in strong inverse relationships between wheat grain yield and grain micro nutrient concentrations [26,27].
An additional supply of secondary and micro nutrients from organic sources will likely benefit both yield and the quality of produce. However, comparisons of the effect of different organic amendments on crop nutrient concentrations have not been studied extensively. Wheat grain Zn concentrations were found to more than double with sewage sludge applications over 4 years in UK field experiments [28]. The concentration of secondary and micro nutrients Mg, Fe, K, Ca, and Mn of the edible part of vegetables was greater when grown in organic compared with conventional farms [29], whereas heavy metal toxicant concentrations of vegetables were greater when grown in conventional rather than organic systems [30]. It was observed in rice that uptake of P and K was greater with chicken manure than compost treatment, whereas uptake of N, Ca, and Mg was greater with compost treatment [31]. Application of FYM and green manure (clover) increased wheat shoot and grain N, S, and P, but shoot and grain Zn and Cd only increased with FYM application [32]. The uptake of P from phosphate fertilizers applied to maize increased with the application of green manure [33].
Organic fertilizers include a wide range of different materials with sometimes quite different properties. Here we used four different materials widely available to farmers in the UK. Anaerobic digestate (AD) is a by-product of bio-gas production from organic waste under anaerobic decomposition. The digestate consists of left-over indigestible material and dead micro-organisms. All nitrogen, phosphorous, and potassium remains in the digestate as none is lost in the biogas, and plant available ammonium content increases after digestion [34]. Compost has already been somewhat mineralized, and in contrast to fresh residues, decomposes and releases nutrients slowly when added to soil [35,36,37]. Farmyard manure is usually a mix of crop residues and animal feces with a low C/N ratio, which decomposes fast and readily releases plant available nutrients [38]. Fresh straw has a very high carbon to nitrogen ratio, meaning that free N can be immobilized by micro-organisms during decomposition and less is available for plant uptake. Nitrogen is more readily available in digestate, but P and K are more readily available in compost and FYM [39]. Co-composting low C/N-ratio materials, e.g., manure with high C/N-ratio materials (e.g., straw), provides increased carbon for microbes to immobilize the free N in the manure and therefore minimizes excess nitrate leaching, and, on the other hand, provides sufficient nitrogen to speed the decomposition of the straw.
The aim of this field experiment was to investigate the effects after 5 years of applying different types and rates of organic amendments on soil and crop nutrition and crop yield. Although the effect of different organic amendments on yield have been studied extensively, the effects on crop nutrition have not. Furthermore, in this study, pXRF (portable x-ray fluorescence) spectroscopy was used to measure the total elemental content of soil, crop, and organic fertilizer samples. X-ray fluorescence is a faster and cheaper method for the analysis of materials with a wide range of elemental contents, and with organic materials can give comparable results to conventional techniques [40,41,42]. Testing the elemental content of new organic fertilizer products and their effect on crop produce could accelerate the assessment of the suitability of new fertilizer products [42,43].
2. Materials and Methods
2.1. Trial Design
To investigate the effect of adding different types and rates of organic matter amendment to the nutritional content and yield of crops, the Fosters field experiment has been conducted over 5 consecutive seasons between 2012–2017. The trial is based at Rothamsted Research in Harpenden, Hertfordshire, in the Southeast of England (51.82 N, 0.37 W). The site is at an altitude of 130 m, and has a temperate climate with mean annual temperature of 10 °C and mean annual rainfall of 700 mm. The soil is characterized as a flinty clay loam of the Batcombe series (average 25% clay, but somewhat variable), with total organic carbon of 1.6% and a pH of 7.0. The trial consists of 220 ploughed plots of 9 × 6 m each (allowing harvest of a 2 m central strip), arranged as a randomized block design in 4 blocks. For this study we have sub-sampled 120 of the plots from the experiment which includes only those plots receiving the same recommended rate of mineral N fertilizer but variable rates of OM (the remaining plots received variable rates of mineral N fertilizer but the same rate of OM). All plots received inorganic nitrogen at the RB209 recommended rate for the specific crop, ranging from 0 to 220 kg ha−1 (RB209, Nutrient Management Guide, Agriculture and Horticulture Development Board, [44]) in 2 separate applications, as well as sulphate of potash (SOP) fertilizer at 111 kg ha−1 each year, except for the 2017 season; however, no P was applied during the experiment because available soil P was sufficient according to the RB209 guidelines. Two arable rotation series were compared in two replicate blocks each season, with half the field sown with each crop; in 2012–13, these were winter wheat and spring barley; in 2013–14, winter oilseed rape (OSR) and spring barley; in 2014–15, winter wheat and winter oats; in 2015–16, winter wheat and spring barley; and in 2016–17, only winter wheat was sown. The cultivations were performed on the same area (GPS located) over the 5 years of the experiment. The experiment was managed using a conventional regime of pest/weed control and ploughing.
2.2. Organic Amendments
The experiment was treated with four types of organic amendment at the start of each season: anaerobic digestate (AD, in solid form from vegetable waste), compost (from a mix of green and food waste), farmyard manure (FYM, from cattle, composted for 1 year), and straw (from wheat and barley grown on the same trial in previous years). There was also a control with no organic amendment applied. Each amendment was applied at 4 different rates: 1, 1.75, 2.5 or 3.5 tons carbon ha−1 (n = 4: 1 plot per OM treatment at each OM rate per block). In addition, mixtures of non-straw and straw amendments: AD + straw, compost + straw, and FYM + straw were applied at a 50:50 rate of carbon content. Organic amendments were applied manually in autumn, and FYM and straw were first chopped with a spreader. The amount of amendment applied was calculated based on the carbon content. Prior to application, samples (n = 3) of all amendments were analyzed for fresh and dry weight, and for total C and N by LECO (TruMac Combustion Analyzer, St. Joseph, Michigan, USA). Total C content and moisture levels were then used to calculate the quantity of each amendment required for each C rate. In addition, total elemental contents of the amendments were analysed using pXRF (see methods below).
2.3. Crop and Soil Sampling
Harvest of grain and straw was carried out using a Sampo 2010 plot combine over an area of 9 × 2 m from the center of each plot. Sub-samples of grain and straw were oven dried at 80 °C for 48 h after collection. Yield was calculated as 85% dry matter based on the moisture content of the sub-sample. Sub-samples of straw and grain from each plot were ground to powder < 0.5 mm, using a Retsch 400 ultra-centrifugal mill with a titanium rotor (Retsch GmbH, Germany). Soil sampling using an auger was carried out after harvest and 5 samples were taken from each plot in a standard ‘W’ pattern from 0 to 30 cm depth. The 5 samples per plot were pooled and homogenized. The samples were air dried for 7 days before being ground to a powder on a Retsch PM400 planetary ball mill (Retsch GmbH, Germany).
2.4. Crop and Soil Nutrient Analyses
Total carbon and nitrogen content in the organic amendments, soil and total nitrogen in grain samples were analyzed by LECO combustion in samples from the baseline and after 5 years (2013 and 2017). A technical replicate was performed every tenth sample for quality control assessment. Only a sub-set of the grain samples was analyzed, including the amendment and control treatments but excluding the mixture treatments, i.e., amendment + straw.
Total element concentrations of the soil, crop straw, and grain were measured using energy dispersive x-ray fluorescence (EDXRF) technology with a pXRF (portable XRF, TRACER 5i, Bruker, Berlin, Germany). The TRACER 5i uses a rhodium anode with a full width height maximum (FWHM) of 135 eV at the manganese K-alpha line (Kα). The detector is a proprietary 40 mm2 silicon drift detector with a typical resolution < 140 eV at 250,000 cps (counts per second) Mn Kα. Excitation parameters are optimized for either light (Na-Ca) or trace (Ti-U) elements. Plant and soil calibrations had previously been established using reference material values measured in-house by total acid dissolution and ICP-OES or ICP-MS (inductively coupled plasma optical emission spectrometry/mass spectrometry) analysis. Quantification models were built with empirical Lucas-Tooth algorithms (Lucas-Tooth and Price, 1961) using automated settings in EasyCal software (Bruker, Berlin, Germany). Trace elements (Mn, Fe and Zn) in plant material were measured with a voltage of 35 keV, current of 35 µA, and a 25 µm Ti:300 µm Al filter. In soil the trace elements were measured with a voltage of 30 keV, current of 50 µA, and a 25 µm Ti:300 µm Al filter. Light elements (Mg, K, Ca, P, and S) in both plant and soil material were measured with a voltage of 10 keV, current of 70 µA, and no filter. However, note that light elements including Mg have a high limit of detection using pXRF with the current method employed. Furthermore, the soil calibration does not predict potassium with accuracy, and under-predicts 2–3-fold. Approximately 1 g of plant and 5 g of soil material were analysed in 30.9 mm wide (Ø) and 29.2 mm high sample cups (Chemplex, Palm City, Florida, USA), which had a 4 µm prolene film (Chemplex, Palm City, Florida, USA) at their base. Elemental concentrations (%) were given as an average of continual measurements throughout a 90 s measurement period.
2.5. Statistical Analyses
General analysis of variance (ANOVA) was used with the following parameters: treatment factors; split/straw only/amendment only (Straw_OM-rate + Amendment_OM-rate × Amendment × Amendment + straw), where ‘split’ compared all amendments with the untreated, ‘straw-only’ compared the straw only amendment with all other treatments, and ‘amendment-only’ compared non-straw amendments with all other treatments, respectively. Blocking factors were field blocks and sub-blocks. The residual graphs were checked and always met normality assumptions. Statistical analyses were performed using Genstat (18th edition, VSN International Ltd., UK).
2.6. Amendment Nutrient Contents
The 5-year average total carbon concentration was 24%, 35%, 43%, and 45% in compost, FYM, AD, and straw, respectively. Total 5-year average nitrogen concentration was 0.5%, 1.4%, 1.9%, and 2.5% in straw, AD, compost and FYM, respectively. The 5-year average C:N ratio was 14, 18, 24, and 104 in FYM, compost, AD and straw, respectively (Table 1). Anaerobic digestate had the highest concentration of phosphorus in both years and in 2013 had the highest concentration of K and S, but in 2017 K and S were highest in FYM. Compost had the highest concentration of Ca and Fe in both years. Magnesium was highest in FYM in 2013 and compost in 2017. Farmyard manure had the highest concentration of Zn and Mn in both years (Table 1). Across all amendments, FYM had the lowest C:N ratio and a good supply of other nutrients, whereas straw had the highest C:N ratio and was low in most nutrients except K.
3. Results
The effect of organic amendments: FYM, compost, and AD with and without added straw and straw-only, and the rate of application, on crop straw, grain mineral nutrient concentration, and yield was assessed. This analysis was conducted for all plots receiving the same rate of mineral fertilizer. In the 2012–2013 season, results were pooled for spring barley and wheat because there were an equal number of barley and wheat plots in the amended and control treatments. ANOVA tests showed no significant differences between wheat and barley in yield or total N and C in grain. Yet, there was a greater Ca concentration in barley straw compared to wheat straw, and higher Ca, Cu, and P but smaller Mn in the barley grain p < 0.05 in all cases (data not shown).
3.1. Yield Effects
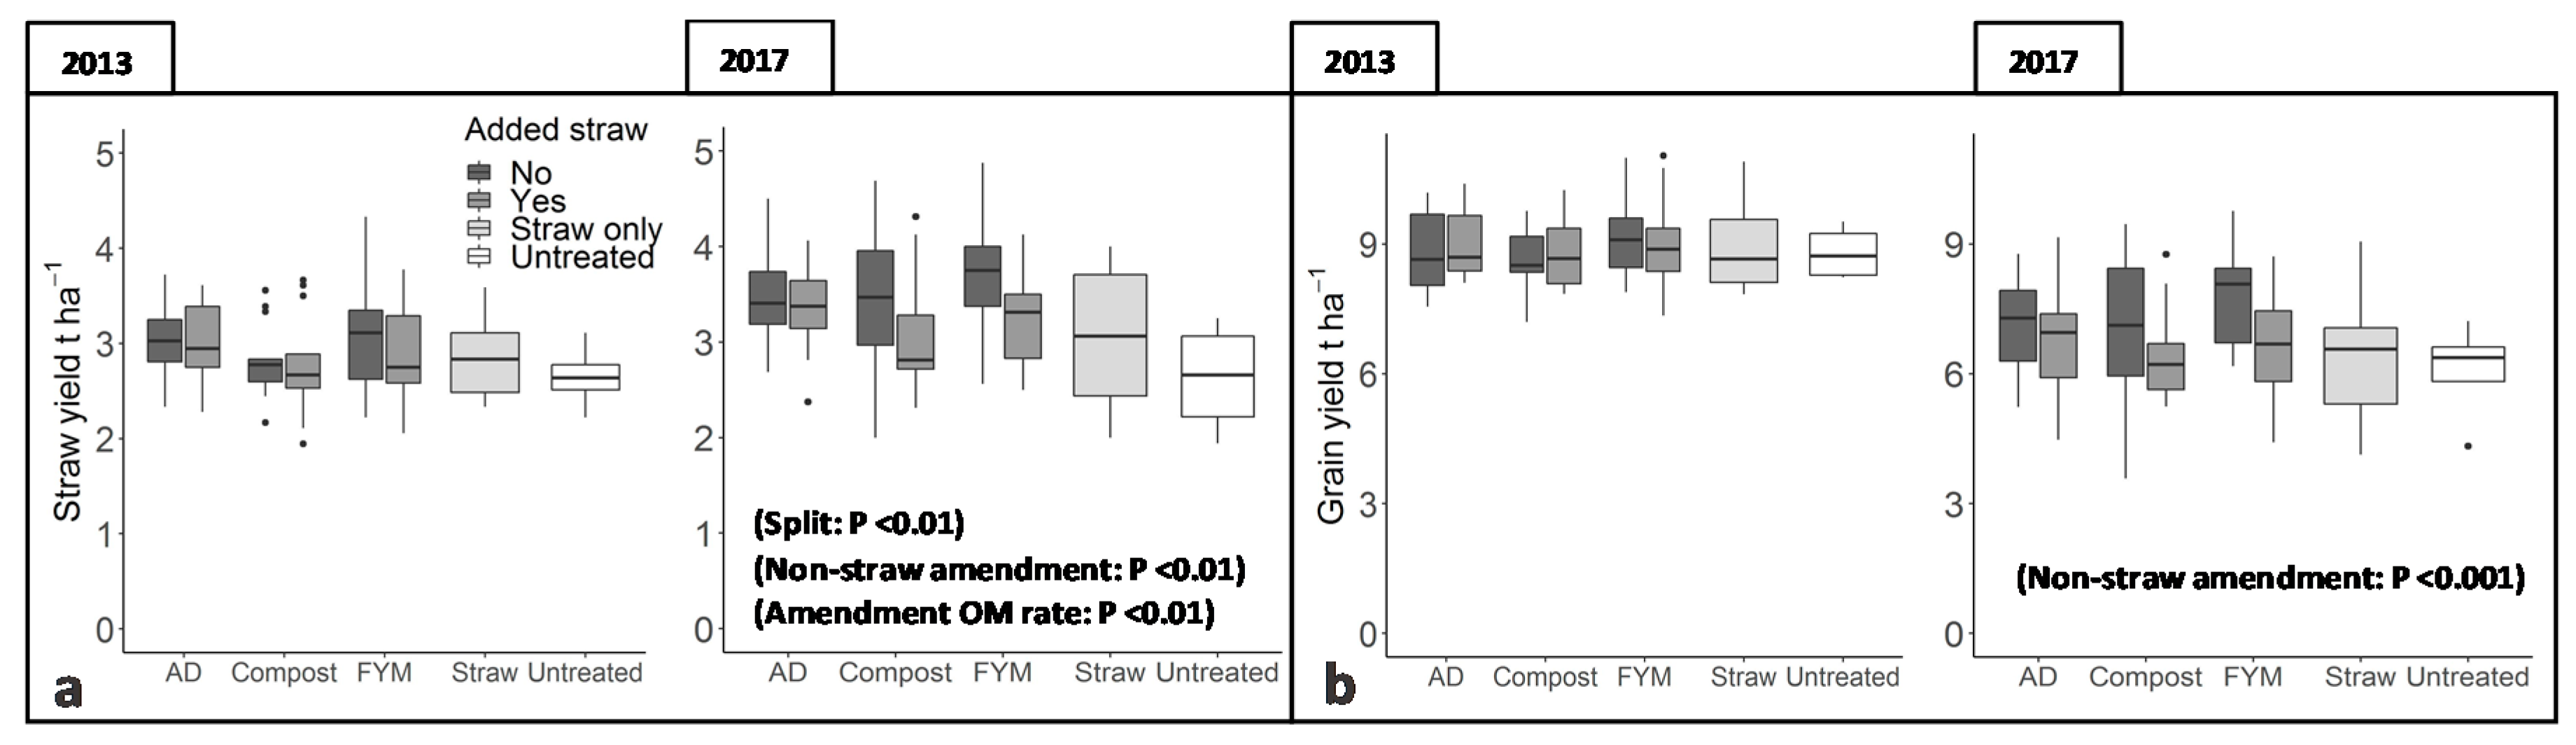
Figure 1 shows the median yield per amendment, pooled from the plots receiving the four different OM rates (n = 4 per OM rate, total n per treatment = 16) and separated for amendments with and without added straw, in the baseline year 2013 and in 2017. Averages for all four rates are shown because although straw and grain yields did increase with increasing rates, these differences were rarely significant.
In 2013, straw and grain yields were not significantly different between the amendment treatments and the control (Figure 1a,b), whereas, in 2017, the amendments without added straw had 28% greater straw yield compared to the control with means of 3.6 and 2.6 t ha−1, respectively (F = 10.0, p < 0.01, Figure 1a). There was also an effect of amendment application rate on straw yield, and the amendments without added straw which received the maximum application rate (4) had a 37% increase in straw yield compared to the control, with means of 4.1 and 2.6 t ha−1, respectively (F = 3.9, p < 0.01, Figure 1a). As with the straw yield, grain yield was 18% greater with the amendments without added straw compared to the untreated control with means of 7.4 and 6.1 t ha−1, respectively (F = 11.2, p <0.001, Figure 1b), and grain yield with the amendments without added straw which received the maximum application rate (4) was 7.9 compared to 6.1 t ha−1 in the control, although this difference was not significant. Yield did not differ significantly between the non-straw amendments, although the yield trend corresponded to a decreasing C:N ratio: AD > compost > FYM (Table1). However, the straw-only and amendment + straw treatments did not increase yield compared to the control.
Across all treatments, grain yields were smaller in 2017 compared with 2013, partly due to less favorable weather, and partly because the 2017 crop was a second cereal crop in the sequence.
3.2. Crop Straw Nutrient Contents
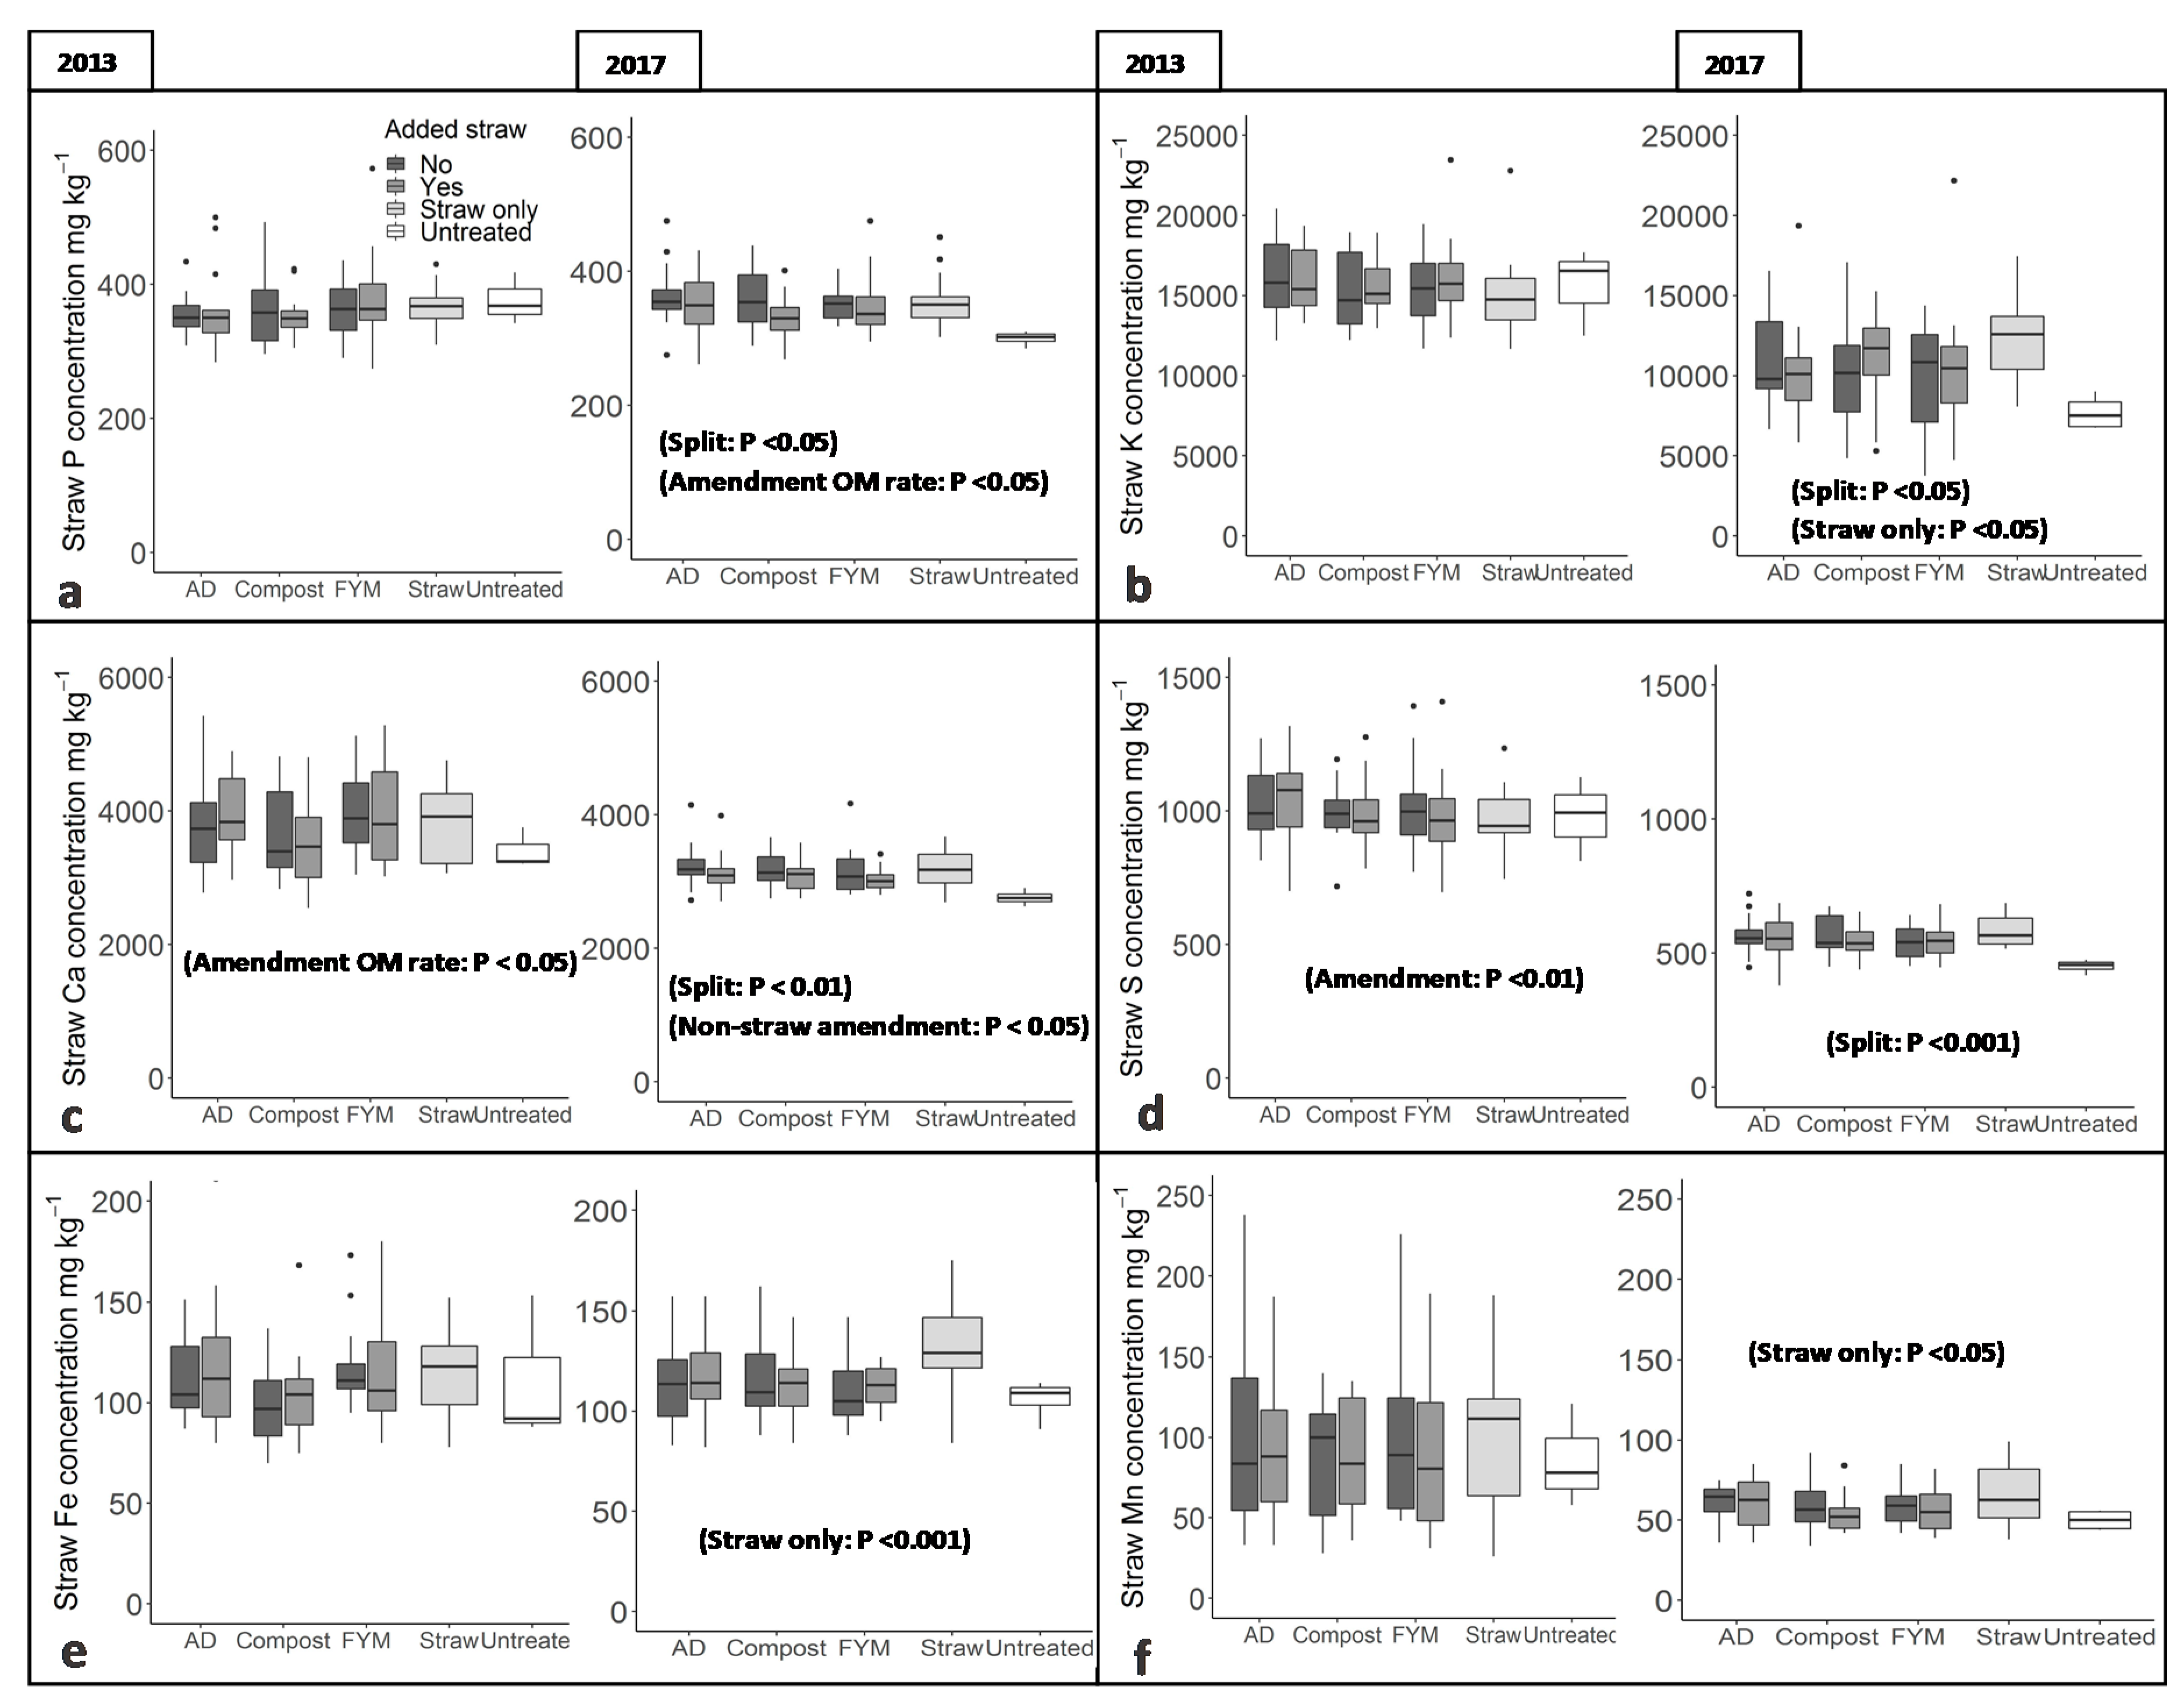
Increasing yields often cause a ‘biomass dilution’ of mineral nutrient concentration in the plant, i.e., the nutrient content is not proportional to biomass, which results in a smaller nutrient concentration. Thus, an assessment of nutrient concentration rather than total uptake (nutrient concentration × yield) will account for such biomass effects, especially when the results described above—Increasing yields with the use of amendments—Are considered.
In 2013, the straw concentrations of Ca as a function of OM rate (F = 2.5, p < 0.05) and S as a function of amendment type—Being greatest with AD treatment (F = 2.6, p < 0.01)—Differed significantly between the amended and control plots (Figure 2a–f). By contrast, in 2017 (Figure 2a–f), the straw of the amended crop compared to the control had significantly greater concentrations of P (F = 7.0, p < 0.05), K (F = 4.1, p < 0.05), Ca (F = 7.5, p < 0.01), and S (F = 11.1, p < 0.001). The straw of the straw-only treatment had greater concentrations of K (F = 4.1, p < 0.05), Fe (F = 12.6, p < 0.001), and Mn (F = 4.3, p < 0.05) compared to all other treatments. In the case of P concentration, there was also a significant effect of amendment without added straw application rate in 2017, with means of 400 mg kg−1 P with the maximum application rate (4) and 300 mg kg−1 in the control (F = 2.5, p < 0.05). Therefore, in 2017, the availability of nutrients was sufficient in the amended plots to facilitate both greater yield and nutrient concentrations compared to the untreated control, thus, no biomass-dilution was evident. However, nutrient concentrations did not differ significantly between the amendments, indicating that all amendments were able to maintain similar nutrient concentrations. Summary data are available in Supplementary Tables S1 and S2.
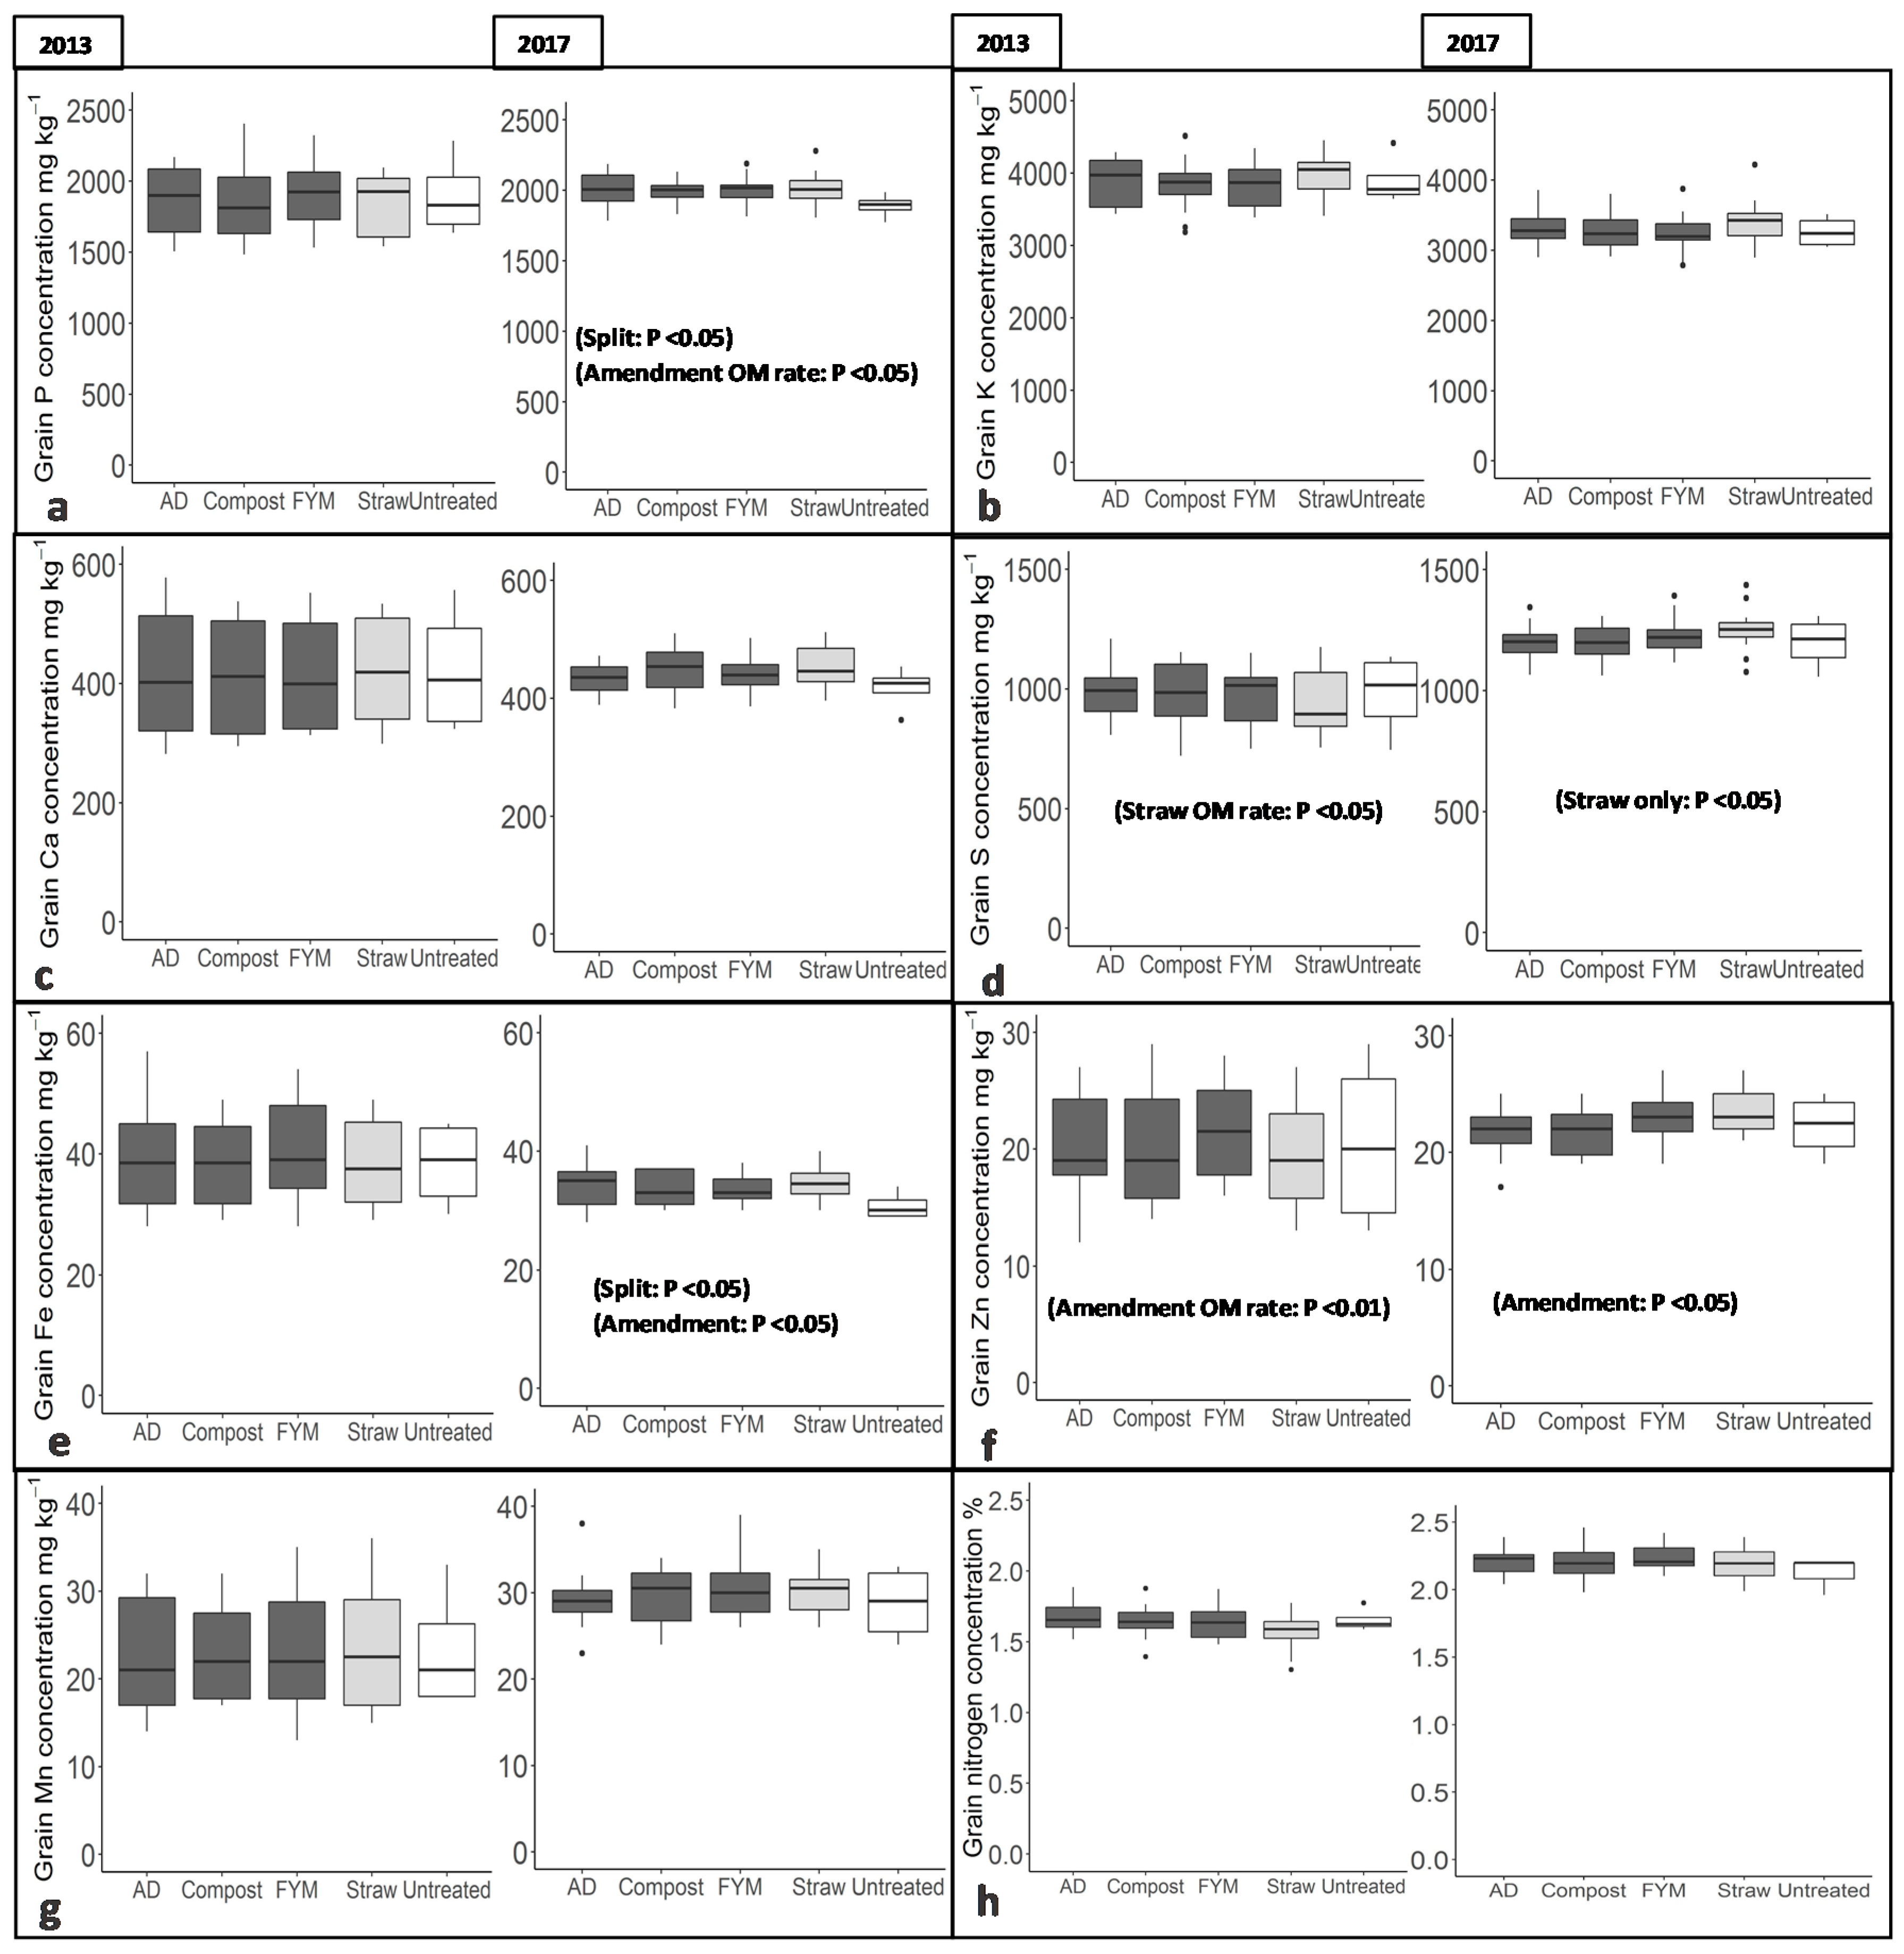
3.3. Crop Grain Nutrient Contents
In 2013, the grain S concentration decreased as a function of straw OM rate (F = 3.3, p < 0.05) and grain Zn concentration increased as a function of non-straw amendment OM rate (F = 4.6, p < 0.01, Figure 3a–h). In 2017, the grain from the amended as compared with the untreated control had a greater concentration of P (2000 and 1900 mg kg-1, respectively (F = 5.0, p < 0.05)), Fe (34 and 31 mg kg-1, respectively (F = 5.4, p < 0.05)) and Zn as a function of amendment type, being greater in the FYM and straw treatments (F = 2.4, p < 0.05, Figure 3a–h), and S, being greatest with the straw-only treatment (F = 3.9, p < 0.05). Summary data are available in Supplementary Tables S1 and S2.
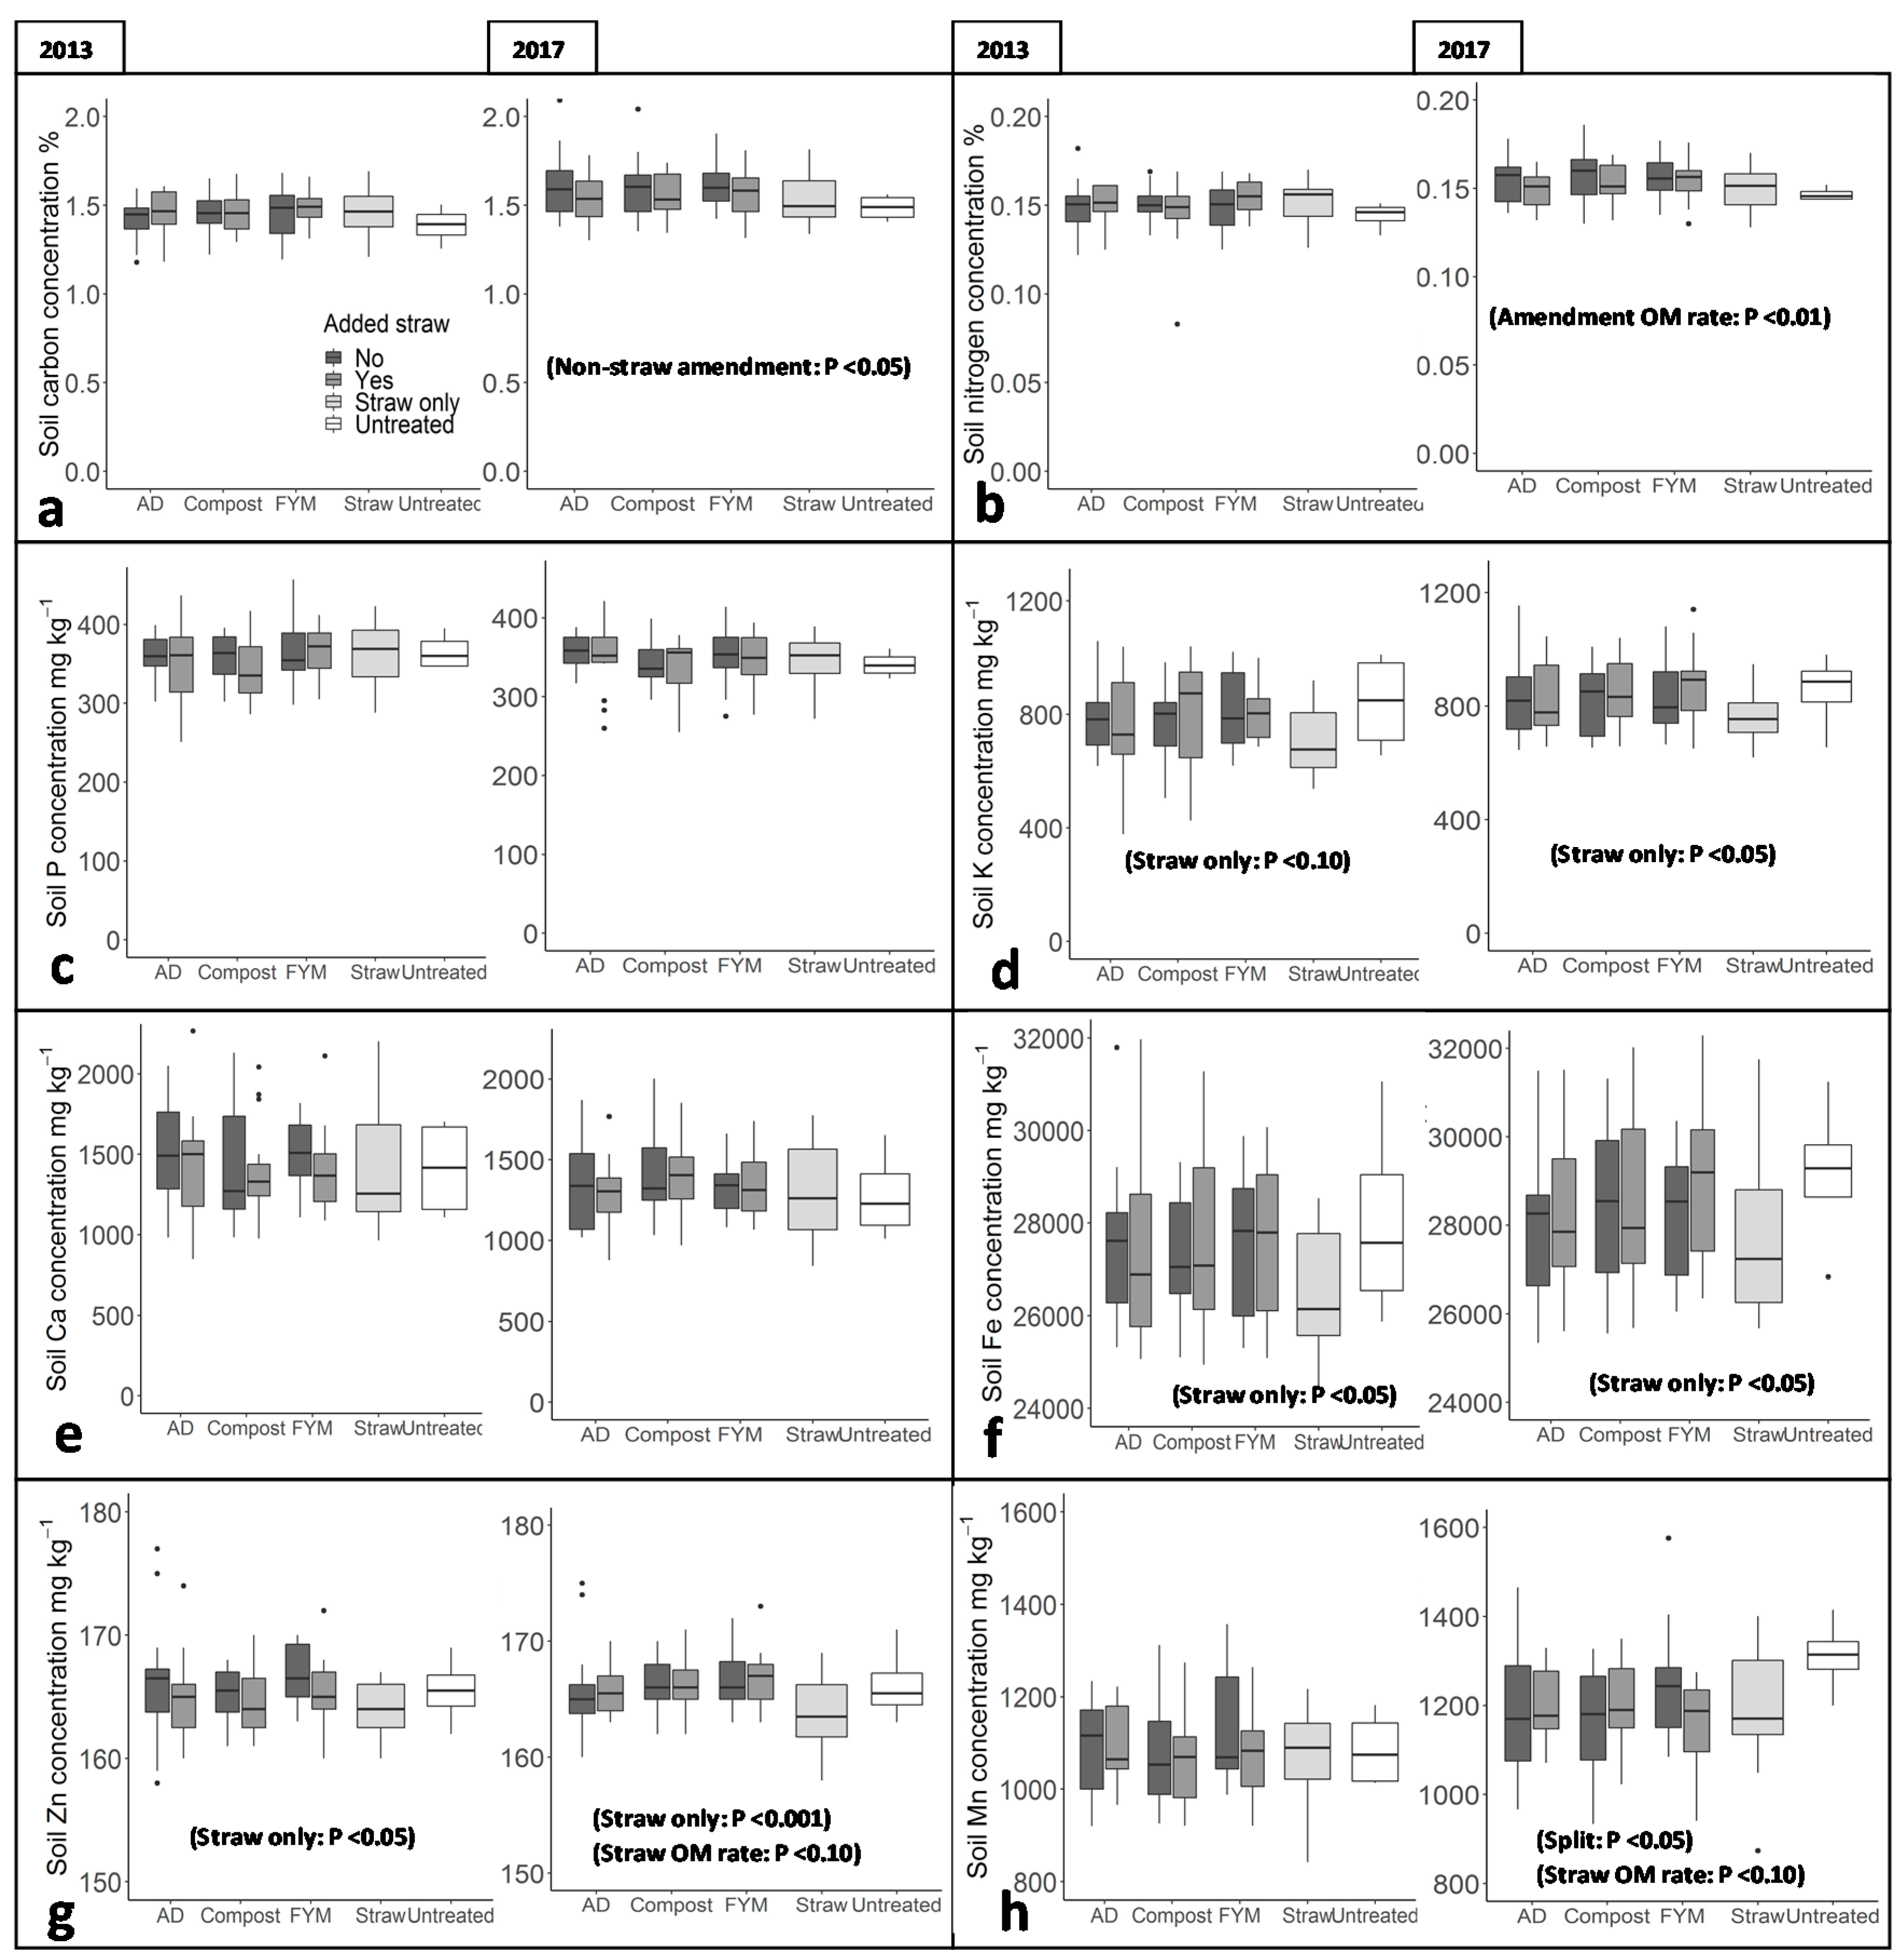
3.4. Soil Total Nutrient Contents
The trends in the soil total nutrient contents were very similar in 2013 and 2017. By 2017 the total nutrient content of the soil of the non-straw amended and untreated control showed only small differences. The soil of the non-straw amendments had a 7% greater total carbon concentration (1.60% versus 1.49%, respectively (F = 4.1, p < 0.05)), and a greater total carbon concentration as a function of OM rate (1.7% in the soil receiving the maximum application rate (4) and 1.5% in the untreated control (F = 3.7, p < 0.01)), as well as a greater total N concentration as a function of OM rate (0.16% in the soil receiving the maximum application rate (4) and 0.15% in the untreated control soil (F= 3.3, p < 0.01, Figure 4a–h)). In addition, soil from the untreated control had a significantly greater concentration of Mn compared to all amendment treatments (F = 5.8, p < 0.05). On the other hand, interestingly, the soil of the straw-only treatment had smaller concentrations of K (F = 3.8, p < 0.10 and F = 6.6, p < 0.05), Fe (F = 6.0, p < 0.05 and F = 6.6, p < 0.05), and Zn (F = 5.1, p < 0.05 and F = 12.7, p < 0.001), in both 2013 and 2017, respectively. Furthermore, concentrations of Zn and Mn were also significantly smaller with the straw-only treatment as a function of straw application rate (F = range 2.6–2.7, p 0.05–0.10). Summary data are available in Supplementary Tables S3 and S4.
4. Discussion
The maximum application rate (4) of C in this study was 3.5 t ha−1, which is equivalent to 35 t (fresh weight) FYM ha−1 [39]. In this study, the application of FYM at rate 3 increased the P and K applied to the soil by 11 and 55 kg ha−1 per year, respectively (Table 1). According to the Nutrient Management Guide, FYM at 35 t ha−1 supplies approx. 245 kg total N ha−1, as well as 25 kg available N ha−1, 55 kg of available P ha−1, and 209 kg available K ha−1 [39]. This compares with the winter wheat requirements, to yield 8 t/ha−1, of 220 kg available N ha−1, 65 kg available P ha−1, and 85 kg available K ha−1 [39]. Therefore, there is a shortfall in the amount of available N and P supplied to the crop by FYM alone. However, around 20%–30% of the organic N contained in manure slurry will be mineralized during the first season [45] and supply a considerable amount of the total available N needed by the crop. The organic P contained in FYM will be mineralized at around 0.9–4.2 mg P kg−1day−1 [46], and the surplus available K has good potential for long term storage in the soil [47]. Thus, farms which apply both manure and mineral fertilizer compared to those which apply mineral fertilizer only apply reduced levels of mineral fertilizers to winter wheat at rates of: N, 175 versus 191 kg ha−1; P, 15 versus 33 kg ha−1; and K, 25 versus 39 kg ha−1, respectively [39].
In 2013 there were no significant differences between the amended and untreated plots in straw and grain yield. However, by 2017, the straw yield was increased by 28% and grain yield by 18% in the non-straw amendment treatments compared to the control treatment (Figure 1). Nitrogen from organic fertilizers often shows little effect on crop growth in the first year of application, because organically bound N has a medium and long-term release in soil [34,48]. Estimates based on modelled field data indicate that after five years the cumulated net N mineralization of the organic N input of pig and cattle slurry would be 71% and 51%, respectively, compared to ~20% mineralization after the first season [45]. In addition, compost can initially immobilize mineral N for 30–70 days in the first season of application due to the high C:N ratio. It was observed that after the first year as the C:N ratio decreased and organic N became increasingly available, yield increased with the compost treatment compared to the treatment with mineral fertilizer only [37].
Regarding the availability of other macro and secondary nutrients in soil, soil samples taken at various times over a 25-year period from a long-term field experiment in Canada, which had received manure applications, indicated that repeated application of organic matter increases the proportion of potentially mineralizable P in soils, probably related to greater soil microbial and enzymatic activity over time [49]. An analysis of soil and grain sampled after 20 years from a long-term field experiment in Switzerland, comparing organic amendment-only and mineral-only fertilized systems, showed no difference in soil available and grain P concentrations between the two systems, although the residual and therefore potentially available P and microbial activity were higher in the organic system [50]. It has also been found that organic amendment-only soils had significantly less available P compared to the mineral-only fertilized soils [46]. After 3 years of application of different organic matter treatments, extractable P and K were observed to be lower with different organic matter treatments compared to a mineral-fertilizer only treatment, except for the P concentration under the FYM treatment [37]. In contrast, an increase in soil extractable P, K, Ca, and Mg has been observed with chicken manure application in a tropical soil [31]. In the present study, the increased crop nutrient concentrations after five seasons, but limited build-up of total soil carbon and nutrients, suggests an increased microbial population and therefore increased mineralization over time, making nutrients more immediately available, although we did not measure soil available nutrients.
The yield in 2017 (Figure 1) increased in the order straw < AD <compost < FYM, corresponding to a decreasing C:N ratio in the amendment (Table 1). Therefore, the crop grown on straw amended plots, including the co-amendment treatments, had smaller yields compared to the non-straw amended plots, indicating that the high C:N ratio of the straw amendment of ~100:1 (exceeding the ideal of 25:1) resulted in immobilization of inorganic N otherwise available for crop uptake and yield. This indicates that extra nitrogen was significant to yield, despite the application of the recommended rate of N to all treatments. The amount of straw applied in a co-compost treatment to reduce N leaching therefore needs to be well balanced to avoid yield loss.
Macro and secondary nutrients P, K, and S were highest in FYM and AD amendments, and micronutrients Zn and Mn were highest in the FYM amendment, whereas, Ca and Fe were highest in compost amendment (Table 1). Despite these differences, there were few significant differences between the non-straw amendments in the effect on crop straw and grain nutrient uptake, and they were all able to supply sufficient nutrients—particularly P, Ca, and S in the straw and P and Fe in the grain, even at the higher yields of 2017 (Figure 2 and Figure 3). It remained unclear whether these secondary nutrients were also important for the observed yield increase. Thus, organic amendments can counteract the shortfall in nutrient quality often experienced by high-yielding crops [23,24,25,26,27].
The straw of the crop grown on the straw-only amended plots had significantly greater concentrations of K and micro nutrients Fe and Mn compared to all other treatments (Figure 2). By contrast to the crop straw, the soil amended with straw-only had significantly decreased concentrations of total K, Fe, and Zn compared to other treatments, even after the first season (Figure 4). This indicates that the availability of these nutrients had increased, which led to a greater crop uptake, and probably leaching, depleting the total soil concentrations. This increased crop concentration of nutrients with straw-only amendment can in small part be explained by the smaller yield with the straw treatment, but this does not explain the decreased total soil concentrations. A higher soil availability of K, Fe, and Zn in the straw-only amended plots may be due the high C:N ratio and slower mineralization of straw, leading to more anoxic conditions in wet soil conditions, under which a different set of microbes which use, in particular, Fe and Mn for respiration-dissimilatory metal reduction, and make these metals more available in the soil [51]. The higher carbon content of the straw and therefore the greater microorganism requirement for nitrogen may also have increased mineralization of the soil carbon rather than mineralization of the amendment alone, and as K, Fe, and Zn only account for a small proportion of microbial biomass (1% of potassium and sulfur, 0.5% of calcium and magnesium, and 0.2% Fe and trace elements, compared to 14% nitrogen and 3% phosphorus) these nutrients would not be immobilized and would be more available in soil solution. Furthermore, plant uptake of K and Fe are often synergistic [52,53,54].
Previous research has shown that generally the availability of heavy metals decreases with increasing soil pH and organic matter, as carbonate or hydroxyl complexes, or stable complexes with humic substances are formed [55]. An increasing soil pH has been found with increasing manure application [32,56,57], as well as a smaller concentration of extractable heavy metals: Cd, Cu, Ni, and Zn with increasing manure rate [56]. Smaller available Zn and Cu was observed in soils with higher OM contents [57,58]. Higher extractable soil and grain Cd concentrations, but not so with Zn, were found with compost treatment [59]. Furthermore, Zn extractability from soil is negatively related to phosphate [60,61]. Thus, the total soil content of heavy metals would be expected to remain stable or increase with OM application. Indeed, an 11-year field study using various organic wastes found the total soil content of most heavy metals increased with organic amendment compared to the control, and the availability often did not increase [62]. In the present study, there was little or no effect of the non-straw amendments on the total soil and crop content of micronutrients (Figure 4). This indicates both that the nutrients mineralized from the non-straw amendment were sufficient for the increased crop yield and therefore not depleting the total soil content, and that all mineralized nutrients were taken up and/or leached and were not sorbed by the soil. However, this study only measured total and not extractable elements or pH of the soil, so the effect of the amendments on these properties cannot be commented on.
The soil total carbon concentrations showed only very small differences between the amended and untreated plots after five seasons. Similarly, in a 9-year field trial with plant and animal-based organic fertilizers, only in the FYM treatment did the SOC remain stable and not decrease [63]. After 3 years of application of different organic matter treatments, no significant differences in soil total C and N were found with organic matter treatment [37]. However, after 10 years in the Askov trials, the soil from the treatment receiving FYM had ~10% higher carbon concentrations compared to the mineral fertilized only treatment [64]. A 50% increase in soil carbon in a highly weathered tropical soil was found after just one year of compost amendment [65]. Thus, there is general agreement that within the first 10 years with modest applications of organic matter to typical arable soils there is limited organic carbon and nutrient build-up, but a greater build-up will occur in poorer soils and over longer periods. Also, it is a possible that a build-up of carbon occurred in the sub-soil <30 cm, as conventional ploughing can move organic matter down the soil profile and decrease it in the top 20 cm [66], however this was not measured in the present study.
5. Conclusions
The benefit of the non-straw organic amendments compared with the mineral-only fertilizer treatment was seen in the increasing yield and adequate supply of both macro and micro nutrients- P, Ca, S, and Fe, thus avoiding biomass-dilution of nutrient concentration in the higher-yielding crop. This benefit was not evident after one season of application but took time to develop. The nitrogen made available to the crop, and therefore yield, decreased with the increasing C:N ratio of the amendment, and consequently the straw-only treatment did not provide an increased yield compared to the untreated plots. However, with the straw-only treatment there was an increase in the uptake of K and micro nutrients Fe, Mn, and Zn. Yet, in the soil, only a very small change in total carbon, and no change in total nutrient content, except with the straw-only amendment, was observed after five years. The study also demonstrates that pXRF could deliver reliable screening of potential organic fertilizers and their effect on crop material.
Supplementary Materials
The following are available online at https://www.mdpi.com/2073-4395/9/12/776/s1: Supplementary Table S1. 2013 crop means; straw and grain yield, nutrient concentration (measured by pXRF) and grain N (measured by LECO), under organic amendment treatments: AD, compost, FYM and straw and mixtures of amendment + straw and the untreated control. Table S2. 2017 crop means; straw and grain yield, nutrient concentration (measured by pXRF) and grain N (measured by LECO), under organic amendment treatments: AD, compost, FYM and straw and mixtures of amendment + straw and the untreated control. Table S3. 2013 soil means; nutrient concentration (measured by pXRF) and C and N (measured by LECO), under organic amendment treatments: AD, compost, FYM and straw and mixtures of amendment + straw and the untreated control. Table S4. 2017 soil means; nutrient concentrations (measured by pXRF) and C and N (measured by LECO), under organic amendment treatments: AD, compost, FYM and straw and mixtures of amendment + straw and the untreated control. The datasets generated during and/or analyzed during the current study are available from the corresponding author on reasonable request.
Author Contributions
Conceptualization, A.W., S.P.M. and S.H.; data curation, C.L.T.; formal analysis, C.L.T.; funding acquisition, S.M.H.; investigation, C.L.T.; methodology, G.E.A. and S.M.H.; project administration, A.P.W.; writing–original draft, C.L.T.; writing–review & editing, G.E.A., A.P.W., S.P.M. and S.M.H.
Funding
This work was funded by the Africa Soil Information Service (AfSIS) project through the Bill & Melinda Gates Foundation, and BBSRC in the Soil to Nutrition programme (BBS/E/C/000I0130).
Acknowledgments
We are grateful for support from collaborators on the AfSIS project at ICRAF (World Agroforestry Centre) Keith Shepherd, Erick Towett, Elvis Weullow, and Andrew Sila in calibrating the pXRF instrument.
Conflicts of Interest
The authors declare no conflict of interest.
References
- DEFRA. British Survey of Fertilizer Practice. Fertilizer Use on Farm for the 2017 Crop Year; Crown: York, UK, 2018; pp. 1–112. [Google Scholar]
- DEFRA. Greenhouse Gas Mitigation Practices—England Farm Practices Survey 2018; Crown: London, UK, 2019. [Google Scholar]
- DEFRA. British Survey of Fertilizer Practice Fertilizer Use on Farm Crops for the 2018 Crop Year; Crown: London, UK, 2019; pp. 1–116. [Google Scholar]
- Case, S.D.C.; Oelofse, M.; Hou, Y.; Oenema, O.; Jensen, L.S. Farmer perceptions and use of organic waste products as fertilizers—A survey study of potential benefits and barriers. Agric. Syst. 2017, 151, 84–95. [Google Scholar] [CrossRef]
- Wong, J.H.; Ho, C.S.; Mansor, N.N.A.; Lee, C.T. Mitigation of Greenhouse Gases Emission through Food Waste Composting and Replacement of Chemical Fertilizer. Chem. Eng. Trans. 2017, 56, 367–372. [Google Scholar]
- Eurostat. Municipal Waste Statistics. 2019. Available online: https://ec.europa.eu/eurostat/statistics-explained/index.php?title=File:Municipal_waste_landfilled,_incinerated,_recycled_and_composted_in_the_EU-28,_1995_to_2017.png (accessed on 23 May 2019).
- European Commission. Directive 1999/31/EC. 1999. Available online: https://eur-lex.europa.eu/legal-content/EN/TXT/?uri=CELEX%3A31999L0031 (accessed on 23 May 2019).
- Committee on Climate Change (CCC). Factsheet: Waste and F-Gases. 2016. Available online: https://www.theccc.org.uk/wp-content/uploads/2013/03/Waste-and-F-gases-factsheet-2015-v1.1.pdf (accessed on 19 May 2019).
- European Environment Agency (EEA). Managing Municipal Solid Waste—A Review of Achievements in 32 European Countries. 2013. Available online: https://www.eea.europa.eu/publications/managing-municipal-solid-waste (accessed on 21 May 2019).
- Rothamsted Research. Electronic Rothamsted Archive. Hoosfield Continuous Spring Barley Experiment Soils. 2017. Available online: http://www.era.rothamsted.ac.uk/Hoos/hfsoils#SEC4 (accessed on 4 May 2019).
- Poulton, P.; Johnston, J.; Macdonald, A.; White, R.; Powlson, D. Major limitations to achieving “4 per 1000” increases in soil organic carbon stock in temperate regions: Evidence from long-term experiments at Rothamsted Research, United Kingdom. Glob. Chang. Biol. 2017, 24, 2563–2584. [Google Scholar] [CrossRef] [PubMed]
- Foereid, B.; Hogh-Jensen, H. Carbon sequestration potential of organic agriculture in northern Europe—A modelling approach. Nutr. Cycl. Agroecosys 2004, 68, 13–24. [Google Scholar] [CrossRef]
- Duxbury, J.M.; Smith, M.S.; Doran, J.M. Soil Organic Matter as a Source and a Sink of Plant Nutrients. In Dynamics of Soil Organic Matter in Tropical Ecosystems; University of Hawaii: Honolulu, HI, USA, 1989; Volume 2, pp. 33–67. [Google Scholar]
- Rothamsted Research. Electronic Rothamsted Archive. Hoosfield Spring Barley Mean Long-Term Yields. 2017. Available online: https://doiorg/1023637/KeyRefOAHByields (accessed on 6 April 2019).
- Yadav, R.L.; Dwivedi, B.S.; Prasad, K.; Tomar, O.K.; Shurpali, N.J.; Pandey, P.S. Yield trends, and changes in soil organic-C and available NPK in a long-term rice-wheat system under integrated use of manures and fertilizers. Field Crops Res. 2000, 68, 219–246. [Google Scholar] [CrossRef]
- Rasmussen, P.E.; Parton, W.J. Long Term Effects of Residue Management in Wheat-Fallow: I Inputs, Yield and Soil Organic Matter. Soil Sci. Soc. Am. J. 1994, 58, 523–530. [Google Scholar] [CrossRef]
- Liu, E.; Yan, C.; Mei, X.; He, W.; Bing, S.H.; Ding, L.; Liu, Q.; Liu, S.; Fan, T. Long-term effect of chemical fertilizer, straw, and manure on soil chemical and biological properties in northwest China. Geoderma 2010, 158, 173–180. [Google Scholar] [CrossRef]
- Edmeades, D.C. The long-term effects of manures and fertilizers on soil productivity and quality: A review. Nutr. Cycl. Agroecosys 2003, 66, 165–180. [Google Scholar] [CrossRef]
- Hijbeek, R.; van Ittersum, M.K.; ten Berge, H.F.M.; Gort, G.; Spiegel, H.; Whitmore, A.P. Do organic inputs matter—A meta-analysis of additional yield effects for arable crops in Europe. Plant Soil 2017, 411, 293–303. [Google Scholar] [CrossRef]
- Edmeades, D.C. The magnesium requirements of pastures in New Zealand: A review. N. Z. J. Agric. Res. 2004, 47, 363–380. [Google Scholar] [CrossRef]
- Davis, D.R. Declining fruit and vegetable nutrient composition: What is the evidence? HortScience 2009, 44, 15–19. [Google Scholar] [CrossRef]
- Hermans, C.; Conn, S.J.; Chen, J.; Xiao, Q.; Verbruggen, N. An update on magnesium homeostasis mechanisms in plants. Metallomics 2013, 5, 1170–1183. [Google Scholar] [CrossRef] [PubMed]
- Fan, M.-S.; Zhao, F.-J.; Fairweather-Tait, S.S.; Poulton, P.R.; Dunham, S.J.; McGrath, S.P. Evidence of decreasing mineral density in wheat grain over the last 160 years. J. Trace Elem. Med. Biol. 2008, 22, 315–324. [Google Scholar] [CrossRef] [PubMed]
- Ficco, D.B.M.; Riefolo, C.; Nicastro, G.; De Simone, V.; Di Gesu, A.M.; Beleggia, R.; Platani, C.; Cattivelli, L.; De Vita, P. Phytate and mineral elements concentration in a collection of Italian durum wheat cultivars. Field Crops Res. 2009, 111, 235–242. [Google Scholar] [CrossRef]
- White, P.J.; Broadley, M.R. Historical variation in the mineral composition of edible horticultural products. J. Hortic. Sci. Biotechnol. 2005, 80, 660–667. [Google Scholar] [CrossRef]
- Peterson, C.J.; Johnson, V.A.; Mattern, P.J. Evaluation of variation in mineral element concentrations in wheat flour and bran of different cultivars. Cereal Chem. 1983, 60, 450–455. [Google Scholar]
- Oury, F.X.; Leenhardt, F.; Remesy, C.; Chanliaud, E.; Duperrier, B.; Balfourier, F.; Charmet, G. Genetic variability and stability of grain magnesium, zinc and iron concentrations in bread wheat. Eur. J. Agron. 2006, 25, 177–185. [Google Scholar] [CrossRef]
- McGrath, S.P.; Chambers, B.J.; Taylor, M.J.; Carlton-Smith, C.H. Biofortification of zinc in wheat grain by the application of sewage sludge. Plant Soil 2012, 361, 97–108. [Google Scholar] [CrossRef]
- Hattab, S.; Bougattass, I.; Hassine, R.; Dridi-Al-Mohandes, B. Metals and micronutrients in some edible crops and their cultivation soils in eastern-central region of Tunisia: A comparison between organic and conventional farming. Food Chem. 2019, 270, 193–298. [Google Scholar] [CrossRef]
- Hadayat, N.; De Oliveira, L.M.; Da Silva, E.; Han, L.; Hussain, M.; Liu, X.; Ma, L.Q. Assessment of trace metals in five most-consumed vegetables in the US: Conventional vs. organic. Environ. Pollut. 2018, 243, 292–300. [Google Scholar] [CrossRef]
- Steiner, C.; Teixeira, W.G.; Lehmann, J.; Nehls, T.; Vasconcelos de Macedo, J.L.; Blum, W.; Zech, W. Long term effects of manure, charcoal and mineral fertilization on crop production and fertility on a highly weathered Central Amazonian upland soil. Plant Soil 2007, 291, 275–290. [Google Scholar] [CrossRef]
- Gruter, R.; Costerousse, B.; Bertoni, A.; Mayer, J.; Thonar, C.; Frossard, E.; Schulin, R.; Tandy, S. Green manure and long-term fertilization effects on soil zinc and cadmium availability and uptake by wheat (Triticum aestivum L.) at different growth stages. Sci. Total Environ. 2017, 599–600, 1330–1343. [Google Scholar] [CrossRef] [PubMed]
- de Medeiros, E.V.; Silva, A.O.; Duda, G.P.; dos Santos, U.J.; de Souza Junior, A.J. The combination of Arachis pintoi green manure and natural phosphate improves maize growth, soil microbial community structure and enzymatic activities. Plant Soil 2019, 435, 175–185. [Google Scholar] [CrossRef]
- Gutser, R.; Ebertseder Th Weber, A.; Schram, M.; Schmidhalter, U. Short-term and residual availability of nitrogen after long-term application of organic fertilizers on arable land. J. Plant Nutr. Soil Sci. 2005, 168, 439–446. [Google Scholar] [CrossRef]
- Antil, R.S.; Bar-Tal, A.; Fine, P.; Hadas, A. Predicting Nitrogen and Carbon Mineralization of Composted Manure and Sewage Sludge in Soil. Compost Sci. Util. 2011, 19, 33–43. [Google Scholar] [CrossRef]
- Erhart, E.; Hartl, W.; Putz, B. Biowaste compost affects yield, nitrogen supply during the vegetation period and crop quality of agricultural crops. Eur. J. Agron. 2005, 23, 305–314. [Google Scholar] [CrossRef]
- Pinto, R.; Brito, L.M.; Coutinho, J. Organic production of horticultural crops with green manure, composted farmyard manure and organic fertilizer. Biol. Agric. Hortic. 2017, 33, 269–284. [Google Scholar] [CrossRef]
- Peigne, J.; Ball, B.C.; Roger-Estrade, J.; David, C. Is conservation tillage suitable for organic farming? A review. Soil Use Manag. 2007, 23, 129–144. [Google Scholar] [CrossRef]
- Agriculture and Horticulture Development Board. Nutrient Management Guide (RB209). Section 2. Organic Materials. Available online: https://ahdb.org.uk/knowledge-library/rb209-section-2-organic-materials (accessed on 25 April 2019).
- Paltridge, N.G.; Palmer, L.J.; Milham, P.J.; Guild, G.E.; Stangoulis, J.C.R. Energy-dispersive X-ray fluorescence analysis of zinc and iron concentration in rice and pearl millet grain. Plant Soil 2012, 361, 251–260. [Google Scholar] [CrossRef]
- McLaren, T.I.; Guppy, C.N.; Tighe, M.K. A Rapid and Non-destructive Plant Nutrient Analysis using Portable X-Ray Fluorescence. Soil Sci. Soc. Am. J. 2012, 76, 1446–1453. [Google Scholar] [CrossRef]
- Resende, L.V.; Nascente, C.C. A simple method for the multi-elemental analysis of organic fertilizer by slurry sampling and total reflection X-ray fluorescence. Talanta 2016, 147, 485–492. [Google Scholar] [CrossRef] [PubMed]
- McWhirt, A.; Weindorf, D.C.; Zhu, Y. Rapid Analysis of Elemental Concentrations in Compost Via Portable X-ray Fluorescence Spectrometry. Compost Sci. Util. 2012, 20, 185–193. [Google Scholar] [CrossRef]
- Agriculture and Horticulture Development Board. Nutrient Management Guide (RB209). Section 4. Arable Crops. Available online: https://ahdb.org.uk/knowledge-library/rb209-section-4-arable-crops (accessed on 17 August 2012).
- Sorensen, P.; Thomsen, I.K.; Schroder, J.J. A model of animal manure nitrogen mineralisation in soil. In Proceedings of the 2016 International Nitrogen Initiative Conference, “Solutions to Improve Nitrogen Use Efficiency for the World”, Melbourne, Australia, 4–8 December 2016. [Google Scholar]
- Oehl, F.; Frossard, E.; Fliessbach, A.; Dubois, D.; Oberson, A. Basal organic phosphorus mineralization in soils under different farming systems. Soil Biol. Biochem. 2004, 36, 667–675. [Google Scholar] [CrossRef]
- Arienzo, M.; Christen, E.W.; Quayle, W.; Kumar, A. A review of the fate of potassium in the soil–plant system after land application of wastewaters. J. Hazard Mater. 2009, 164, 415–422. [Google Scholar] [CrossRef] [PubMed]
- Sorensen, P. Immobilisation, remineralisation and residual effects in subsequent crops of dairy cattle slurry nitrogen compared to mineral fertilizer nitrogen. Plant Soil 2004, 267, 285–296. [Google Scholar] [CrossRef]
- Whalen, J.K.; Chang, C.; Olson, B.M. Nitrogen and phosphorus mineralization potentials of soils receiving repeated annual cattle manure applications. Biol. Fertil. Soils 2001, 34, 334–341. [Google Scholar] [CrossRef]
- Oberson, A.; Fardeau, J.C.; Besson, J.M.; Sticher, H. Soil phosphorus dynamics in cropping systems managed according to conventional and biological agricultural methods. Biol. Fertil. Soils 1993, 16, 111–117. [Google Scholar] [CrossRef]
- Dixit, R.; Wasiullah Malaviya, D.; Pandiyan, K.; Singh, U.B.; Sahu, A.; Shukla, R.; Singh, B.P.; Rai, J.P.; Sharma, P.K.; Lade, H.; et al. Bioremediation of heavy metals from soil and aquatic environment: An overview of principles and criteria of fundamental processes. Sustainability 2015, 7, 2180–2212. [Google Scholar] [CrossRef] [Green Version]
- Bolle-Jones, E.W. The effect of varied nutrient levels on the concentration and distribution of manganese within the potato plant. Plant Soil 1955, 6, 45–60. [Google Scholar] [CrossRef]
- Alam, S.; Rahman, M.H.; Kamei, S.; Kawai, S. Alleviation of Manganese Toxicity and Manganese-Induced Iron Deficiency in Barley by Additional Potassium Supply in Nutrient Solution. J. Soil Sci. Plant Nutr. 2002, 3, 387–392. [Google Scholar] [CrossRef] [Green Version]
- Malvi, U.R. Interaction of micronutrients with major nutrients with special reference to potassium. J. Agric. Sci. 2011, 24, 106–109. [Google Scholar]
- Colombo, C.; Palumbo, J.-Z.H.; Pinton, R.; Cesco, S. Review on iron availability in soil: Interaction of Fe minerals, plants and microbes. J. Soils Sediments 2014, 14, 538–548. [Google Scholar] [CrossRef]
- Narwal, R.P.; Singh, B.R. Effect of organic materials on partitioning, extractability and plant uptake of metals in an alum shale soil Water. Water Air Soil Pollut. 1998, 103, 405–421. [Google Scholar] [CrossRef]
- Ramzani, P.M.A.; Khalid, M.; Naveed, M.; Ahmad, R.; Shahid, M. Iron biofortification of wheat grains through integrated use of organic and chemical fertilizers in pH affected calcareous soil. Plant Physiol. Biochem. 2016, 104, 284–293. [Google Scholar] [CrossRef]
- Clemente, R.; Escolar, A.; Bernal, M.P. Heavy metals fractionation and organic matter mineralisation in contaminated calcareous soil amended with organic materials. Bioresour. Technol. 2006, 97, 1894–1901. [Google Scholar] [CrossRef]
- McGrath, S.P.; Sanders, J.R.; Shalaby, M.H. The effects of soil organic matter levels on soil solution concentrations and extractabilities of manganese, zinc and copper. Geoderma 1988, 42, 177–188. [Google Scholar] [CrossRef]
- Schweizer, S.A.; Seitz, B.; van der Heijden, M.G.A.; Schulin, R.; Tandy, S. Impact of organic and conventional farming systems on wheat grain uptake and soil bioavailability of zinc and cadmium. Sci. Total Environ. 2018, 639, 608–616. [Google Scholar] [CrossRef]
- Rengel, Z. Availability of Mn, Zn and Fe in the rhizosphere. J. Soil Sci. Plant Nutr. 2015, 15, 397–409. [Google Scholar] [CrossRef] [Green Version]
- Wierzbowska, A.; Hanus-Fajerska, E.; Muszynska, E.; Ciarkowska, K. Natural organic amendments for improved phytoremediation of polluted soils: A review of recent progress. Pedosphere 2018, 26, 1–12. [Google Scholar]
- Raup, J.; Oltmanns, M. Farmyard manure, plant based organic fertilizers, inorganic fertilizer—Which sustains soil organic matter best? Asp. Appl. Biol. 2016, 79, 273–276. [Google Scholar]
- Schjonning, P.; Christensen, B.T.; Carstensen, B. Physical and chemical properties of a sandy loam receiving animal manure, mineral fertilizer and no fertilizer for 90 years. Eur. J. Soil Sci. 1994, 45, 257–268. [Google Scholar] [CrossRef]
- Steiner, C.; Glaser, B.; Teixeira, W.G.; Lehmann, J.; Blum, W.E.H.; Zech, W. Nitrogen retention and plant uptake on a highly weathered central Amazonian Ferralsol amended with compost and charcoal. Eur. J. Soil Sci. 2008, 171, 893–899. [Google Scholar] [CrossRef]
- Stockfisch, N.; Forstreuter, T.; Ehlers, W. Ploughing effects on soil organic matter after twenty years of conservation tillage in Lower Saxony, Germany. Soil Tillage Res. 1999, 52, 91–101. [Google Scholar] [CrossRef]
Figure 1.
Median (± 25th and 75th quartiles, 95% CI and outliers) of (a) straw yield and (b) grain yield in the baseline year 2013 and in 2017. Wheat (and barley in 2013) was grown on plots treated with different organic matter amendments or without amendment. The amended plots also had additional straw or not (Yes and No, respectively). All plots had received the same rate of inorganic fertilizer. Per treatment the results are pooled from plots receiving different OM rates; 1–4 (n = 4 of each, total n = 16).

Figure 2.
Median (± 25th and 75th quartiles, 95% CI and outliers) straw concentration of (a) phosphorus, (b) potassium, (c) calcium, (d) sulfur, (e) iron, and (f) manganese in the baseline year 2013 and in 2017. Wheat (and barley in 2013) was grown on plots treated with different organic matter amendments or without amendment. The amended plots also had additional straw or not (Yes and No, respectively). All plots had received the same rate of inorganic fertilizer. Per treatment the results are pooled from plots receiving different OM rates; 1–4 (n = 4 of each, total n = 16).

Figure 3.
Median (± 25th and 75th quartiles, 95% CI and outliers) grain concentration of (a) phosphorus, (b) potassium, (c) calcium, (d) sulfur, (e) iron, (f) zinc, g. manganese, and h. nitrogen in the baseline year 2013 and in 2017. Wheat (and barley in 2013) was grown on plots treated with different organic matter amendments or without amendment. All plots had received the same rate of inorganic fertilizer. Per treatment the results are pooled from plots receiving different OM rates; 1–4 (n = 4 of each, total n = 16).

Figure 4.
Median (± 25th and 75th quartiles, 95% CI and outliers) soil concentration of (a) total carbon, (b) total nitrogen, (c) phosphorus, (d) potassium, (e) calcium, (f) iron, (g) zinc, and (h) manganese in the baseline year 2013 and in 2017. Wheat (and barley in 2013) was grown on plots treated with different organic matter amendments or without amendment. The amended plots also had additional straw or not (Yes and No, respectively). All plots had received the same rate of inorganic fertilizer (RB209 recommended rate). Per treatment the results are pooled from plots receiving different OM rates; 1–4 (n = 4 of each, total n = 16).


Table 1.
Total C and N and C:N ratio, and macro and micro nutrient concentration (measured using pXRF) of the amendments: anaerobic digestate, compost, FYM and straw, in the baseline season (2013), after 5 seasons (2017), and as an average of the analyses from each of the 5 seasons.
Table 1.
Total C and N and C:N ratio, and macro and micro nutrient concentration (measured using pXRF) of the amendments: anaerobic digestate, compost, FYM and straw, in the baseline season (2013), after 5 seasons (2017), and as an average of the analyses from each of the 5 seasons.
| Season | Anaerobic Digestate | Compost | FYM | Straw | |
|---|---|---|---|---|---|
| Total C (%) | 2013 | 41.7 | 29.3 | 30.8 | 45.9 |
| 2017 | 43.4 | 19.5 | 37.1 | 43.4 | |
| 5-year average | 42.7 | 24.1 | 34.6 | 45.2 | |
| Total N (%) | 2013 | 2.4 | 1.4 | 2.7 | 0.5 |
| 2017 | 1.5 | 1.5 | 2.8 | 0.6 | |
| 5-year average | 1.9 | 1.4 | 2.5 | 0.5 | |
| Extra added per year (at rate 3, kg ha−1) | 48 | 35 | 63 | 13 | |
| C:N | 2013 | 17:1 | 21:1 | 11:1 | 92:1 |
| 2017 | 30:1 | 13:1 | 13:1 | 74:1 | |
| 5-year average | 24:1 | 18:1 | 14:1 | 104:1 | |
| P (mg kg−1) | 2013 | 4300 | 1900 | 4300 | 600 |
| 2017 | 5000 | 2600 | 4400 | 627 | |
| Extra added per year (at rate 3, kg ha−1) | 11.6 | 5.6 | 10.9 | 1.5 | |
| K (mg kg−1) | 2013 | 16,700 | 9000 | 12,000 | 12,900 |
| 2017 | 16,600 | 12,500 | 31,800 | 11,900 | |
| Extra added per year (at rate 3, kg ha−1) | 41.6 | 26.9 | 54.8 | 31 | |
| Ca (mg kg−1) | 2013 | 9900 | 23,800 | 13,400 | 3400 |
| 2017 | 5800 | 18,100 | 12,600 | 5000 | |
| Extra added per year (at rate 3, kg ha−1) | 19.6 | 52.4 | 32.5 | 10.5 | |
| Mg (mg kg−1) | 2013 | 2900 | 2800 | 3400 | 960 |
| 2017 | 3100 | 4000 | 3600 | 760 | |
| Extra added per year (at rate 3, kg ha−1) | 7.5 | 8.5 | 8.8 | 2.2 | |
| S (mg kg−1) | 2013 | 5300 | 2200 | 3500 | 414 |
| 2017 | 2200 | 2100 | 3700 | 1400 | |
| Extra added per year (at rate 3, kg ha−1) | 9.4 | 5.4 | 9 | 2.3 | |
| Fe (mg kg−1) | 2013 | 2300 | 9000 | 5200 | 77 |
| 2017 | 600 | 10,600 | 2600 | 147 | |
| Extra added per year (at rate 3, kg ha−1) | 3.6 | 24.5 | 9.8 | 0.3 | |
| Zn (mg kg−1) | 2013 | 47 | 70 | 140 | 11 |
| 2017 | 41 | 51 | 266 | 11 | |
| Extra added per year (at rate 3, kg ha−1) | 0.1 | 0.2 | 0.5 | 0.03 | |
| Mn (mg kg−1) | 2013 | 102 | 143 | 357 | 47 |
| 2017 | 89 | 197 | 374 | 81 | |
| Extra added per year (at rate 3, kg ha−1) | 0.2 | 0.4 | 0.9 | 0.2 |
© 2019 by the authors. Licensee MDPI, Basel, Switzerland. This article is an open access article distributed under the terms and conditions of the Creative Commons Attribution (CC BY) license (http://creativecommons.org/licenses/by/4.0/).
Share and Cite
MDPI and ACS Style
Thomas, C.L.; Acquah, G.E.; Whitmore, A.P.; McGrath, S.P.; Haefele, S.M. The Effect of Different Organic Fertilizers on Yield and Soil and Crop Nutrient Concentrations. Agronomy 2019, 9, 776. https://doi.org/10.3390/agronomy9120776
AMA Style
Thomas CL, Acquah GE, Whitmore AP, McGrath SP, Haefele SM. The Effect of Different Organic Fertilizers on Yield and Soil and Crop Nutrient Concentrations. Agronomy. 2019; 9(12):776. https://doi.org/10.3390/agronomy9120776
Chicago/Turabian StyleThomas, Cathy L., Gifty E. Acquah, Andrew P. Whitmore, Steve P. McGrath, and Stephan M. Haefele. 2019. "The Effect of Different Organic Fertilizers on Yield and Soil and Crop Nutrient Concentrations" Agronomy 9, no. 12: 776. https://doi.org/10.3390/agronomy9120776
Note that from the first issue of 2016, this journal uses article numbers instead of page numbers. See further details here.