1. Introduction
One of the most important threats of climate change is its impact on the availability of freshwater resources. Globally, the biggest draw of water resources is the agriculture sector, expending around 70% of the total freshwater resources [
1,
2,
3]. The world’s increasing population is adding strain on agricultural production to satisfy the demand for food and for animal feed. Meeting these growing food needs is pushing decision makers toward intensifying agricultural activity, therefore raising the agriculture water demand for the purpose of irrigation. Irrigation monitoring is essential to support the implementation of water management policies and increase water use efficiency [
4,
5,
6]. Monitoring irrigation activities does not only include spatial quantification of the irrigated areas, but also gathering knowledge about the frequency of irrigation and the corresponding water consumption [
6,
7,
8,
9,
10].
At larger scales, remote sensing is a powerful tool for land surface monitoring. The Earth Observation (EO) data available now at enormous spatial scales makes it possible to achieve land surface monitoring, including and not limited to several agricultural and hydrological applications [
11,
12,
13,
14,
15]. Remote sensing has proven its great potential and efficiency in irrigation applications where several techniques and models were developed to produce irrigation maps and the detection of the frequency of irrigation, as well as for the estimation of the irrigation water consumption at the local, regional and national scales. The large-scale monitoring of irrigation, at national and regional scales, is beneficial to estimate accurate irrigation water consumption, which in return could be useful for authorities to detect, follow and reduce the illegal water abstractions from rivers and groundwater aquifers especially in countries that lack precise water consumption declarations by farmers and suffer from water scarcity.
Recently, several studies have exploited Synthetic Aperture Radar (SAR) data and optical data for the monitoring of irrigated areas [
7,
8,
9,
16,
17,
18,
19,
20,
21,
22,
23]. The proxy-measure of irrigation (mapping and irrigation frequency) using SAR data relies on the variation in the surface soil moisture (SSM), which has been demonstrated to correlate well with radar backscattering coefficients [
24,
25,
26,
27,
28,
29]. On the other hand, optical data were commonly used to map the irrigated surface using the difference in the spectral signature between irrigated and rain-fed areas. Due to the abundance of water in irrigated plots, they usually harbor more intense photosynthesis and denser biomass, thus leading to differences in the spectral signature between irrigated plots and comparable rain-fed plots. These differences are likely visible using vegetation indices derived from multispectral optical satellites such as the normalized difference vegetation index (NDVI), the normalized difference water index (NDWI) and the normalized difference red-edge index (NDRE) [
30,
31]. The combined use of optical and SAR data proved the capability of obtaining, on one hand, accurate irrigated area maps, as well as precise monitoring of the frequency of irrigation [
19,
31,
32].
Currently, the only SAR and optical EO data that offer continuous monitoring of the land surface at the combined high temporal (five to six days revisit time before the loss of S1B sensor on 3 August 2022) and spatial resolutions (up to 10 m) are the Sentinel-1 and Sentinel-2 satellite data. Where Sentinel-1 ensures continuous SAR imaging for six days of temporal resolution, the Sentinel-2 offers four days of revisit time for optical images. Several studies showed that the C-band (5.405 GHz) SAR time series from the Sentinel-1 (S1) satellite is efficient for mapping irrigated areas and for detecting irrigation frequency (irrigation episodes) [
7,
16,
33]. Models built using the S1 C-band data rely on detecting the changes in the backscattering of the SAR coefficient between consecutive images (at a time difference of six days), such as the one developed by Bazzi et al. [
32,
33], Le Page et al. [
34] and Ouaadi et al. [
35], that is basically related to changes in the surface soil moisture (about 3 to 5 cm depth in the C-band). A sharp increase in the backscattering coefficients between two S1 images can be attributed to a sharp increase in surface soil moisture, caused either by an irrigation episode or by a rainfall event. On the other hand, a decrease in the SAR backscattering coefficients between consecutive S1 images is evidence of a decrease in soil moisture values and thus the absence of any water input caused by either rainfall or irrigation. Since models built using S1 data for irrigation detection rely on change detection between the consecutive S1 images, the revisit time of the satellite is the most important factor that limits the irrigation detection capability. In fact, after a wetting event (irrigation, rainfall), the surface soil moisture evaporates in a few days. If SSM increased from 15–20 vol.% to 30–40 vol.% with the wetting event, it returns to 15–20 vol.% after about three days (in the case of loam soil texture [
28,
36]). However, the rate of drying out of the soil following a wetting event (days needed to dry out completely) may vary according to on the soil texture.
In the context of agricultural areas, the effect of vegetation cover on the SAR backscattering signal cannot be disregarded. In fact, the penetration of the SAR signal through the canopy cover to reach the soil layer and detect soil moisture information is highly dependent on the characteristics of the vegetation canopy: characteristics such as structure, biomass, vegetation water content and vegetation density. There are other factors affecting SAR penetration through vegetation, specifically, the SAR wavelength used. Bazzi et al. [
37] analyzed the sensitivity of the SAR signal in C- (wavelength ~6 cm) and L-bands (wavelength ~24 cm) for the detection of the irrigation events. They concluded that when the vegetation is moderately developed (NDVI ≤ 0.7), the C-band temporal variation remains sensitive to the soil moisture dynamics and the irrigation events can be detected. However, a well-developed vegetation cover constrains the detection of irrigation when using the C-band wavelength for a few crop types. They showed that over Gramineae (cereal) crops (such as Wheat and Barley) the SAR backscattering response to the irrigation event was negligible when the vegetation was highly developed. However, legume crop types did not show any constraint for irrigation detection using the C-band SAR signal even in the presence of well-developed vegetation cover. On the other hand, the L-band with a higher wavelength did not show any limitation in the irrigation detection in the presence of well-developed vegetation cover. In the same context, El Hajj et al. [
36] showed for LAI (leaf area index) values beyond 1.5 m
2/m
2 with a vegetation height of approximately 70 cm in Wheat crops, the C-band S1-SAR signal in VV and VH polarizations becomes insensitive to surface soil moisture. Similarly, Baghdadi et al. [
38] also showed that the sensitivity of the SAR signal in the C-band (VV polarization) decreases from 0.11 dB/vol.% for low biomass values to 0.05 dB/vol.% for biomass values greater than 1 kg/m
2 (NDVI ~0.7).
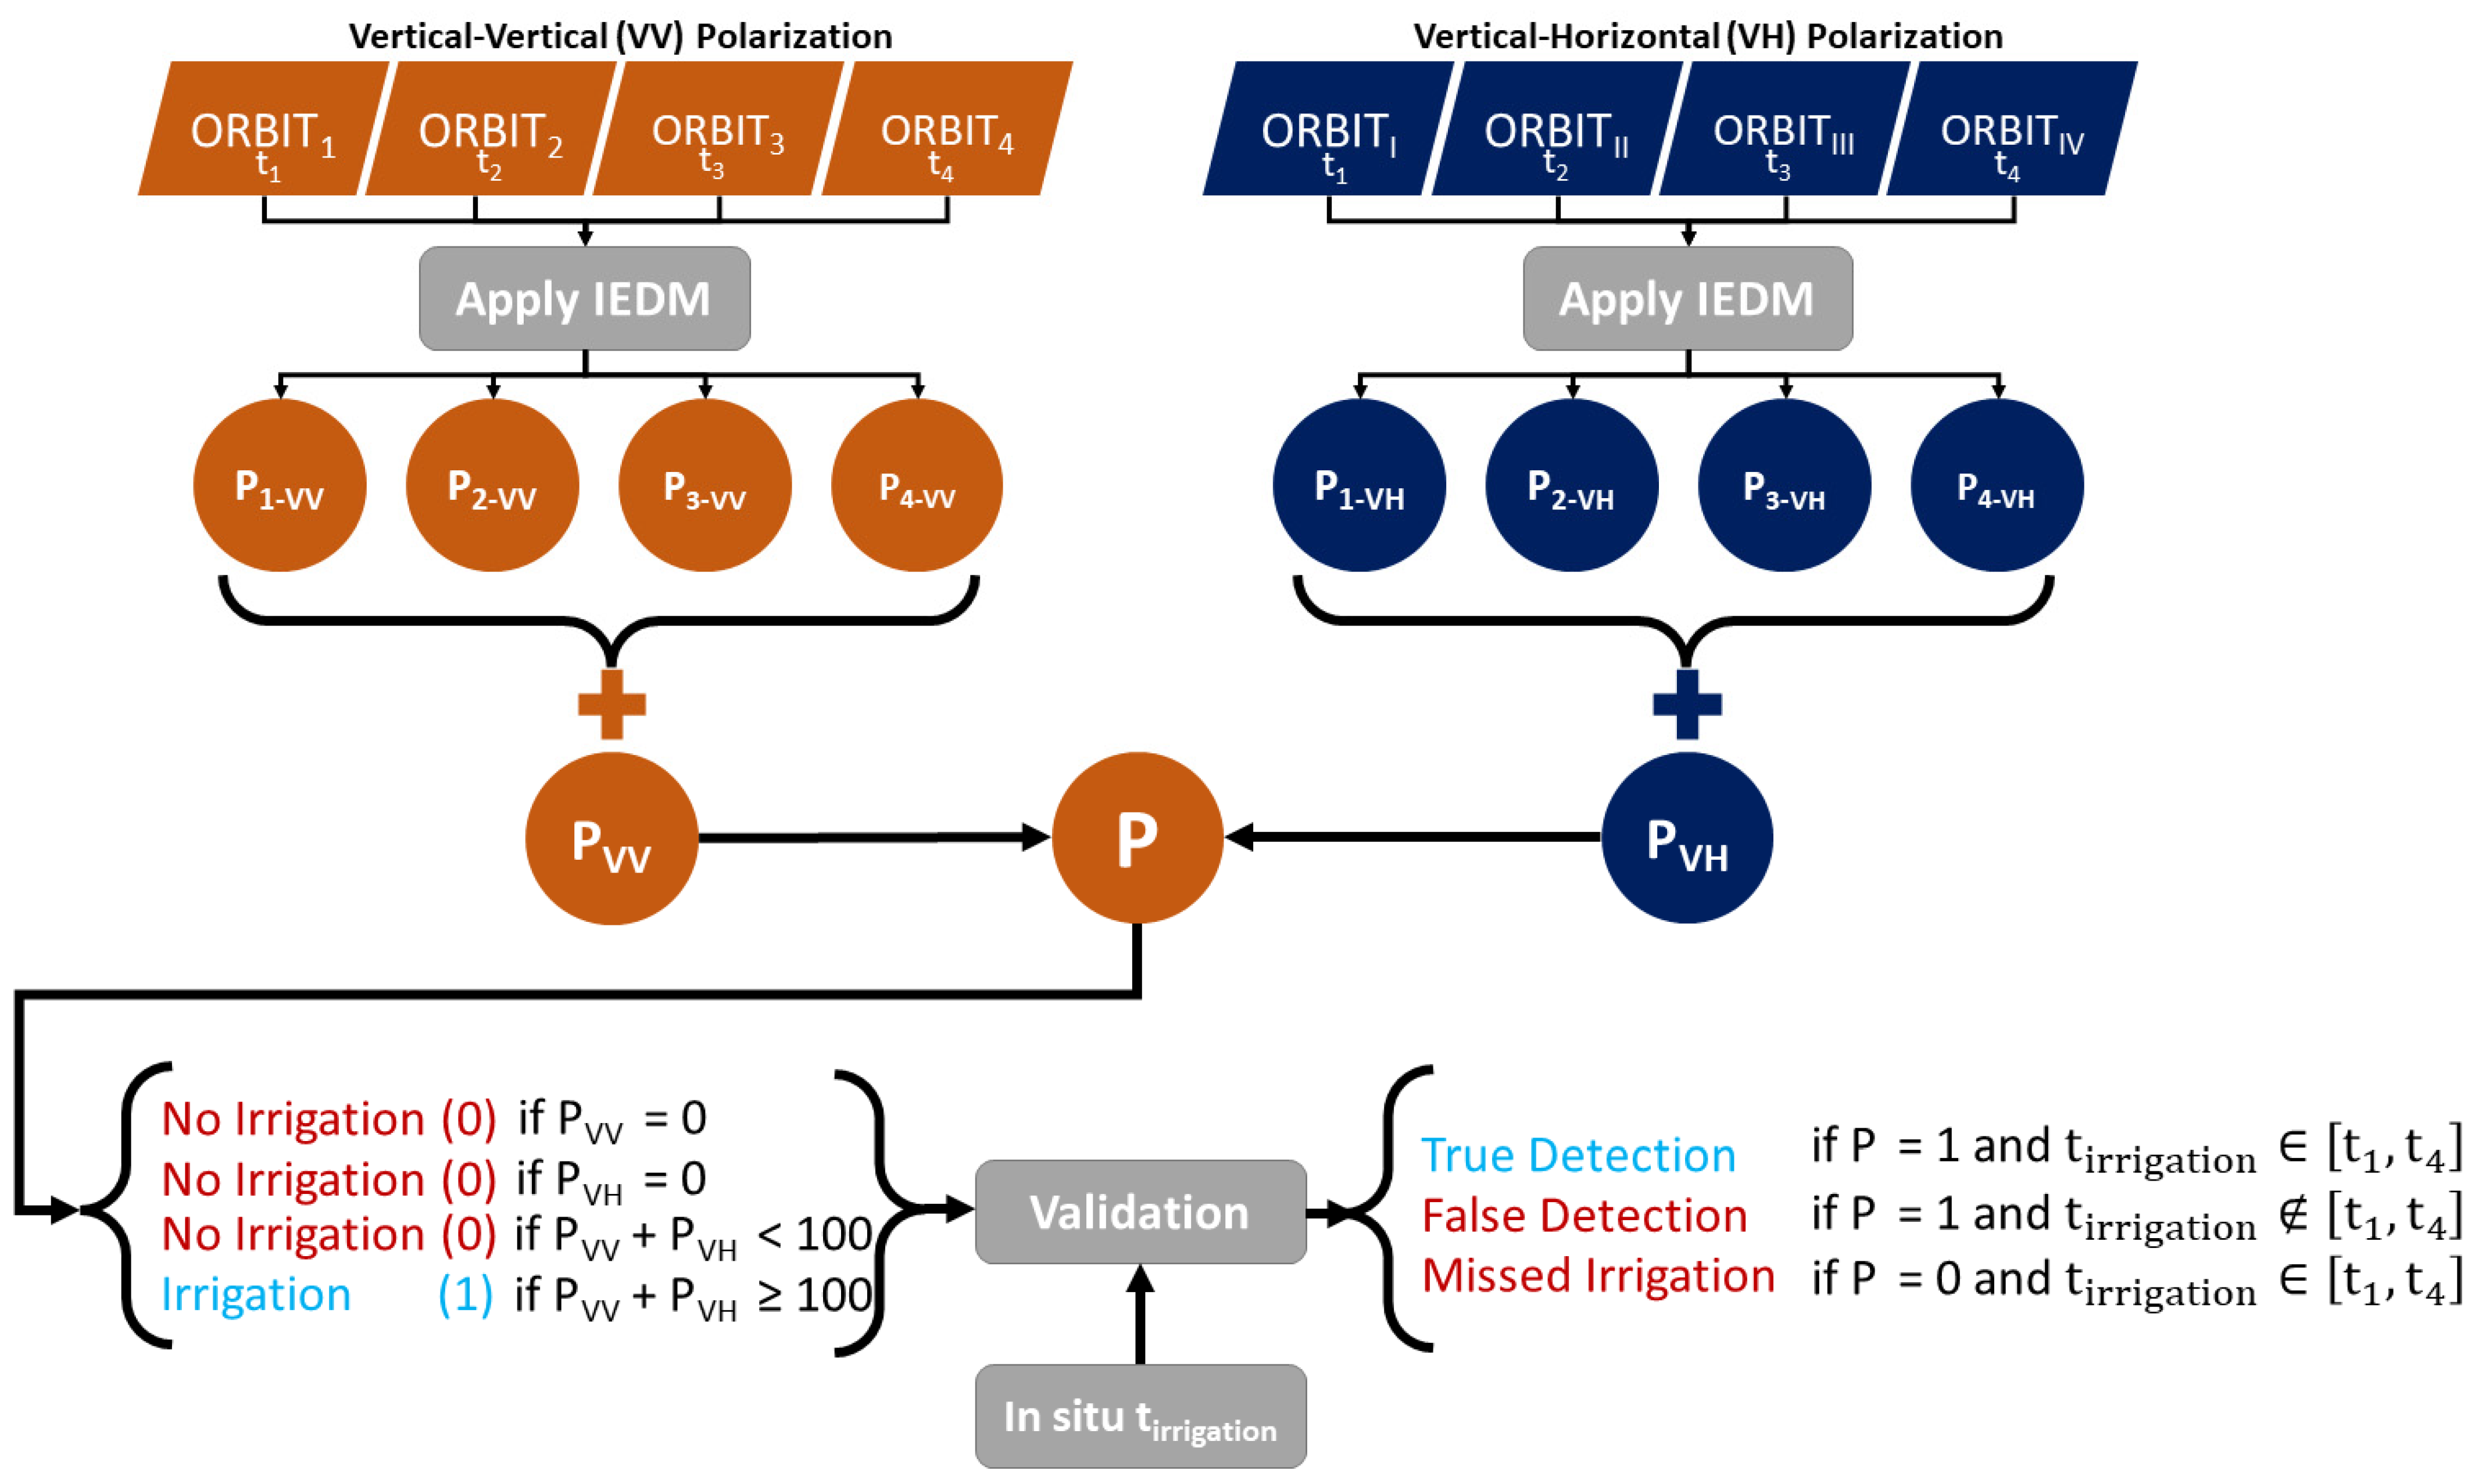
In a recent study, Bazzi et al. [
33] proposed an algorithm called the IEDM (Irrigation Event Detection Model) to detect irrigation events at the plot scale. This algorithm mainly relies on the change detection in the S1 C-band backscattering coefficients where the increase in the SAR backscattering coefficient is mainly due to the increase in the soil moisture values caused either by a rainfall event or by an irrigation episode. To separate irrigation from rainfall, they compared the S1 backscattering signal at the plot scale to that at the basin scale (grid scale of 10 km × 10 km). The assumption says that if the increase in the plot scale backscattering coefficient is due to rainfall, all the surrounding plots must encounter the same variation and therefore the SAR backscattering at grid scale would also increase. On the other hand, the occurrence of an irrigation episode would affect only the targeted plot, thus the increase in the SAR signal at the plot scale accompanied with a stability or decrease at grid scale is evidence of a local change in soil moisture at the plot level, and thus it is the effect of irrigation and not rainfall [
7,
14]. In Bazzi et al. [
33], they proposed that the IEDM could be suitable for operational near-real-time application for irrigation detection at the plot scale.
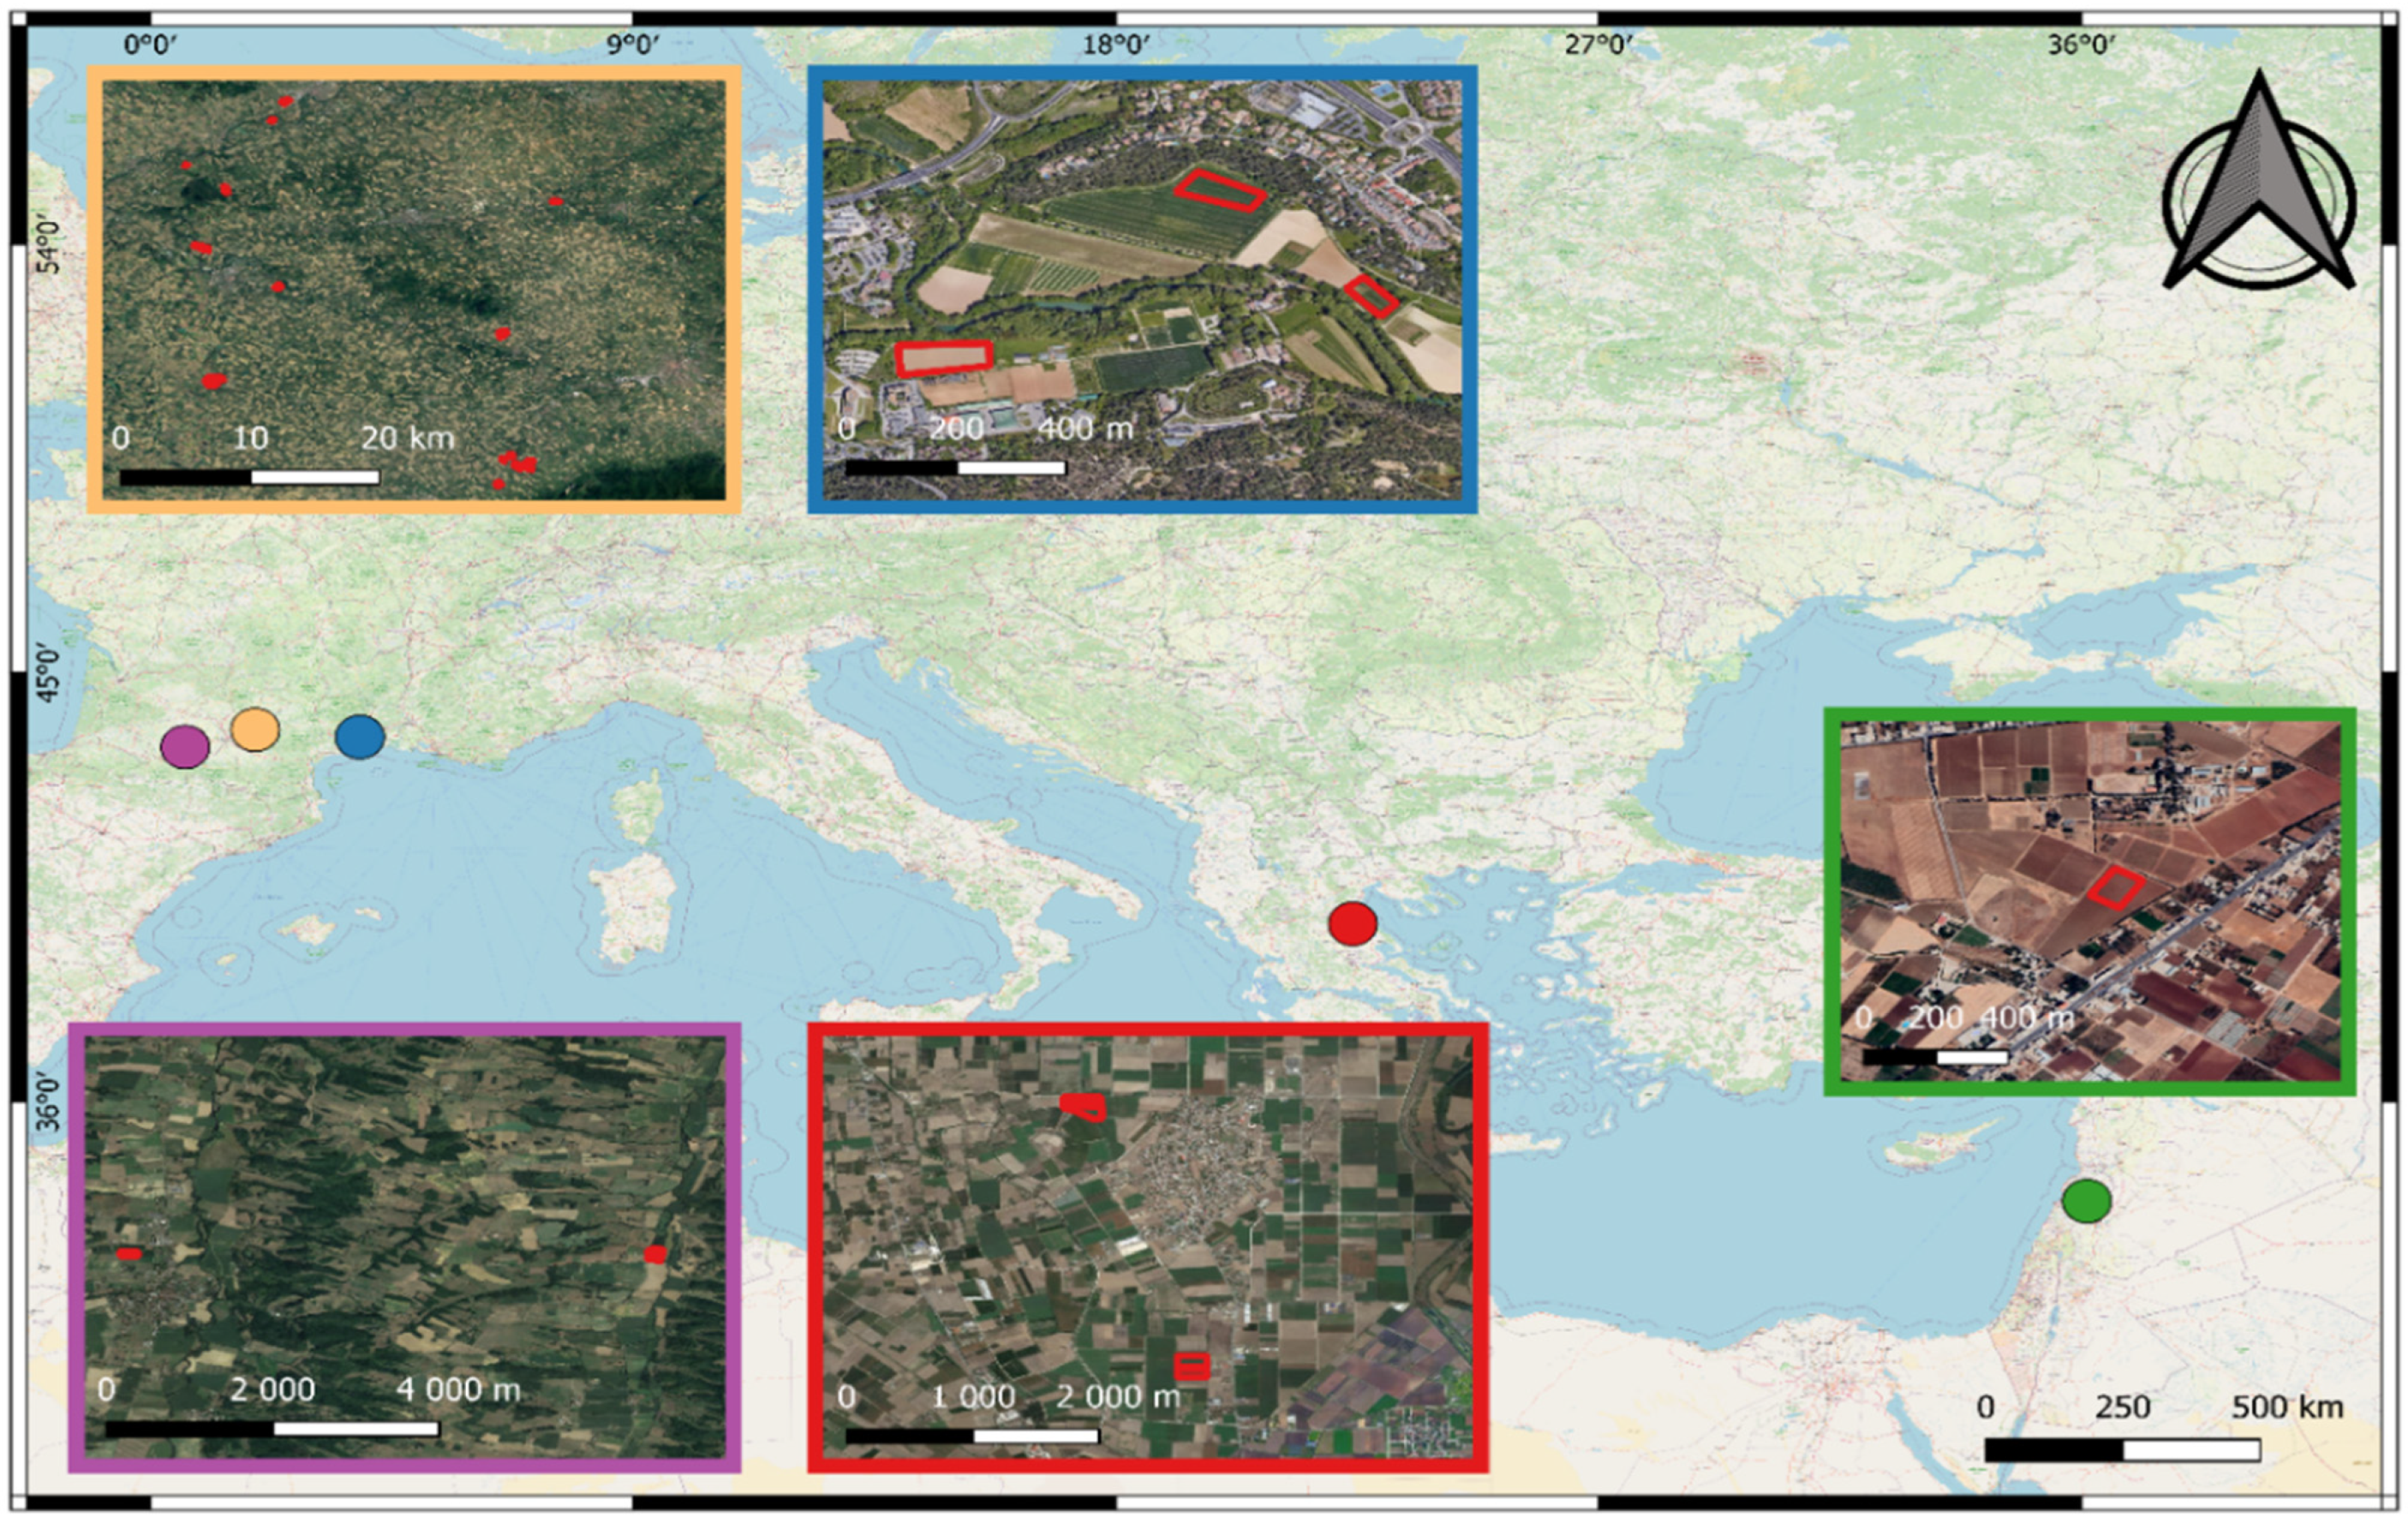
The integration of the IEDM as an operational tool to detect irrigation events in a near-real-time scenario requires first a deep assessment of the strength and limitations of the IEDM. Our objective in this study is to assess the feasibility of using the IEDM and S1 time series for irrigation detection by considering the maximum likelihoods that may be encountered in an operational application of the IEDM mainly regarding the climatic conditions and the crop type. To do so, we collected a wide database of irrigation that contains irrigation data from different climatic regions and over several summer crops. This kind of assessment may help understand the applicability of the IEDM at large scales. The study was carried out over five study sites in Tarn, France; West Occitanie, France; East Occitanie, France; Bekaa Valley, Lebanon; and the Thessaly region, Greece. Crop types included common summer irrigated crops such as Maize, Soybean, Sorghum and Potato. The climate among sites varies from semi-arid to temperate. The IEDM was applied at the agricultural plot scale and the accuracy of irrigation detection was analyzed according to the climatic conditions, vegetation development and the frequency of the available S1 images (S1 orbits and S1 revisit time).
3. Results
3.1. IEDM Accuracy for Irrigation Detection
Table 3 summarizes the recall, precision and F-score values of each study site at each year and for each specific crop type. In the Tarn study (temperate climate), the recall values of the Maize crop ranged between 43% and 57% between 2017 and 2019 with an F-score value reaching 64% in 2019 and its lowest value in 2018 (51%). The Soybean crops showed generally lower recall and F-score values in Tarn compared to Maize across the three years, with recall values ranging between 31% and 63% and an F-score between 42% and 59%. This indicates that generally, over Tarn the model performed better on Maize than on Soybean for three years with one out of two irrigations not detected. The four Soybean plots in the OW site (temperate climate) in 2020 with a total of 20 irrigation events showed a recall value of 66%, indicating the proper detection of 14 out of the 21 irrigation events. An additional four false-detected events on the four plots (average of one false detection per plot) were detected with a precision value reaching 76%, leading to an F-score of 70%. In the OE site with semi-arid climatic conditions, the results showed better accuracy for the detection of the irrigation events. For the three plots Maize, Soybean and Sorghum, the F-score value reached 89%, 86% and 83%, respectively. High recall and precision values for OE also ensures the good detection of almost all the irrigation events with very few false irrigation detections. The Potato plot in Lebanon’s semi-arid region also showed similar results to that of the OE. Out of 12 irrigations, 10 irrigations were correctly detected and only 1 false detection was observed, leading to a recall, precision and F-score of 83%, 91% and 87%, respectively. Similarly, the two Maize plots in Greece with a total of 22 irrigation events had a recall value of 72%, with 16 out of 22 irrigation events detected. Only two false detections were detected on the two plots (average of one false detection per plot), with a precision reaching 84% and an F-score reaching 75%.
Generally, across all sites, years and crop types, 60% of the irrigation events were detected (recall) with a precision of 76% and an F-score of 67%. The overall false detections for all the 38 plots with a total number of irrigations of 273 reached 53 false detections, with an average of 1 to 2 false detections per plot per season (the number of irrigations per plot is between 5 and 30 irrigations depending on crop type and the climatic zone).
3.2. Effect of the Climatic Conditions
The irrigation detection could be limited depending on the studied climatic region. To better understand the effect of the climatic conditions on the detection of the irrigation events, we calculated the accuracy metrics per climatic conditions considering OE, LB and GR as belonging to the arid to semi-arid region and TR and OW as belonging to the temperate region. Data from the two climatic conditions were considered regardless of the crop type and the studied year, even though both factors play an important role in the irrigation detection.
Table 4 shows the recall, precision and F-score calculated per climatic region by considering the sum of all detected, undetected and falsely detected irrigation events in each climatic region. The results clearly show that over the semi-arid climatic conditions better detection of irrigation events is achieved with a recall value reaching 86% (86% of the total irrigation events summed for all semi-arid sites are detected) with an F-score of 85%. Less accuracy is obtained for temperate regions (TR and OW together) where the recall reaches only 49% (approximately half of the irrigation events are detected) and an F-score of 53% (
Table 4). These results ensure that in drier conditions, with rare rainfall events in the summer season and generally drier soil, clearer separation between the dry and the wet states could be obtained, and therefore, clearer capture of the increases in soil moisture that are linked to irrigation events could be detected.
Table 4 also presents the percentage of the irrigation events not detected due to the presence of rainfall events. Among all the undetected irrigation events, the events that were not detected specifically due to the presence of rainfall are counted. Then, the percentage is calculated as the number of irrigation events not detected only due to rainfall divided by the total number of the undetected irrigation events. An irrigation event is considered as undetected due to rainfall if a rainfall event occurs within the same time interval (between consecutive S1 images) as the irrigation event. Rainfall events can be easily determined based on the increase in the grid scale backscattering coefficients (
1 dB) between two S1 images. In the temperate areas, 30.1% of the undetected irrigation events were found to be undetected due to the presence of the rainfall events. Indeed, when both the irrigation event and the rainfall event occur simultaneously between the same S1 acquisition images (at six days revisit), it would be very difficult to distinguish the effect of irrigation from that of the rainfall, since both events cause the increase in the soil moisture values and their effect on the S1 image is the same. Thus, the rainfall justifies approximately 30.1% of the failure to detect the irrigation events in a temperate area. Therefore, in temperate areas encountering frequent rainfall events, the detection of the irrigation event could be highly constrained by rainfall and is not only related to the efficiency of the IEDM in irrigation detection. In contrast, in the arid to semi-arid study zones, 15% of irrigations were missed because of rainfall events, meaning that there were less rainfall events that could negatively affect the accuracy of irrigation detection.
3.3. Effect of the Vegetation Cover
The effect of the vegetation cover in detecting irrigation events could not be discarded, because the C-band SAR signal is sometimes attenuated by the vegetation cover. As such, we analyzed the effect of crop growth on the accuracy of irrigation detection to understand the constraints of vegetation development on the irrigation detection and analyze this constraint as a function of crop type. Since the two dominant crop types are Maize and Soybean, with robust and rich datasets to draw out conclusions, this analysis concentrates on these two crop types. For this reason, plots with these two crop types were grouped together to obtain two groups: Maize and Soybean. Plots are grouped regardless of the climatic region and the studied year, since the importance here is to discuss only the vegetation development, which is expected to be similar for the same crop across regions.
Table 5 summarizes the accuracy metrics (recall, precision, F-score) obtained for these two crop types. The Maize crops show slightly better detection of irrigation events than the Soybean with a precision of 59.7% for Maize and 54.5% for Soybean. Both crop types have nearly similar precision values (around 74–75%). Similar precisions indicate that the crop type does not induce differences in false detections, which could be more likely attributed to the threshold values of the IEDM and the radiometric accuracy of the S1 data (fluctuation in the S1 signal linked to radiometric accuracy) rather than the studied crop type. Finally, a generally higher F-score value is obtained for the Maize crops (66.7%) than that of the Soybean crops (62.6%).
To examine how the vegetation growth affects the irrigation detection, we chose to examine the correlation between the NDVI, being an indicator for vegetation growth, with the undetected irrigation events. In
Table 5, the percentage of the irrigation events not detected due to developed vegetation cover is presented. We calculated it by dividing the number of undetected irrigation events that have a corresponding NDVI value greater than 0.7 by the total number of irrigation events with NDVI > 0.7. The threshold value greater than 0.7 is considered as a good representative of the well-developed vegetation stage, as reported by several sensitivity analysis studies [
37,
38]. Indeed,
Table 5 shows that for Maize crops, 39.2% of the undetected events were justified by the presence of well-developed vegetation cover (NDVI > 0.7). Higher percentage exists over Soybean crops, where 59.3% of the undetected irrigation events were found to be corresponding to well-developed vegetation cover.
To understand the variations in the irrigation detection accuracy as a function of the vegetation development, we investigated, for each crop type, the correlation between the recall metric and the NDVI. Among the three metrics, the recall was chosen to be studied as a function of NDVI, since it reflects the percentage of the irrigation events correctly detected and thus gives an idea about the relation between the failure to detect the irrigation events and the NDVI. To do so, for each crop type, we grouped the irrigation events occurring between June and September on an interval of 20 days. The period from June to September was chosen because this period is usually the period of irrigation for summer crops in our study sites, especially for Maize and Soybean (as shown in
Table 1), and corresponds to the beginning of the vegetation development (from moderate to well-developed vegetation cover) in all the sites for both crops. In addition, the grouping of classes on a time interval of 20 days provides a sufficient period to insure the variation in the NDVI values and thus changes in the vegetation stages and characteristics. Therefore, for each crop type (Maize and Soybean), the recall metric was recalculated for each 20-day period as the percentage of detected irrigation events to the total number of irrigations in the same period. The average NDVI values of all the irrigation events was also calculated for each period. Between June and September, we obtained five distinct classes of recall values and their corresponding NDVI values for the five twenty-day interval periods.
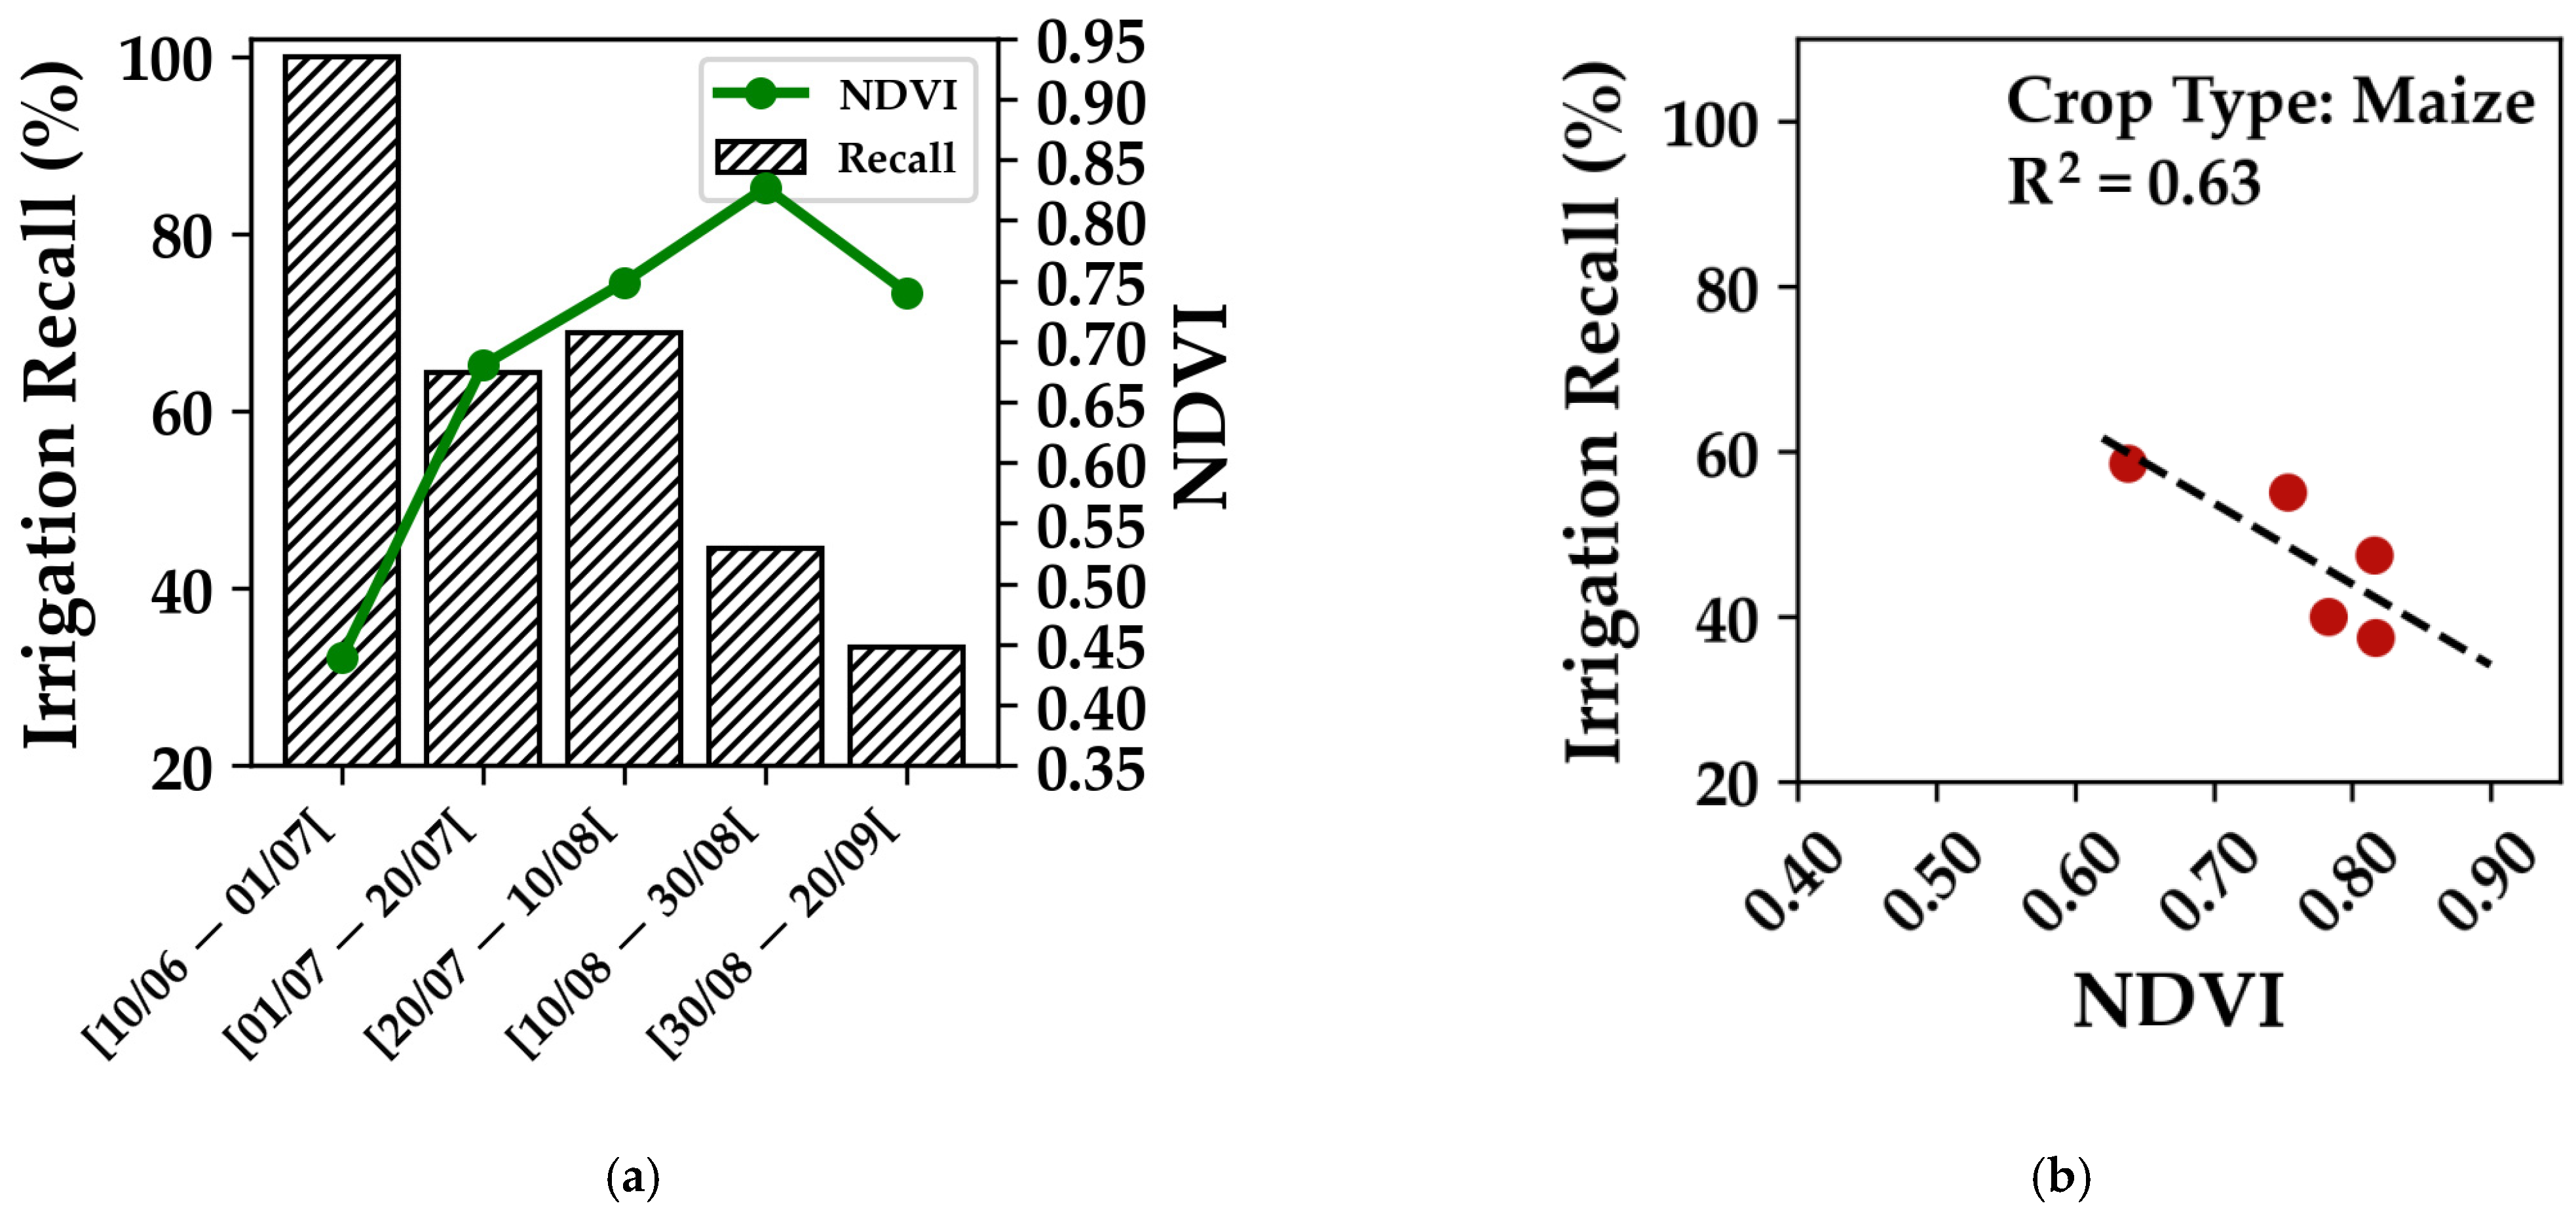
Figure 3 shows the variation in the recall metric for the Maize crop, as a function of the NDVI. In
Figure 3a, the bar plots represent the recall calculated for each period and the green line shows the variation in the NDVI values.
Figure 3a clearly shows that for the Maize crop between June and September, the recall value decreases from about 60% for NDVI values around 0.6 to approximately 40% for NDVI reaching 0.8.
Figure 3b shows (for the same samples and periods) the correlation between the recall and the NDVI with a decreasing pattern of recall as NDVI increases and a correlation coefficient (R
2) between the recall and NDVI reaching 0.63. Similarly, for Soybean crops,
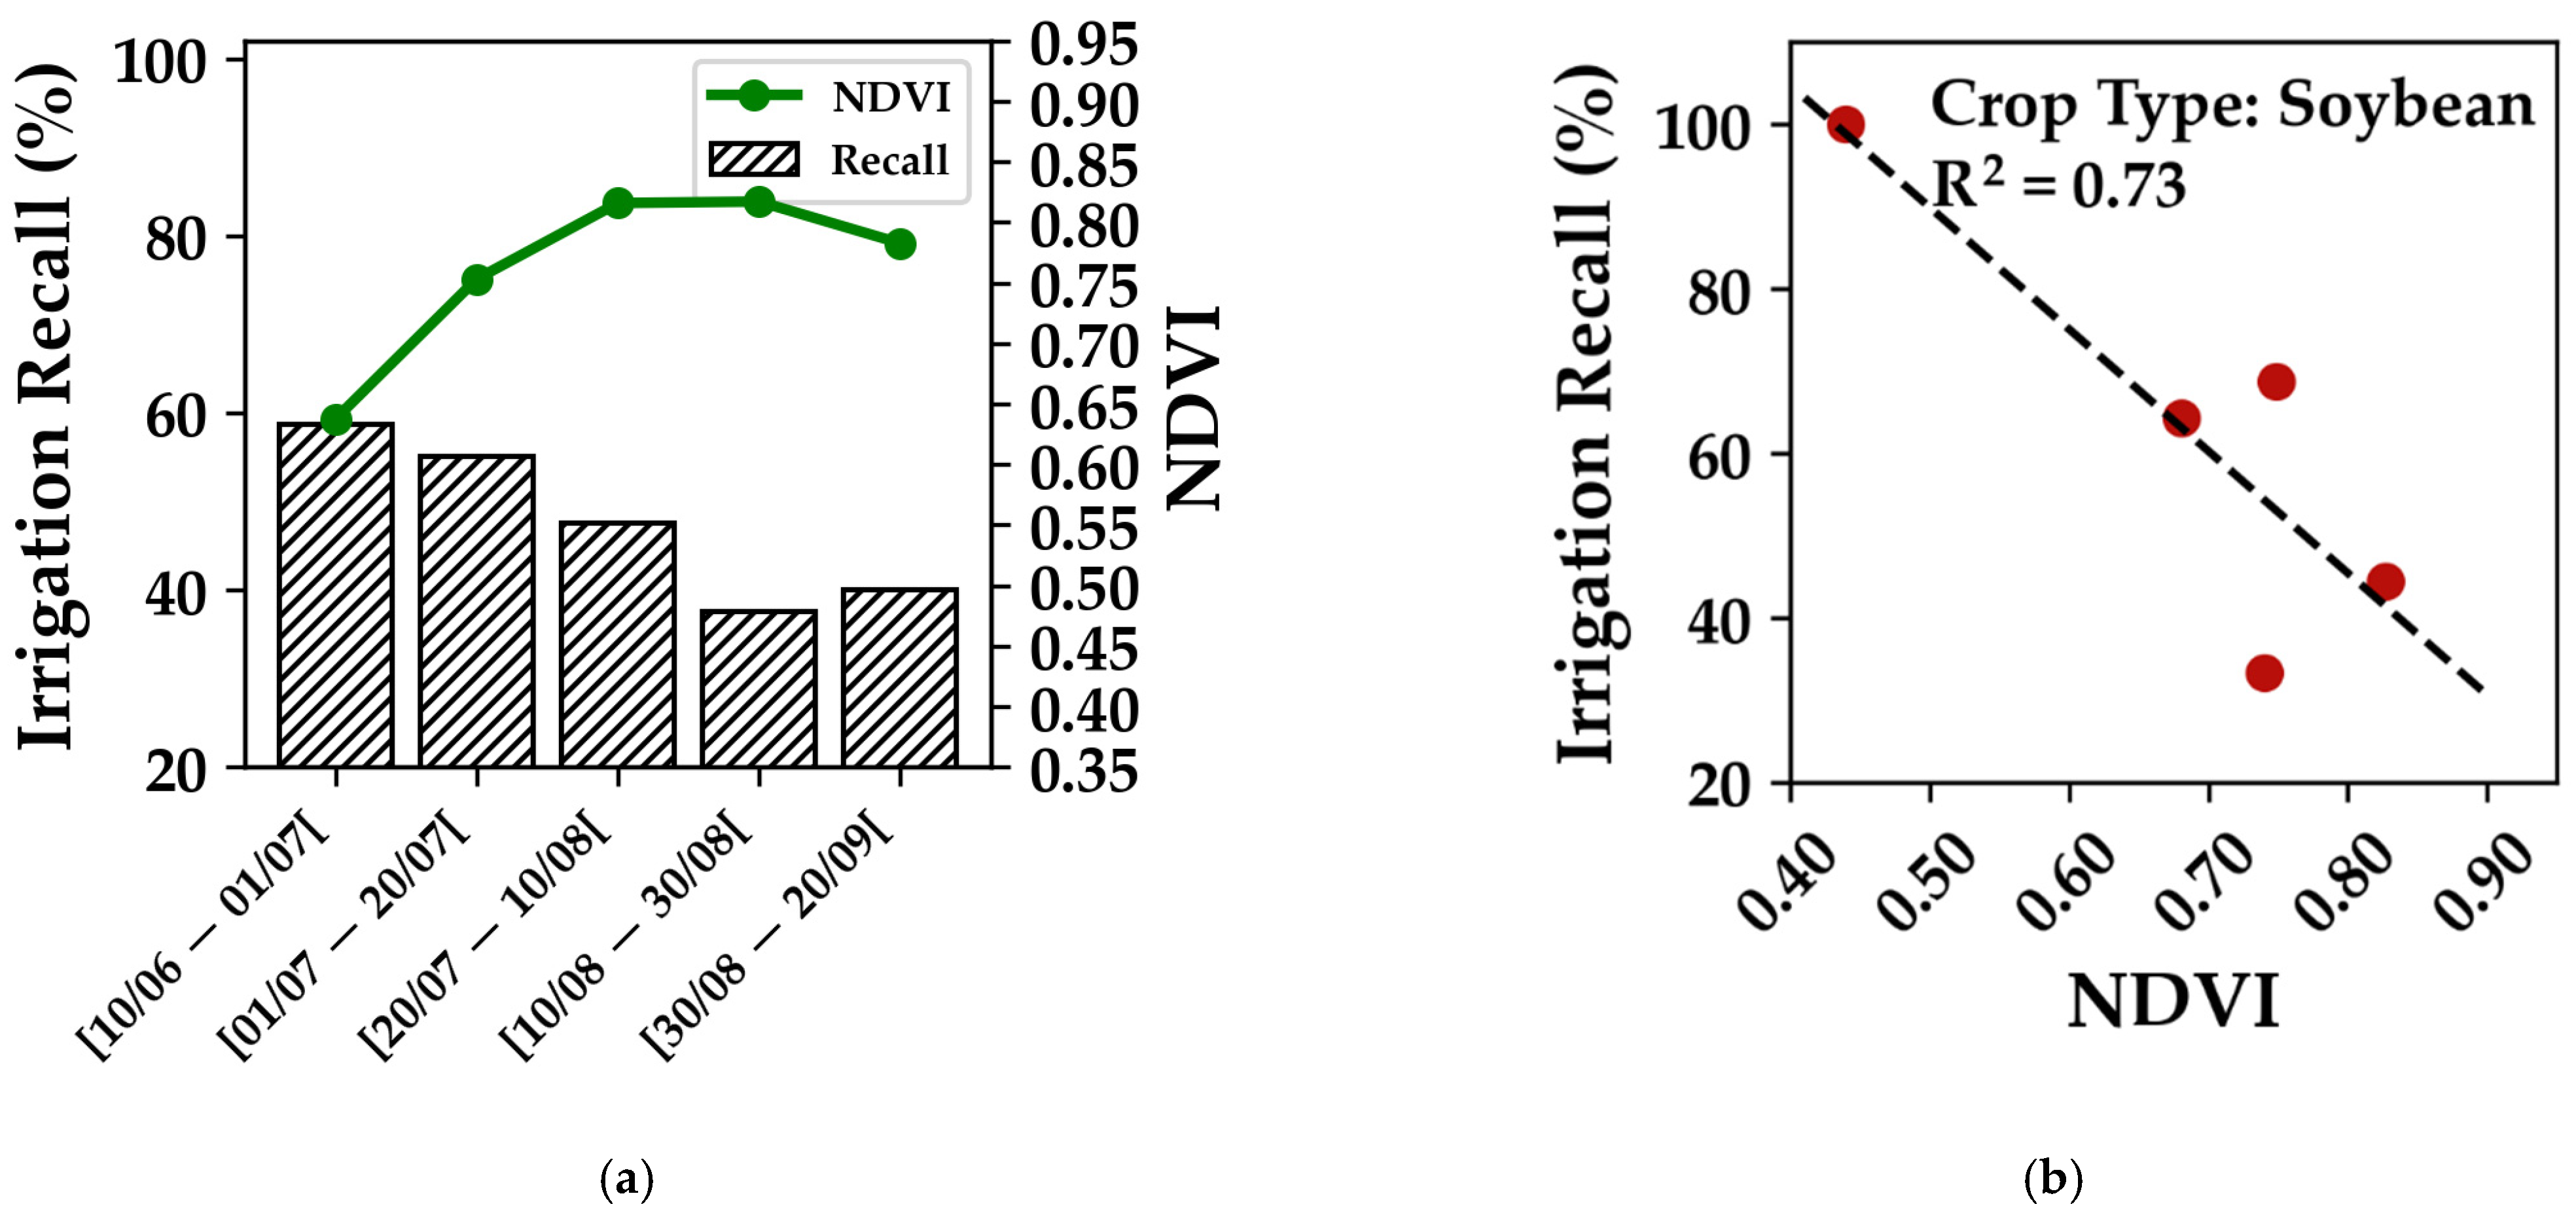
Figure 4a,b show that the recall value decreases from 100% (all events are detected) for NDVI of 0.4 (low vegetation cover) to reach about 30% for NDVI values beyond 0.7. The correlation coefficient R
2 between the recall and the NDVI for Soybean reaches 0.73 with a decreasing pattern of recall as the NDVI increases.
For both crop types, it was clearly visible that the development of the vegetation cover constrains the detection of the irrigation events. This could be directly linked to the penetration capabilities of the C-band SAR signal in the well-developed vegetation cover in addition to the effects of the vegetation volume diffusion of the C-band SAR. As shown by several studies, the penetration of the C-band SAR signal to reach the surface soil is highly dependent on the vegetation characteristics, including but not limited to the vegetation height, density and biomass [
32,
36,
38]. Although the vegetation cover constrains the detection of the irrigation events, it remains sometimes possible to detect some of the irrigation events with a highly developed vegetation cover, as the recall value of both crop types never reaches zero. In fact, for both Maize and Soybean, the vegetation development can constrain the detection of the irrigation events but does not completely prevent it. Indeed, the backscattering SAR signal from well-developed vegetation cover of these two crops remains slightly sensitive to soil moisture but to a lesser degree than that for bare soil or low to moderate vegetation cover [
33,
40]. The slight variation in the SAR backscattering signal in the case of very well-developed vegetation cover are already considered in the IEDM (the low and moderate irrigation possibilities explained in
Section 2.4 with −0.5
1 dB). Even in the presence of well-developed vegetation cover, the IEDM is still capable of detecting slight variations in the soil moisture to a certain extent and attributes them to irrigation events but with a lower confidence level (low to moderate possibilities). In addition, a possible reason to detect irrigation even when the canopy is well developed is that the S1 satellite has passed at the time of irrigation (this is a possibility, but it is not exclusive). In fact, for crops irrigated by sprinkling, if the satellite passes during the irrigation event it is possible to detect an increase in the radar signal due mainly to water droplets on the leaves.
Unlike the case of Gramineae cereal crops (such as Wheat and Barley) that highly attenuate the C-band SAR signal due to their vertical structure (small leaves, longs stalks and seedheads) and completely prevent the C-band SAR signal from penetrating in developed vegetation, as shown by Bazzi et al. [
37], Maize and Soybean crops showed only some limitations in the case of developed vegetation cover where the recall values remained between 30 and 40% for well-developed vegetation. However, the irrigation detection over Soybean crops was more likely to be constrained by the vegetation cover than Maize crops, as the recall value of Soybean had stronger correlation with NDVI (0.73 for Soybean compared to 0.63 for Maize) and a lower value for saturated NDVI (30% for Soybean and 40% for Maize). This slight difference between the Soybean and Maize could be a result of the different developmental characteristics of the Soybean crop as well as the difference in the geometric characteristic of the Soybean plant compared to Maize, which result in more disruption of the C-band SAR signal.
3.4. Effect of the Orbits’ Coverages and Number of S1 Images
The last important factor to be discussed in this study is the orbits’ coverages and the number of available S1 images used to detect the irrigation events. In fact, it was demonstrated previously by Bazzi et al. [
32] that the detection of irrigation events is highly dependent on the revisit time of the S1 satellites. They showed that for bare soil to moderate vegetation cover (NDVI < 0.7), irrigation events could hardly be detected if the time difference between the irrigation event and the next S1 image is more than four days. This time difference decreases to one to two days when the vegetation is developed and the NDVI is greater than 0.7. For this reason, Bazzi et al. [
32] recommended using the maximum number of S1 images available from several S1 orbits to guarantee the highest chances of detecting irrigation events. Indeed, overlapping S1 orbits can provide up to 4 S1 images every 6 days with 20 images per month, taking advantage of four possible S1 orbits. However, this condition is not always available for any location on the Earth’s surface and is also dependent on the surface area of the studied site to ensure being within the overlapping area of the four S1 orbits.
For this reason, it may happen to have a lower number of S1 images covering a study site, which may reach just a couple of images instead of four in a six-day time interval. Usually, two images in six days are guaranteed from the ascending and descending acquisition modes that cover the same imaged area (using both S1A and S1B). Nevertheless, due to some technical problems or maintenance planning, some S1 images from the same orbit acquisition could be missing, thus leading to less than 10 S1 images per month. For example, in the case of Tarn 2018 and 2019, some images were missing from the source of the ESA website, thus leading to some gaps in the six-day temporal series of the same orbit and a lower number of S1 images per month (seven to eight images per month).
We analyzed the effect of the number of available S1 images per month for each climatic zone separately. Regardless of the crop type, we aggregated the irrigation data based on the number of available images per month and classified them into three classes: the first class corresponds to the plots having less than 10 images per month (7 and 8 images in TR region), the second class corresponds to plots with exactly 10 images per month (dataset in ascending and descending modes) and the third class corresponds to plots with 15 and 20 S1 images per month (full dataset of three to four orbits covering the plots). For the two climatic regions, we calculated the average frequency of irrigation per plot per season. This frequency of irrigation is the ratio between the total number of irrigation events applied to the total number of plots divided by 12 weeks (12 weeks corresponds to 3 months between June and September).
Table 6 summarizes the accuracy metric obtained for different classes of available S1 images for both studied climatic regions. For semi-arid areas, we can observe that the number of S1 images did not greatly affect the detection of the irrigation events. Indeed, while we have no more than 10 images per month for OE, we still obtained a high detection accuracy with high recall values (F-score of 86%). In the case of the Potato plot in LB (with 15 images per month) and for the case of the Maize plots in GR (with 20 images), we obtained nearly similar accuracies to that of the OE, with an F-score reaching 81.2%. These similar accuracies across the semi-arid regions, regardless of the number of images, were expected, since the detection of the change in the soil’s water status in dry regions remains possible with irrigations being frequent and rainfall events being rare during the summer. Over all the plots, the frequency of irrigation reached 1 irrigation per week (average of 14 irrigations per plot each season). The high irrigation frequency (up to one irrigation per week) with moderate frequency of S1 images (two images in six days) makes it possible to detect the maximum number of irrigation events even with a lower number of S1 images.
The situation is different in the temperate areas. The results (
Table 6) show that the recall (percentage of detected irrigation events) decreases with the decrease in the number of available S1 images and so do the F-score values. For example, plots with less than 10 images per month had an average recall value of 46.8% and an F-score of 55.9%. Plots with 10 images per month had a slightly better average recall value of 49.1% and a slightly higher F-score of 57.4%. Finally, the plots having the maximum number of S1 images per month (20 images) had the highest recall value reaching 66.6% and an F-score of 70%. Thus, in temperate areas, the detection of the irrigation events is highly dependent on the available number of S1 images. This dependency could be explained by the fact that a low number of images accompanied by the low frequency of irrigation in such regions (one irrigation per two weeks) can lead to a higher percentage of the irrigation events being missed if these events do not occur close in time to each available S1 image. In addition, the frequent rainfall with a low number of S1 images can lead to more overlapping between the rainfall and irrigation between the consecutive S1 images, thus limiting the capability of detecting the irrigation event. Therefore, in such temperate climatic conditions, the likelihood of detecting irrigation events increases when the number of available S1 images is higher.
4. Discussion
In this study, the detection of the irrigation events at the plot scale was assessed using the Sentinel-1 data and a decision tree algorithm (IEDM). Results demonstrated that the IEDM with Sentinel-1 data could provide a good overall performance for irrigation detection. Regardless of some of the presented limitations of the IEDM performance across climatic regions and studied crops, the IEDM combined with Sentinel-1 could still be efficient to detect irrigation events. However, other limitation factors could also be discussed to assess better the performance of the IEDM with S1.
The IEDM was applied to all agricultural plots regardless of the soil type of each plot. The effect of the irrigation on the soil wetness degree could be also correlated to the soil type of the agricultural plot. Indeed, soil texture and its field capacity, which is the amount of water content held in the soil after excess water caused by rainfall or irrigation, can have a significant impact on the detection of the irrigation events. This is mainly related to the soil depletion, dry out and evaporation rates that vary between soil types and climatic conditions. Usually, soils that have more capacity to retain water in their top layers are more likely to have better detection of the irrigation events, especially in arid and semi-arid areas where the dry out of the soil is rapid due to high evaporation intensity. In this case, even if the surface soil water is very low, the overall soil water in the lower soil depth is not necessarily low. The condition of the rapid dry out of the surface soil (depending on soil texture and climate) and the different soil water content between top layers and deep layers generate the discussion of two principal points for irrigation detection using S1 and the IEDM: (1) the temporal resolution of the used sensor and (2) the penetration of the used SAR signal.
First, the rapid dry out of the soil means that the used sensor should have higher temporal resolution that may be useful to detect rapid change in the soil moisture content (increase due to irrigation and decrease after due to dry out). As discussed in the manuscript and validated in previous studies [
32,
34,
35], the maximum time delay between the irrigation event and the next S1 image to detect the irrigation event must not exceed 4 days. The effect of the satellite temporal resolution on the irrigation detection was assessed by several studies [
36,
37]. Le Page et al. [
34], Ouaadi et al. [
35] and Bazzi et al. [
37] showed that beyond three to four days after the irrigation, it becomes difficult to detect the effect of an irrigation event on the S1 backscattering signal, and thus the irrigation could hardly be detected. This fact was also proved by El Hajj et al. [
36] using the X-band SAR data, where they showed that it was difficult to detect an irrigation event occurring three to four days before the SAR acquisition. This leads to the fact that for efficient detection of all irrigation events, the temporal resolution of the SAR sensor must be at most less than 4 days. Finally, the revisit time of the SAR constellation is one the most important challenges to detect the irrigation events.
The second main point regarding the dry out of the surface soil and the difference between surface and deep-water content is the penetration of the used SAR band to detect the wetness degree of the soil. In the case of S1 with a C-band signal at a wavelength of about 5 cm, only the wetness degree of the first 5 cm of the soil could be measured. In fact, even with such limited penetration, the S1 sensor, as shown in this paper, could still detect irrigation events with good accuracy. Nevertheless, it is well known that using SAR signals with higher wavelengths could be more adequate to measure soil water content for soil layers deeper than 5 cm. For example, the L-band SAR signal having a wavelength reaching about 24 cm has higher penetration capabilities than the C-band and can reflect better the soil water status and its variation after the irrigation events. A recent study comparing between the C- and L-bands for irrigation detection demonstrated that the L-band performs better than the C-band in irrigation detection and shows higher variability to the variation in the soil water content than the C-band [
37]. In Bazzi et al. [
37], they showed that between wet and dry soil, the L-band can vary from −11 dB for wet soil due to irrigation to less than −18 dB when the soil is completely dry (difference of about 7 dB). For the C-band, the variation was less than that of the L-band, where the backscattering SAR signal could vary from −10 dB to −14 dB (difference of 4 dB) between wet and dry soil. Their study also demonstrated that the correlation between the SAR backscattering signal and the wetness degree of the soil was higher for the L-band than C-band. They concluded then that even though the C-band could still be used to detect irrigation events and wetness degrees, the L-band shows superior capabilities compared to the C-band. Unfortunately, until now the L-band remains for non-commercial use and operational L-band SAR sensors in free and open access modes are not available, which makes the use of the L-band sensor for irrigation detection in operational modes inadequate. However, future planned L-band sensors can open the way toward better detection of irrigation events by integrating the L-band SAR data in the IEDM instead of the C-band SAR data. This integration may also necessitate the re-calibration of the IEDM threshold values of the decision tree to be more adequate with the L-band SAR signal.
Another point to discuss regarding the IEDM and the S1 is the irrigation system used at the plot scale. In this study, almost all the plots were irrigated by the common sprinkler irrigation technique. Previously, Bazzi et al. [
32] reported a similar capability of the S1 data to detect irrigation using the gravity irrigation technique. Drip irrigation, which is becoming more common now to reduce the water consumption and increase the water use efficiency, is not yet analyzed. In this study, only a few irrigation events in the Greece Maize crops were performed using drip irrigation. No specific observation was remarked for these irrigation events that were also detected in the study. However, the absence of a robust database of drip irrigation prevents us from drawing out robust conclusions regarding the capability to detect these irrigation events using the S1 and the IEDM. A study performed by Soulis et al. [
41] assessed the effect of the positioning of the soil moisture sensors placed in soil on the soil moisture values in the drip irrigation context. They showed that the irrigation efficiency was significantly affected by the placement of the soil water content sensor (depth of sensor). Specifically, the sensor placement on the irrigation efficiency had an efficiency as high as 16%. Back to the SAR data, this means that the penetration of the SAR signal (at 5 or 24 cm) can play an important role in the detection of the irrigation events in drip irrigation cases, as the drip irrigation is more targeted to the plants.
The last point to discuss in this paper is the operational use of the IEDM to serve as a generic tool for irrigation detection. In fact, the IEDM was first proposed as a near-real-time model to detect irrigation events and thus can serve as an irrigation detection tool during the growing season. The data used to detect irrigation events in the S1 image of date (t) do not rely on the future captured S1 image of date t + i but on the previous S1 images captured before the time t (mainly on t-1). The efficiency and rapidity of the IEDM to detect an irrigation event is thus dependent on the delivery time of S1 images, which are usually delivered in a “fast 24 h” delivery mode. Therefore, the implementation of the IEDM in an operational pipeline tool can guarantee the detection of the irrigation event in real time after the availability of the S1 image. Moreover, the IEDM requires the agricultural plots’ boundaries to calculate the SAR backscattering signals at plot scales. These data, which are sometimes available for some countries, could also be generated using a simple image segmentation technique of an NDVI time series to obtain an accepted map of the agricultural plots’ boundaries if they are not available at the national scale. Current tools such as the LPIS (land-parcel identification system) could help obtain the agricultural plots’ boundaries used to calculate the SAR signal at both plot and grid scales (10 km × 10 km) required by the IEDM.
5. Conclusions
This study presented a detailed assessment of detecting irrigation events at the plot scale using the S1 time series data and a change detection algorithm (IEDM). The IEDM was applied using S1 time series over five semi-arid and temperate study sites in Europe and the Middle East and across several major summer crops.
The main findings showed that the accuracy of the irrigation detection reaches 85% for semi-arid areas, higher than that for temperate areas reaching 53%. Developed vegetation cover was found to be an important constraint in the detection of irrigation events, where the irrigation detection accuracy decreased from about 60% for moderate vegetation cover (NDVI < 0.60) to less than 40% when the NDVI reached values beyond 0.7. The main results also demonstrated the dependency of the irrigation detection accuracy on the availability of the S1 images (number of used S1 images in the S1 time series), especially over temperate areas. The effect of the availability of S1 images was of great importance to analyze, especially with the loss of the S1B satellite from the S1 constellation which will reduce the S1 revisit time. Future assessment of the IEDM may include the analysis of irrigation detection accuracy with respect to soil types and irrigation techniques.
Despite some limitations regarding the climatic context and the vegetation development, the IEDM proved to be a powerful tool for irrigation detection at the plot scale. The IEDM, which could be implemented in a near-real-time operational application, may automatize the detection of irrigation events at the plot scale and help authorities better understand the water consumption rates in irrigated agriculture, especially for regions encountering illegal water abstractions and water scarcity.

 ,
, 


