Article

Changes in Relationships between Humic Substances and Soil Structure following Different Mineral Fertilization of Vitis vinifera L. in Slovakia

by
Vladimír Šimanský
1,*,
Elżbieta Wójcik-Gront
2,
Jarmila Horváthová
3,
Dorota Pikuła
4,
Tomáš Lošák
5,
Agnieszka Parzych
6,
Martin Lukac
7,8 and
Elena Aydın
9,*
1
Department of Soil Science, Institute of Agronomic Sciences, Faculty of Agrobiology and Food Resources, Slovak University of Agriculture, 949 76 Nitra, Slovakia
2
Department of Biometry, Institute of Agriculture, Warsaw University of Life Sciences—SGGW, Nowoursynowska 159, 02-776 Warsaw, Poland
3
Centre of Languages, Slovak University of Agriculture, Tr. A. Hlinku 2, 949 76 Nitra, Slovakia
4
Department of Plant Nutrition and Fertilization, Institute of Soil Science and Plant Cultivation-State Research Institute, Czartoryskich 8, 24-100 Puławy, Poland
5
Department of Environmentalistics and Natural Resources, Faculty of Regional Development and International Studies, Mendel University in Brno, Zemědělská 1, 61300 Brno, Czech Republic
6
Department of Environmental Chemistry, Institute of Biology and Earth Sciences, Pomeranian University in Slupsk, 76-200 Slupsk, Poland
7
School of Agriculture, Policy and Development, University of Reading, Reading RG1 1AF, UK
8
Department of Forest Management, Faculty of Forestry and Wood Sciences, Czech University of Life Sciences, 16521 Prague, Czech Republic
9
Department of Biometeorology and Hydrology, Institute of Landscape Engineering, Faculty of Horticulture and Landscape Engineering, Slovak University of Agriculture, 949 76 Nitra, Slovakia
*
Authors to whom correspondence should be addressed.
Agronomy 2022, 12(6), 1460; https://doi.org/10.3390/agronomy12061460
Submission received: 2 June 2022 / Revised: 16 June 2022 / Accepted: 16 June 2022 / Published: 17 June 2022

Abstract

:
The quantity and quality of soil organic matter (SOM) depending on many edaphic and environmental factors may change in response to agriculture-related practices. The SOM humification process can be supported by the application of mineral fertilizers, but in the production vineyards, such information is lacking. NPK fertilizer alters the soil quality, and therefore, the aim of this study was to: (1) assess the extent and dynamics of different NPK (control—no fertilization; 1st NPK; and 3rd NPK levels) rates to the soil with grass sward cover in a productive vineyard on changes in SOM, humic substances (HS), and soil structure, and (2) identify relationships between SOM, HS, and soil structure. Results showed that the share of humic acids in soil organic carbon decreased only in NPK1 compared to control and NPK3 treatments. The color quotient of humic substance values in NPK1 and NPK3 increased by 4 and 5%, respectively, compared to control. Over a period of 14 years, the content of soil organic carbon increased by 0.71, 0.69, and 0.53 g kg−1 year−1 in the control, NPK1, and NPK3, respectively. The content of HS increased linearly with slight differences due to NPK application. The vulnerability of the soil structure decreased due to fertilization—more at the higher NPK level. The rate of formed soil crust was decreasing in the following order: control > NPK1 > NPK3. In the control treatment, the relations between SOM, HS, and soil structure were most abundant and with the greatest significance, while with the increasing level of NPK, these relations lost their significance.

1. Introduction

Viticulture has undergone significant changes over the last 100 years due to globalization, which Slovakia has not bypassed. After 1989, the area of productive vineyards significantly decreased from the original 35,000 ha (before 1989) to the currently registered 22,000 ha. Of the total number of vineyards registered, approximately 16,000 ha were cultivated, but only 12,000 ha were productive at the beginning of the 2000s [1]. The downward trend has been evident since 2015 and it continues from year to year [2]. According to the database of the Statistical Office of the Slovak Republic, currently, there are 6000 ha of productive vineyards registered in Slovakia.
Compared to other agricultural crops, the vineyard has generally low demands for its cultivation. It often grows in the sites where soil conditions do not allow another profitable form of intensive agriculture. The cultivation of vineyards occurs on exposed slopes with shallow and skeletal sandy soil [3,4,5]. Nevertheless, for optimal growth, vine requires the sites with slightly acidic to neutral soil pH (5.5–7.5) with sufficient organic matter, which initiates good soil aggregation, resulting in a water-resistant soil structure [5].
Soil structure is the fundamental soil physical property. Soil structure combines texture, packing, and the resulting void shapes under the aspect of the particle diameter and shapes and the pores produced by these solid bodies [6]. On the other hand, aggregate formation as a core unit of soil structure [7], due to the organized juxtaposition of particles, leads to the formation of larger discrete units based on natural (largely uninfluenced by humans) physical, chemical, and biological processes such as swelling and shrinkage, energetic interactions between soil colloids, flocculation and peptization depending on the valence, and concentration of the ions, but also after the intestinal passage in worms [6]. One of the most important factors responsible for the aggregate stability is soil organic matter (SOM) [8,9]. Its individual components differently affect the formation and stabilization of soil aggregates. More labile forms are responsible for the temporary stability of soil aggregates [10,11], which is mainly related to their more sensitive reaction to environmental changes [12]. Temporary stabilization of soil aggregates through labile fractions of SOM is not a good solution for carbon sequestration over a long period of time. More stable components such as humic substances and especially humic acids are usually responsible for the long-term stability of soil aggregates [13]. The changes in land use or soil management practices can alter the chemical properties, including humic substances [14,15]. It was noted that the more stable fractions of SOM are responsible for the stable structure in the vineyards of the Slovak Republic as a result of the different soil management [3,14]. Consequently, the aim of winegrowers should be supporting the aggregation process and in particular, the stabilization of soil aggregates through the humification of SOM and the use of measures aimed at stabilizing humic substances in the soil environment. Such measures include all those that form the optimal conditions for SOM conversion into humic substances. Váchalová et al. [16] stated that the humification of organic matter takes place at optimal pH with a sufficient supply of nutrients in the soil being a significant factor, especially sufficient content of P, Mg, and N. For this reason, rational fertilization with mineral fertilizers can be a useful agronomic tool to improve the soil environment. Mineral fertilizers support the mineralization of SOM; however, they significantly contribute to the formation of biomass, including the root mass. Higher proportion of roots means greater production of root exudates, which are an important factor in triggering humification [16] with the subsequent formation and stabilization of soil aggregates [17,18]. The above-mentioned processes are affected by the dose of mineral fertilizers. High doses of mineral fertilizers can promote greater mineralization, while rational doses support the creation of optimal soil conditions. Such a course is identified on arable land [19,20]. However, studies with NPK fertilizers applied to the soil with grass sward cover in productive vineyards are still lacking.
Therefore, the aims of this study were to: (1) assess the dynamics and extent of application of the different rates of NPK to the soil with grass sward cover in a productive vineyard on changes in SOM, humic substances, and soil structure stability, and (2) identify relationships between SOM, humic substances, and soil structure stability depending on the rate of NPK applied to the soil with grass sward cover in the vineyard. We proceeded from the assumption that at higher rates of NPK application to the vineyard soil with grass sward cover, the production of root biomass would be higher, but the humification would be lower as a result of lower microbial activity. We also assumed that rational fertilization (lower rate of NPK application) would support the production of humic substances and improve the overall aggregate stability in the vineyard.

2. Materials and Methods

2.1. Study Site

The experimental vineyard is situated in the Dražovce suburb of Nitra (48°21′6.16″ N; 18°3′37.33″ E) in the western part of Slovakia. Dražovce is located between the western slopes of the Tribeč Mountain range that belongs to the Carpathian Mountains and the Nitra River valley, constituting a part of the Great Danubian Lowland. The Tribeč Mountain range is built of granitoid rocks and a packet of Mesozoic (Triasic) dolomites. The slopes of the Tribeč Mountain range and higher parts of the Nitra River valley are covered with colluvial deposits built of weathered Carpathian rocks and also with a widespread mantle of Quaternary silty loamy aeolian loess sediments accumulated in periglacial conditions of the last glaciation [21]. The major soil types in the proximity of the study area comprise Eutric Dolomitic Leptosol, Luvic Chernic Phaeozem, Nudiargic Luvisol, Eutric Cambisol, Haplic Calcisol, Vermic Chernozem, and Ekranic Technosol [22]. The study area has a warm temperate climate, fully humid with warm summers (Cfb) according to the classification by Köppen-Geiger [23]. The mean annual air temperature is 10.8 °C while the mean annual sum of precipitation is 559 mm (based on the thirty-year climatic normal from 1991 to 2020).

2.2. Experimental Setup in the Vineyard

The experimental vineyard is set in the southwestern foothills of the Zobor hill (the highest peak of the Zobor part of the Tribeč Mountain range). In the 11th century, the southern and southwestern slopes of the Zobor hills were deforested and vineyards were planted. Today, the locality is used as a horticulture area and also for growing plants to produce wines [24]. The site was abandoned before the establishment of the experimental vineyard. In 2000, the site was ploughed, and vines (Vitis vinifera L. cv. Chardonnay) were planted in rows at 2 × 1.2 m spacing. The soil has been classified as sandy Rendzic Leptosol with strong anthropogenic influence [25]. Soil texture is described as 569 g sand kg−1, 330 g silt kg−1, and 101 g clay kg−1, and rock fragments represent about 8% of topsoil bulk (0–30 cm). Prior to vine planting, the soil (topsoil) contained on average 17.0 ± 1.6 g kg−1 of soil organic carbon, 1067 ± 103 mg kg−1 of total N, 99 ± 8 mg kg−1 of available P, 262 ± 15 mg kg−1 of available K, the base saturation percentage was 99.3 ± 0.01%, and soil pH in H2O was 7.18 ± 0.08. A mix of grasses (Lolium perenne L. 50% + Poa pratensis L. 20% + Festuca rubra subsp. commutata Gaudin 25% + Trifolium repens L. 5%) was sown in 2003, which was used in the inter-rows of the vines. In 2006, a long-term experiment with application of the different levels of NPK fertilization was conducted in a randomized complete block design with three replications. In this study, the treatments consisted of three levels of NPK fertilization (Table 1).

2.3. Soil Samples and Analytical Methods

During 2008–2020, soil samples were repeatedly taken from the soil depth of 0–30 cm in spring and sampling included all treatments of fertilization. Each subplot (21 m2) with three replicates at the different NPK fertilization levels included three sampling points at a distance of about 5–6 m. Soil samples for determining the parameters of the soil structure were taken with a spade to preserve the natural lines of soil aggregates. Soil samples for the determination of SOM and humic substances were taken from the same areas. A set of 3 samples from each replicate was mixed into the average soil sample. A total of 27 average soil samples were taken every year. The disturbed soil samples for determination of SOM and humic substances were dried at the laboratory temperature and grounded. Soil organic carbon (SOC) content was determined by the wet combustion method [27], and the labile carbon content (CL) was measured by the Loginow method [28]. The fractional composition of humus was analyzed by using the Tyurin method as modified by Ponomareva and Plotnikova [27]. The optical characteristics of humus quality were assessed as absorbance of humic substances and humic acids (0.1 m L−1 NaOH) measured at wavelengths of 465 and 650 nm using the Jenway Model 6400 spectrophotometer. Since humic substances (HS) and humic acids (HA) contain a great number of chromophores and do not create separate peaks in UV–VIS range, the chemical structure of HS and HA determined by the analysis of so-called color quotients of humic substances (Q4/6HS) and humic acids (Q4/6HA) is very useful. The color quotients were calculated as the ratios of absorbance at 465 nm wavelength (the content of materials at the beginning stage of transformation) and at 650 nm wavelength (strongly humified organic materials), which decreases with the increasing molecular weight and condensation [29]. The soil samples for the determination of the soil structure stability were also dried at the laboratory temperature. For the determination of individual fractions of water-stable aggregates, wet sieving Baksheev method [30] was used. Briefly, the soil sample was overflowed with distilled water. Two hours later, the sample was transferred to the top sieve (>5 mm) in a cylindrical container (Baksheev device), which was filled with distilled water. The cylinder was hermetically closed and the sample was sieved for 12 min. The evaluated size fractions of water-stable aggregates (WSAs) were as follows: >5, 3–0.5, 0.5–0.25 (macro-aggregates), and <0.25 mm (micro-aggregates). The material retained was quantified in each sieve except for the micro-aggregates. Their content was calculated as the difference between the total weight of the soil sample and sums of macro-aggregates. The particle size distribution was determined after the dissolution of CaCO3 with 2 m L−1 HCl and decomposition of the organic matter with 6% H2O2. After repeated washing, the samples were dispersed by using the solution of 0.06 m L−1 (NaPO3)6 and 0.075 m L−1 Na2CO3. The percentual representation of five size fractions was determined: coarse sand (2–0.25 mm), medium and fine sand (0.25–0.05 mm), coarse silt (0.05–0.01 mm), medium and fine silt (0.01–0.001 mm), and clay (<0.001 mm). Further, the soil structure parameters were calculated based on the obtained analytical data. The mean weight diameters of aggregates for dry (MWDd) and wet (MWDw) sieving as well as the vulnerability coefficient (Kv) by Valla et al. [31] were calculated according to following equations (Equations (1)−(3)):
MWD d = i = 1 n x i w i
where MWDd is the mean weight diameter of aggregates for dry sieving (mm), xi is the mean diameter of each size fraction (mm), wi is the portion of the total sample weight occurring in the corresponding size fraction, and n is the number of size fractions.
MWD W = i = 1 n x i WSA
where MWDw is the mean weight diameter of WSA (mm), xi is the mean diameter of each size fraction (mm), WSA is the portion of the total sample weight occurring in the corresponding size fraction, and n is the number of size fractions.
K v = MWD d MWD w
where MWDd is the mean weight diameter of aggregates for dry sieving (mm) and MWDw is the mean weight diameter of WSA (mm).
The structure coefficient (K) was calculated according to Equation (4):
K = A B
where A is the weight of air-dried aggregates in size fractions from 0.25 to 7 mm and B is the sum of weight of air-dried aggregates in size fractions more than 7 mm and less than 0.25 mm.
The index of the aggregate stability (Sw) was calculated according to the following Equation (5):
Sw = WSA 0.09   sand silt + clay
where Sw denotes aggregate stability, and WSA is the content of water-stable aggregates (%).
The index of crusting (Ic) was calculated according to Equation (6):
Ic = 1.5   S f + 0.75   S c Cl + ( 10   SOM )
where Sf is % fine silt, Sc is % coarse silt, Cl is % clay, and SOM is % soil organic matter content.
Critical soil organic matter content (St) was calculated by using Equation (7):
S t = SOM ( Clay + Silt )

2.4. Statistical Analysis

The statistical analysis was performed with StatisticaTM v. 13.1 (Dell Inc., Round Rock, TX, USA). The means of soil characteristics were compared between the years and NPK level by two-way analysis of variance (ANOVA). The homogeneous groups were distinguished by the Tukey test for α = 0.05. The biplot display of principal component analysis (PCA) was used to determine the relationship between the soil data for 2008, 2014, and 2021 for three levels of fertilization. PCA permits creating components that reflect the combined effect of multiple variables that are acting in a similar way. Simple linear regression was applied to establish the relationships between soil characteristics and observation time (year). Additionally, multiple linear regression analysis was used for humic substance variables depending on year, NPK level, and soil structure variables. The relationships between selected parameters were investigated by using the Pearson’s correlation test for α = 0.05.

3. Results

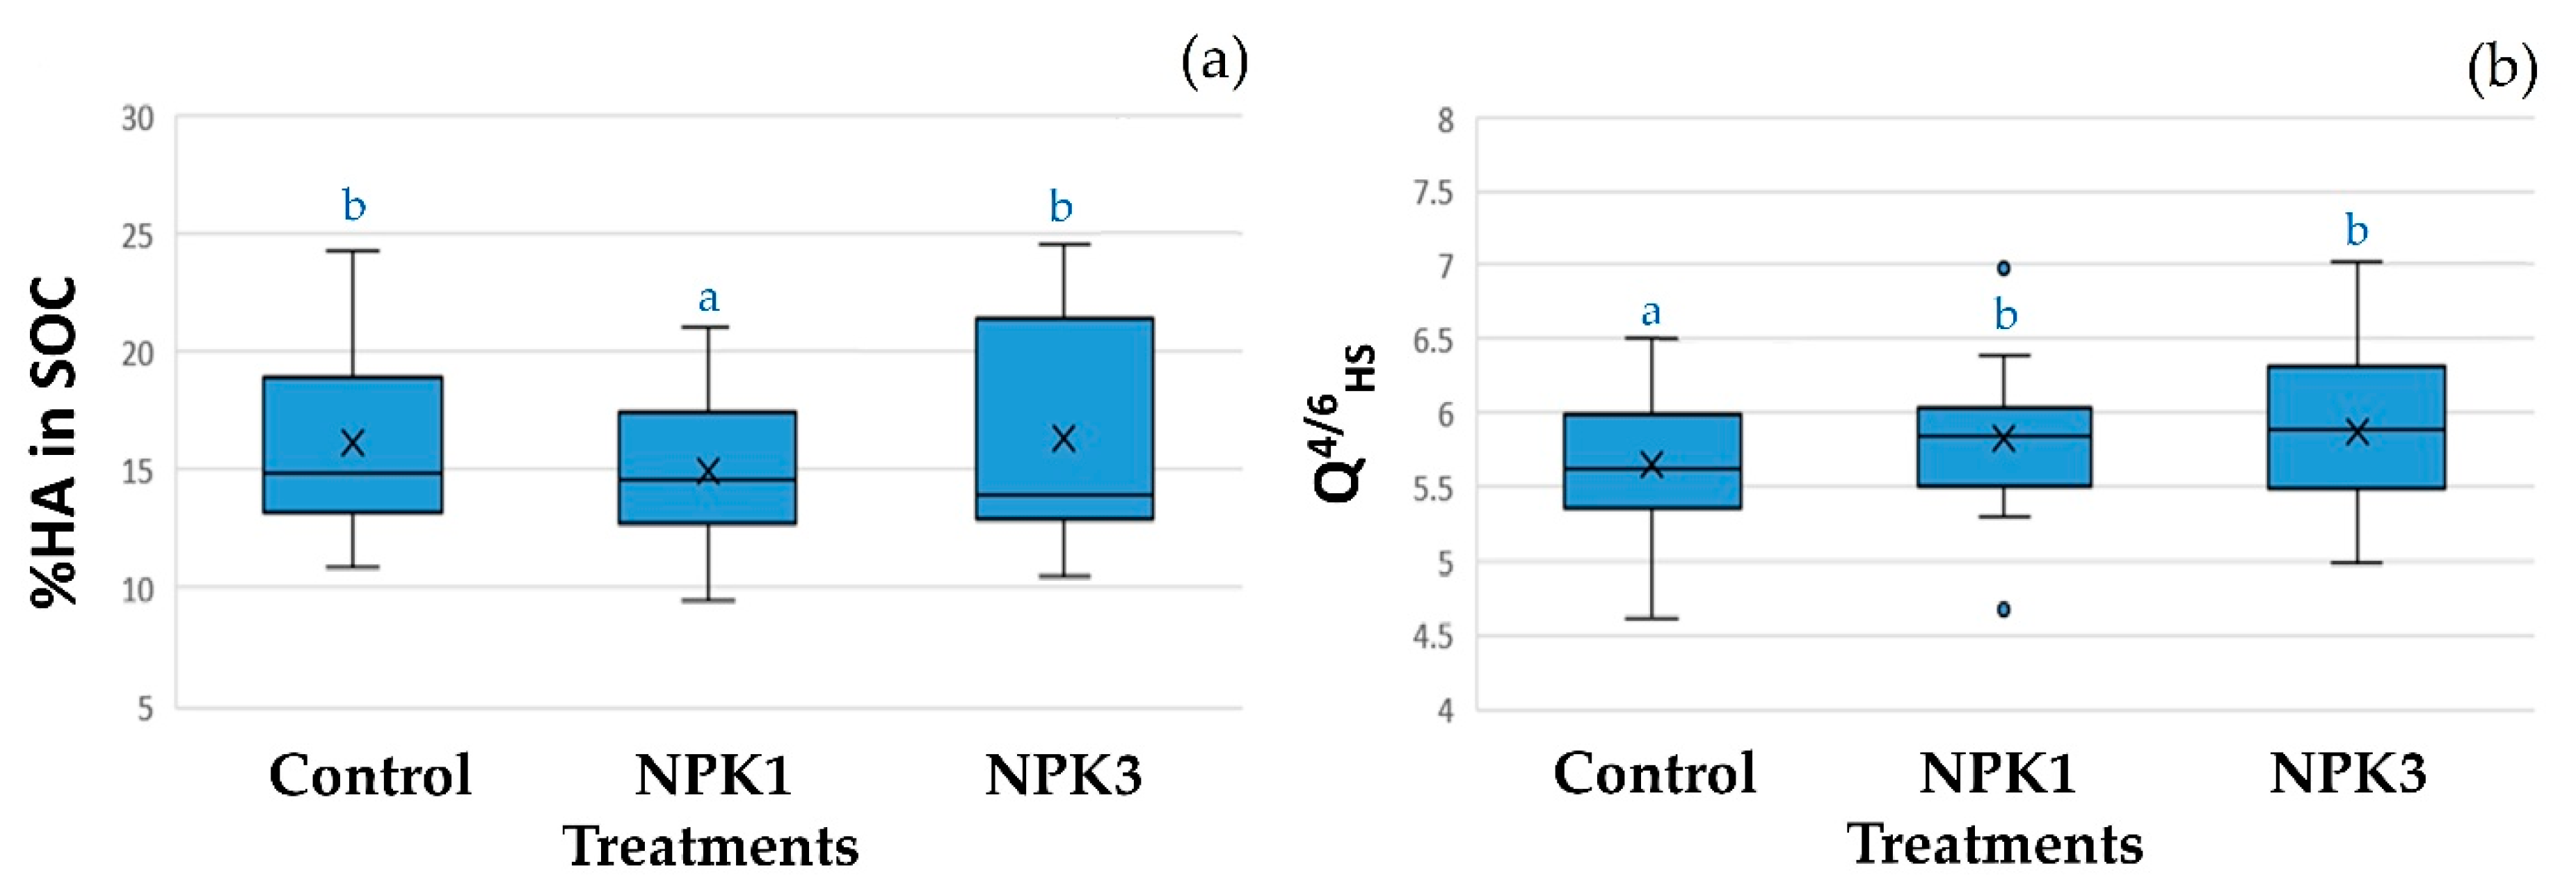
3.1. Soil Organic Matter, Humic Substances, and Soil Structure

The two-factor ANOVA showed the year as a significant factor for all SOM, humic substances, and soil structure parameters. Only in the case of the share of humic acid in soil organic carbon (%HA in SOC) and Q4/6HS, the level of fertilization was significant. Specifically, for %HA in SOC, statistically significant differences were identified between control and NPK1 (in NPK1, decrease in %HA in SOC was 8% compared to control) and between both levels of NPK fertilization (in NPK3, increase in %HA in SOC was 10% compared to NPK1). The stability of humic substances induced by Q4/6HS was significantly reduced due to the mineral fertilization. The Q4/6HS values in NPK1 and NPK3 increased by 4 and 5%, respectively, compared to control treatment (Figure 1). Other parameters of SOM and humic substances but also soil structure were not affected by the mineral fertilization (Table 2).
PCA was used to reduce dimensionality and increase interpretation while minimizing the data information loss. New uncorrelated variables (PC1 and PC2) were created that successively maximize variance. The two-dimensional variability (PC1 and PC2) represents the variability of the variables included in the analysis. PCA was based on the correlation between the variables. The results of specific PCA carried out for a combination of 3 years (2008, 2014, and 2021) and three levels of fertilization (control, NPK1, and NPK3) for all measured variables (SOM, humic substances, and soil structure parameters), are summarized in Figure 2. The aim of the analysis was to find out the relationship between variables and multivariate differences between treatments. Only the first two principal components (PC1, PC2) were considered as they contain the most information of the original data (68% + 20% = 89%). The differences between the treatments with respect to the horizontal axis (PC1) are of the greatest importance. This means that the biggest differences were caused by the different years of measurements, not the method of fertilization, which was also confirmed by ANOVA (Table 2). The data for the same years were grouped, separately into 2008, 2014, and 2021. SOM parameters such as the share of humic substances in SOC (%HS in SOC), share of humic acids in SOC (%HA in SOC), share of fulvic acids in SOC (%FA in SOC), and HS including humic acids (HA) and fulvic acids (FA) were strongly positively correlated, and all treatments for 2021 (especially 2021 × control and also 2021 × NPK1 and 2021 × NPK3) had a high value of these SOM and humic substance parameters. The variables %HS in SOC, %HA in SOC, %FA in SOC, and HS, HA, and FA strongly negatively correlated with variable index of crusting (Ic). The treatments for 2008 (2008 × control, 2008 × NPK1, and especially 2008 × NPK3) had high values of vulnerability of the soil structure, contents of water-stable micro-aggregates, stability of humic substances and Ic, and low values of %HS in SOC, %HA in SOC, %FA in SOC, and HS, HA, and FA at the same time. The treatments 2014 × control, 2014 × NPK1, and 2014 × NPK3 had high values of variables such as contents of water-stable macro-aggregates in the range of 3–0.5 mm and humic acids to fulvic acids ratio (HA:FA ratio) and moderate values of almost all the other variables (Figure 2).

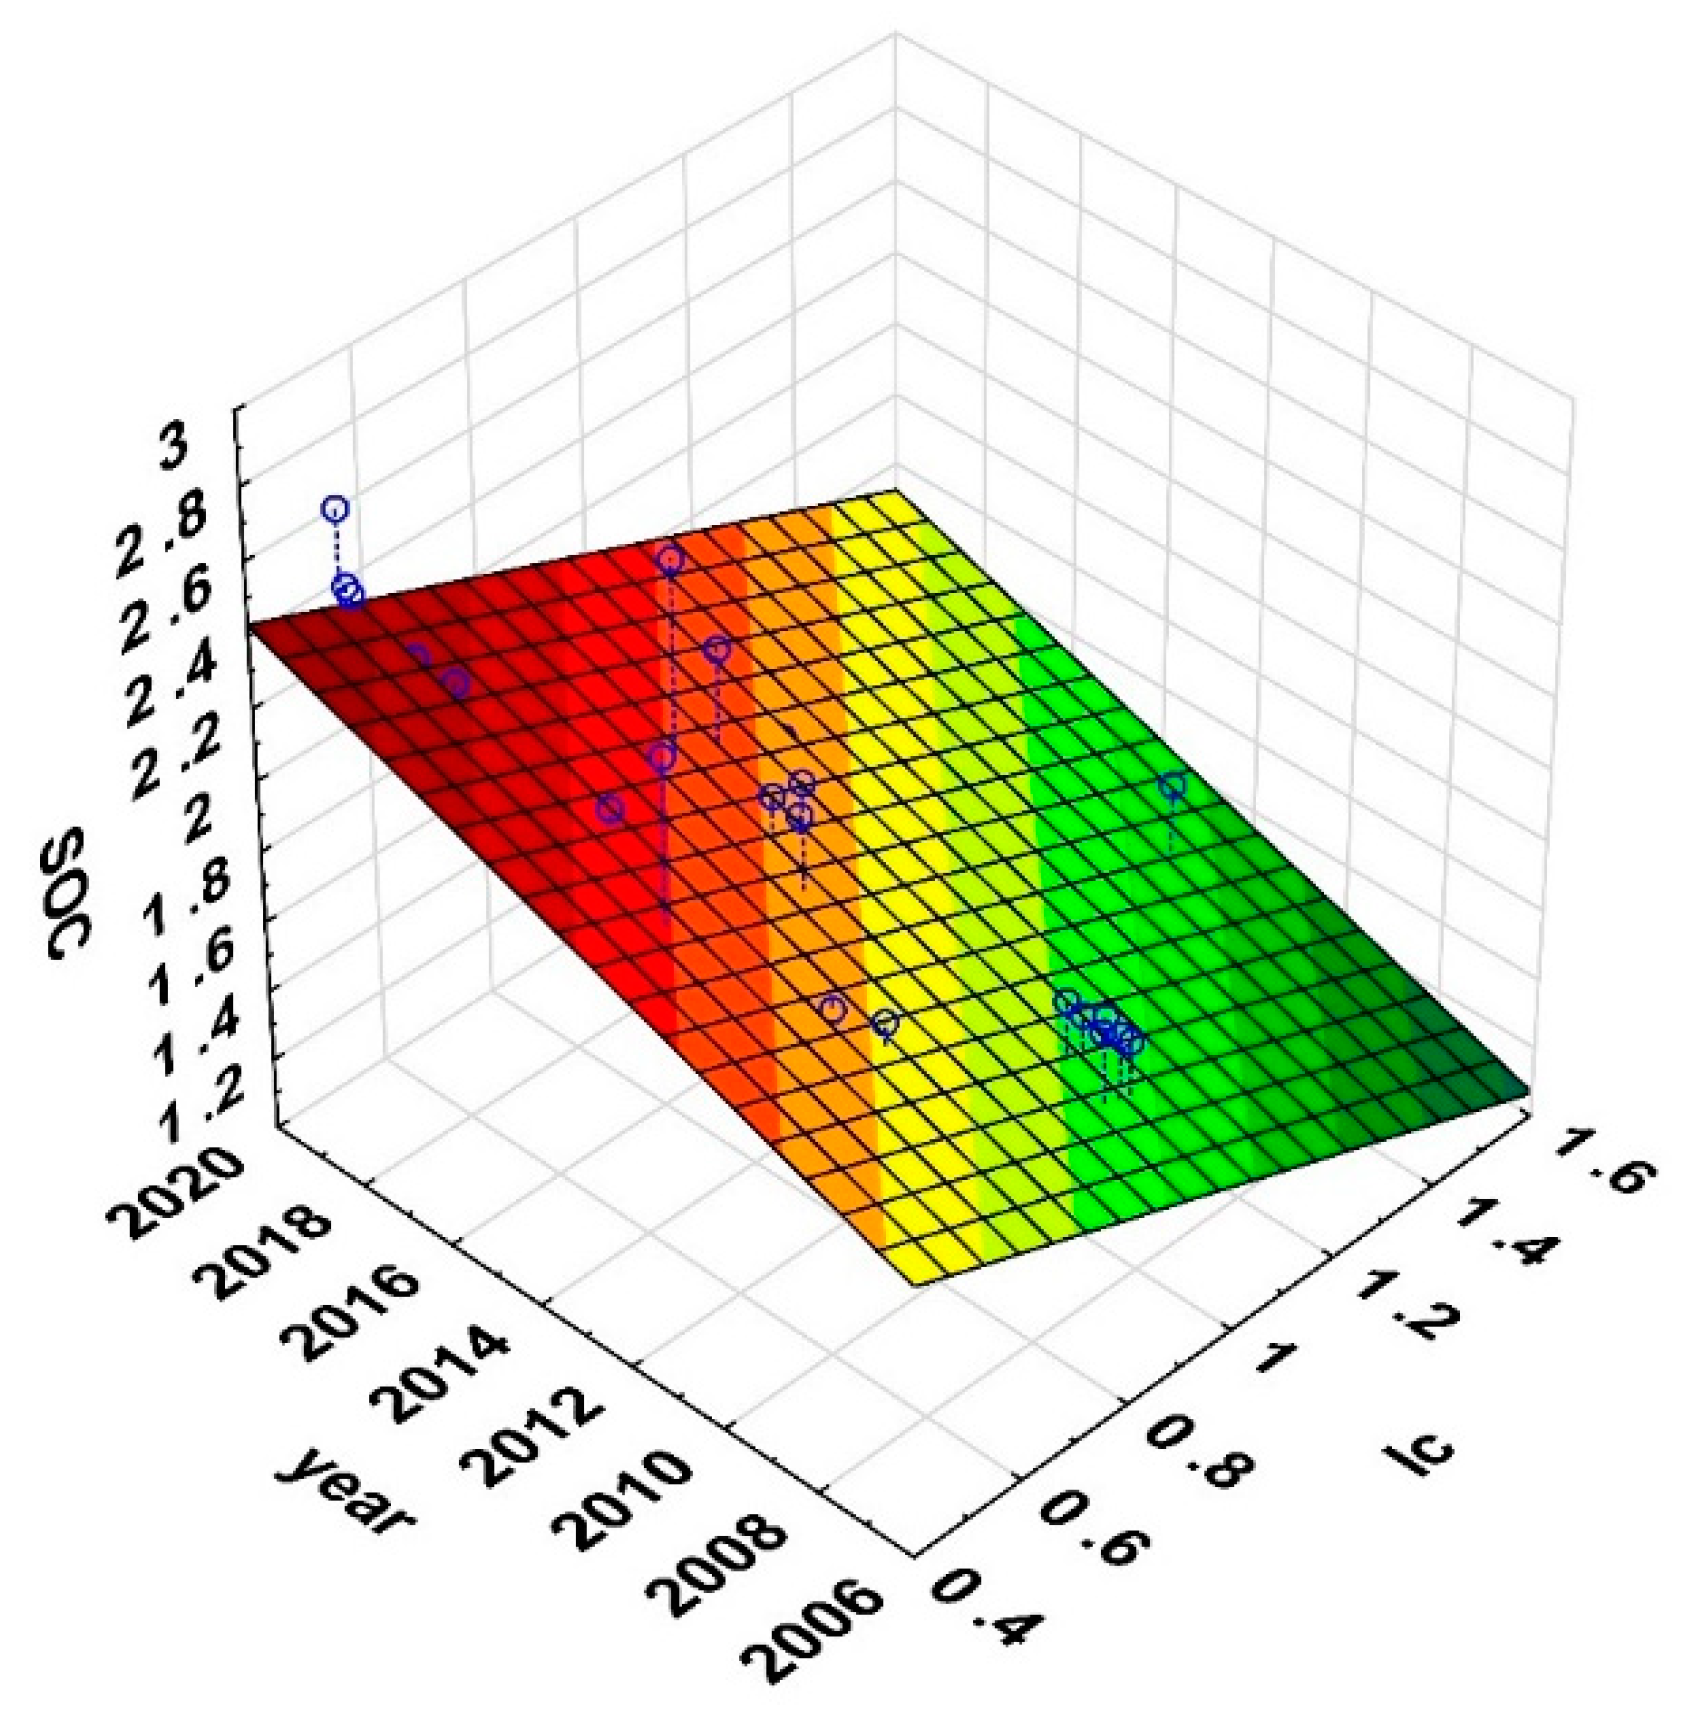
3.2. Dynamics of SOM, Humic Substances, and Soil Structure for 2008–2021

The development of individual parameters over time during the studied period for each fertilization level is presented in Table 2. The content of SOC in all fertilization treatments, including control, increased over the period of 14 years. The average rate of increase in SOC in the control, NPK1, and NPK3 was 0.71, 0.69, and 0.53 g kg−1 year−1, respectively, which represents an average increase over this period (2008–2021) by 60, 56, and 46%, respectively. The dynamics of other SOM parameters, as well as the qualitative parameters of humic substances, did not show statistically significant linear trends for the observed period. However, the content of HS, including HA and FA alone, significantly linearly increased over the period of 2008–2021, and the trend was very similar in all fertilization treatments (Table 3).
Over the period of 14 years, the contents of the water-stable macro-aggregate (WSAma) size fractions in the fertilization treatments were widely dispersed, and thus, no direct relationship could be found between them and the duration of the experiment. Only in the control without fertilization, also due to the annual application of higher doses of NPK (NPK3), the content of water-stable micro-aggregates (WSAmi) increased linearly in a statistically significant way. During the observed period, the dynamics of Kv and Ic values in all fertilization treatments showed a statistically significant linear decrease, while on the other hand, the values of St increased linearly. The vulnerability of the structure, but also St as a significant parameter of the soil structure, was most pronounced due to NPK3 > control > NPK1. Non-fertilization in grass sward cover between vine rows eliminated the formation of soil crust. At the same time, the high rates of NPK (NPK3) added to the grass in rows of the vine contributed to the formation of soil crust more intensively compared to lower rates of NPK (NPK1). The impacts of the structure variables, NPK level, and year were assessed separately on each of SOC and humus variables: HS, HA, and FA (Table 4, Figure 3).
Most of the variables describing the soil structure were not statistically significant, and the level of fertilization was not statistically significant as well. The independent variables that had a significant impact on Ic are SOC (p = 0.039) and year (p = 0.024). The year had a statistically significant effect on all studied variables of humic substances. In the case of SOC, multiple linear regression was performed for the two statistically significant variables and the regression equation was determined: Ic = −0.02 · year − 0.18 · SOC + 36.31 (Figure 3). The regression coefficient for SOC was negative, denoting increasing Ic values with a decrease in the SOC content. For the year variable, the relationship was also negative, i.e., Ic decreased over time, regardless of the fertilization level.

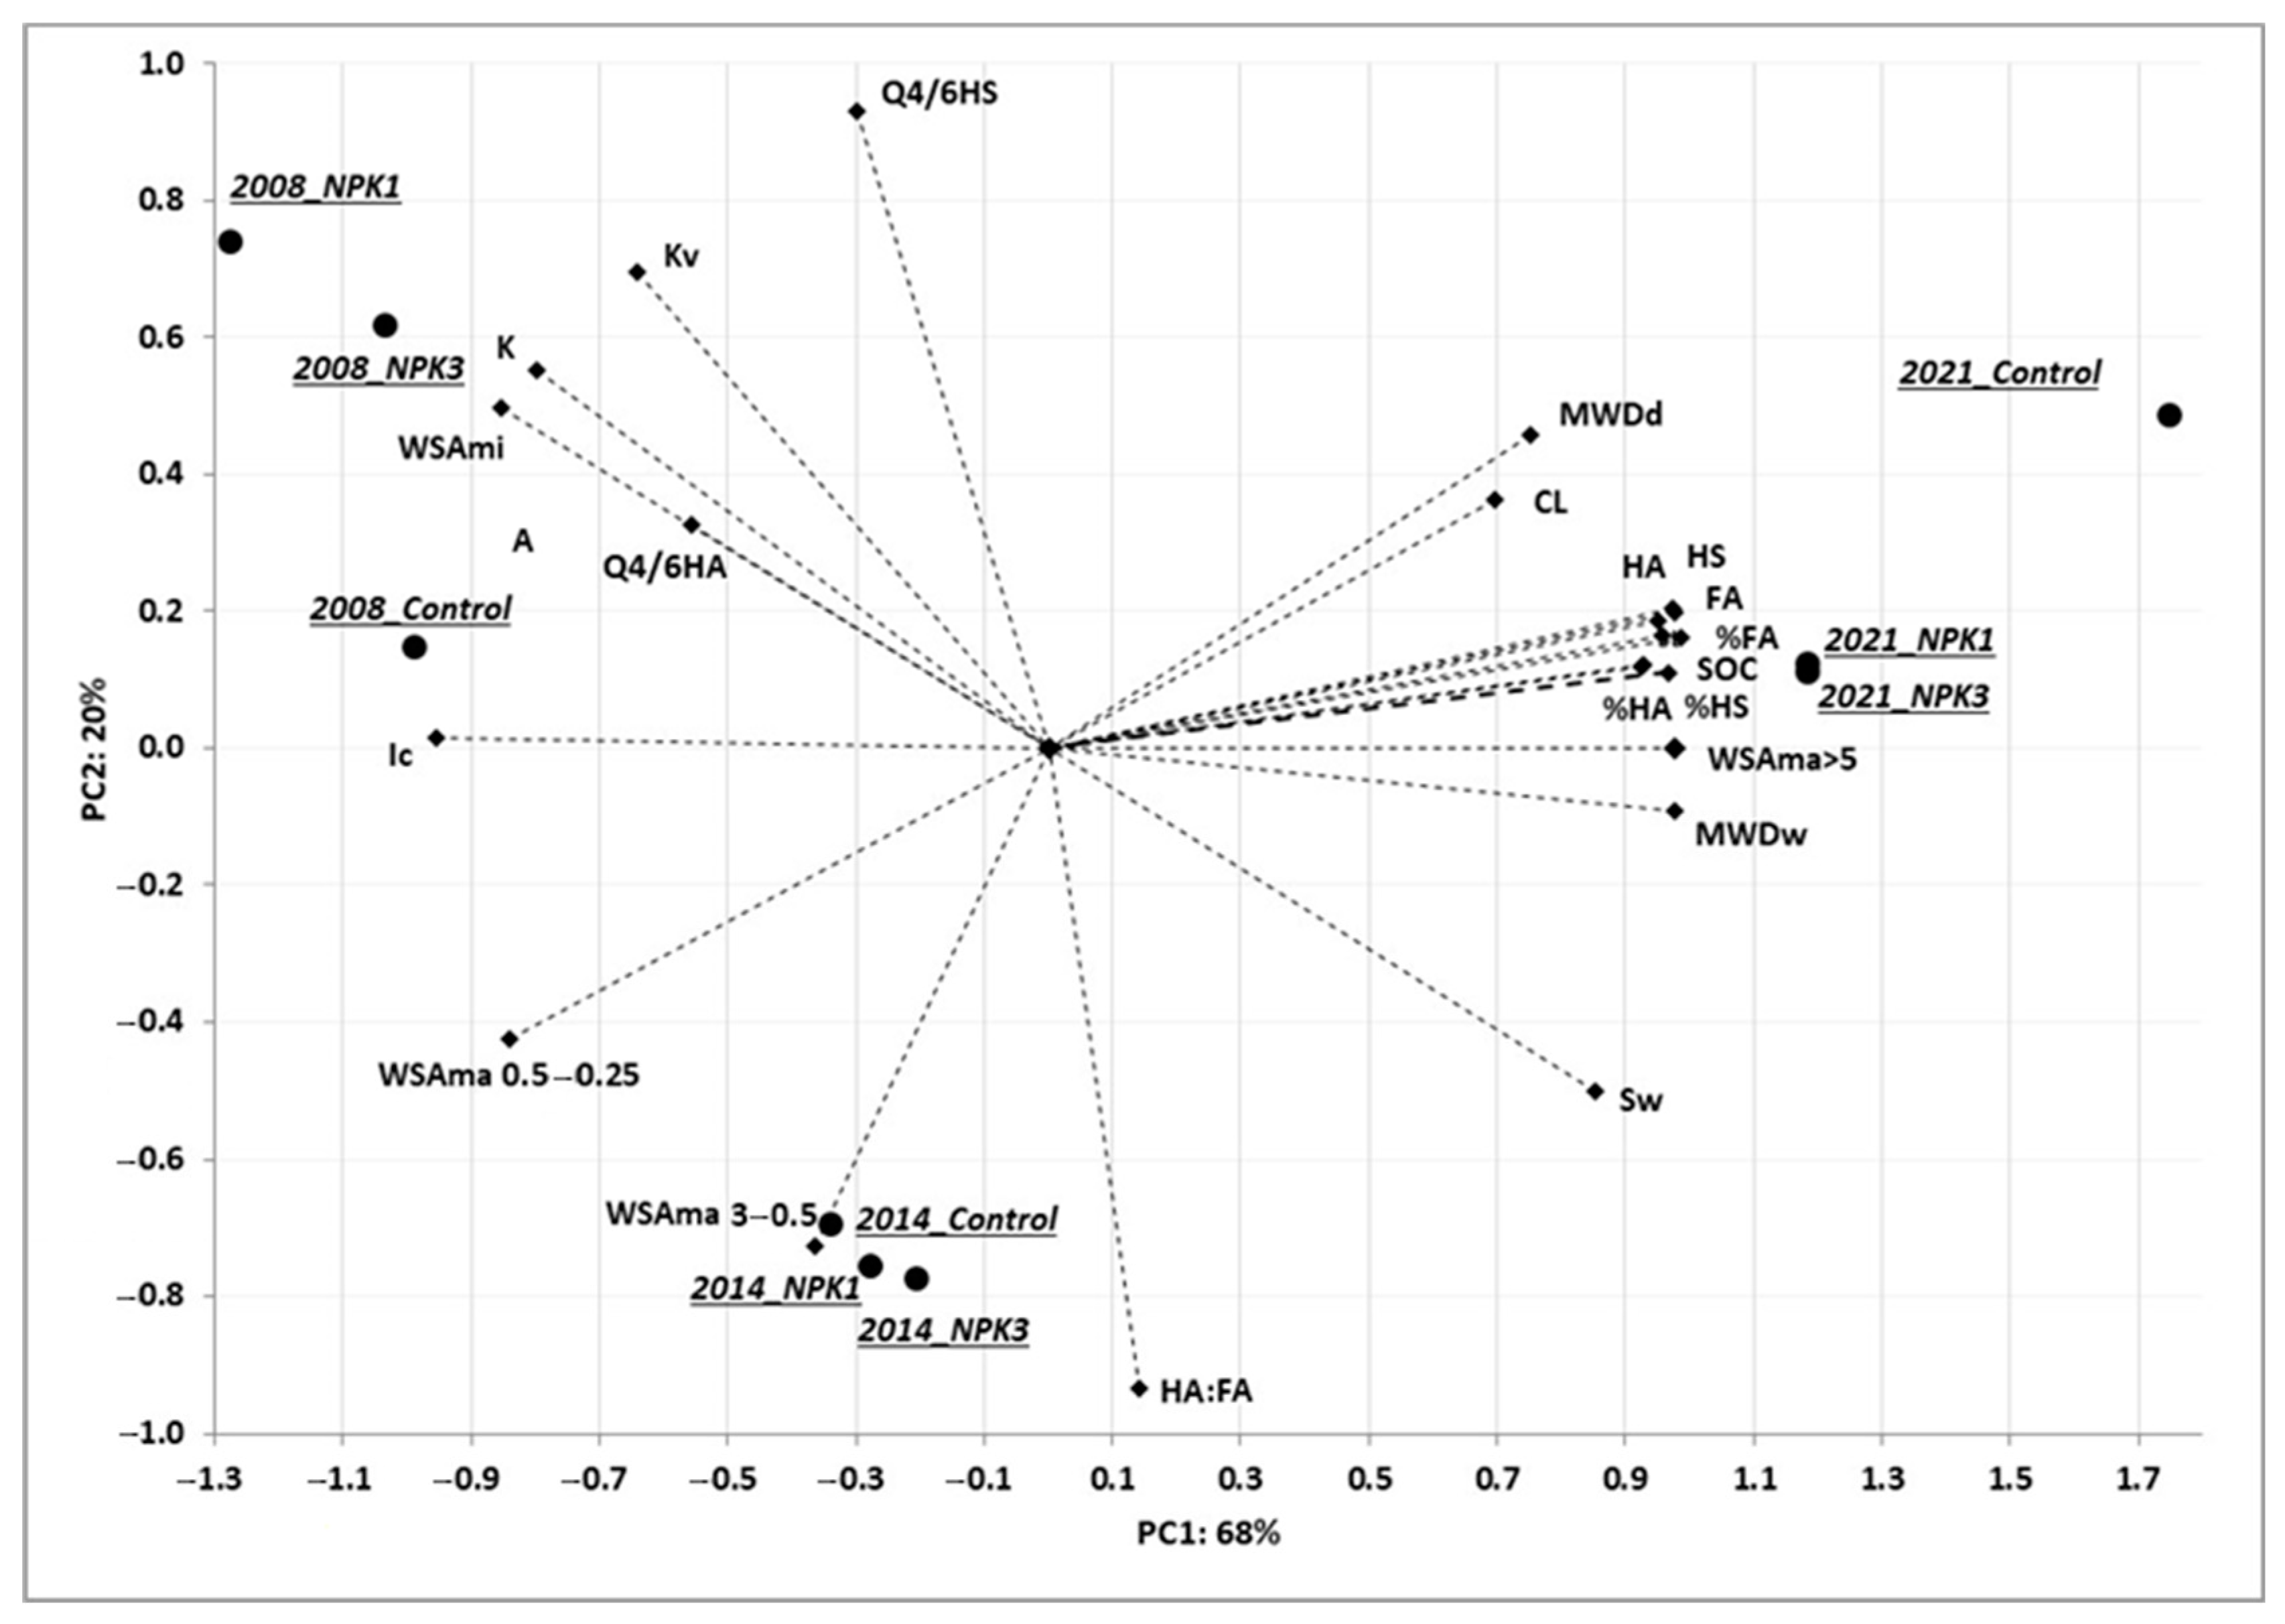
3.3. Correlations between SOM, Humic Substances, and Soil Structure in Fertilization Treatments during 2008–2021

The correlation coefficients between SOM, humic substances, and soil structure were also different depending on the intensity of NPK fertilization in the productive vineyard (Table 5). The results clearly indicated that with a higher level of NPK fertilization in the vineyard, the number of statistically significant correlations between the above variables decreased. In other words, the most statistically significant correlations between SOM, humic substances, and soil structure were obtained in the control and their number decreased in the order control > NPK1 > NPK3. In the control, the overall higher content of SOM and humic substances correlated with the increased mean weight diameter of water-stable aggregates (MWDw), especially the size fraction > 5 mm of WSAma, was what improved the soil structure stability expressed by the critical level of SOM. Due to the higher content of SOC and HS, in the treatment without fertilization, the formation of soil crust also decreased. In the control, the soil structure correlated with the quantitative parameters of SOM and the content of humic substances more than with their stability. The quality and stability of humic substances did not significantly correlate with soil structure. In the treatment with the 1st level of NPK fertilization in a productive vineyard (NPK1), SOC, CL, HS, and HA were positively correlated with St values. Higher FA content correlated positively with the increased stability of the soil aggregates and at the same time negatively correlated with the content of WSAmi and Kv in this fertilization treatment. At a higher level of NPK fertilization of the productive vineyard (NPK3), statistically significant positive and negative correlations were found between SOC vs. St; CL vs. St; HS vs. St; FA vs. St and SOC vs. Ic; HS vs. Ic, respectively.

4. Discussion

4.1. Soil Organic Matter and Humic Substances

SOM can be expressed as the function of balance between the rate of its deposition and rate of its loss [32,33]. Moreover, depending on the conditions, SOM in soil underlies the transformation processes, such as mineralization, humification, and also digestion [16,29]. Therefore, it is no surprise that all monitored parameters of SOM and humic substances statistically significantly changed in the course of the years (Table 2). The variable content of SOM and humic substances in the soil over the years can refer to the different production of the aboveground and root biomass (grassing of inter-rows of the vine in all treatments), different microbial activity, and the diverse dynamics of the SOM transformation processes during the studied period (Figure 2). For example, growing of cover crops [34] or mulching [35] reduces the loss of SOM in vineyard soils. The grassing of inter-rows of the vine contributes to the C sequestration in the production vineyards [4,5] and improves the quality of humic substances in these soils [3]. Apart from the physico-chemical properties including soil texture, the content of SOM depends also on the crop cover. A higher production of biomass is the prerequisite for higher SOM accumulation in soil [36]. If the nutrients enter into the soil via long-term mineral fertilization, an increased formation of plant biomass, including the microbial, is assumed [37]. Under optimal conditions, the labile fractions of the formed biomass mineralize. If the optimal conditions are created for humification (i.e., sufficiency of P, Mg, N, optimal pH, the balance between air and water in soil, the presence of semilabile and semistable fractions of primary SOM, and higher temperature), SOM is transformed into the humic substances [16]. However, the mineral fertilization did not have a statistically significant effect on SOM (besides %HA in SOC) and humic substances (apart from Q4/6HS). The results on %HA in SOC indicate that the primary organic matter prevails over humic substances in all treatments. However, this primary organic matter humifies less and is constantly replenished through exudates, plant, root residues, and biomass of microorganisms. The results indicate that in the control and NPK3 treatments (Figure 1), the primary organic matter humified considerably less than in NPK1. Additionally, the fertilization at both doses of NPK compared with the control treatment decreased the stability of HS. The humic substances, which are formed only as a result of grass growing in the inter-rows of the vine, had higher stability and were more condensed [13,29,38] in the control without the addition of NPK into the grass-covered rows of the vine. However, the dynamics of rising SOM and humic substance contents had a statistically linear trend in all treatments (Table 3). As the increases were almost identical, no difference was observed between the individual treatments of fertilization and control, but between the levels of NPK fertilization in 2008–2020. Before the experiment, the area had been cultivated for centuries; therefore, it was assumed that the contents of SOM and humic substances stabilized before the experiment was established [39,40]. The setting up of the experiment and sowing grasses into inter-rows of the vine might have upset the balance in SOM [41]. This resulted in the gradual increase in SOC and also the contents of HS including HA and FA (Table 3). However, mineral fertilization did not accelerate these changes. This is a typical scenario of soil regeneration [42]; after the elimination of soil-intensive cultivation via the plant biomass remaining in place, the content of SOC is increased and the dynamics of SOM is adjusted.

4.2. Soil Structure

Changes in temperature and humidity in time have an impact on the aggregation through alternating cycles of freezing and thawing in soil, as well as soil humidification and drying, which results in mixing of the soil particles and their merging in the organic colloids [43]. Changes in soil temperature and moisture also facilitate the microbial activity, which is a key factor in the aggregation process [44,45]. The results of this study also confirm the significant effect of the year on the changes in the parameters of the soil structure (Table 2). Considerable differences between fertilization treatments in different years were evident at the beginning of the experiment (2008), in the middle (2014) and also at the end in 2020, and the experiment still continues (Figure 2). Overall, the mineral fertilization applied into the grass-covered inter-rows of the vine did not affect statistically significantly the soil structure (Table 2). However, the dynamics of changes for some parameters were different depending on the level of mineral fertilization (Table 3). In 2008–2020, the total dynamics for almost all parameters of the soil structure had a statistically significant linear trend indicating the improvement of the soil structure only in the control, where grasses were sown into vine inter-rows. The effect of the plant roots on the aggregation via their length and density, microbial associations, cover of soil surface [45], and the formation of root exudates [18,46] is known. The impact of NPK in the grass-covered inter-rows of the vine was observed as the improvement in the linear trends in the soil structure only for some parameters. For instance, the total vulnerability of soil structure decreased as a result of NPK fertilization—more at a higher application dose. However, the stability of soil aggregates increased linearly only in the control and NPK3 treatments, which corresponded to a decrease in WSAmi content. Similarly, the rate of soil crust formation decreased in the following order of control > NPK1 > NPK3. In the control and NPK3 treatments, the root biomass, root exudates, and a higher activity of microorganisms, including microscopic fungi [37,47], can be responsible for structural state. In the case of NPK1, this effect can be associated with better conditions for the process of humification, which results in an improved soil structure. In the control and NPK3, the improvement of soil structure can also be associated with the effect of the soil fauna [48]. With a higher total biomass in the root zone, more earthworms were counted (unpublished data). The earthworms devour the organic mass (aboveground and underground biomass of the cultivated grasses in vine inter-rows) that is consequently mixed with other soil mineral particles in their digestive tract. The excretions in the form of worm-casts are considered to be stable soil aggregates [49].

4.3. Relationships between SOM, Humic Substances, and Soil Structure from the Effect of Fertilizing in Vine Inter-rows

SOM and humic substances play an essential role in the formation of soil structure [4,8,9,44,48]. In the case of this study, the impacts of soil structure parameters, NPK levels, and year were assessed separately on each SOM and humic substance variable (Table 3) with different effects. The results of the multiple regression analysis demonstrated that due to the grass cultivation in vine inter-rows (in all treatments), the content of SOC increased year by year, whereas the formation of the soil crust decreased. No significant multiple regression relationships between SOM, HS, and soil structure were detected, depending on the vintage and also the level of NPK fertilization applied to the grass-covered vine inter-rows (Table 4). The contents of SOM and HS, including their quality, are modified considerably by the soil management practices, as it has been documented in the publications of several authors [50,51]. The stability and size distribution of soil aggregates is also affected by the land use [52], and the rate of decay of macro- and micro-aggregates can be influenced by mineral fertilization. Mineral fertilization increases the mineralization, which results in the growth of SOM labile fractions and temporarily also the stabilization of the soil aggregates [10,11,48]. However, this effect was insufficient in the presented study. In the vineyard soil, only the more stable SOM fractions had a stronger effect on the stabilization of the soil structure [14]. Therefore, simple correlations between SOM, HS, and the parameters of soil structure depending on the level of fertilization were assessed. According to the results indicated in Table 5, the intensity of fertilization had a significant impact on the mutual relations between SOM, HS, and soil structure. In the control, where grasses grew in the vine inter-rows, statistically significant correlations were the most numerous. Along with the rising intensity of fertilization in the grass-covered vineyard inter-rows, these relations lost its significance. In the control, the quantity and quality of SOM and HS supported the formation of larger aggregates and the stability of the soil structure. In NPK1, the SOM and HS parameters did not affect the average size of aggregates except only the higher fractions of WSAma > 5–0.5 mm. In NPK3, SOM and HS did not influence the average size of aggregates and the content of all fractions, i.e., WSA including WSAmi. This is a surprising fact because the stabile organo-mineral complex is formed as a basis of the favorable soil structure via HS and calcium and clay particles [53,54]. The effect of mineral fertilizers was apparently eliminated as a result of nutrient depletion from the mineral fertilizers simply by the soil microorganisms, and also by the vine growth or the cultivated grasses. A higher dose facilitated the biomass formation and lower doses of NPK also encouraged the humification of SOM (Figure 1). The formation of root exudates and the boost of microbial activity supports the soil aggregation [17,18]. However, in our experiment, the results indicate a more essential effect of the grass cultivation in the vine inter-rows, which besides the root exudates, impacts the soil structure through the root hairs. In other words, the larger macro-aggregates are stabilized via the root hairs [55], or they dry out the soil surrounding the plant roots, which allows the orientation of the clay particles that are associated consequently with the organic colloids via the polyvalent cations [48,53]. The rhizosphere aggregates are more stable than the non-rhizosphere soil aggregates [46,54,56].

5. Conclusions

Not all SOM, humic substances, and soil structure parameters were affected by fertilization. The addition of the lower dose of NPK into the grass-covered vine inter-rows improved SOM humification. Both levels of NPK application negatively influenced the HS stability, and the effect was more pronounced at a higher dose of NPK. The significant differences of the SOM, HS, and soil structure parameters in the individual treatments of fertilization were observed at the beginning, in the middle, and also at the end of the experiment.
During the observed period, the dynamics of SOM, HS, and also soil structure parameters was different depending on the fertilization. The contents of SOC increased most intensively as a result of grassing and a higher level of fertilization but less intensively with a higher dose of NPK. The contents of HS, including HA and FA, increased linearly; however, it was without the considerable differences between the treatments with fertilization. During the monitored period 2008–2020, the overall dynamics of almost all parameters of the soil structure had a statistically significant linear trend, indicating the improvement of soil structure only in the control, where the grasses were sown into vine inter-rows. The vulnerability of the soil structure decreased as a result of NPK fertilization—more at a higher application dose. In the observed period, the stability of the soil aggregates increased linearly, but the presence of WSAmi decreased (but only in NPK3 treatment). The acceleration of the soil crust formation was eliminated significantly in the following order of control > NPK1 > NPK3.
The multiple regression relationships between SOM, HS, and soil structure taking into account the effect of vintage and fertilization showed that as a result of the grass cultivation in vine inter-rows (in all treatments), the content of SOC was increasing year-over-year, whereas the soil crust formation was decreasing. The relations between SOM and soil structure were different depending on the fertilization level. In the unfertilized control, where grasses grew in the vine inter-rows, the statistically significant correlations were the most numerous with the highest significance. Along with the rising level of fertilization into the grass-covered vine inter-rows, these relations lost its significance.
The results indicate that the relationships between SOM, HS, and soil structure improved considerably simply because of the grass cultivation in the vine inter-rows as a result of addition of mineral fertilization into the grass-covered rows. However, many relations were inexplicit in NPK fertilization; therefore, this problem still requires further study and apparently the evaluation of several variables. There is the presumption that the studied relations may be affected by other components (the content of carbonates, pH, presence and mobilization of P, Ca, or Mg), related to the improvement of structure in NPK fertilization.

Author Contributions

Conceptualization, V.Š.; methodology, V.Š.; software, V.Š., E.W.-G. and E.A.; validation, E.W.-G., J.H., D.P., T.L., A.P., M.L. and E.A.; formal analysis, V.Š. and E.W.-G.; investigation, V.Š.; resources, V.Š. and J.H.; data curation, V.Š. and E.W.-G.; writing—original draft preparation, V.Š. and E.W.-G.; writing—review and editing, J.H., D.P., T.L, A.P., M.L. and E.A.; visualization, V.Š., E.W.-G. and E.A.; supervision, V.Š.; project administration, V.Š. and J.H.; funding acquisition, V.Š. and J.H. All authors have read and agreed to the published version of the manuscript.

Funding

This study was supported by the Cultural and Educational Grant Agency MŠVVaŠ SR (KEGA) project No 013SPU-4/2021 “Development of Pedological Terminology of Slovak and English Equivalents and Their Applicability in Scientific-Pedagogical Process”. Furthermore, this publication is the result of the project implementation of “Scientific support of climate change adaptation in agriculture and mitigation of soil degradation” (ITMS2014 + 313011W580), supported by the Integrated Infrastructure Operational Programme, funded by the ERDF.

Institutional Review Board Statement

Not applicable.

Informed Consent Statement

Not applicable.

Data Availability Statement

The datasets generated and analyzed during the current study are available from the authors upon a reasonable request.

Acknowledgments

The authors express their gratitude to the editor and the reviewers for their constructive comments.

Conflicts of Interest

The authors declare no conflict of interest. The funders had no role in the design of the study; in the collection, analyses, or the interpretation of the data; in the writing of the manuscript, or in the decision to publish the results.

References

  1. Braun, J.; Vanek, G. Pestujeme Vinič [We Grow Vines]; Form Servis: Bratislava, Slovakia, 2003; p. 216. (In Slovak) [Google Scholar]
  2. Súľovský, M.; Hriník, D. Možnosti Uplatnenia Fyzicko-Geografických Prístupov ako Príspevku ku Kvalitatívne Orientovanej Vinohradníckej Produkcii (Possibilities of Applying Physico-Geographical Approaches as a Contribution to Qualitatively Oriented Viticultural Production). Geogr. Cassoviensis 2016, 2, 175–192. Available online: https://uge-share.science.upjs.sk/webshared/GCass_web_files/articles/GC-2016-10-2/Sulovsky_Hrinik.pdf (accessed on 13 September 2021).
  3. Šimanský, V.; Bajčan, D. The stability of soil aggregates and their ability of carbon sequestration. Soil Water Res. 2014, 3, 111–118. [Google Scholar] [CrossRef] [Green Version]
  4. Šimanský, V.; Balashov, E.; Horák, J. Water stability of soil aggregates and their ability to sequester carbon in soils of vineyards in Slovakia. Arch. Agron. Soil Sci. 2016, 2, 177–197. [Google Scholar] [CrossRef]
  5. Lazcano, C.; Decock, C.; Wilson, S.G. Defining and managing for healthy vineyard soils, intersections with the concept of Terroir. Front. Environ. Sci. 2020, 8, 68. [Google Scholar] [CrossRef]
  6. Blume, H.P.; Brümmer, G.W.; Fleige, H.; Horn, R.; Kandeler, E.; Kögel-Knabner, I.; Kretzschmar, R.; Stahr, K.; Wilke, B.M. Soil Science; Springer: Berlin/Heidelberg, Germany, 2016; p. 618. [Google Scholar]
  7. Foth, H.D. Fundamentals of Soil Science; JohnWiley & Sons: New York, NY, USA, 1990; p. 360. [Google Scholar]
  8. Mamedov, A.I.; Fujimaki, H.; Tsunekawa, A.; Tsubo, M.; Levy, G.J. Structure stability of acidic Luvisols: Effects of tillage type and exogenous additives. Soil Till. Res. 2021, 206, 104832. [Google Scholar] [CrossRef]
  9. Wu, Q.; Jiang, X.; Lu, Q.; Li, J.; Chen, J. Changes in soil organic carbon and aggregate stability following a chronosequence of Liriodendron chinense plantations. J. For. Res. 2021, 1, 355–362. [Google Scholar] [CrossRef]
  10. Wang, S.Q.; Li, T.X.; Zheng, Z.C. Tea plantation age efects on soil aggregate-associated carbon and nitrogen in the hilly region of western Sichuan, China. Soil Till. Res. 2018, 180, 91–98. [Google Scholar] [CrossRef]
  11. Dai, H.C.; Chen, Y.Q.; Liu, K.C.; Li, Z.X.; Qian, X.; Zang, H.D.; Yang, X.L.; Zhao, Y.X.; Shen, Y.W.; Li, Z.J.; et al. Water-stable aggregates and carbon accumulation in barren sandy soil depend on organic amendment method: A three-year field study. J. Cleaner Prod. 2019, 212, 393–400. [Google Scholar] [CrossRef]
  12. Šimanský, V. Soil organic matter in water-stable aggregates under different soil management practices in a productive vineyard. Arch. Agron. Soil Sci. 2013, 9, 1207–1214. [Google Scholar] [CrossRef]
  13. Polláková, N.; Šimanský, V.; Kravka, M. The influence of soil organic matter fractions on aggregates stabilization in agricultural and forest soils of selected Slovak and Czech hilly lands. J. Soils Sediments 2018, 18, 2790–2800. [Google Scholar] [CrossRef]
  14. Šimanský, V.; Bajčan, D.; Ducsay, L. The effect of organic matter on aggregation under different soil management practices in a vineyard in an extremely humid year. Catena 2013, 101, 108–113. [Google Scholar] [CrossRef]
  15. Jonczak, J. Soil organic matter properties in Stagnic Luvisols under different land use types. Acta Agrophysica 2013, 4, 565–576. Available online: https://bibliotekanauki.pl/articles/35937c (accessed on 26 September 2021).
  16. Váchalová, R.; Kolář, L.; Muchová, Z. Primární Organická Půdní Hmota a Humus, Dvě Složky Půdní Organické Hmoty (Primary Soil Organic Matter and Humus, Two Components of Soil Organic Matter); SUA: Nitra, Slovakia, 2016; p. 122. (In Czech) [Google Scholar]
  17. Baumert, V.L.; Vasilyeva, N.A.; Vladimirov, A.A.; Meier, I.C.; Kögel-Knabner, I.; Mueller, C.W. Root exudates induce soil macroaggregation facilitated by fungi in subsoil. Front. Environ. Sci. 2018, 6, 140. [Google Scholar] [CrossRef]
  18. Burak, E.; Quinton, J.N.; Dodd, I.C. Root hairs are the most important root trait for rhizosheath formation of barley (Hordeum vulgare), maize (Zea mays) and Lotus japonicus (Gifu). Ann. Bot. 2021, 128, 45–57. [Google Scholar] [CrossRef] [PubMed]
  19. Firdovsi, A.G. Influence of introduction of mineral fertilizers under Chestnut soils on accumulation of common nitrogen, phosphorus and potassium on annual age of grape culture. Agric. Res. Tech. 2019, 1, 556113. [Google Scholar] [CrossRef]
  20. Kováčik, P.; Ryant, P. Agrochémia, Princípy a Prax (Agrochemistry, Principles and Practice); SPU: Nitra, Slovakia, 2019; p. 358. (In Slovak) [Google Scholar]
  21. Hreško, J.; Pucherová, Z.; Baláž, I.; Ambróz, M.; Bezák, P. Krajina Nitry a jej Okolia (The Landscape of Nitra and its Surroundings); UKF: Nitra, Slovakia, 2006; p. 254. (In Slovak) [Google Scholar]
  22. Jankowski, M.; Šimanský, V.; Markiewicz, M.; Pilichowska, A.; Michalak, J. Differently used soils of the Tribeč mountain range and Nitra valley slope. In Soil Sequences Atlas IV; Świtoniak, M., Charzyński, P., Eds.; Nicolaus Copernicus University: Toruń, Poland, 2018; pp. 139–158. [Google Scholar]
  23. Kottek, M.; Grieser, J.; Beck, C.; Rudolf, B.; Rubel, F. World map of the Köppen-Geiger climate classification updated. Meteorol. Z. 2006, 15, 259–263. [Google Scholar] [CrossRef]
  24. Šimanský, V. Changes in soil structure and soil organic matter due to different severities of fire. Ecology 2015, 34, 226–234. [Google Scholar] [CrossRef] [Green Version]
  25. World Reference Base for Soil Resources 2014. International Soil Classification System for Naming Soils and Creating Legends for Soil Maps. Update 2015; World Soil Resources Reports No. 106; FAO: Rome, Italy, 2015; Available online: http://www.fao.org/3/i3794en/I3794en.pdf (accessed on 13 June 2021).
  26. Fecenko, J.; Ložek, O. Výživa a Hnojenie Poľných Plodín (Nutrition and Fertilization of Field Crops); SAU: Nitra, Slovakia, 2000; p. 442. (In Slovak) [Google Scholar]
  27. Dziadowiec, H.; Gonet, S. Przewodnik Metodyczny do Badań Materii Organicznej Gleb (Methodological Guidebook for The Organic Matter Researches); PTG: Warszawa, Poland, 1999; pp. 31–34. (In Polish) [Google Scholar]
  28. Loginow, W.; Wisniewski, W.; Gonet, S.S.; Ciescinska, B. Fractionation of organic carbon based on susceptibility to oxidation. Pol. J. Soil Sci. 1987, 20, 47–52. [Google Scholar]
  29. Stevenson, F.J. Humus Chemistry—Genesis, Composition, Reactions; Wiley & Sons: New York, NY, USA, 1982; p. 512. [Google Scholar]
  30. Vadjunina, A.F.; Korchagina, Z.A. Methods of Study of Soil Physical Properties; Agropromizdat: Moscow, Russia, 1986; p. 415. (In Russian) [Google Scholar]
  31. Valla, M.; Kozák, J.; Ondráček, V. Vulnerability of aggregates separated from selected anthorsols developed on reclaimed dumpsites. Rostl. Výroba 2000, 46, 563–568. [Google Scholar]
  32. Khorramdel, S.; Koocheki, A.; Mahallati, M.N.; Khorasani, R.; Ghorbani, R. Evaluation of carbon sequestration potential in corn fields with different management systems. Soil Till. Res. 2013, 133, 25–31. [Google Scholar] [CrossRef]
  33. Yan, X.; Zhou, H.; Zhu, Q.H.; Wang, X.F.; Zhang, Y.Z.; Yu, X.C.; Peng, X. Carbon sequestration efficiency in paddy soil and upland soil under long-term fertilization in southern China. Soil Till. Res. 2013, 130, 42–51. [Google Scholar] [CrossRef]
  34. López-Vicente, M.; Calvo-Seas, E.; Álvarez, S.; Cerdà, A. Effectiveness of cover crops to reduce loss of soil organic matter in a rainfed vineyard. Land 2020, 9, 230. [Google Scholar] [CrossRef]
  35. Cataldo, E.; Fucile, M.; Mattii, G.B. A review: Soil management, sustainable strategies and approaches to improve the quality of modern viticulture. Agronomy 2021, 11, 2359. [Google Scholar] [CrossRef]
  36. Yang, P.; Hu, Z.; Shu, Q. Factors affecting soil organic carbon content between natural and reclaimed sites in Rudong coast, Jiangsu province, China. J. Mar. Sci. Eng. 2021, 9, 1453. [Google Scholar] [CrossRef]
  37. Luo, P.; Han, X.; Wang, Y.; Han, M.; Shi, H.; Liu, N.; Bai, H. Influence of long-term fertilization on soil microbial biomass, dehydrogenase activity, and bacterial and fungal community structure in a brown soil of northeast China. Ann. Microbiol. 2015, 65, 533–542. [Google Scholar] [CrossRef] [Green Version]
  38. Weber, J. Humic Substances and Their Role in the Environment. EC Agric. 2020, 1, 3–8. Available online: https://www.ecronicon.com/eco20/pdf/ECAG-03-ECO-0002.pdf (accessed on 26 November 2021).
  39. Kögel-Knabner, I.; Guggenberger, G.; Kleber, M.; Kandeler, E.; Kalbitz, K.; Scheu, S.; Eusterhues, K.; Leinweber, P. Organo-mineral associations in temperate soils: Integrating biology, mineralogy, and organic matter chemistry. J. Plant. Nutr. Soil Sci. 2008, 171, 61–82. [Google Scholar] [CrossRef]
  40. Hernandez-Soriano, M.C.; Sevilla-Perea, A.; Kerré, B.; Mingorance, M. Stability of Organic Matter in Anthropic Soils: A Spectroscopic Approach. In Soil Processes and Current Trends in Quality Assessment; Hernandez-Soriano, M.C., Ed.; IntechOpen: London, UK, 2013; Available online: https://www.intechopen.com/chapters/43222 (accessed on 8 October 2021). [CrossRef] [Green Version]
  41. Lal, R. Soil Carbon Sequestration Impacts on Global Climate Change and Food Security. Science 2004, 304, 1623–1627. Available online: https://www.science.org/doi/10.1126/science.1097396 (accessed on 14 February 2022). [CrossRef] [Green Version]
  42. Conant, R.T.; Cerri, C.E.; Osborne, B.B.; Paustian, K. Grassland management impacts on soil carbon stocks: A new synthesis. Ecol. Appl. 2017, 27, 662–668. [Google Scholar] [CrossRef] [Green Version]
  43. Singer, M.J.; Southard, R.J.; Warrington, D.J.; Janitzky, P. Stability of synthetic sand clay aggregates after wetting and drying cycles. Soil Sci. Soc. Am. J. 1992, 56, 1843–1848. [Google Scholar] [CrossRef]
  44. Daquan, S.; Lin, Q.; Angst, G.; Huang, L.; Anikó, C.; Emsens, W.J.; van Diggelen, R.; Vicena, J.; Cajthaml, T.; Frouz, J. Microbial communities in soil macro-aggregates with less connected networks respire less across successional and geographic gradients. Eur. J. Soil Biol. 2022, 108, 103378. [Google Scholar] [CrossRef]
  45. Rillig, M.C.; Wright, S.F.; Eviner, V.T. The role of arbuscular mycorrhizal fungi and glomalin in soil aggregation: Comparing effects of five plant species. Plant. Soil 2002, 238, 325–333. [Google Scholar] [CrossRef]
  46. Czarnes, S.; Hallett, P.D.; Bengough, A.G.; Young, I.M. Root- and microbial-derived mucilages affect soil structure and water transport. Eur. J. Soil Sci. 2000, 51, 435–443. [Google Scholar] [CrossRef]
  47. Santos, D.; Murphy, S.L.S.; Taubner, H.; Smucker, A.J.M.; Horn, R. Uniform separation of concentric surface layers from soil aggregates. Soil Sci. Soc. Am. J. 1997, 61, 720–724. [Google Scholar] [CrossRef]
  48. Bronick, C.J.; Lal, R. Soil structure and management: A review. Geoderma 2005, 124, 3–22. [Google Scholar] [CrossRef]
  49. Świtoniak, M.; Kabala, C.; Karlins, A.; Charzyński, P. Guidelines for Soil Description and Classification; Polish Society of Soil Science: Torun, Poland, 2018; p. 286. [Google Scholar]
  50. Nayak, S.; Mishra, C.S.K. Nutrient enrichment of mine spoil with suitable organic and bio-fertilizer amendments as a sustainable technology for eco restoration. In Soil Amendments for Sustainability; Rakshit, A., Sarkar, B., Abhilash, P.C., Eds.; CRC Press: New York, NY, USA, 2019; pp. 349–361. [Google Scholar]
  51. Iwai, C.H.B.; Oo, A.N.; Kruapukdee, A.; Chuasavatee, T. Vermicompost as soil amendment for sustainable land and environment in Thailand. In Soil Amendments for Sustainability; Rakshit, A., Sarkar, B., Abhilash, P.C., Eds.; CRC Press: New York, NY, USA, 2019; pp. 321–349. [Google Scholar]
  52. Zhao, J.; Chen, S.; Hu, R.; Li, Y. Aggregate stability and size distribution of red soils under different land uses integrally regulated by soil organic matter, and iron and aluminum oxides. Soil Till. Res. 2017, 167, 73–79. [Google Scholar] [CrossRef] [Green Version]
  53. Guanglei, S.; Zhansheng, Z.; Feineng, J. Effects of humic acid-containing solid waste fertilizer on spinach yield and benefits. Zhejiang Agric. Sci. 2016, 11, 1876–1878. [Google Scholar]
  54. Kobierski, M.; Kondratowicz-Maciejewska, K.; Banach-Szott, M.; Wojewódzki, P.; Castejón, J.M.P. Humic substances and aggregate stability in rhizospheric and non-rhizospheric soil. J. Soils Sediments 2018, 18, 2777–2789. [Google Scholar] [CrossRef] [Green Version]
  55. Ge, Z.; Fang, S.; Chen, H.Y.H.; Zhu, R.; Peng, S.; Ruan, H. Soil aggregation and organic carbon dynamics in poplar plantations. Forests 2018, 9, 508. [Google Scholar] [CrossRef] [Green Version]
  56. Caravaca, F.; Hernandez, T.; Garcia, C.; Roldan, A. Improvement of rhizosphere aggregate stability of afforested semiarid plant species subjected to mycorrhizal inoculation and compost addition. Geoderma 2002, 108, 133–144. [Google Scholar] [CrossRef]
Figure 1. Box plots for share of humic acids in soil organic carbon (a) and color quotient of humic substances (b) displaying the minimum, first quartile, median, mean, third quartile, and maximum. The letters indicate homogeneous groups according to Tukey procedure at 0.05 significance level.
Agronomy 12 01460 g001
Figure 2. A biplot of the first two components of the PCA model of the soil data for 2008, 2014, and 2021 for three levels of fertilization (control, NPK1, and NPK3) presenting relationships between variables and multivariate differences between treatments. SOC—soil organic carbon; CL—labile carbon; %HS—share of humic substances in soil organic carbon; %HA—share of humic acids in soil organic carbon; %FA—share of fulvic acids in soil organic carbon; HS—humic substances; HA—humic acids; FA—fulvic acids; HA:FA—humic acids to fulvic acids ratio; Q4/6HS—color quotient of humic substances; Q4/6HA—color quotient of humic acids; K—structure coefficient; Kv—vulnerability coefficient; MWDd—mean weight diameter—dry sieving; St—critical level of SOM; Sw—index of aggregate stability; MWDw—mean weight diameter of water-stable aggregates; Ic—index of crusting; WSAma—water-stable macro-aggregates, WSAmi—water-stable micro-aggregates.
Agronomy 12 01460 g002
Figure 3. The results of multiple linear regression for index of crusting (Ic) dependence on soil organic carbon (SOC) and year, Ic = −0.02 · year − 0.18 · SOC + 36.31, R2 = 0.49.
Agronomy 12 01460 g003
Table 1. The investigated treatments in vineyard.
TreatmentDescription
ControlSown grass (mowed four times per year) in the inter-rows of vine, no fertilization.
1st level of NPK fertilization for a productive vineyard (NPK1)Corresponding to: 80 N kg ha−1, 35 P kg ha−1 and 135 K kg ha−1 [26]. Used fertilizer was Duslofert Extra 14-10-20-7 and real rates of nutrients applied in treatment were: 100 kg ha−1 N, 30 kg ha−1 P, 120 kg ha−1 K. The dose of nutrients was divided: 1/2 applied into the soil in spring (bud burst—in March) and 1/2 in flowering (in May). Grass sward cover in the inter-rows of vine. Grasses were mowed four times per year on average across all treatments.
3rd level of NPK fertilization for a productive vineyard (NPK3)Corresponding to: 120 N kg ha−1, 55 P kg ha−1 and 195 K kg ha−1 [26]. Used fertilizer was Duslofert Extra 14-10-20-7 and real rates of nutrients applied in treatment were: 125 kg ha−1 N, 50 kg ha−1 P, 185 kg ha−1 K. The dose of nutrients was divided: 2/3 applied into the soil in spring (bud burst—in March) and 1/3 in flowering (in May). Grass sward cover in the inter-rows of vine. Grasses were mowed four times per year on average across all treatments.
Table 2. Results of two-way ANOVA for soil characteristics depending on year and NPK level.
Soil Organic and Humic Substance ParametersYear p-ValueNPK p-ValueSoil Structure ParametersYear p-ValueNPK p-Value
SOC<0.0010.295K<0.0010.557
CL0.0040.548Kv0.0010.333
%HS in SOC<0.0010.086ΣMWDd<0.0010.993
%HA in SOC<0.0010.024St<0.0010.294
%FA in SOC<0.0010.530Sw<0.0010.118
HS<0.0010.303ΣMWDw<0.0010.280
HA<0.0010.315Ic<0.0010.655
FA<0.0010.330WSAma > 5<0.0010.237
HA:FA ratio<0.0010.257WSAma 3–0.50.0060.559
Q4/6HS<0.0010.004WSAma 0.5–0.250.0220.901
Q4/6HA<0.0010.052WSAmi<0.0010.075
Notes: p—significance level; statistically significant values are marked in red. NPK—level of fertilization (control, NPK1, and NPK3); SOC—soil organic carbon; CL—labile carbon; %HS in SOC—share of humic substances in soil organic carbon; %HA in SOC—share of humic acids in soil organic carbon; %FA in SOC—share of fulvic acids in soil organic carbon; HS—humic substances; HA—humic acids; FA—fulvic acids; HA:FA ratio—humic acids to fulvic acids ratio; Q4/6HS—color quotient of humic substances; Q4/6HA—color quotient of humic acids; K—structure coefficient; Kv—vulnerability coefficient; MWDd—mean weight diameter—dry sieving; St—critical level of SOM; Sw—index of aggregate stability; MWDw—mean weight diameter of water-stable aggregates; Ic—index of crusting; WSAma—water-stable macro-aggregates, WSAmi—water-stable micro-aggregates.
Table 3. The results of linear regression analysis for soil characteristics depending on year for three NPK levels (control, NPK1, and NPK3).
ParameterLinear ModelTrendProbabilityParameterLinear ModelTrendProbability
Control
SOCy = 0.071x − 141increase0.749 **Ky = −0.468x + 949decrease0.564 *
CLy = 102x − 202,782n.d.n.s.Kvy = −0.061x + 124decrease0.601 *
HSy = 0.040x − 81increase0.649 *ΣMWDdy = 0.018x − 34n.d.n.s.
HAy = 0.018x − 367increase0.670 *Sty = 0.283x − 561increase0.748 **
FAy = 0.022x − 44increase0.610 *Swy = 0.035x − 68n.d.n.s.
%HSy = 0.807x − 1595n.d.n.s.ΣMWDwy = 0.094x − 186increase0.584 *
%HAy = 0.308x − 605n.d.n.s.Icy = −0.030x + 62decrease0.812 ***
%FAy = 0.498x − 988n.d.n.s.WSAma > 5y = 1.889x − 3773n.d.n.s.
HA:FA ratioy = 0.005x − 8n.d.n.s.WSAma 3–0.5y = −0.204x + 454n.d.n.s.
Q4/6HSy = 0.050x − 96n.d.n.s.WSAma 0.5–0.25y = −0.193x + 396n.d.n.s.
Q4/6HAy = 0.023x − 41n.d.n.s.WSAmiy = −1.492x + 3022decrease0.553 *
NPK1
SOCy = 0.068x − 135increase0.754 **Ky = −0.414x + 839n.d.n.s.
CLy = 89.474x − 177,592n.d.n.s.Kvy = −0.083x + 1678decrease0.569 *
HSy = 0.040x − 79increase0.754 **ΣMWDdy = 0.006x − 10n.d.n.s.
HAy = 0.018x − 35increase0.715 **Sty = 0.272x − 540increase0.754 **
FAy = 0.022x − 44increase0.730 **Swy = 0.037x − 73n.d.n.s.
%HSy = 0.938x − 1860n.d.n.s.ΣMWDwy = 0.056x − 111n.d.n.s.
%HAy = 0.337x − 664n.d.n.s.Icy = −0.034x + 69decrease0.564 *
%FAy = 0.610x − 1215n.d.n.s.WSAma > 5y = 0.959x − 1903n.d.n.s.
HA:FA ratioy = 0.007x − 13n.d.n.s.WSAma 3–0.5y = 0.519x − 999n.d.n.s.
Q4/6HSy = 0.046x − 86n.d.n.s.WSAma 0.5–0.25y = 0.085x − 164n.d.n.s.
Q4/6HAy = −0.011x + 26n.d.n.s.WSAmiy = −1.494x + 3030n.d.n.s.
NPK3
SOCy = 0.053x − 106increase0.697 **Ky = −0.418x + 847n.d.n.s.
CLy = 72.943x − 144,151n.d.n.s.Kvy = −0.094x + 191decrease0.711 **
HSy = 0.040x − 80increase0.736 **ΣMWDdy = −0.005x + 13n.d.n.s.
HAy = 0.017x − 34increase0.710 **Sty = 0.213x − 421increase0.696 **
FAy = 0.023x − 46increase0.721 **Swy = 0.036x − 71increase0.643 *
%HSy = 1.238x − 2463n.d.n.s.ΣMWDwy = 0.076x − 152n.d.n.s.
%HAy = 0.441x − 871n.d.n.s.Icy = −0.024x + 48decrease0.740 **
%FAy = 0.797x − 1592increase0.582 *WSAma > 5y = 1.632x − 3254n.d.n.s.
HA:FA ratioy = -0.017x + 36n.d.n.s.WSAma 3–0.5y = 0.162x − 282n.d.n.s.
Q4/6HSy = 0.044x − 82n.d.n.s.WSAma 0.5–0.25y = −0.269x + 548n.d.n.s.
Q4/6HAy = 0.001x + 3n.d.n.s.WSAmiy = −1.548x + 3134decrease0.642 *
Notes: n.s.—non-significant; n.d.—non-detected; * p < 0.05; ** p < 0.01; *** p < 0.001; y = SOM, humic substances or soil structure parameters, x = years. Dependent variables: SOC—soil organic carbon; CL—labile carbon; HS—humic substances; HA—humic acids; FA—fulvic acids; %HS—share of humic substances in soil organic carbon; %HA—share of humic acids in soil organic carbon; %FA—share of fulvic acids in soil organic carbon; HA:FA ratio—humic acids to fulvic acids ratio; Q4/6HS—color quotient of humic substances; Q4/6HA—color quotient of humic acids; K—structure coefficient; Kv—vulnerability coefficient; MWDd—mean weight diameter—dry sieving; St—critical level of SOM; Sw—index of aggregate stability; MWDw—mean weight diameter of water-stable aggregates; Ic—index of crusting; WSAma—water-stable macro-aggregates, WSAmi—water-stable micro-aggregates.
Table 4. The results of multiple linear regression analysis.
NPKYearSOCHSHAFA
Icb52.39−0.02−0.02−0.17−1.400.432.12
p-value 0.3110.0240.0390.7320.9140.611
KKvΣMWDdSwΣMWDwWSAmi
Icb −0.010.09−0.12−0.960.15−0.02
p-value 0.3860.5730.1890.4110.0950.406
Notes: NPK—level of fertilization (control, NPK1, and NPK3); SOC—soil organic carbon; HS—humic substances; HA—humic acids; FA—fulvic acids; Ic—index of crusting depending on year; K—structure coefficient; Kv—vulnerability coefficient; MWDd—mean weight diameter–dry sieving; Sw—index of aggregate stability; MWDw—mean weight diameter of water-stable aggregates; WSAmi—water-stable micro-aggregates. Statistically significant values are shown in red font.
Table 5. The correlation coefficients between SOM, humic substances, and soil structure for the different levels of NPK fertilization.
KKvMWDdStSwMWDwIcWSAmaWSAmi
>53–0.50.5–0.25
Control
SOC−0.39−0.500.071.000.450.53−0.690.48−0.16−0.24−0.45
CL−0.42−0.520.300.860.530.70−0.490.67−0.32−0.44−0.53
HS−0.34−0.530.140.640.420.66−0.490.68−0.50−0.47−0.42
HA−0.28−0.440.200.650.330.61−0.580.64−0.54−0.49−0.33
FA−0.38−0.590.080.620.470.67−0.400.68−0.44−0.44−0.48
%HS in SOC−0.24−0.380.140.160.280.49−0.160.55−0.46−0.44−0.29
%HA in SOC−0.10−0.200.200.060.090.36−0.220.44−0.52−0.47−0.09
%FA in SOC−0.33−0.500.080.220.410.55−0.100.59−0.38−0.39−0.41
HA:FA ratio−0.030.380.30−0.04−0.33−0.19−0.38−0.18−0.13−0.010.33
Q4/6HS0.08−0.190.090.480.080.27−0.420.27−0.11−0.57−0.08
Q4/6HA−0.09−0.150.240.440.100.24−0.270.22−0.03−0.48−0.10
NPK1
SOC−0.49−0.290.461.000.390.33−0.710.280.140.29−0.39
CL−0.14−0.110.310.750.150.17−0.440.150.000.28−0.16
HS−0.41−0.490.200.600.490.49−0.400.470.17−0.36−0.50
HA−0.30−0.350.290.680.380.41−0.490.410.05−0.25−0.39
FA−0.46−0.560.130.500.560.52−0.300.490.25−0.43−0.55
%HS in SOC−0.26−0.52−0.030.140.440.47−0.050.470.17−0.60−0.44
%HA in SOC−0.04−0.290.050.180.230.34−0.140.37−0.04−0.51−0.25
%FA in SOC−0.39−0.61−0.080.110.530.510.010.490.29−0.59−0.53
HA:FA ratio−0.29−0.050.390.370.130.08−0.380.030.080.41−0.15
Q4/6HS0.280.170.000.42−0.32−0.18−0.35−0.15−0.360.320.32
Q4/6HA0.13−0.05−0.030.05−0.05−0.05−0.07−0.05−0.010.090.03
NPK3
SOC−0.09−0.45−0.361.000.180.02−0.630.020.28−0.17−0.18
CL0.10−0.33−0.420.78−0.040.00−0.35−0.010.06−0.250.04
HS−0.30−0.420.100.560.350.37−0.480.37−0.05−0.51−0.35
HA−0.27−0.390.150.480.330.41−0.540.44−0.23−0.48−0.33
FA−0.30−0.410.060.600.350.32−0.420.300.09−0.50−0.35
%HS in SOC−0.31−0.290.260.130.320.44−0.240.44−0.23−0.51−0.32
%HA in SOC−0.27−0.200.34−0.100.270.47−0.190.49−0.44−0.44−0.27
%FA in SOC−0.31−0.340.170.310.330.38−0.260.35−0.03−0.52−0.33
HA:FA ratio−0.270.090.26−0.490.190.130.020.15−0.190.36−0.19
Q4/6HS0.38−0.13−0.320.51−0.17−0.14−0.26−0.190.17−0.120.17
Q4/6HA0.360.00−0.390.17−0.31−0.32−0.10−0.380.250.200.31
Notes: K—structure coefficient; Kv—vulnerability coefficient; MWDd—mean weight diameter—dry sieving; St—critical level of SOM; Sw—index of aggregate stability; MWDw—mean weight diameter of water-stable aggregates; Ic—index of crusting; WSAma—water-stable macro-aggregates, WSAmi—water-stable micro-aggregates; SOC—soil organic carbon; CL—labile carbon; HS—humic substances; HA—humic acids; FA—fulvic acids; %HS—share of humic substances in soil organic carbon; %HA—share of humic acids in soil organic carbon; %FA—share of fulvic acids in soil organic carbon; HA:FA ratio–humic acids to fulvic acids ratio; Q4/6HS—color quotient of humic substances; Q4/6HA—color quotient of humic acids. Statistically significant correlations are shown in red font. The background color of the cells with the correlation coefficient values indicates the strength of the relationship. The color ranges from dark green indicating positive correlations toward dark orange indicating negative correlations.
Publisher’s Note: MDPI stays neutral with regard to jurisdictional claims in published maps and institutional affiliations.

