
Response of Maize, Cotton, and Soybean to Increased Crop Density in Heterogeneous Planting Arrangements
by

Sandra R. Ethridge
1, 
Anna M. Locke
1,2,
Wesley J. Everman
1,
David L. Jordan
1 and
Ramon G. Leon
1,3,4,* 1
Department of Crop and Soil Sciences, North Carolina State University, Raleigh, NC 27695, USA
2
Soybean and Nitrogen Fixation Research, USDA Agricultural Research Service, Raleigh, NC 27607, USA
3
Center for Environmental Farming Systems, North Carolina State University, Raleigh, NC 27695, USA
4
Genetic Engineering and Society Center, North Carolina State University, Raleigh, NC 27695, USA
*
Author to whom correspondence should be addressed.
Agronomy 2022, 12(5), 1238; https://doi.org/10.3390/agronomy12051238
Submission received: 22 April 2022
/
Revised: 12 May 2022
/
Accepted: 19 May 2022
/
Published: 23 May 2022
(This article belongs to the Special Issue Crop Yield and Quality Response to Cultivation Practices)
Abstract
:The reduction of row spacing and increase of crop population density are important tools for maximizing crop yield. For this strategy to be effective, the crop population should not create intraspecific crop competition that penalizes yield. Thus, planting arrangements that increase light interception throughout the canopy without increasing row spacing might be needed to maintain yield. In this study, heterogeneous planting arrangements on evenly spaced rows were analyzed for maize (Zea mays L.), cotton (Gossypium hirsutum L.), and soybean (Glycine max (L.) Merr.). Each crop had four planting arrangements: (1) normal density in all rows, considered the control, (2) doubled density in all rows, (3) a sequential arrangement of normal and tripled densities (each in every other row; NTNT), and (4) normal-tripled-tripled-normal (NTTN). Maize and cotton did not exhibit changes in growth and architecture when comparing uniform and variable planting arrangements. Soybeans were more adaptable and increased biomass production by 44% to 45% in variable arrangements. None of the crops showed differences in yield due to planting arrangement, so the use of rows with different densities might not be needed when using high densities to maximize yield.
1. Introduction
Reducing row spacing and increasing population density are important strategies for maximizing crop yield [1,2,3]. However, for this strategy to be effective, the resulting crop population densities should not create intraspecific crop competition that penalizes yield. For example, when increasing soybean population from 240,000 to 420,000 plants ha−1, yield was unaffected or slightly increased [4]. Furthermore, it has been demonstrated that in maize and cotton, doubling seeding rate does not decrease yield [5,6,7].
The use of narrow row spacing or higher crop density must consider canopy light interception and radiation use efficiency so that crop yields are maintained or increased. Thus, it is important that the planting arrangement allows light penetration to lower layers within the canopy [8,9,10,11]. For example, when a soybean canopy was manually opened, and lower leaves were able to obtain sunlight, there was a 258% increase in apparent photosynthesis of leaves in the lower canopy as compared to the natural shade found under field conditions [12]. This increase in light availability to the lower canopy could also delay leaf senescence, which in maize, for example, would allow the crop to photosynthesize for longer [13]. Another example of maximizing light interception efficiency through planting arrangements is the solar corridor cropping system, in which variation of crop spatial arrangements is used to increase crop yield without varying plant density [14]. This alternative planting arrangement maximizes solar radiation interception by either narrowing or widening row spacing of paired single or twin narrow rows of taller crops for more uniform and vertical distribution of incident light available to exposed leaves [14,15]. The problem with this approach is that it lengthens time to canopy closure and reduces crop competitive ability.
Current crop planting density recommendations have been selected to maximize yield. Thus, criteria such as maximization of light interception and avoidance of intra-specific competition have prevailed when determining crop planting density and arrangement [1,2,3]. In addition, high crop planting densities could be used instead of differing row spacing to mitigate complications for cultivation and harvest due to narrow row spacing [16].
Interactions between the optimization of reductions in crop density for better light penetration within the canopy and increases in crop density for yield maximization, as well as high seed costs, are part of major tradeoffs that must be resolved using innovative production strategies. One of those strategies might be the use of heterogeneous planting arrangements on evenly spaced rows that increase crop competitiveness while maintaining or increasing yield. This is now possible due to the availability of precision planters, which optimize agricultural production systems while considering spatial and temporal variability within the field [17]. In addition to variable application rates, precision agriculture also includes the use of global positioning systems (GPS) for assessing the spatial variability for site-specific application control [18]. This allows farmers to utilize their knowledge of weed spatial variability in their fields and create specific and directed management practices to more effectively suppress or prevent weed reproduction.
Currently, there are no studies that have varied planting density between rows while maintaining equal row spacing to reduce yield losses. By planting high- and low-density rows, light penetration through the canopy should be higher than in uniform densities, while still having fast canopy closure. This strategy has the potential to maintain or even increase crop yield. However, crop architecture varies by species, therefore the viability of such planting strategy will depend on morphological characteristics and responses to differences in planting arrangement.
Importantly, this planting strategy could be used as part of an integrated weed management strategy to prevent or reduce the production of new seed by weeds surviving herbicide applications or cultivations [19,20]. However, before the implementation of these variable planting arrangements for weed suppression, it is first critical to understand the morphological and yield responses of the crop to minimize unwanted penalties associated with increased plant density. The objective of the present study was to take a first step in characterizing the responses of three important row crops to variable planting arrangements. Our hypothesis was that uniform, high-density plantings suffer yield reductions due to intraspecific competition, and planting arrangements with variable planting densities across rows, while maintaining the same average density (i.e., high and low densities), will have higher yield compared to uniform planting densities in all rows by increasing light penetration within the canopy and thus minimizing intraspecific competition. We further hypothesized that crop responses to variable planting densities depends on whether changes in density are performed on single rows or pairs of rows.
2. Materials and Methods
2.1. Site Description
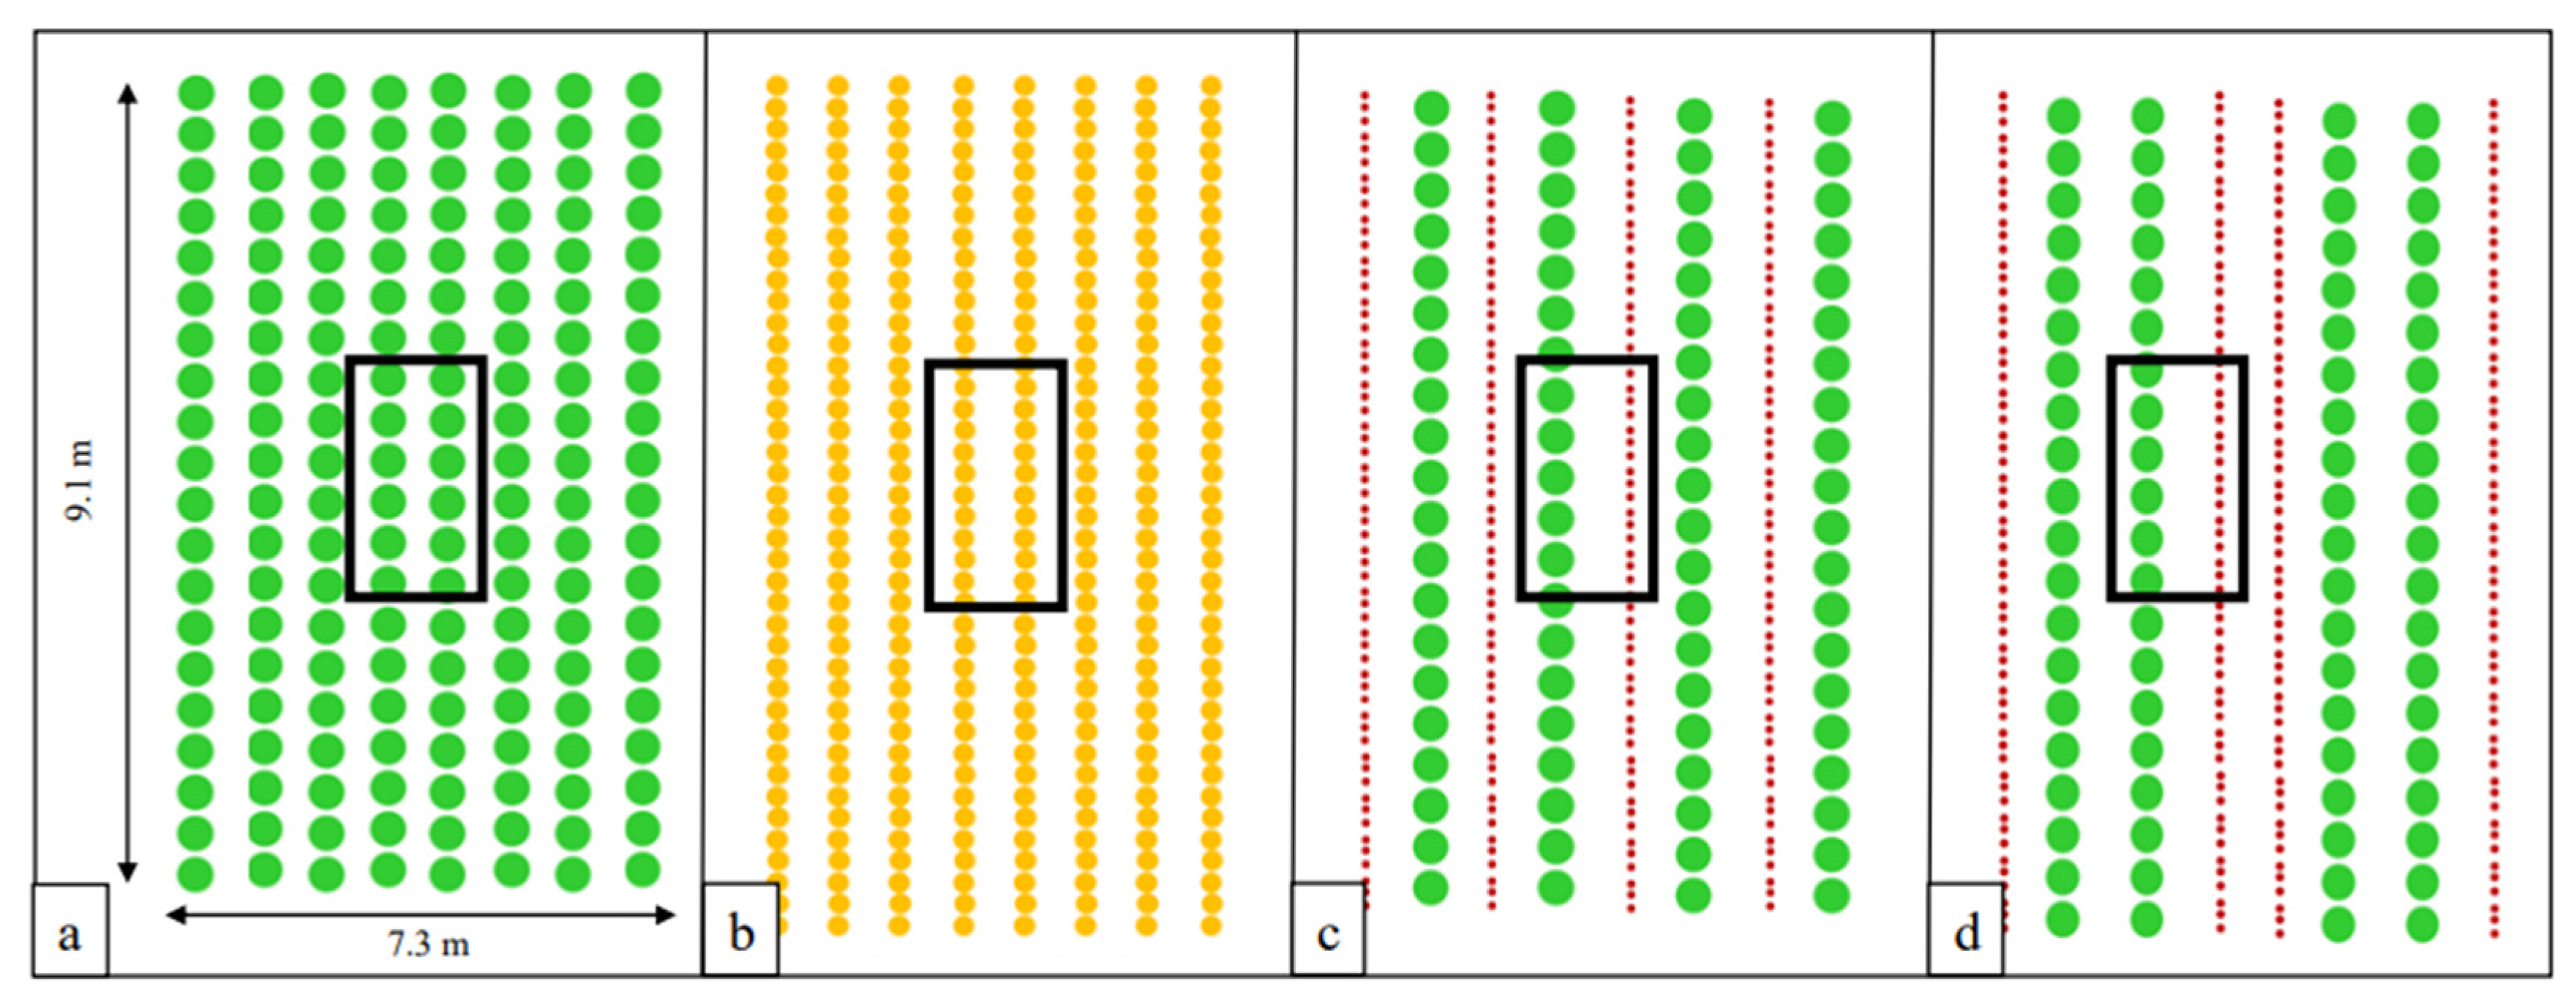
A field study was conducted to evaluate growth and yield responses of different planting arrangements in maize (Zea mays L.), cotton (Gossypium hirsutum L.), and soybean (Glycine max L. Merr.). This study was conducted in the summer seasons of 2019 and 2020 at the Upper Coastal Plain Research Station in Rocky Mount, NC (35.89, −77.68), and Cherry Research Farm in Goldsboro, NC (35.38, −78.03). The soil in Rocky Mount was a Goldsboro fine sandy loam (fine–loamy, siliceous, subactive, thermic Aquic Paleudult) with pH 6.3 and 1.50% organic matter. The soil in Goldsboro was a Wickham loamy sand (fine-loamy, mixed, semiactive, thermic Typic Hapludult) with pH 5.5 and 1.25% organic matter. In 2019, the maize variety used was DKC62-08 (Dekalb hybrid seed, Bayer CropScience LP), and in 2020, the variety was DKC67-42 (Dekalb hybrid seed, Bayer CropScience LP). In 2019 and 2020, the cotton variety was DP1646 B2XF (Bollgard Xtendflex, Bayer CropScience LP), and the soybean variety was C5947LL (Credenz, BASF). Crops were planted with a four-row planter (John Deere 1700, Deere & Company, Moline, IL, USA) in 91 cm rows in Rocky Mount and with a six-row planter (1215 Rigid Mounted, CNH Industrial America LLC) in 76 cm rows in Goldsboro. Planter seeding plates were modified to ensure that each desired arrangement was planted in a single pass. In each year, there were three and four replications in Rocky Mount and Goldsboro, respectively, with 12 treatments at each location. In Rocky Mount, the plot size was 9.1 m by 7.3 m (i.e., 8 rows wide; Figure 1) and in Goldsboro, the plot size was 9.1 m by 4.6 m (i.e., 6 rows wide). The number of rows used per plot was chosen to minimize border effects that could influence crop responses to planting arrangements in the area where data were collected.
2.2. Treatments and Management
Each crop had four planting arrangements: (1) normal density in all rows, considered the control, (2) doubled density in all rows, (3) a sequential arrangement of normal and tripled densities (each in every other row; NTNT), and (4) normal-tripled-tripled-normal (NTTN; Figure 1; Table 1). The normal planting density was the optimum recommended for the variety and local conditions of eastern North Carolina. Per area basis, all treatments, except the normal control, doubled the recommended density, but in different spatial arrangements. This was performed to study how different planting patterns affected crop growth. The experiment was arranged as a randomized complete block design and each crop was analyzed separately.
In Rocky Mount, cotton and soybean were planted on 8 May 2019 and 4 May 2020, and maize was planted on 8 May 2019 and 3 June 2020. In Rocky Mount, in 2019, nitrogen was applied at 157 and 71 kg ha−1 in maize and cotton, respectively. In Rocky Mount in 2020, there was an increase to 208 kg ha−1 of nitrogen in maize only. In Goldsboro, cotton and soybean were planted on 9 May 2019 and 7 May 2020, and maize was planted on 9 May 2019 and 3 June 2020. Due to poor stand, maize was replanted on 3 June 2020. In Goldsboro in 2019, layby applications of nitrogen were applied at rates of 118 and 86 kg ha−1 to maize and cotton, respectively. In Goldsboro in 2020, there was an increase to 157 kg ha−1 of nitrogen in maize only. At both locations, glufosinate (Liberty 280 SL, Bayer CropScience LP, Research Triangle Park, NC, USA) was applied twice in the season at 593 g ai ha−1 on all crops in both locations for broad-spectrum weed control. The Rocky Mount location received irrigation, while the Goldsboro experiment was rainfed. All other fertilizer, weed, and pest management practices were performed using guidelines from the North Carolina State Extension Service and individual farm’s soil test analysis results.
2.3. Data Collection and Analysis
Crop population density was determined by counting emerged plants in each row, 20 days after planting (DAP). Plant thinning was performed manually when needed to ensure correct spacing between each plant and proportions among population densities (Table 1). Crop height, width, and leaf area index (LAI) using a plant canopy analyzer (LI-2200C, LI-COR Biosciences) were measured at three separate times during the season, all occurring before canopy closure. LAI was measured in order to characterize differences in plant canopy density and dynamics among planting arrangements. Measurements were taken from the two center rows to minimize border effects that could influence crop responses to planting arrangements (Figure 1). In the normal and double planting arrangements, three plants were randomly selected from each of the center two rows to be measured. In the NTNT and NTTN planting arrangements, three plants from the normal row and three plants from the triple row were taken for measurements. For height and width measurements, six observations in total were taken per plot. Width measurements were taken from directly above the apical meristem of the main stem and measuring outward toward the row middle, to the longest point from the plant. This was performed without extending the leaves of the plant to ensure that the width was representative of the area covered by the plant. Leaf area index was measured following instructions from the LAI-2200C Plant Canopy Analyzer Instruction Manual [21] and Strachan et al. [22]. A 90° view cap was used and one reading 20 cm above canopy was taken prior to in-row measurements below canopy at 5 cm from soil surface. In total, nine leaf area index measurements were taken per plot, three within each of the two center rows and three between the two center rows. Scatter corrections were then made using the FV2200 software (LI-COR Biosciences). Once the fastest growing treatment exhibited canopy closure (i.e., at least 30% overlap between the leaves of contiguous rows), six plants were collected per plot (with the same sampling method as height and width measurements) and their leaf area was measured using a leaf area meter (LI-3100C, LI-COR Biosciences) and biomass was determined after drying plants at 60 °C until a constant weight was obtained. At the end of the season, the center four rows were harvested with a cotton harvester and a grain combine for maize and soybean.
Data from high- and low-density rows for NTNT and NTTN treatments were averaged for the analysis to allow comparisons with the uniform planting treatments. Within NTNT and NTTN treatments, high- and low-density rows were compared as well. All statistical analyses were performed using SAS, version 9.4 (SAS Institute Inc., Cary, NC, USA). Treatments were considered fixed effects, and block, location, and year were considered random effects in the analysis due to lack of interactions between the location, year, and block with the treatment effects (p > 0.05). Height, width, and leaf area index were analyzed with repeated measures using PROC GLM, with days after planting as the repeated measure. Biomass, leaf area, and yield were analyzed with ANOVA using PROC GLIMMIX and Type III tests of fixed effects. Mean separation was conducted using Tukey’s honestly significant difference with p = 0.05.
3. Results and Discussion
3.1. Maize
Maize height at 43 and 62 DAP showed no differences among treatments (Table 2). However, at 83 DAP, the double, NTNT, and NTTN planting arrangements had decreases in height, ranging from 4.9% to 8.5%, compared to the normal planting density (Table 2). This could be due to the increase in intraspecific competition for nutrients, water, and light as plant density was increased [23]. The NTNT planting arrangement also had a 4.0% increase in height compared to the double planting arrangement. Maize width did not respond to planting arrangements at any measurement time (Table 2).
Conversely, maize at 43 and 62 DAP had higher leaf area index in the double, NTNT, and NTTN planting arrangements compared to the control. These increases were between 56% and 58% at 43 DAP and 25% to 33% at 62 DAP (Table 3). At 83 DAP, the leaf area index in the double density was 35% greater than the normal planting arrangement (Table 3). The number of leaves per plant produced by maize at canopy closure was not different between planting arrangements, but there was a decrease in total leaf area per plant of the double, NTNT, and NTTN planting arrangements of 30%, 26%, and 27%, respectively, compared to the normal planting density (Table 3). Previous studies have shown that LAI increases by augmenting plant density from 40,000 plants per ha−1 to 100,000 plants per ha−1, but the leaf area per plant decreased in the same range due to intraspecific competition [24].
Biomass per plant decreased by 43% and 27% in the double and NTNT planting arrangements, respectively, compared to the normal planting arrangement at canopy closure (Table 4). A previous study showed similar results in that stalk dry matter increased asymptotically with increasing plant density, up to 125,000 plants per ha−1, with any further increase in planting density reducing dry matter per plant [25]. The NTTN exhibited no differences from the control. When measuring biomass per area, however, the double, NTNT, and NTTN planting arrangements had higher biomass accumulation per area compared to the normal planting arrangement, with increases in biomass ranging from 28% to 34% (Table 4). There were no differences in grain yield among planting arrangements (Table 4).
Maize ear length, weight, and kernel count at harvest were greater in the normal planting arrangement in comparison to double and NTTN (Table 5). The lower ear weight and kernel number could be due to reductions in light interception within the canopy at higher density plantings, therefore reducing the assimilate supply, which results in abortion of kernels at the ear tip [26].
3.2. Cotton
At 83 DAP, cotton plants in the NTNT planting arrangement were 4.6% taller compared to the normal planting arrangement (Table 2). The widths of NTNT plants were 7.4% greater compared to the double planting arrangement (Table 2). Only at 43 DAP were there differences in LAI, when the double and NTNT had a 48% and 50% increase in LAI, respectively, compared to the normal planting arrangement (Table 3). The double, NTNT, and NTTN planting arrangements had decreases in leaf number and leaf area at canopy closure. Leaf number was decreased in these treatments by 24% to 37% and total leaf area per plant was decreased by 28% to 39% compared to the normal planting arrangement (Table 3). The biomass per plant did not differ among planting arrangements; however, the biomass per area was greater in the NTNT, with a 34% increase compared to the normal planting arrangement (Table 4). Interestingly, the biomass per area of the double did not differ from the normal arrangement. The higher biomass in the NTNT and NTTN planting arrangements and early season increase in LAI in the NTNT planting arrangement can result in shading and growth reductions of weeds, therefore increasing the competitiveness of cotton [27].
There were no differences in cotton fiber yield among planting arrangements (Table 4). In previous studies, higher densities of cotton with more fruiting forms did not result in proportional fiber yield increases, which could be due to lower boll retention and smaller boll sizes [28]. However, cotton grown in ultra-narrow rows (25–38 cm) had similar lint yields compared to cotton in 101 cm rows due to higher boll retention in gin turnout in the latter [29].
3.3. Soybean
From 43 DAP to 83 DAP, the double planting arrangement was taller than the normal planting arrangement, and at canopy closure, had an increase of 8% in height (Table 2). At 43 and 62 DAP, the double, NTNT, and NTTN planting arrangements were wider than the normal planting arrangement, with increases in widths ranging from 13% to 17% at 43 DAP and 7% to 9% at 62 DAP (Table 2). At 83 DAP, the width of plants in the NTNT planting arrangement were 6% greater than plants in the double planting arrangement (Table 2).
These differences in height and width could be due to increased branching (e.g., pattern and length) and intraspecific competition triggering self-shade avoidance processes [11]. There were no differences in LAI at any measurement time among planting arrangements (Table 3). At canopy closure, leaf number in the double planting arrangement was 40% and 23% lower compared to the normal and NTTN planting arrangements, respectively (Table 3). The higher number of leaves at canopy closure in the normal planting arrangement also resulted in 62% greater leaf area compared to the double planting arrangement (Table 3).
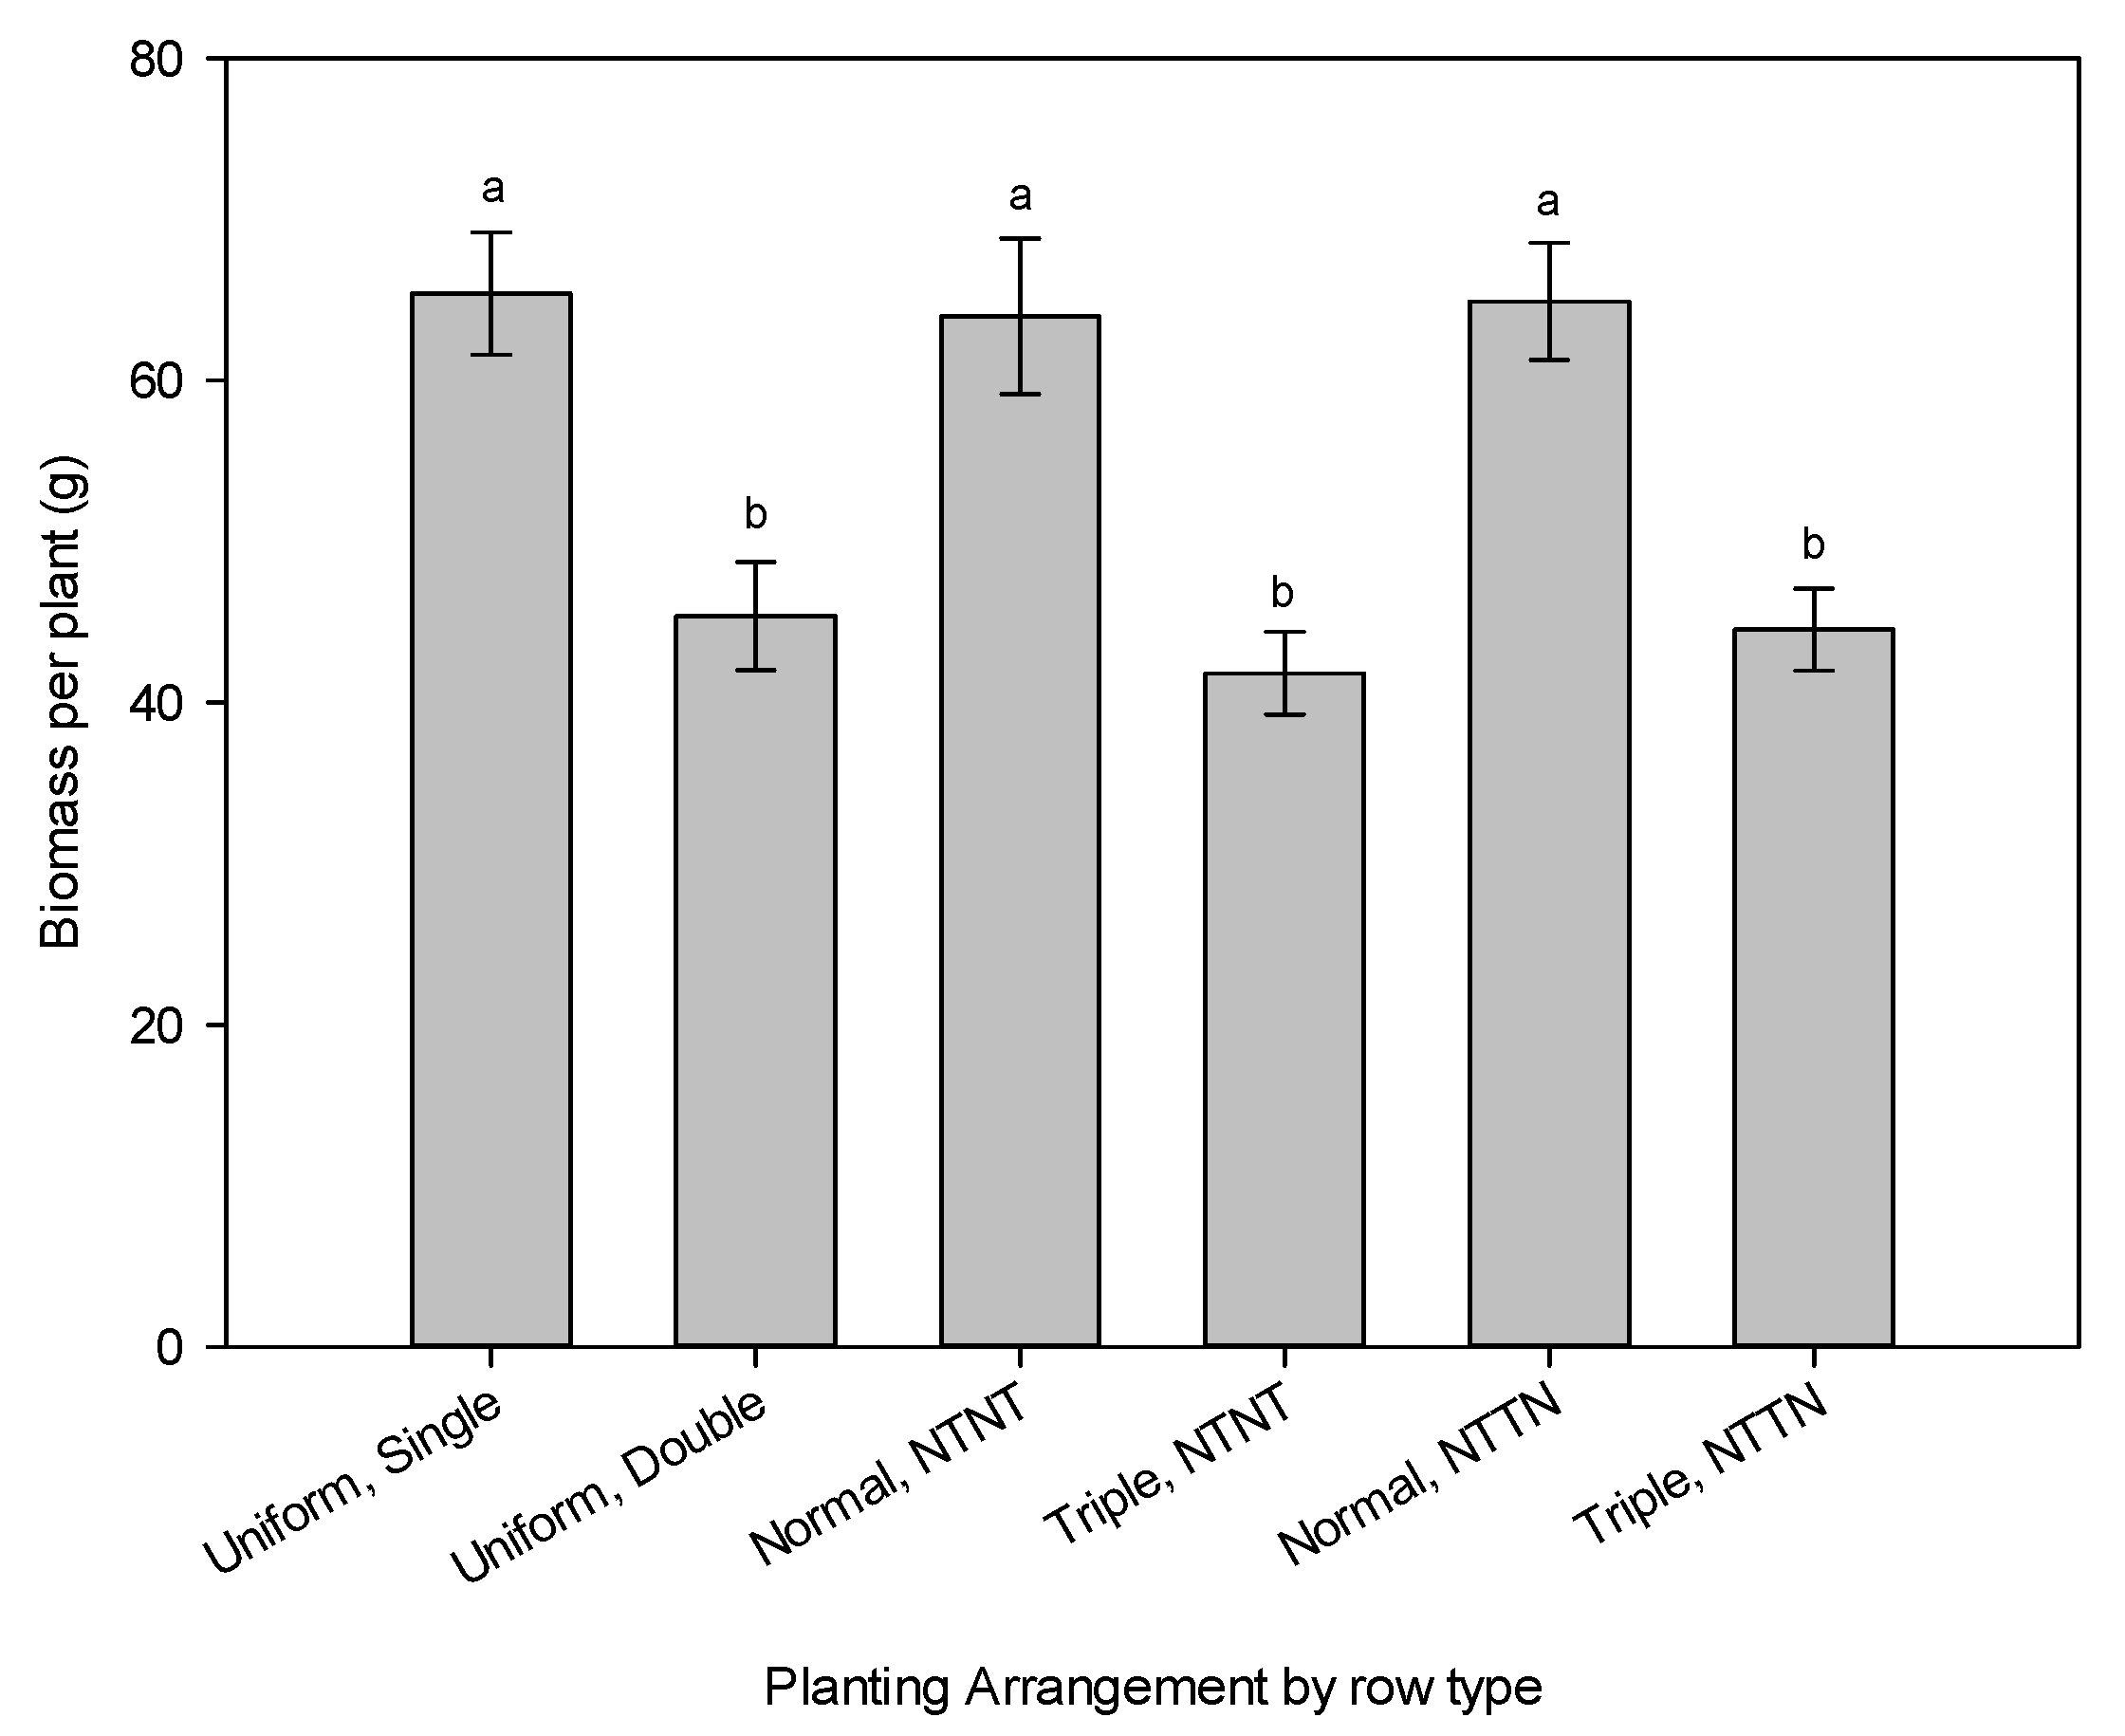
The biomass per plant was lowest in the double planting arrangement, with decreases in biomass ranging from 20% to 32% (Table 4). In the case of the biomass per area, NTNT and NTTN was 44 to 45% greater than the normal planting arrangement (Table 4). When comparing the row densities in the NTNT and NTTN planting arrangements, the triple rows showed a reduction in biomass per plant of 30 to 40% as compared to the normal-density rows (Figure 2). The triple-density rows in the NTNT and NTTN planting arrangements and the uniform double density also showed no differences in biomass per plant (Figure 2). There were no differences in yield among the planting arrangements (Table 4).
Therefore, when planting soybean at higher densities in variable patterns, as performed in the present study, there could be an opportunity for increased soil carbon accumulation and increased residual organic matter due to the increase in biomass production [30]. In addition, the use of legumes in rotation can lead to improved soil quality, which could increase the carbon sequestration potential for crop succeeding soybeans in rotation [31]. There is also an opportunity to understand how determinate or indeterminate cultivars respond to increased planting densities and patterns.
4. Conclusions
In the United States, there has been an increasing dependence on a very small number of inbred maize lines, with decreasing genetic diversity overtime [32]. In this study, the growth responses of maize and cotton to planting arrangements were non-plastic, due presumably to this intensive breeding. However, because maize, cotton, and soybean exhibited no differences in yield due to planting arrangement, there could be potential to use this strategy to reduce weed pressure as part of a robust integrated weed management program. Decreasing the time to canopy closure decreases the critical period of weed control, and thus improves weed management [33,34]. Due to this, future research should integrate multiple crop varieties to understand how planting arrangements could affect physiological aspects of these crops to increase weed control in-season.
The present study took a novel approach for planting, focusing on the use of heterogeneous crop arrangements in order to increase light availability throughout the canopy. Due to the observed non-plastic responses of the studied crops, there is not an advantage in the use of heterogeneous planting arrangements, especially to maximize yield. Therefore, we must reject our original hypotheses. Instead, it could be more beneficial and simpler to use uniform, high-density planting to obtain quick canopy closure. However, there were growth parameters that benefited from heterogeneous planting arrangements, such as the increase in soybean biomass accumulation per area. Thus, it is possible that for some crops, such as soybean, heterogeneous planting arrangements combining high- and low-density rows could be used to promote multiple ecosystem services that depend on biomass production in the agroecosystem. Finally, a critical factor that must be explored further is how to offset higher production costs associated with seed and nutrient inputs, in order to maintain economic viability when using higher planting density for quick canopy closure, weed suppression, biomass accumulation, and ecosystem services.
Author Contributions
Conceptualization, R.G.L.; methodology, S.R.E., A.M.L., W.J.E., D.L.J. and R.G.L.; formal analysis, S.R.E. and R.G.L.; investigation, S.R.E., D.L.J. and R.G.L.; resources, D.L.J. and R.G.L.; data curation, S.R.E. and R.G.L.; writing—original draft preparation, S.R.E. and R.G.L.; writing—review and editing, A.M.L., W.J.E., D.L.J. and R.G.L.; visualization, S.R.E.; supervision, R.G.L.; project administration, R.G.L.; funding acquisition, W.J.E. and R.G.L. All authors have read and agreed to the published version of the manuscript.
Funding
This research was funded by USDA-CPPM Grant 2018–70006-28933 and Hatch Project NC-02653.
Institutional Review Board Statement
Not applicable.
Informed Consent Statement
Not applicable.
Data Availability Statement
Data can be provided upon request to R.G.L. for non-commercial purposes.
Acknowledgments
We thank Theresa Reinhardt-Piskackova, Manuel Camacho, Alyssa Zsido, and Ashley Pouncey for technical support. We also thank NCDACS research stations for field experiment support.
Conflicts of Interest
The authors declare no conflict of interest.
References
- Pant, M.M. Dependence of plant yield on density and planting pattern. Ann. Bot. 1979, 44, 513–516. [Google Scholar] [CrossRef]
- Wells, R. Dynamics of soybean growth in variable planting patterns. Agronomy 1993, 85, 44–48. [Google Scholar] [CrossRef]
- Williams, W.A.; Loomis, R.S.; Duncan, W.G.; Dovrat, A.; Nunez, F. Canopy architecture at various population densities and the growth and grain yield of corn. Crop Sci. 1968, 8, 303–308. [Google Scholar] [CrossRef]
- Arce, G.D.; Pedersen, P.; Hartzler, R.G. Soybean seeding rate effects on weed management. Weed Technol. 2009, 23, 17–22. [Google Scholar] [CrossRef]
- Bednarz, C.W.; Bridges, D.C.; Brown, S.M. Analysis of cotton yield stability across population densities. Agron. J. 2005, 102, 296–302. [Google Scholar] [CrossRef]
- Boquet, D.J. Cotton in ultra-narrow row spacing: Plant density and nitrogen fertilizer rates. Agron. J. 2005, 97, 279–287. [Google Scholar] [CrossRef]
- Shapiro, C.A.; Wortmann, C.S. Corn response to nitrogen rate, row spacing, and plant density in Eastern Nebraska. Agron. J. 2006, 98, 529–535. [Google Scholar] [CrossRef] [Green Version]
- Board, J.E.; Harville, B.G. Explanations for greater light interception in narrow-vs. wide-row soybean. Crop Sci. 1992, 32, 198–202. [Google Scholar] [CrossRef]
- Reta-Sanchez, D.G.; Fowler, J.L. Canopy light environment and yield of narrow-row cotton as affected by canopy architecture. Agron. J. 2002, 94, 1317–1323. [Google Scholar] [CrossRef]
- Stewart, D.W.; Costa, C.; Dwyer, L.M.; Smith, D.L.; Hamilton, R.I.; Ma, B.L. Canopy structure, light interception, and photosynthesis in maize. Agron. J. 2003, 95, 1465–1474. [Google Scholar] [CrossRef]
- Weber, C.R.; Shibles, R.M.; Byth, D.E. Effect of plant population and row spacing on soybean development and production. Agron. J. 1966, 58, 99–102. [Google Scholar] [CrossRef]
- Johnston, T.J.; Pendleton, J.W.; Peters, D.B.; Hicks, D.R. Influence of supplemental light on apparent photosynthesis, yield, and yield components of soybean (Glycine max L.). Crop Sci. 1969, 9, 577–581. [Google Scholar] [CrossRef]
- Li, R.; Liu, P.; Dong, S.; Zhang, J.; Zhao, B. Increased maize pant population induced leaf senescence, suppressed root growth, nitrogen uptake, and grain yield. Agron. J. 2019, 111, 1581–1591. [Google Scholar] [CrossRef]
- Kremer, R.J.; Deichman, C.L. Introduction: The solar corridor concept. Agron. J. 2014, 106, 1817–1819. [Google Scholar] [CrossRef]
- Nelson, K.A. Corn yield response to the solar corridor in upstate Missouri. Agron. J. 2014, 106, 1847–1852. [Google Scholar] [CrossRef]
- Johnson, G.A.; Hoverstad, T.R.; Greenwald, R.E. Integrated weed management using narrow corn row spacing, herbicides, and cultivation. Agron. J. 1998, 90, 40–46. [Google Scholar] [CrossRef]
- Coelho, A.L.F.; Queiroz, D.M.; Valente, D.S.M.; Pinto, F.A.C. Development of a variable-rate controller for a low-cost precision planter. Appl. Eng. Agric. 2020, 36, 233–243. [Google Scholar] [CrossRef]
- Šarauskis, E.; Kazlauskas, M.; Naujokiene, V.; Bruciene, I.; Steponavicius, D.; Romaneckas, K.; Jasinskas, A. Variable Rate Seeding in Precision Agriculture: Recent Advances and Future Perspectives. Agriculture 2022, 12, 305. [Google Scholar] [CrossRef]
- Buhler, D.D.; Hartzler, R.G.; Forcella, F. Implications of weed seedbank dynamics to weed management. Weed Sci. 1997, 45, 329–336. [Google Scholar] [CrossRef]
- Norris, R.F. Ecological implications of using thresholds for weed management. J. Crop Prod. 1999, 2, 31–58. [Google Scholar] [CrossRef]
- LI-COR Biosciences. LI-COR Biosciences LAI-2200C Plant Canopy Analyzer Instruction Manual; LI-COR Biosciences: Lincoln, NE, USA, 2019. [Google Scholar]
- Strachan, I.B.; Stewart, D.W.; Pattey, E. Determination of leaf area index in agricultural systems. Micrometeorol. Agric. Syst. 2005, 47, 179–198. [Google Scholar]
- Tetio-Kagho, F.; Gardner, F.P. Responses of maize to plant population density. I. Canopy development, light relationships and vegetative growth. Agron. J. 1988, 80, 930–935. [Google Scholar] [CrossRef]
- Tollenaar, M.; Dibo, A.A.; Aguilera, A.; Weise, S.F.; Swanton, C.J. Effect of crop density on weed interference in maize. Agron. J. 1994, 86, 591–595. [Google Scholar] [CrossRef]
- Tetio-Kagho, F.; Gardner, F.P. Responses of maize to plant population density II. Reproductive development, yield and yield adjustments. Agron. J. 1988, 80, 935–940. [Google Scholar] [CrossRef]
- Hashemi-Dezfouli, A.; Herbert, S.J. Intensifying plant density response of corn with artificial shade. Agron. J. 1992, 84, 547–551. [Google Scholar] [CrossRef]
- Street, J.E.; Buchanan, G.A.; Crowly, R.H.; McGuire, J.A. Influence of cotton (Gossypium hirsutum) densities on competitiveness of pigweed (Amaranthus spp.) and sicklepod (Cassia obtusifolia). Weed Sci. 1981, 29, 253–256. [Google Scholar] [CrossRef]
- Galanopoulou-Sendouka, S.; Sficas, A.G.; Fotiadis, N.A.; Gagianas, A.A.; Gerakis, P.A. Effect of population density, planting date and genotype on plant growth and development of cotton. Agron. J. 1980, 72, 347–353. [Google Scholar] [CrossRef]
- Nichols, S.P.; Snipes, C.E.; Jones, M.A. Cotton growth, lint yield, and fiber quality as affected by row spacing and cultivar. J. Cotton Sci. 2004, 8, 1–12. [Google Scholar]
- Reicosky, D.C.; Kemper, W.D.; Langdale, G.W.; Douglas, C.L.; Rasmusssen, R.E. Soil organic matter changes resulting from tillage and biomass production. J. Soil Water Conserv. 1995, 50, 253–261. [Google Scholar]
- Nair, R.; Mehta, C.R.; Sharma, S. Carbon sequestration in soils—A review. Agric. Rev. 2015, 36, 81–99. [Google Scholar] [CrossRef]
- Troyer, A.F.; Openshaw, S.J.; Knittle, K.H. Measurement of genetic diversity among popular commercial corn hybrids. Crop Sci. 1988, 28, 481–485. [Google Scholar] [CrossRef]
- Teasdale, J.R. Influence of narrow row/high population corn (Zea mays) on weed control and light transmittance. Weed Technol. 1995, 9, 113–118. [Google Scholar] [CrossRef]
- Yelverton, F.H.; Coble, H.D. Narrow row spacing and canopy formation reduces weed resurgence in soybean (Glycine max). Weed Technol. 1991, 5, 169–174. [Google Scholar] [CrossRef]
Figure 1.
Visual representation of crop densities, sampling area, and plot size for each planting arrangement for maize, cotton, and soybean. Within the rows, green circles represent the normal planting density, yellow circles represent doubled planting density, and red circles represent tripled planting density. Each crop had four planting arrangements on eight, evenly spaced rows shown as followed: (a) normal density in all rows, considered the control, (b) doubled density in all rows, (c) a sequential arrangement of normal and tripled densities, and (d) normal-tripled-tripled-normal. Dark squares located in the center of each plot are the locations in which samples were taken for data collection to prevent a border effect. Plot sizes are for the Rocky Mount location.

Figure 2.
Biomass per plant of soybean grown in rows with normal (N), doubled, and (tripled) in either uniform, NTNT, or NTTN planting arrangements. Bars with different letters indicate significant differences at p < 0.05. Error bars indicate the standard error of the mean.
Figure 2.
Biomass per plant of soybean grown in rows with normal (N), doubled, and (tripled) in either uniform, NTNT, or NTTN planting arrangements. Bars with different letters indicate significant differences at p < 0.05. Error bars indicate the standard error of the mean.


Table 1.
Crop densities for each planting arrangement for maize, cotton, and soybean in Rocky Mount and Goldsboro, NC, for the 2019 and 2020 summer seasons.
Table 1.
Crop densities for each planting arrangement for maize, cotton, and soybean in Rocky Mount and Goldsboro, NC, for the 2019 and 2020 summer seasons.
| Location | Crop | Density | Seeding Rate | Population Density |
|---|---|---|---|---|
| Seeds ha−1 | Plants ha−1 | |||
| Rocky Mount | Maize | normal | 63,000 | 53,800 |
| doubled | 124,200 | 107,600 | ||
| tripled | 188,400 | 161,500 | ||
| Cotton | normal | 99,400 | 71,800 | |
| doubled | 205,000 | 143,500 | ||
| tripled | 297,300 | 215,300 | ||
| Soybean | normal | 210,700 | 143,500 | |
| doubled | 430,600 | 287,000 | ||
| tripled | 627,900 | 430,600 | ||
| Goldsboro | Maize | normal | 53,800 | 43,000 |
| doubled | 105,000 | 86,100 | ||
| tripled | 159,200 | 129,200 | ||
| Cotton | normal | 99,100 | 86,100 | |
| doubled | 198,200 | 172,200 | ||
| tripled | 296,500 | 258,300 | ||
| Soybean | normal | 217,900 | 172,200 | |
| doubled | 418,400 | 344,400 | ||
| tripled | 634,00 | 516,700 |
Table 2.
Height and width for maize, cotton, and soybean for each planting arrangement. NTNT: a sequential arrangement of normal and tripled densities (each in every other row), and NTTN: normal-tripled-tripled-normal planting density. Means and standard error of the means followed by a different letter indicate significant differences at p < 0.05.
| Crop | Planting Arrangement | Height | Height | Height | Width | Width | Width |
|---|---|---|---|---|---|---|---|
| 43 DAP | 62 DAP | 83 DAP | 43 DAP | 62 DAP | 83 DAP | ||
| ___________________cm___________________ | ___________________cm___________________ | ||||||
| Maize | Normal | 51 ± 3 a | 146 ± 5 a | 200 ± 3 a | 29 ± 1 a | 51 ± 1 a | 54 ± 1 a |
| Double | 52 ± 3 a | 141 ± 4 a | 183 ± 3 c | 29 ± 1 a | 50 ± 1 a | 53 ± 0.8 a | |
| NTNT | 52 ± 3 a | 145 ± 4 a | 190 ± 2 b | 29 ± 1 a | 50 ± 1 a | 53 ± 0.8 a | |
| NTTN | 51 ± 3 a | 149 ± 4 a | 190 ± 3 bc | 30 ± 1 a | 52 ± 1 a | 54 ± 0.9 a | |
| Cotton | Normal | 18 ± 0.4 b | 47 ± 1 b | 81 ± 1 b | 9 ± 0.3 b | 21 ± 0.6 a | 30 ± 0.6 ab |
| Double | 21 ± 0.5 a | 49 ± 1 ab | 80 ± 1 b | 10 ± 0.3 ab | 22 ± 0.5 a | 29 ± 0.6 b | |
| NTNT | 22 ± 0.5 a | 50 ± 1 a | 85 ± 1 a | 10 ± 0.3 ab | 21 ± 0.5 a | 32 ± 0.7 a | |
| NTTN | 21 ± 0.5 a | 49 ± 0.9 ab | 78 ± 1 b | 11 ± 0.3 a | 21 ± 0.5 a | 30 ± 0.6 ab | |
| Soybean | Normal | 24 ± 0.5 b | 49 ± 0.8 b | 77 ± 2 b | 12 ± 0.4 b | 26 ± 0.3 b | 34 ± 0.7 ab |
| Double | 28 ± 2 a | 54 ± 1 a | 83 ± 2 a | 13 ± 0.4 a | 28 ± 0.4 a | 33 ± 0.5 b | |
| NTNT | 26 ± 0.6 ab | 53 ± 0.9 a | 82 ± 2 ab | 13 ± 0.5 a | 28 ± 0.4 a | 35 ± 0.4 a | |
| NTTN | 25 ± 0.6 ab | 52 ± 1 a | 80 ± 2 ab | 14 ± 0.8 a | 28 ± 0.5 a | 34 ± 0.5 ab | |
Table 3.
Leaf number, leaf area, and leaf area index measurements for maize, cotton, and soybean for each planting arrangement. NTNT: a sequential arrangement of normal and tripled densities (each in every other row), and NTTN: normal-tripled-tripled-normal. Means and standard error of the means followed by a different letter indicate significant differences at p < 0.05.
| Crop | Planting Arrangement | Leaf Number | Leaf Area | Leaf Area Index | Leaf Area Index | Leaf Area Index |
|---|---|---|---|---|---|---|
| 43 DAP | 62 DAP | 83 DAP | ||||
| cm2 | m2 m−2 | m2 m−2 | m2 m−2 | |||
| Maize | Normal | 11.0 ± 0.3 a | 3714 ± 278 a | 0.20 ± 0.06 b | 1.80 ± 0.16 b | 2.90 ± 0.18 b |
| Double | 10.0 ± 0.4 a | 2857 ± 190 b | 0.60 ± 0.07 a | 2.70 ± 0.15 a | 3.90 ± 0.20 a | |
| NTNT | 10.0 ± 0.3 a | 2951 ± 197 b | 0.50 ± 0.06 a | 2.50 ± 0.15 a | 3.50 ± 0.20 ab | |
| NTTN | 10.0 ± 0.3 a | 2915 ± 191 b | 0.50 ± 0.06 a | 2.40 ± 0.15 a | 3.60 ± 0.23 ab | |
| Cotton | Normal | 62 ± 17 a | 2465 ± 234 a | 0.80 ± 0.06 b | 2.40 ± 0.12 a | 3.80 ± 0.32 a |
| Double | 39 ± 16 b | 1497 ± 199 b | 1.20 ± 0.07 a | 2.80 ± 0.15 a | 4.10 ± 0.23 a | |
| NTNT | 47 ± 13 b | 1760 ± 144 b | 1.20 ± 0.07 a | 2.70 ± 0.15 a | 4.30 ± 0.29 a | |
| NTTN | 43 ± 14 b | 1697 ± 178 b | 1.10 ± 0.06 ab | 2.50 ± 0.12 a | 3.90 ± 0.29 a | |
| Soybean | Normal | 45 ± 2 a | 2793 ± 265 a | 1.50 ± 0.09 a | 3.40 ± 0.13 a | 5.00 ± 0.32 a |
| Double | 27 ± 3 c | 1719 ± 237 b | 1.90 ± 0.09 a | 3.20 ± 0.15 a | 5.50 ± 0.31 a | |
| NTNT | 32 ± 4 bc | 2241 ± 362 ab | 1.70 ± 0.09 a | 3.10 ± 0.12 a | 5.20 ± 0.26 a | |
| NTTN | 35 ± 2 b | 2536 ± 248 ab | 1.70 ± 0.07 a | 3.10 ± 0.12 a | 5.10 ± 0.35 a |
Table 4.
Yield and biomass measurements for maize, cotton, and soybean for each planting arrangement. NTNT: a sequential arrangement of normal and tripled densities (each in every other row), and NTTN: normal-tripled-tripled-normal. Means and standard error of the means followed by a different letter indicate significant differences at p < 0.05.
| Crop | Planting Arrangement | Biomass per Plant | Biomass per Area | Yield * |
|---|---|---|---|---|
| g | kg ha−1 | kg ha−1 | ||
| Maize | Normal | 151 ± 16 a | 8600 ± 837 b | 4525 ± 517 a |
| Double | 105 ± 11 b | 11,981 ± 1114 a | 4019 ± 467 a | |
| NTNT | 119 ± 8 b | 12,663 ± 910 a | 4078 ± 580 a | |
| NTTN | 124 ± 10 ab | 13,083 ± 1019 a | 3825 ± 508 a | |
| Cotton | Normal | 103 ± 11 a | 8190 ± 954 b | 2792 ± 192 a |
| Double | 70 ± 6 a | 10,759 ± 462 ab | 2860 ± 202 a | |
| NTNT | 84 ± 7 a | 12,424 ± 1196 a | 3007 ± 211 a | |
| NTTN | 81 ± 6 a | 11,825 ± 1008 ab | 2749 ± 193 a | |
| Soybean | Normal | 63 ± 4 a | 10,686 ± 623 b | 4180 ± 264 a |
| Double | 43 ± 5 b | 12,833 ± 1287 ab | 4184 ± 260 a | |
| NTNT | 55 ± 4 a | 15,460 ± 1103 a | 4524 ± 274 a | |
| NTTN | 54 ± 4 a | 15,372 ± 967 a | 4162 ± 207 a |
* Yield refers to maize grain, soybean seed, and cotton fiber.
Table 5.
Maize ear length, ear weight, and kernel count measurements for each planting arrangement. NTNT: a sequential arrangement of normal and tripled densities (each in every other row), and NTTN: normal-tripled-tripled-normal. Means and standard error of the means followed by a different letter indicate significant differences at p < 0.05.
| Crop | Planting Arrangement | Maize Ear Length | Maize Ear Weight | Maize Kernel Count per Ear |
|---|---|---|---|---|
| cm | g | |||
| Maize | Normal | 17.0 ± 0.4 a | 168 ± 10 a | 442 ± 33 a |
| Double | 14.0 ± 0.5 b | 119 ± 9 b | 308 ± 31 b | |
| NTNT | 15.0 ± 0.4 ab | 137 ± 8 ab | 371 ± 27 ab | |
| NTTN | 14.0 ± 0.5 b | 131 ± 8 b | 338 ± 26 b |
Publisher’s Note: MDPI stays neutral with regard to jurisdictional claims in published maps and institutional affiliations. |
© 2022 by the authors. Licensee MDPI, Basel, Switzerland. This article is an open access article distributed under the terms and conditions of the Creative Commons Attribution (CC BY) license (https://creativecommons.org/licenses/by/4.0/).
Share and Cite
MDPI and ACS Style
Ethridge, S.R.; Locke, A.M.; Everman, W.J.; Jordan, D.L.; Leon, R.G. Response of Maize, Cotton, and Soybean to Increased Crop Density in Heterogeneous Planting Arrangements. Agronomy 2022, 12, 1238. https://doi.org/10.3390/agronomy12051238
AMA Style
Ethridge SR, Locke AM, Everman WJ, Jordan DL, Leon RG. Response of Maize, Cotton, and Soybean to Increased Crop Density in Heterogeneous Planting Arrangements. Agronomy. 2022; 12(5):1238. https://doi.org/10.3390/agronomy12051238
Chicago/Turabian StyleEthridge, Sandra R., Anna M. Locke, Wesley J. Everman, David L. Jordan, and Ramon G. Leon. 2022. "Response of Maize, Cotton, and Soybean to Increased Crop Density in Heterogeneous Planting Arrangements" Agronomy 12, no. 5: 1238. https://doi.org/10.3390/agronomy12051238
Note that from the first issue of 2016, this journal uses article numbers instead of page numbers. See further details here.