Article

Impact of Olive Trees on the Microclimatic and Edaphic Environment of the Understorey Durum Wheat in an Alley Orchard of the Mediterranean Area

1
Department of Agronomy, Food, Natural Resources, Animals and the Environment, University of Padova, Viale dell’Università 16, 35020 Padova, Italy
2
INRAE, Diascope Unit, UE0398, INRA, Domaine de Melgueil, 34130 Montpellier, France
3
LEPSE, INRAE, Montpellier SupAgro, University of Montpellier, 34060 Montpellier, France
4
Tropical and Mediterranean Symbioses Laboratory (LSTM), University of Montpellier II SupAgro, UMR 113 CIRAD, IRD. TA10J, 34398 Montpellier, France
*
Author to whom correspondence should be addressed.
Agronomy 2022, 12(2), 527; https://doi.org/10.3390/agronomy12020527
Submission received: 31 January 2022 / Revised: 17 February 2022 / Accepted: 18 February 2022 / Published: 20 February 2022

Abstract

:
In the current context of climate change, the impact of trees in agroforestry systems is expected to mitigate water and heat stresses, particularly in semi-arid environments. Within this framework, in a two-year trial conducted at INRAE in Southern France, the dynamics of microclimatic parameters and the edaphic environment of durum wheat were investigated under a yearly-pruned (AF) and a never-pruned (AF+) 6-m apart alley olive orchard, in comparison with controls under full sun. Here it was recorded a reduction of photosynthetic active radiation (PAR) by 30% and 51% in AF and AF+, respectively, during the wheat cycle, together with a marked reduction of wind speed compared to controls (–85% in AF and −99% in AF+). A significant buffer effect was also highlighted for air temperature, averagely +1.7 °C during the night and −3.2 °C during the daytime under the moderate shading of AF. The positive effect of trees on soil water conservation increased with the intensity of shading, particularly during the critical wheat stage of grain filling, with benefits on wheat root mycorrhization, and NH4+ and NO3 abundance in the arable layer. Despite some of the environmental modifications being favorable for the understorey wheat, these were not translated into yield improvements, suggesting that the severe shading associated with the small inter-row and evergreen trees has a prevailing effect, that requires to be managed through appropriate tree pruning.

1. Introduction

Olive trees, grown in rows or as scattered trees, have been intercropped with cereals such as wheat for centuries in the Mediterranean area [1]. As a consequence of agricultural intensification, these traditional agroforestry systems have no longer been implemented in the last decades in a large part of this area. However, a renewed interest in olive alley-cropping is currently emerging with the aim to improve the sustainability of both olive orchards and wheat cultivation. Indeed, among 9.5 million hectares of olive groves distributed across the Mediterranean area, a large part concerns ancient orchards with low productivity and a high risk of abandonment [2]. Besides, there is an increasing need to improve the resilience of wheat to climate change, while providing ecosystem services in agreement with the requirements of the European Agricultural Policy. This is particularly relevant in the Mediterranean area, which has been identified as one of the most prominent “Hot-Spots” in future climate change projections [3,4], consisting of a marked decrease in precipitations, particularly during summer [5,6], associated with greater occurrence of spring/summer heat and drought stresses. The inter-annual weather variability is also expected to increase [7,8,9], while warming will enhance evapotranspiration and the potential incidence and severity of drought [10]. The negative impact of climate change on crop production has already been documented [11,12,13]. The increase of evapotranspiration and crop water requirements modify plant phenology [14,15], resulting in reduced yield and quality. Indeed, under heat/drought stress the growing cycle of wheat is shortened, and the onset of the senescence process is anticipated, in this way compromising the grain filling process and yield [16,17,18].
Agroforestry systems have a high potential to provide ecosystem services related to microclimate buffering by reducing water evapotranspiration and preserving soil moisture through shading, windbreak, controlling soil erosion, and increasing soil fertility [19,20,21,22,23]. Up to date, the multiple ecosystem services provided by agroforestry have been associated with improvements in crop growth and yield mainly in tropical and subtropical regions [20,24,25,26,27]. Agroforestry farming is reported as an opportunity, notably in South America [28,29,30] and Africa [31,32,33,34], for its high potential to address various on-farm adaptation needs [35,36,37]. Alley-cropping systems involving legume trees in the tropics are reported to enhance crop resilience to climate change [32,36,38]. For instance, the widespread systems including white leadtree (Leucaena leucocephala (Lam.) de Wit) and apple-ring acacia (Faidherbia albida (Delile) A. Chev.) trees intercropped with sorghum, cowpea or coffee, demonstrated to enhance soil carbon sequestration and crop productivity, thanks to the increase of soil mineral nutrients and the buffer effect on temperature [32,39,40,41,42]. A large number of experimental studies also documented the positive effects of shading by trees on cocoa cultivation, through the enhancement of soil fertility and water conservation [37,43,44,45,46].
In temperate regions, despite some experimental evidence summarized by Fagerholm et al. [47] and Torralba et al. [19], there is a need to better quantify the role of agroforestry practices in ecosystem services delivery. This is particularly relevant in the Mediterranean area, where the risk of yield losses associated with climate issues is increasing and therefore the impact of trees on the microclimatic and edaphic environment might be beneficial for understorey crops.
In this study, durum wheat was intercropped for two years in the alleys of an olive orchard subjected to different levels of pruning in southern France, in a site where the productivity of this olive orchard and the yield and quality of wheat have already been investigated [48,49].
In this paper, the microclimatic parameters and the edaphic environment available for durum wheat were compared among three experimental conditions (treatments): (i) in wheat monoculture without trees; (ii) in alley-cropping with olive trees under severe shading within a never-pruned olive orchard, mimicking abandoned orchards; (iii) and in alley-cropping within a yearly pruned olive orchard. The purpose was to evaluate the potential role of olive trees to provide environmental ecosystem services and ensure higher resilience to climate change compared to wheat monoculture, by assessing (i) the impact of trees on microclimatic parameters and edaphic environment and (ii) the effect of the different experimental conditions on durum wheat growth and yield.

2. Materials and Methods

2.1. Study Site

The experiments were carried out at the French National Research Institute for Agriculture, Food and the Environment (INRAE) experimental DiaScope unit at Mauguio–Montpellier in the south of France (43°35′ N, 3°45′ E; 12 m a.s.l.; flatland) for two years from 2015 to 2017. Based on historical data (30 years), the site has a sub-humid Mediterranean climate, with a yearly average temperature of ~15 °C, and a maximum daily temperature that increased from 34 °C at the end of the last century up to 38 °C in 2017. The sunshine duration at the site is one of the highest in France, i.e., 7 h 22 min per day as annual average vs. the French average of 4 h 46 min. The historical average annual precipitation is about 750 mm with high heterogeneity in the rainfall pattern across years. The number of rainy days is relatively low, i.e., <60 per year (Table S1).

2.2. Experimental Design

Durum wheat (Triticum durum Desf.) was sown in mid-November of each year in three experimental conditions (treatments; Figure S1): two olive orchards, one never pruned (named “AF+”) and one yearly pruned (named “AF”), in comparison with open-field controls (without trees, named “C”) under organic management. Twenty-five durum wheat genotypes were cultivated in the olive alleys, following local sowing and harvest recommended dates (Table S1). The trial was arranged as a randomized block design with three replicates per treatment by cultivating wheat in annual rotation with legume crops, i.e., chickpea and fababean according to the year. Here only the data concerning the plots of one wheat genotype, hosting the sensors and tools for measuring microclimatic and edaphic parameters, are presented.
In the AF treatment (Figure S1d), the olive trees were yearly pruned from 2012. The orchard was planted in 2002 and consisted of 8 rows (6 × 6 m apart) in a 0.5-ha area, with two plots lines of wheat hosted in the inter-row (Figure S1d). Olive trees belong to the Picholine clone, with tree rows oriented along the main axis NW-SE.
The AF+ treatment was implemented in an olive grove that was planted in 2002 as well, with the same planting design and row orientation as in AF, located close to AF treatment (20 m to the west; Figure S1c). In this orchard, the olive trees were clones of the Arbequine x Oliviere crossing and had never been pruned. As a consequence, the canopy size was larger than in AF, and only one plots line was sown in each olive inter-row.
In each year, the control treatment without trees was set up close to AF and AF+ under full sun conditions.

2.3. Microclimate Parameters

A Meteo-France weather station located at the INRAE station, 100 m from the experimental fields, provided daily air temperature, air humidity, rainfall, global radiation and PAR (photosynthetic active radiation) and wind speed, from the beginning of the trial (2015). Additional sensors (Table S2) were placed in the experimental area (in the center of the alley) hosting the three treatments (control, AF, and AF+). To avoid any possible interaction of wheat genotype, all the sensors were placed in the plots of the same genotype (i.e., cv 1). Except for wind speed, air temperature and relative humidity, which were recorded in 2016–17 only, all the other microclimate parameters were recorded both in 2015–16 and 2016–17 growing seasons. During April 2017 (2nd year), PAR availability in AF treatment was also measured at different distances from the tree line, i.e., at +1 m and +3 m (center of the alley).

2.4. Edaphic Parameters

Sensors for measuring soil moisture were placed in the plots of cv 1, close to the sensors for microclimate parameters, at four different depths, i.e., 30, 60, 90, 110 cm, as described in Table S2.
A number of 13 geo-referenced soil samples were also collected in the three treatments in February 2016 and 2017, at 0–30, 30–60 and 60–90 cm depth. The total amount of nitrogen (N), nitrate (NO3) and ammonium (NH4+) were determined following the Dumas dry-combustion method.
The mycorrhizal analysis was carried out in 2016–17 on the roots of 6 durum wheat varieties, 3 modern and 3 old varieties, chosen to represent the genetic diversity of the 25 investigated wheat genotypes. At BBCH 50 (heading stage), in each treatment (C, AF and AF+) and for the 6 varieties, all the plants over a rectangular sampling area at the center of the plot (2 wheat rows × 40 cm of length) were collected. All the plants on the sampling area and the soil attached to roots (until 30 cm of depth) were collected in plastic bags and stored at −4 °C. Mycorrhizal analyses were carried out at the Tropical and Mediterranean Symbioses Laboratory (LSTM- CIRAD Baillarguet, France). Plant roots of each sample were cleaned from soil particles, and 3 replicates of 90 root fragments (1-cm long), collected from the central part of the root length, were analyzed in each variety and treatment. Root fragments were stained, observed under a microscope (Provis, Olympus), and rated according to a range of classes as described by the MO–M–C–04 protocol, according to Delteil et al. [50]. Data were processed through Mycocalc software [51], which provided the following parameters: (i) rate of root length with internal mycorrhizal structures (vesicles or hyphae) (ii) intensity of mycorrhizal colonization in root fragments, and (iii) abundance of arbuscules in the mycorrhizal parts of root fragments.

2.5. Yield Components

Three days before harvest, plants of a sampling area (two wheat rows × 40 cm of length) were sampled in each plot for counting the number of plants, and tillers and spikes per plant, and that of grains per spike. After oven-drying (80 °C for 48 h), the shoot biomass (dry weight) was also determined. Harvest took place from 30 June to 6 July according to the considered year (Table S1), using a mini-combine harvester. The grains of each plot were weighed and subjected to humidity determination. For each replicate/treatment, 3 samples were used for calculating the thousand-grain weight (TGW). Here the data of cv 1 only are presented, where all the sensors were placed.

2.6. Statistical Analysis

Data on microclimatic and edaphic parameters, wheat yield and mycorrhizal colonization, measured in C, AF and AF+ treatments, were subjected to ANOVA using R studio software ver. 2.7 [RStudio Public Benefit Corporation (PBC), Boston, MA, USA]. Separation of means was set at p ≤ 0.05 with the Tukey’s HSD test. Hourly data of air temperature and relative humidity from wheat sowing to harvest, in C and AF treatments, were classified as “day” or “night”, according to the sunset and sunrise times of each day, thanks to the R package “RAtmosphere”.

3. Results

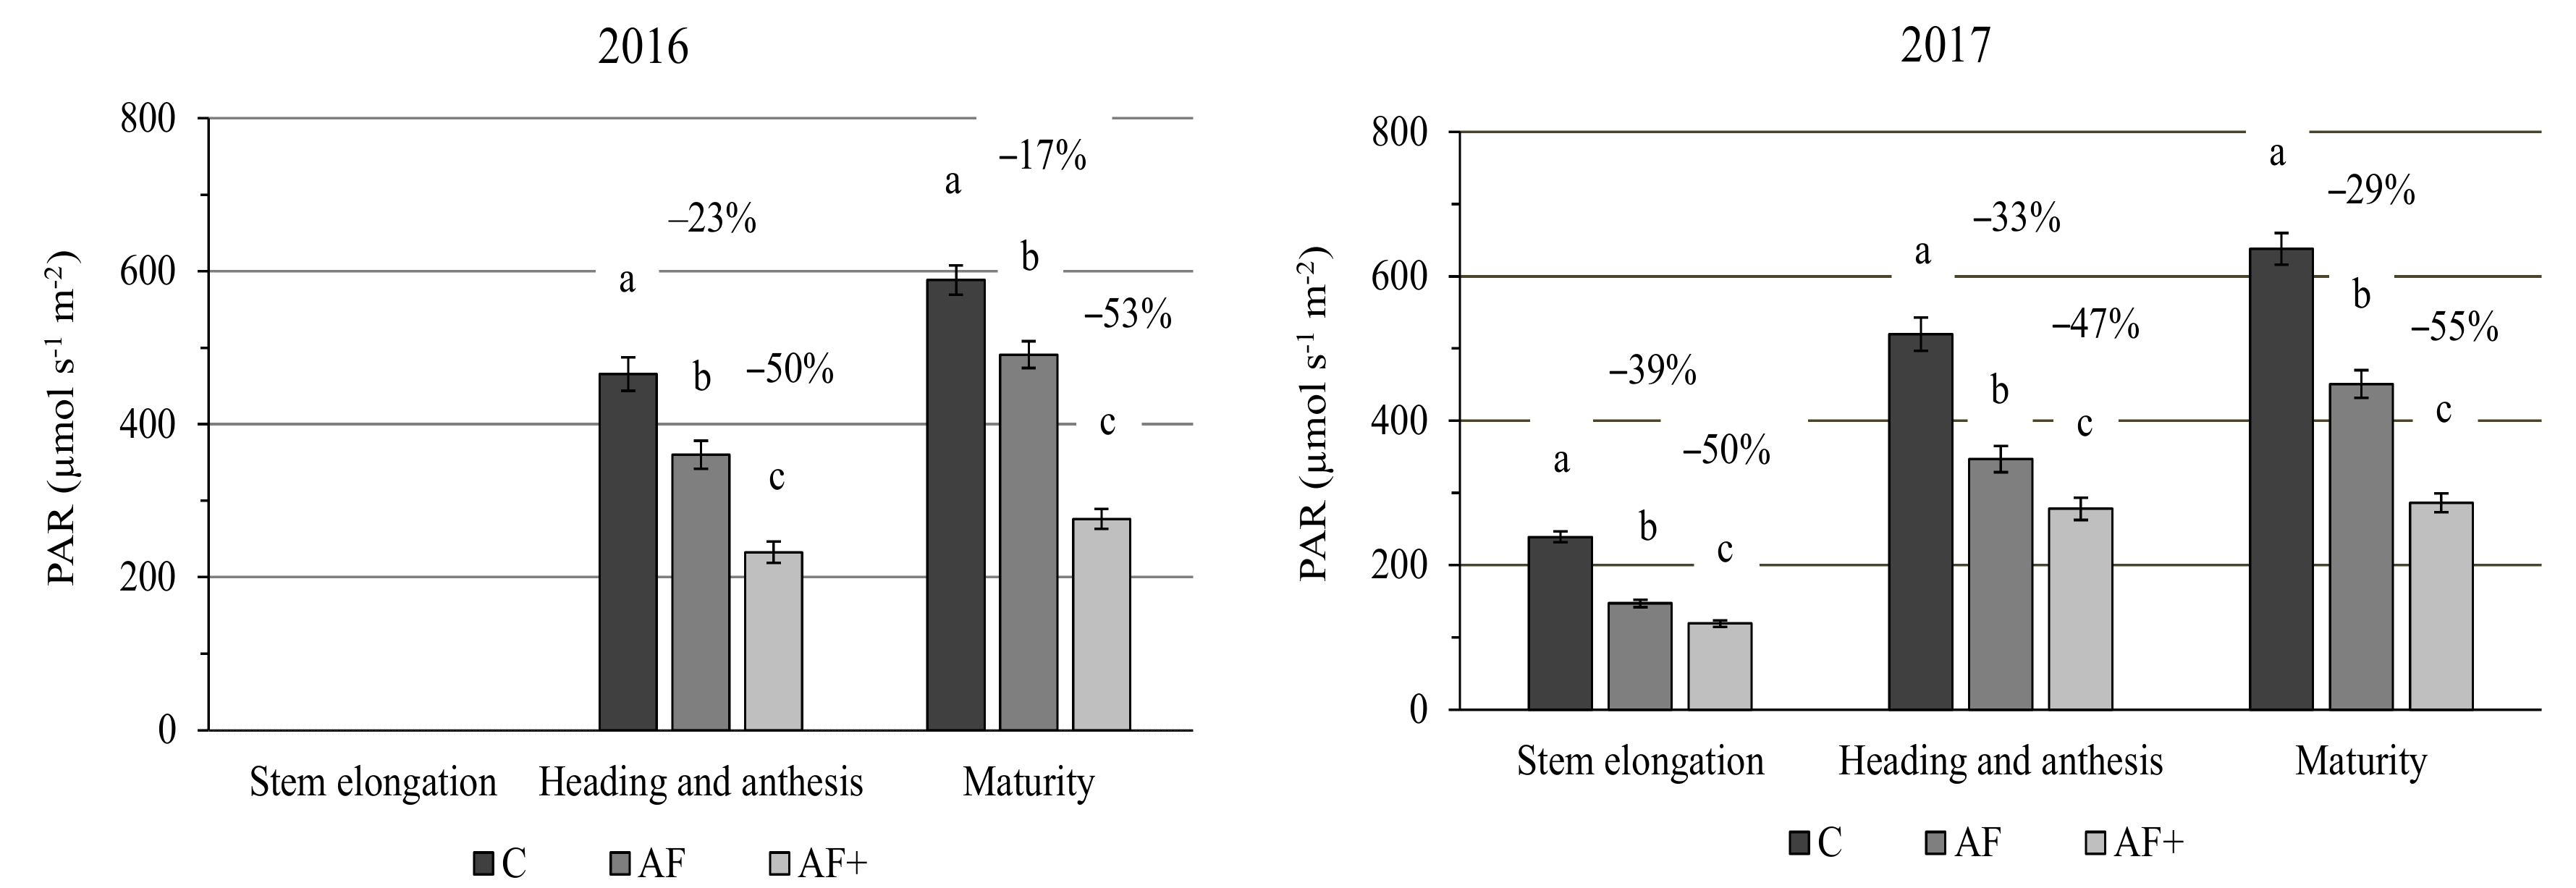
3.1. Solar Radiation

The photosynthetic active radiation (PAR) reaching the wheat canopy under full sun conditions (control treatment) was 380 µmol s−1 m−2 as the average of the whole growing cycle. As compared to this value, PAR was reduced by 30% in AF and by 51% in AF+ (two-year average).
Within the moderate shade treatment (AF), the difference in PAR availability vs. the control treatment decreased during the wheat cycle, i.e., from −39% during stem elongation to −23% during grain filling (maturity), as two-year average. At the same time, the reduction of PAR in the severe shading treatment (AF+) in comparison with the open field showed small variations across the wheat cycle, ranging from −47% during heading and anthesis to −55% at maturity in 2017 (Figure 1).
As regards the distance from the tree line, significant differences were observed in PAR levels at the center of the alley (+3 m from olives trunk) and at the wheat plot boundaries (1 m from the tree line) in AF treatment. During heading and anthesis in 2017, PAR was averagely reduced by 33% in the middle of the alley and by 78% at +1 m from the tree line, as compared to full sun conditions.

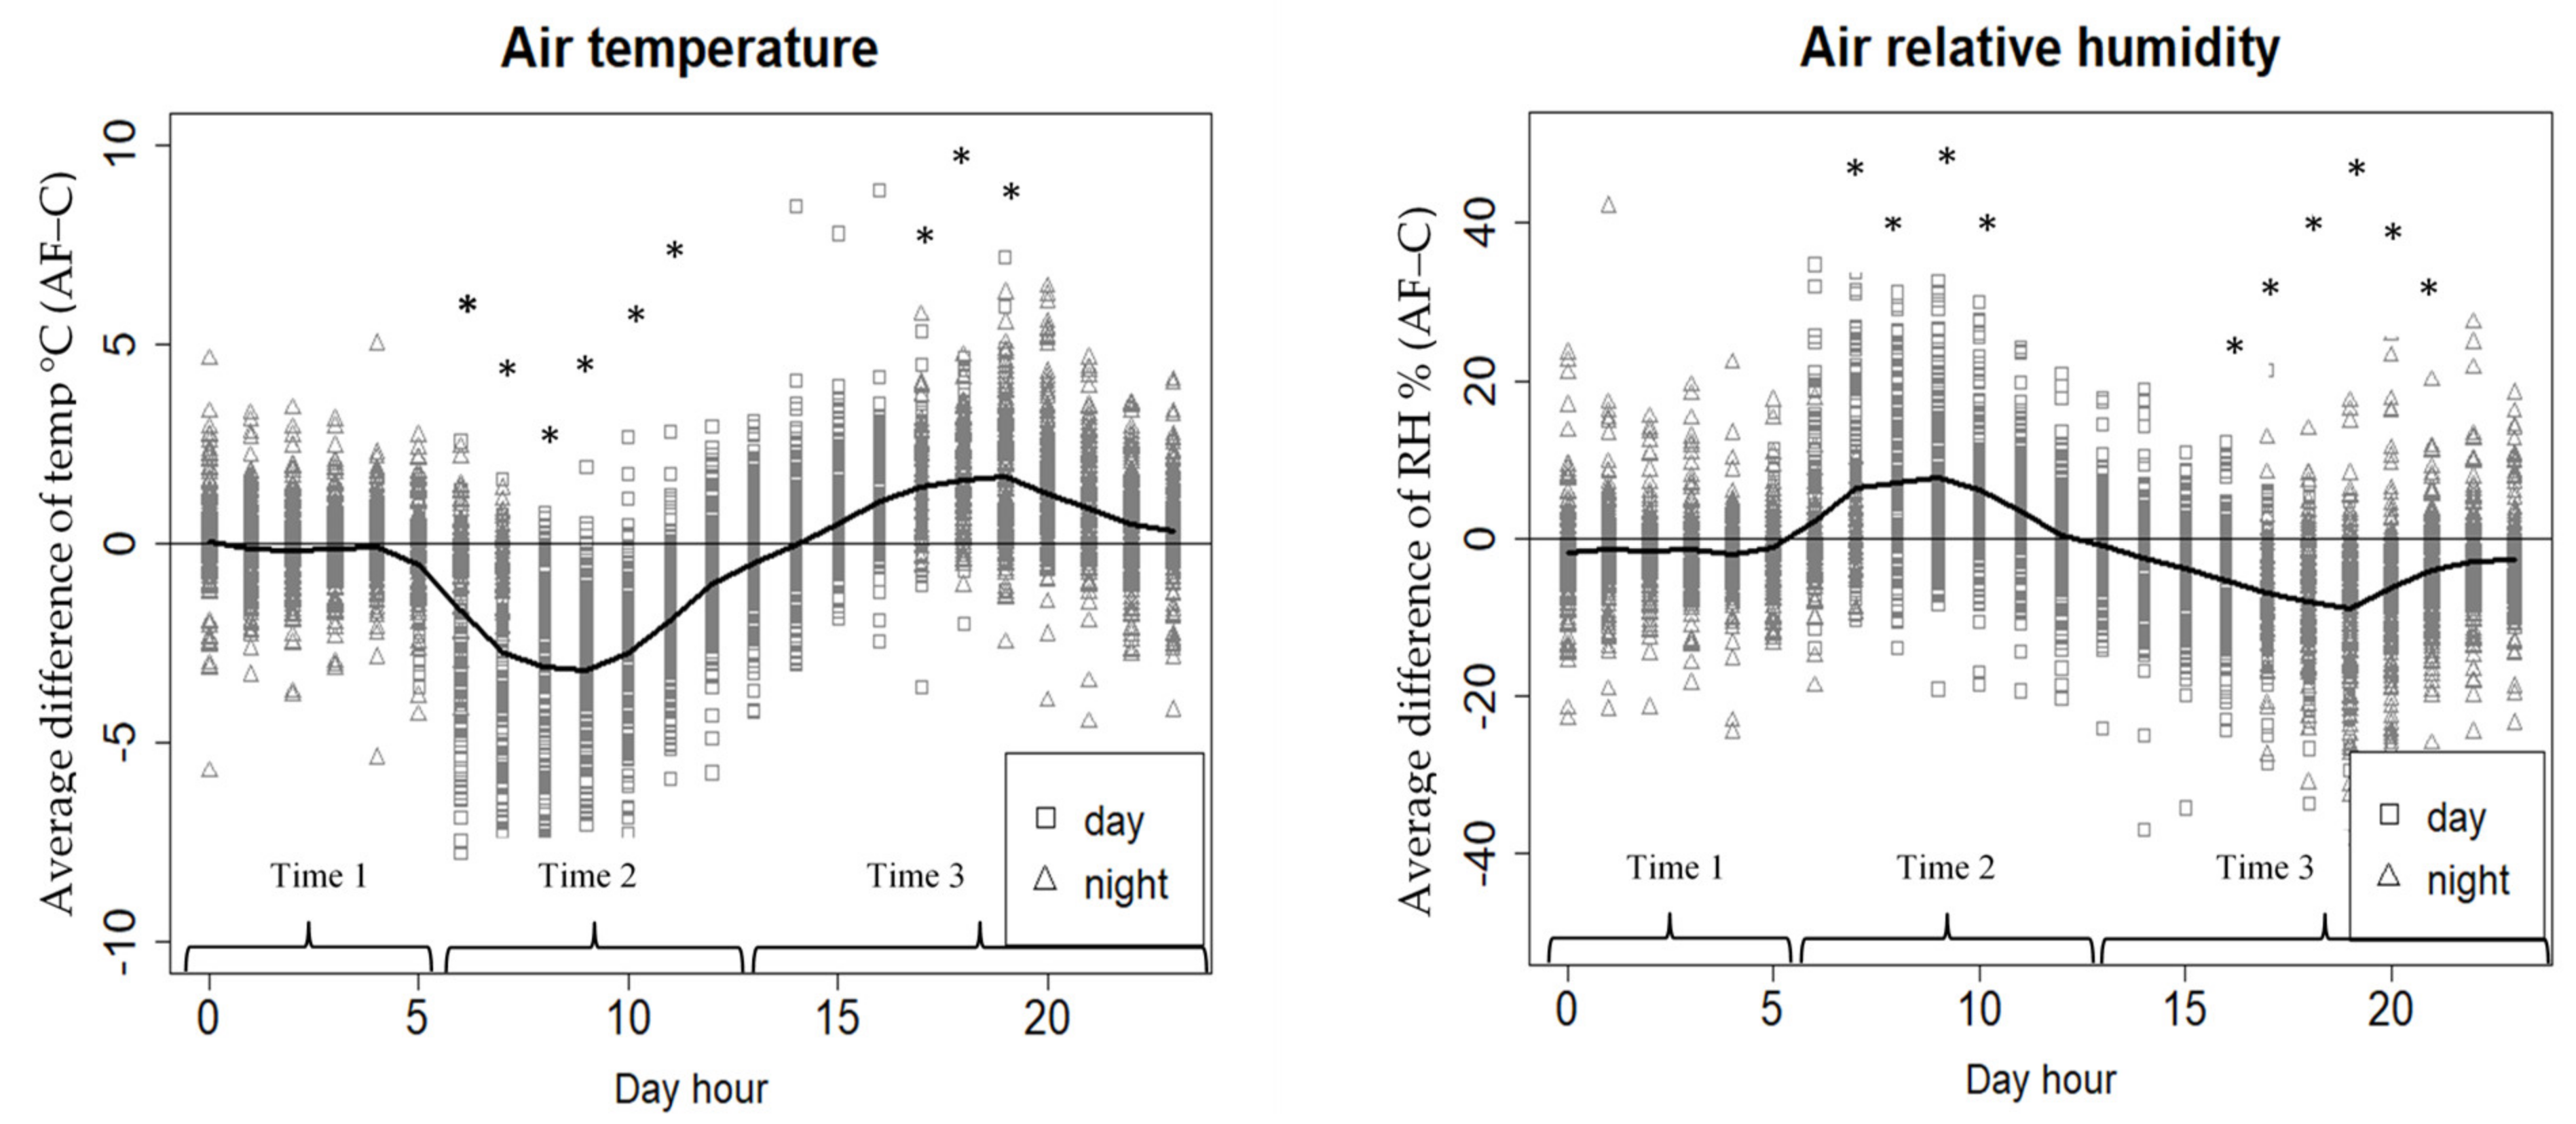
3.2. Air Temperature and Relative Humidity

No significant differences were observed between the agroforestry treatments (AF and AF+) and controls (C) for maximum and minimum daily air temperature and relative humidity. However, a buffer effect was clearly noticed in the moderate shade treatment (AF) as highlighted by the dynamics of daily temperature and relative humidity in the olive alleys in comparison with the open field (Figure 2). From 6 a.m. to midday (i.e., Time2) (Figure 2-left, Table S3), the air temperature was significantly lower in AF as compared to C, with a mean difference of –1.8 °C (maximum of −3.2 °C at 9 a.m.). Additionally, the average difference between air temperature in AF vs. C within Time2 increased from the early stages of the wheat cycle to later stages (i.e., −1.8 °C, −2.4 °C and −2.6 °C during stem elongation, heading and anthesis, and maturity, respectively). On the contrary, from 1 p.m. to midnight (Time3), the air temperature was higher in AF as compared to C (+1.2 °C on average, +1.7 °C as maximum at 7 p.m.), with a lower variation between the two treatments as compared to Time2, but significant between 5 p.m. to 7 p.m. As regards the growth periods, within Time3 the difference of air temperature between AF and C was low but significant during stem elongation (+0.6 °C in AF vs. C), while it was considerably higher during heading and anthesis, and maturity (+1.6 °C and +1.5 °C, respectively) (p ≤ 0.05).
The air relative humidity (RH) showed an opposite daily dynamic than the air temperature. From 6 a.m. to midday (Time2, Figure 2-right), RH was higher in AF than C (significantly from 7 a.m. to 10 a.m.), on average by +3.4%, with a maximum variation at 9 a.m. (+7.7%). Similarly to air temperature, the difference in RH between treatments within Time2 increased over time: it was minimum during stem elongation (+2.4% in AF vs. C) and maximum during wheat grain maturity (+6.1% in AF vs. C). From 1 p.m. to midnight (Time3), on the contrary, average RH was lower in AF than under full sun (significantly from 4 p.m. to 9 p.m.), on average by −6.1%, with a maximum variation at 7 p.m. (−9%). Within Time3, when comparing RH during the different growth periods, the difference between treatments was minimum during heading and anthesis (−5.0% in AF vs. C) and maximum during maturity stage (−7.9% in AF vs. C) (Table S3).

3.3. Wind Speed

Wind speed was significantly reduced in both agroforestry treatments, i.e., by 85.5% and 99.6% in AF and AF+, respectively, compared to open field (2.0 m s−1), as the average between sowing to harvesting in 2017 (Table 1). The greatest difference between AF and C treatments was measured during the latest period of wheat “maturity” (−93% vs. C). In AF+ treatment, wind speed was markedly reduced during all growth stages (average of 0.01 m s−1). Considering the whole wheat cycle, the maximum wind speed values recorded in C, AF and AF+ treatments were 24 m s−1, 9.8 m s−1 and 4.5 m s−1, respectively.
When wind speed is above 17 Km h−1 (i.e., 4.7 m s−1; Beaufort Scale Level 3 [52]), the application of chemical treatments is not recommended. Throughout the measurement period (210 days), the number of hours with a maximum wind speed >4.7 m s−1 in the Control treatment was 1757 h, (equal to 73 days), the majority of which during stem elongation (1083 h), and a shorter period during heading and anthesis (327 h) and maturity (347). In AF treatment, the number of hours with a maximum wind speed >4.7 m s−1 was 161, (equal to 7 days), of which 142 were recorded during stem elongation, while in AF+ treatment this threshold wind speed was never exceeded.

3.4. Edaphic Environment

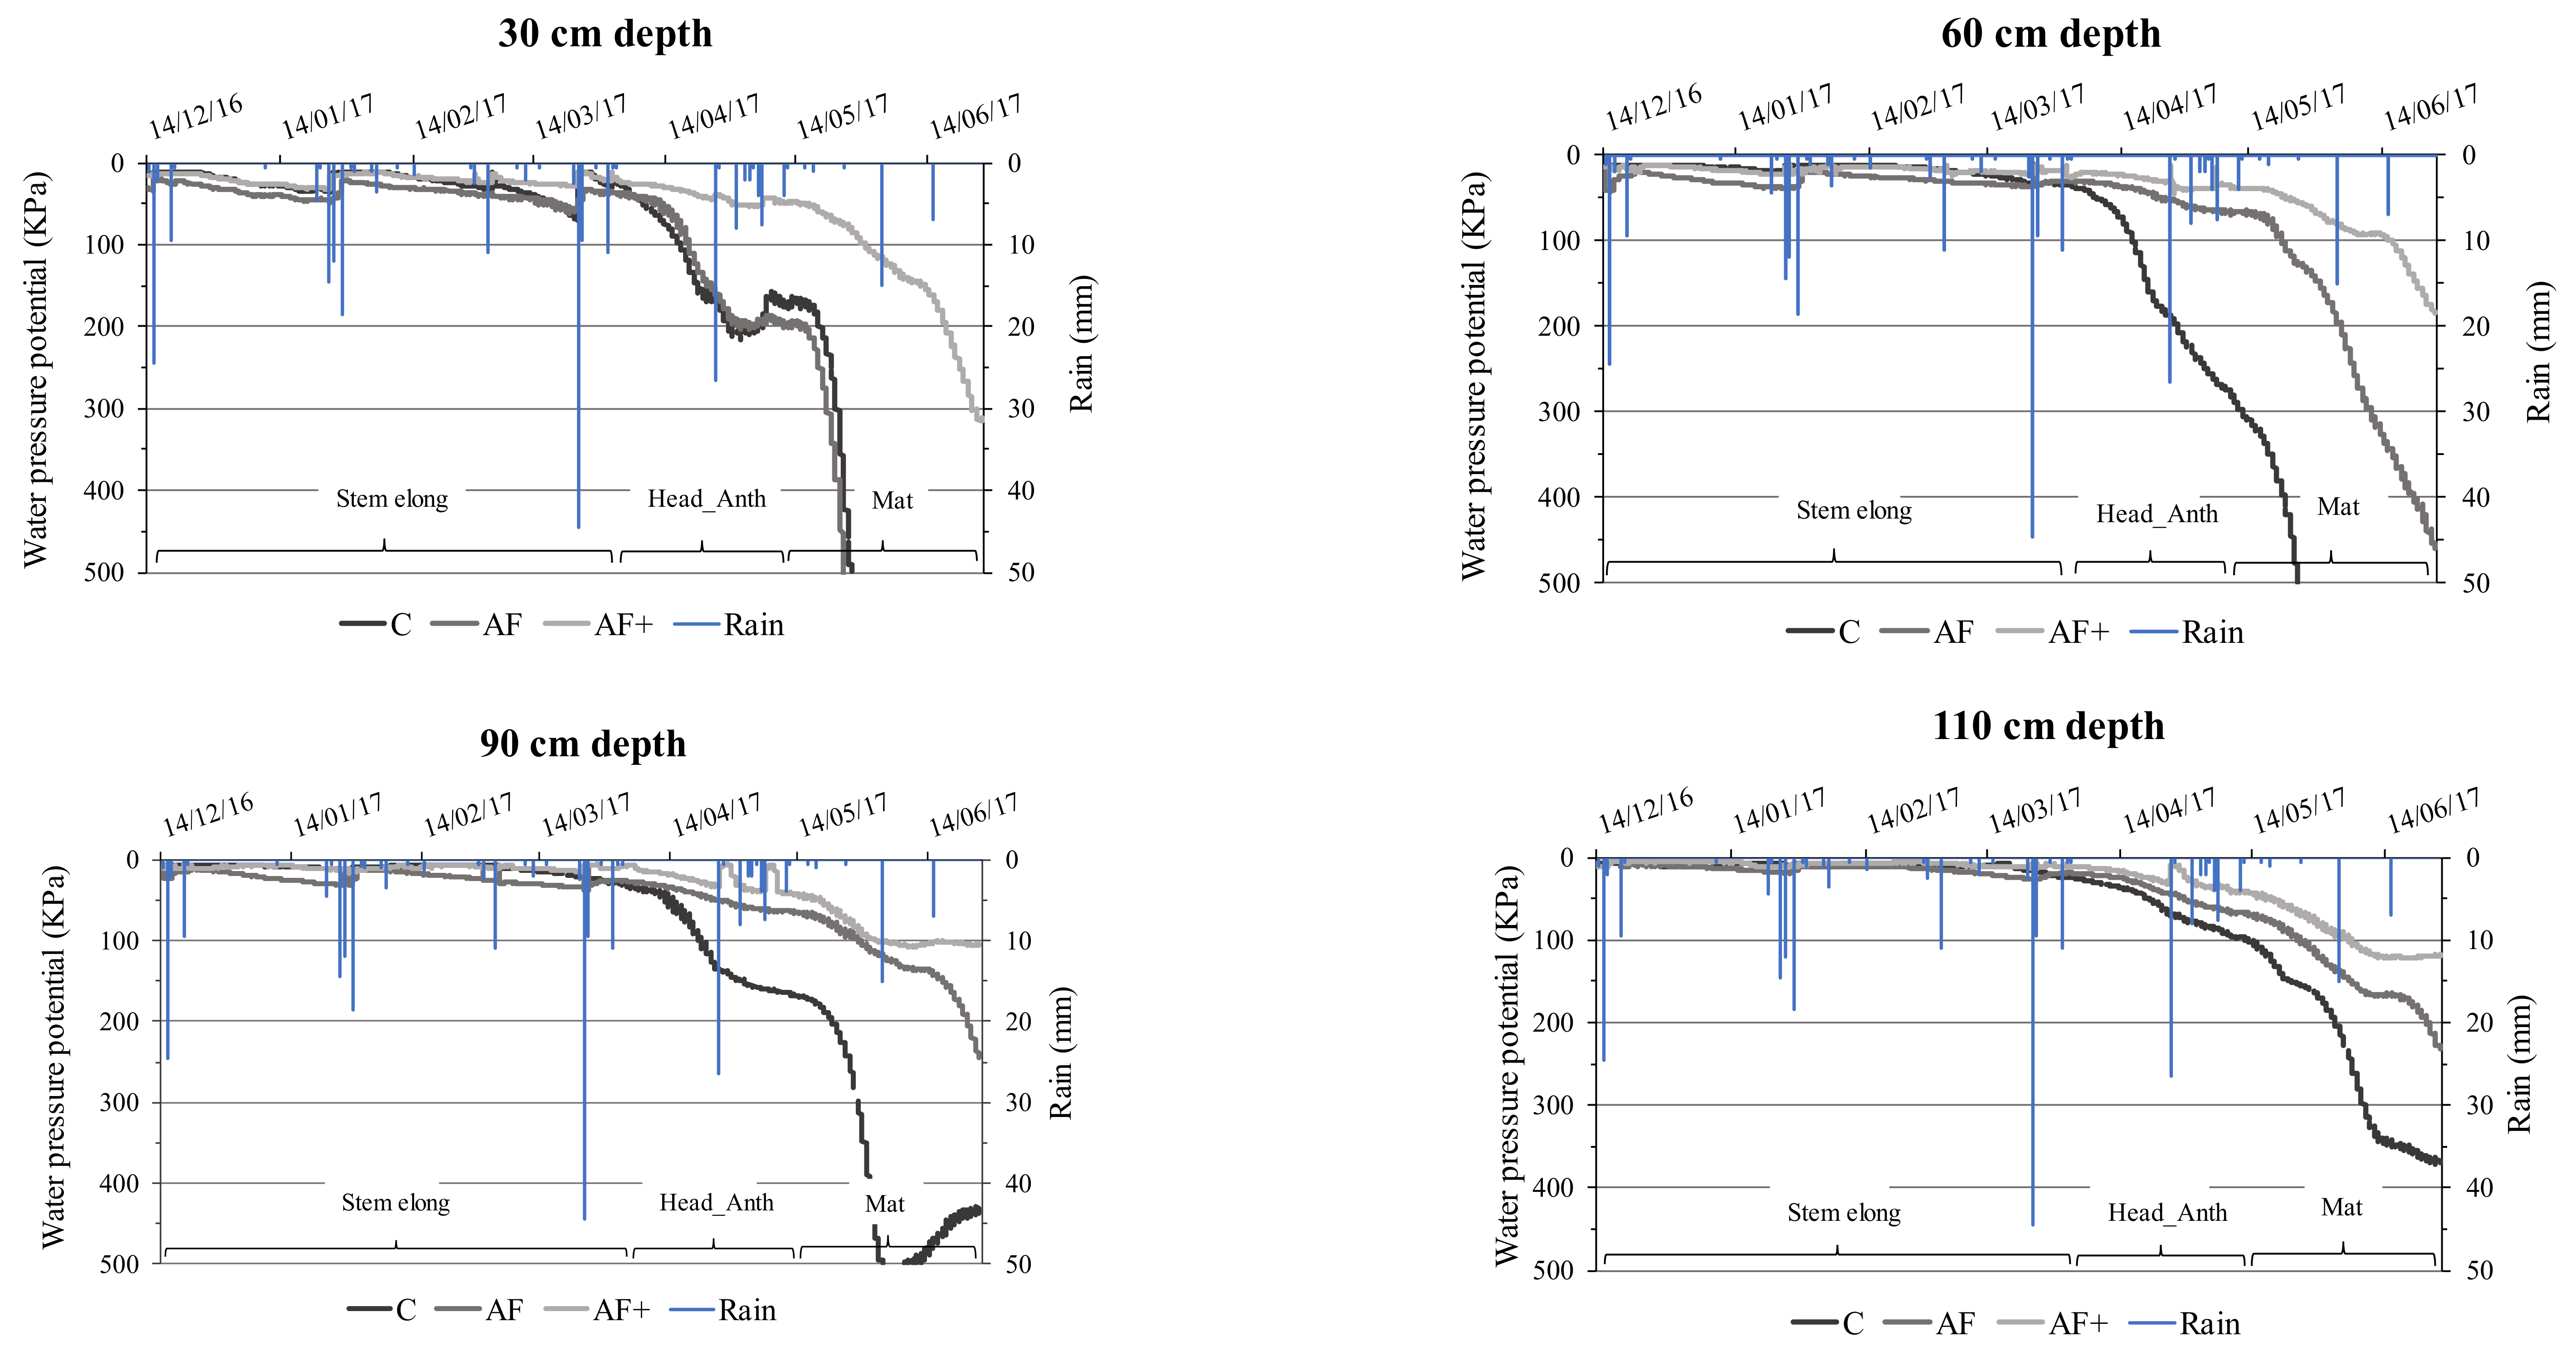
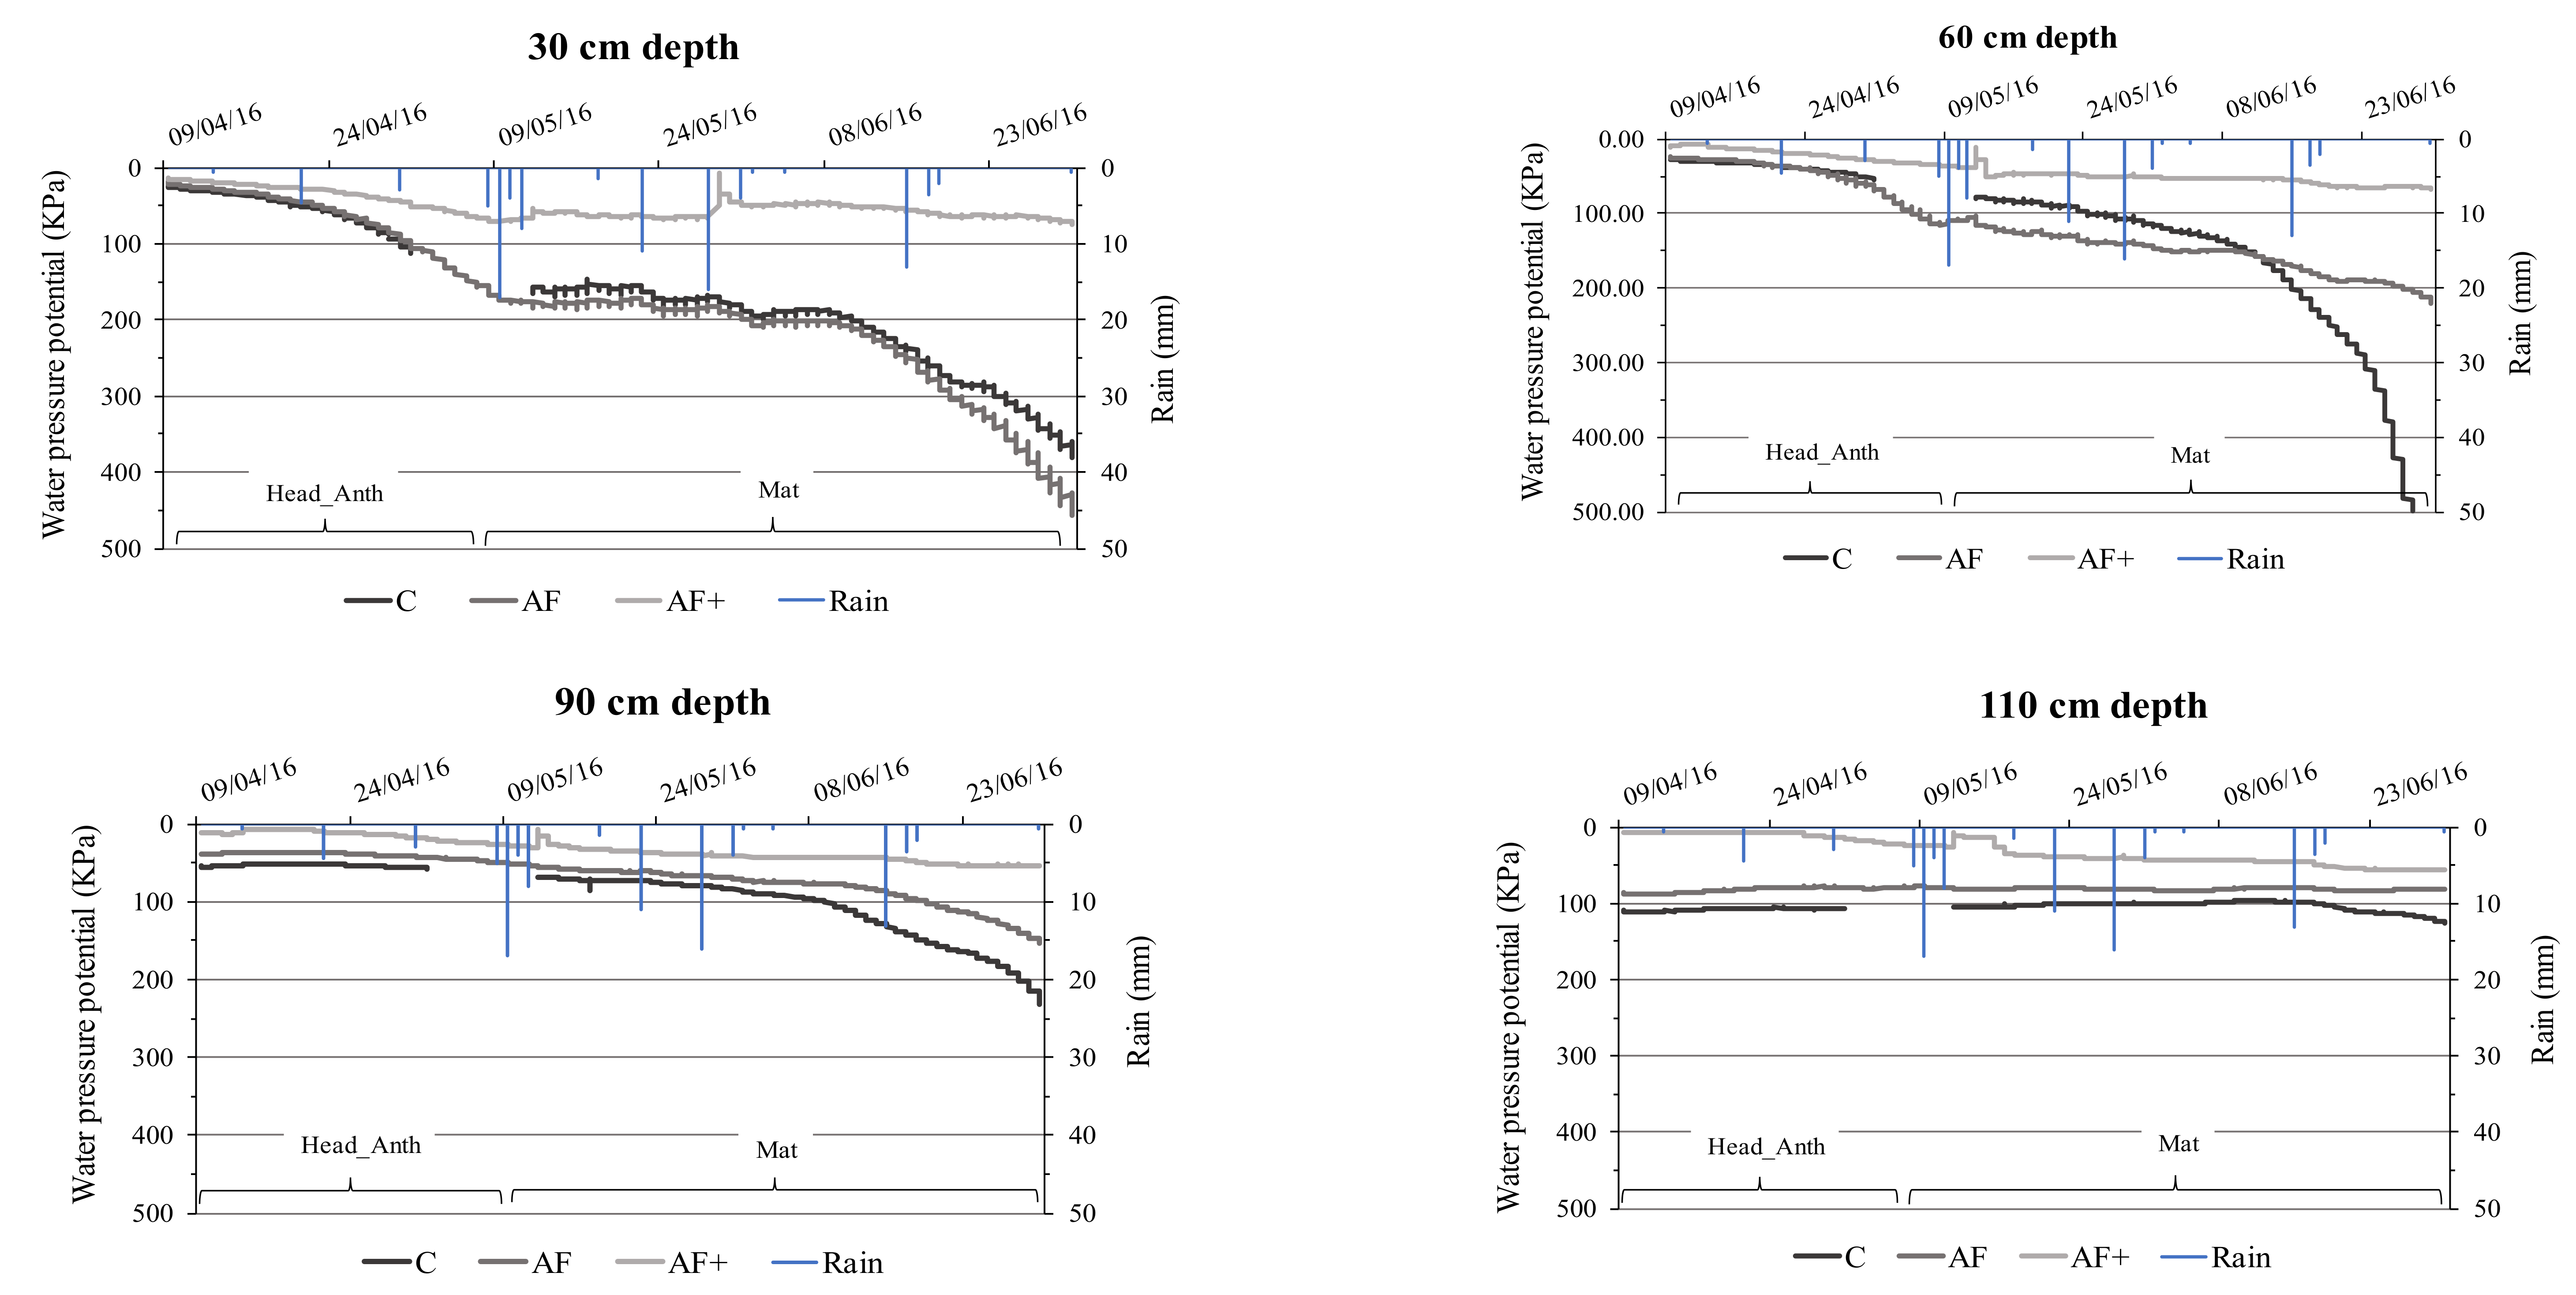
3.4.1. Soil Moisture Content

Significant differences among treatments were observed on soil water content, which varied depending on the wheat growth stage and soil depth (i.e., 30, 60, 90, and 110 cm). During stem elongation, the mean water pressure potential was below 60 KPa in all the treatments at any depth (Figure 3). Within this period, the water potential decreased significantly from 50 Kpa to 10 Kpa in all the treatments and at any depth, as a consequence of precipitation and water percolation after any abundant event.
Significant differences among treatments were revealed from the first week of April onwards in both years. During the heading and anthesis time, at 30 cm depth, a significant increase of water potential from 50 KPa at the beginning of April up to 180 KPa on the second week of May was observed in both C and AF treatments, while in AF+ treatment the water pressure potential remained low, just over 40 KPa (as average) in both years. At 60 cm of depth, a different pattern was observed in the two years during heading and anthesis: in 2016, water pressure potential was on average 40 KPa in controls, 55 KPa in AF (+48% vs. C, p ≤ 0.05) and 22 KPa in AF+ (−41%vs. C, p ≤ 0.05) (Figure 4); on the contrary, in 2017 a significant increase of water stress was observed under full sun conditions from the first week of April onward, as the water potential of C increased from an average of 50 KPa at the beginning of April up to 300 KPa in the second week of May (Figure 3). During this period, both agroforestry treatments maintained a significantly higher soil water content (+71% in AF and +82% in AF+) as compared to controls. At 90 and 110 cm of soil depth, the water pressure potential of the control treatment during heading and anthesis increased more importantly in 2017 than in 2016; nevertheless, both agroforestry treatments showed a significantly higher soil water content as compared to full sun conditions, with the most shaded treatment (AF+) displaying the greatest effect (on average −35% and −75% of water pressure potential in AF and AF+, respectively).
The greatest differences among treatments were observed during the last period of the wheat cycle, from 11 May to harvesting (end of June), during the grain filling period (Figure 3 and Figure 4). At this time, both C and AF treatments showed a significant increase of water stress in topsoil (30 cm depth), water pressure potential ranging from 180 KPa in the second week of May to >400 KPa at the end of June. Considering that 300 KPa is the reliability limit of the values recorded by the Watermark probes, at 30 cm depth of both C and AF treatments the water pressure potential exceeds this threshold in both years from the last week of May onward, with higher water stress in 2017. The AF+ treatment, instead, showed a significantly higher water content in the topsoil (30 cm) as compared to both C and AF at this time: on average +73% in 2016 and +5% in 2017. From 60 cm to 110 cm of soil depth, the hierarchy in soil water content clearly was AF+ > AF > C from mid-May until harvesting in both years. Regardless of soil depth and year, the most shaded treatment (AF+) showed the lowest water pressure potential.

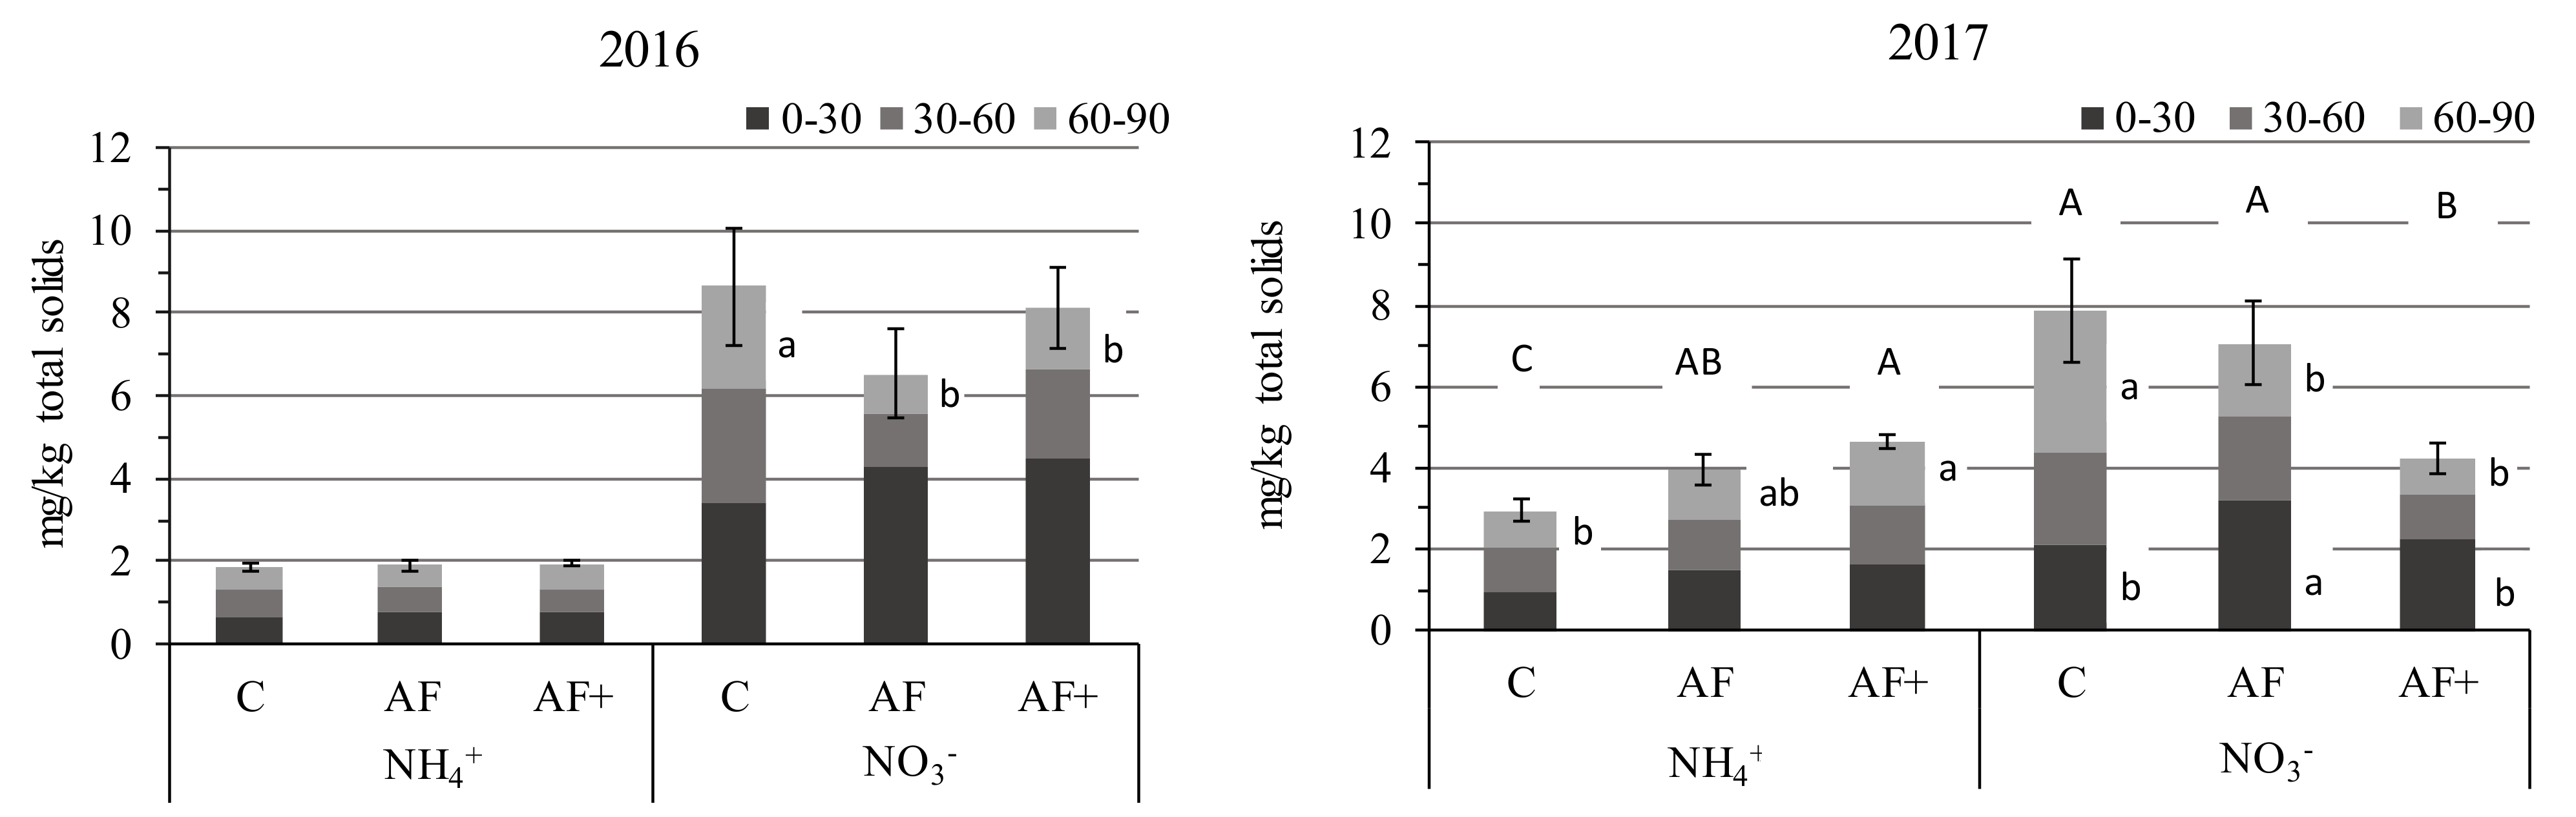
3.4.2. Soil Fertility

In the first year trial (2015–16), the average soil ammonium (NH4+) concentration in the 0–90 cm depth interval was not statistically different among the three treatments, it being 1.8, 1.9 and 2.0 ppm (mg kg−1) in C, AF and AF+ respectively. However, considering the different soil layers, the two agroforestry treatments showed a higher ammonium concentration at 0–30 cm depth (+30% in AF and +23% in AF+) and a lower one at 30–60 cm depth (−21% in AF and −20% in AF+) compared to controls, although it was not significant (Figure 5). A significant increase of [NH4+] was observed in the second year in all the treatments, particularly in the two agroforestry treatments. Indeed, in 2016–17, AF and AF+ had significantly higher soil ammonium concentrations than C in 0–90 cm soil layer. The greatest difference was observed in topsoil (0–30 cm), AF and AF+ having +63% and +75% of [NH4+] vs. C.
Unlike [NH4+] dynamics, a general decrease of [NO3] (−24% on average; 0–90 cm) was observed from the first to the second year. In 2015–16, the nitrate concentration was not significantly different among the three treatments with regard to the 0–90 cm soil profile. However, higher [NO3] was measured in the topsoil layer (0–30 cm) of AF (+25%) and AF+ (+30%) (p > 0.05). Beneath 30 cm of depth, instead, [NO3] was lower in AF and AF+ than in C, significantly for the deepest soil layer (60–90 cm) (Figure 5). In 2016–17, the average nitrate concentration was similar in C and AF treatments, but significantly lower in AF+ (−47% vs. C) (0–90 cm). When comparing different soil depth intervals, in AF significantly higher [NO3] values were observed in the 0–30 cm layer (+53% vs. C), whereas lower values at greater depth and significantly for the 60–90 cm interval (−49% and −76% in AF and AF+, respectively, vs. C).

3.5. Mycorrhizal Colonization

All the wheat root fragments (100% of frequency) grown in the two agroforestry treatments were colonized by arbuscular mycorrhizal fungi (AMF), vs. 96% of controls (p ≤ 0.05; Table 2). The intensity of mycorrhizal colonization, expressed as a percentage of the length of the colonized root fragment, was significantly higher in agroforestry treatments (+51% and +41% in AF and AF+ respectively), as well as the abundance of AMF arbuscules (+74% in AF and +66% in AF+).
Wheat plants in AF showed higher values than AF+, with regard to the three parameters used to describe mycorrhizal colonization, however, it was not statistically significant.

3.6. Durum Wheat Yield and Yield Components

The average yield of the wheat cultivar 1 was reduced by 50% in AF and 76% in AF+ compared to controls C (1.6 t ha−1), as two-year average (Table 3). Concerning the yield components, the number of tillers and spikes per plant and the shoot dry weight were markedly reduced under both the shading treatments, significantly for plant biomass. The most affected yield component was the number of grains per spike: −83% in both agroforestry treatments vs. C. On the contrary, the thousand-grain weight (TGW) was higher in AF (+12%) than in C, although not significantly, while AF+ negatively affected TGW (−30%).

4. Discussion

This trial provided useful results on the potential of olive alley systems to provide adequate microclimatic and edaphic conditions for an understorey winter durum wheat, in the context of climate change.

4.1. Air Temperature and Relative Humidity

Air temperature buffering is an important environmental benefit linked to agroforestry practices, with particularly favorable effects in heat-sensitive crops in tropical regions [35,37]. Within tropical agroforestry systems including coffee and Faidherbia albida trees, the mitigation of extreme temperatures is considered as a key strategy to designing more resilient and climate-smart farming systems [32,37,53]. However, mitigation and/or adaptation to heat stress is becoming increasingly relevant worldwide, including the Mediterranean area. Here we observed a significant buffer effect between day and night temperatures in the moderate shading agroforestry treatment (AF), as durum wheat cultivated in the olive alleys experienced a lower temperature during the daytime (maximum reduction of 3.2 °C) and higher during the night (maximum +1.7 °C), compared to full sun open field conditions. Recently, the same variation patterns in day and night temperatures were observed in a durum wheat-walnut agroforestry system in the south of France (−1.2 °C and +1.17 °C, respectively, with clear days) [14,54] and in a wheat-poplar AF system in Germany (−3.4 °C during the daytime and +1.6 °C at night) [55]. In our study, the most interesting result was related to the greatest buffering effect observed later in the season, during the grain filling period of wheat, which is the most sensitive to high temperatures and drought, and decisive for productivity and quality.
The effect of olive trees on air temperature showed a high potential towards the improvement of crop resilience to climate changes. However, while reducing daytime temperatures can have beneficial effects on crop growth [32,35], warmer nights may impair wheat growth and yield. García et al. [56] observed a yield reduction of 7% for each °C increase during the nighttime in durum wheat and barley compared to ambient temperatures in growth chambers. In these conditions accelerated development rate and lower carbon assimilation rate, due to higher dark respiration, were suggested by Grant et al. [57]. Durum wheat needs cold temperatures during winter to ensure an optimal tillering [58,59], while warming temperatures during this period are usually translated into a lower number of tillers per plant, as we observed in our study, i.e., −26% and −27% in AF and AF+, respectively.
The relative humidity of air in the alleys showed a day–night pattern similar to that observed for air temperature. Although a higher air relative humidity (RH) is reported among the environmental benefits of agroforestry, this was noticed only during some hours of the day, i.e., from 5 a.m. to midday (maximum +9%). Lin [53] obtained similar results for a longer period of the day, i.e., from 8 a.m. to 16 p.m., in an agroforestry system with coffee trees. According to this author, lower humidity during night hours may have not affected the plants negatively, as daytime measurements are more important in determining water use in plants.

4.2. Wind Speed

The presence of a high population of olive trees had a significant windbreak effect, as wind speed was decreased from −85.5% of yearly pruned trees (AF) to −99.6% with unpruned trees (AF+). Wind speed is of high importance in regulating evapotranspiration, but also to correctly managing chemical and fertilizer applications by foliar spraying. It was not the case in our organic cropping system, but it is well known that the efficiency of spraying depends on the crop stage and the accuracy of irroration. In France, phytosanitary applications are forbidden when wind speed is ≥19 km h−1 (level 3–4 in the Beaufort scale), but not recommended even >17 km h−1. The latter is often exceeded in open fields of the Mediterranean area. In this study, wind speed exceeded this threshold for >300 h during the growing season of wheat. The presence of trees drastically reduces wind speed, giving the chance to choose the most appropriate timing for chemical treatments, and also to reduce drift risks. The greatest windbreak effect was observed during wheat anthesis and grain filling, an interesting result as protection against pathogens is strategic at this time.

4.3. Soil Moisture

Water conservation is considered the most relevant ecosystem service that agroforestry systems can provide [20,47], and it becomes particularly useful in arid and semiarid regions, as in the Mediterranean area. In our study, as expected, soil water availability raised as the shade level increased, despite the tree-crop competition. The severe shading treatment (AF+) had a significantly higher soil moisture level as compared to the other two treatments, regardless of the soil layer considered (within the 0–110 cm profile) and wheat stage. The moderate shading treatment (AF) showed soil moisture contents similar to controls in the arable layer (0–30 cm), but significantly higher in deeper layers. Water conservation in our olive orchard was particularly evident from wheat heading to harvesting when drought events are increasingly frequent in the Mediterranean area and detrimental to crop yield. The beneficial effect of trees on soil moisture conservation is widely documented in tropical and subtropical regions, supporting the negative correlation between shade level and evapotranspiration [60]. A key question in tree-crop interactions is whether trees could uptake water from deeper soil horizons to reduce competition with annual crops in topsoil [32]. In this regard, some authors are also considering the process of hydraulic lift as a possible way for increasing soil moisture in shallow soil layers [60,61,62,63,64]. Although the hydraulic lift has been reported in species such as Quercus, Pinus and jujube tree with a high contribution in agroforestry farming systems [65,66,67], scientific evidence is not yet available in temperate climates with olive trees.
Therefore, the preservation of soil moisture recorded in the two agroforestry systems seems to be related to the effects of microclimate buffering exerted by the olive trees during the whole crop cycle, i.e., shading, reduced air temperature for some day hours and windbreak effect. A reduction of soil evaporation and crop transpiration were reported by other authors to explain higher soil moisture [55,61,62]. However, soil moisture conservation is debated in recent literature, as some authors consider water as the main limiting factor in intercropping between woody plants and crops. Gillespie et al. [68], while intercropping maize with oak trees, did not observe yield reductions when belowground competitions for water and nutrients were limited by polyethylene barriers. Wanvestraut et al. [69] confirmed this result and reported a 26% yield reduction in cotton without underground barriers. Although it is difficult to separate the effect of belowground competition for water and nutrients, some authors report that crop productivity in agroforestry systems of semiarid regions is mainly limited by water competition [60,61,68,70]. In this view, our results showing improved soil moisture content are very interesting for increasing crop resilience to climate change. Although root biomass of wheat is mainly confined in the arable layer, the maximum rooting of wheat is 100–120 cm, depending on soil depth and fertility [71]. It is therefore expected that wheat can exploit the greater water availability even in AF, beneath 60 cm of depth.

4.4. Soil Fertility

There is much evidence of the positive role of agroforestry farming in maintaining or improving soil fertility in tropical environments [28,72], while investigations are still lacking in temperate climates [19]. In our study, only soil nitrogen content was considered, as ammonium (NH4+) and nitrate (NO3) concentrations across the soil profile. Here we remind that there was not any fertilizer application since the orchard plantation, and therefore nitrogen was mainly delivered by legumes in rotation with durum wheat.
In aerated soils, nitrate is the major nitrogen form [73], and we confirm it was three to four times more abundant than ammonium in this study. [NH4+] and [NO3] were found higher in agroforestry treatments than in the open field in the arable layer (0–30 cm), thus benefiting wheat. This is probably due to higher soil organic matter as a result of the additional turnover of olive leaves, fine roots and plant residues in the orchard alleys, as observed by other authors [21,74,75]. However, further studies are required to clarify these processes in our alley-cropping system.
The lower soil nitrate concentration measured within agroforestry treatments when considering the deeper soil profile (60 and 90 cm depth), might be due to mineralization slowdown [76] or to significant competition for this nutrient between wheat and olive trees. Although difficult, further investigations on vertical and horizontal (from the trunk till the center of the alley, where soil samples were taken) root distribution of olive trees, will be useful to better understand if competition for nitrogen is the main belowground limiting factor. Actually, the period of our study was probably short to establish a long-term evolution in soil characteristics with or without wheat intercropping; therefore, it will be useful to continue monitoring nitrogen concentration in the following years to better assess the potential of this agroforestry model in soil fertility in the Mediterranean area [19,77].

4.5. Arbuscular Mycorrhizal Fungi (AMF)

Thanks to the symbiotic association with plant roots, AMF can facilitate the mobilization and acquisition of nutrients, especially the low mobile phosphorus (P), protect plants from pathogens and improve water relations [78,79,80]. As consequence, investigating the potential contribution of AMF in mediating tree-crop interactions is relevant, especially in low external input systems, like in organic farming. In our study, the roots of wheat intercropped with both the yearly pruned and the never pruned olive trees showed a significantly higher intensity of colonization and arbuscular abundance, as compared to wheat grown in monoculture, an effect possibly related to greater soil moisture. These data corroborate previous results, demonstrating that agroforestry promotes beneficial biological interactions between useful microorganisms and plant species [81,82,83,84,85]. Tree-based intercropping, indeed, is known to act as a reservoir for an abundant mycelial network for crops [86], and also to enhance the richness of AM fungal communities compared to monoculture [87]. AMF are known to improve active nutrient acquisition, including N, as well as other processes, such as enlarging soil volumes for nutrient access, changing P absorption kinetics and solubilization, and improving soil aggregation and stability [83,86,88]. Our results contribute to providing evidence of the high potential of agroforestry to create favorable conditions for AMF root colonization, thus improving soil characteristics and plant nutrition.

4.6. Durum Wheat Performances

Despite the positive impact of agroforestry treatments on the microclimatic conditions and edaphic environment, durum wheat yield was significantly reduced when intercropped with olive trees; productivity was halved in the moderate shading treatment (AF) and decreased even by 76% in the severe shading treatment (AF+). Among yield components, the most affected by agroforestry conditions was the number of grains per spike, which derives by the number of fertilized flowers per spike, which is determined at anthesis and strongly dependent on the PAR availability. The two agroforestry systems of our study were characterized by an average PAR reduction of −30% and −51% respectively in the moderate (AF) and severe (AF+) shading treatments, compared to full sun conditions. These shading levels are similar to those recorded in other alley-cropping designs within temperate climates [68,89,90]. In a walnut-durum wheat intercropping located at Restinclières, 20 km N from our study site, a PAR reduction comparable to our AF, i.e., −31%, led to a similar wheat yield reduction, i.e., −50% [90]. In recent studies, severe shading was linked to a decrease in stomatal conductance and photosynthetic rate [91]. Low shading levels, on the contrary, may increase the fraction of diffuse light, which is more efficiently used by plants, and might enhance CO2 uptake, photosynthesis and plant growth. With PAR reduction below 15%, Li et al. [92] observed enhanced plasticity of light-harvesting variables (leaf area, pigment contents, canopy architecture), and increased wheat yield. In this way, it is crucial to identify appropriate tree-crop combinations in order to define the most suitable system designs, and to manage tree growth properly to limit PAR reductions for the understorey crop. Li et al. [89] highlighted that tree growth and pruning, tree row orientation and spacing, and also tree phenology can reduce significantly the extent of shading. For instance, by intercropping durum wheat with Paulownia trees, these authors recorded PAR reductions by −22%, −44% and −56% during flowering, grain filling and maturity, respectively. The association of a winter cereal and a late sprouting deciduous tree species showed to be favorable, as walnuts budburst occurs when wheat has already reached the maximum leaf area index. On the opposite, olive trees, as evergreen species, lead to significant shade on the understorey cereal during its whole growth cycle. The orientation of tree rows has also an impact, N-S orientations being less competitive for light than E-W [55,68,90,93], especially at high and medium latitudes [94]. In this experiment, therefore, the NW-SE orientation of trees might have led to a higher shade impact than ideal N-S orientation. The distance between the olive tree rows (6 m both in AF and AF+) is common in the Mediterranean region for olive orchards, but is particularly challenging for the growth and development of the associated crop. The narrow inter-rows combined with the ever-green trait of the trees increased tree-crop competition for soil resources, but mainly for light. Therefore, the strong reduction of crop biomass observed in agroforestry was presumably due to the decrease of light availability, and this may also explain the higher soil water content measured in the alleys. It is not a speculation to hypothesize that a larger inter-row could reduce light competition and improve wheat productivity, with better exploitation of soil moisture. There are several examples in the literature of silvoarable agroforestry systems in a temperate climate with larger inter-rows (from 15 to 90 m) [14,90,95,96], where the authors investigated the effect of the distance from the tree line on light availability, crop physiology and yield [95,96,97]. We agree on the relevance of AF design and management in order to modulate the occurrence and the magnitude of multiple potential interactions between trees and intercrops. This trial anyhow contributed to evidence the high potential of olive alley systems to provide adequate microclimatic and edaphic conditions for an understorey winter durum wheat, in the context of climate change. The screening of cereal ideotypes for agroforestry conditions, taking advantage of participatory ecobreeding approaches [98], and searching for useful traits, will further contribute to improving the sustainability of alley-cropping farming systems.

5. Conclusions

The sustainability of organic olive groves in the Mediterranean area and their ability to provide a microclimatic and edaphic environment suitable for an associated understorey crop, such as durum wheat, were the challenging questions at the origin of this study. These results demonstrate the high potential of olive alley-cropping systems to provide relevant ecosystem services regarding temperature buffering, windbreak effects and soil water conservation, which are strategic in drought-stressed areas, such as the Mediterranean one. Olive trees were also able to modify the edaphic environment by creating favorable conditions for arbuscular mycorrhizal fungi growth, which is fundamental in low-input farming systems to enhance plant nutrient uptake. However, these microclimatic and edaphic changes were not translated into higher yield in the considered durum wheat variety. The strong competition for light due to the narrow inter-row and to the evergreen trait of olive trees appeared as the main limiting factor. A key strategy to promote the reintroduction of alley-cropping systems mixing olive trees and cereals in the Mediterranean area is to adopt olive alley-cropping designs with larger inter-row in order to decrease the shade pressure on crops; however, this would also act on microclimate and edaphic parameters, probably reducing the extent of buffering and windbreak effects. An optimal compromise between the requirements of the crop and the tree components remains to be assessed and requires further investigations.

Supplementary Materials

The following are available online at www.mdpi.com/article/10.3390/agronomy12020527/s1, Figure S1. Location of the experimental site in the South of France (a, b), 15 km east from Montpellier; the fields hosting the three treatments (C, AF and AF+) at the INRAE experimental station (c); and the durum wheat –olive trees intercropping in AF and AF+ treatments (d).; Table S1. Dates of sowing and harvesting of durum wheat, and average values of the main climatic indicators recorded between sowing and harvesting dates in 2015–16 and 2016–17 growing seasons. Climatic data are from a Meteo–France weather station located at the INRAE station, 100 m from the experimental fields.; Table S2. Details of the sensors used for recording microclimatic and edaphic parameters in the 3 treatments (C, AF, and AF+) from wheat sowing to harvesting during 2015–16 and 2016–17 growing seasons; Table S3. Average air temperature and relative humidity recorded in C and AF treatments within three times of the day (Time1 = 12 pm–5 am, Time2 = 6 am–12 am, Time3 = 1 pm–11 pm), during 2016–17 growing season at stem elongation, heading and anthesis, and maturity. Within the same wheat cycle period and time of the day, air temperature (°C) and relative humidity (%) are also expressed as difference between AF and C treatments. For each microclimate parameter, in a same line, different letters indicate significant difference according to the Tukey’s HSD test (p ≤ 0.05).

Author Contributions

Conceptualization, D.D.; methodology, D.D, F.M., O.T., Y.P. and R.D.; formal analysis, A.P., H.-Y.H. and D.D.; investigation, B.B., H.-Y.H. and A.P.; resources, D.D.; data curation, B.B., H.-Y.H., A.P. and F.M.; writing—original draft preparation, A.P. and D.D.; writing—review and editing, A.P., D.D. and T.V.; visualization, A.P. and D.D.; supervision, D.D.; project administration, D.D.; funding acquisition, D.D. All authors have read and agreed to the published version of the manuscript.

Funding

This study was undertaken in the frame of the AGFORWARD project (grant agreement no. 613520), co-funded by the European Commission, Directorate-General for Research and Innovation, within the 7th Framework Program of RTD, Theme 2—Biotechnologies, Agriculture, and Food. The research fellowship of A.P. allowing for the “writing—review and editing” of this Manuscript was granted by the University of Padova BIRD210158/21.

Data Availability Statement

The data presented in this study are available on request from the corresponding author.

Conflicts of Interest

The authors declare no conflict of interest.

References

  1. Nerlich, K.; Graeff-Hönninger, S.; Claupein, W. Agroforestry in Europe: A review of the disappearance of traditional systems and development of modern agroforestry practices, with emphasis on experiences in Germany. Agrofor. Syst. 2013, 87, 475–492. [Google Scholar] [CrossRef]
  2. Nieto, O.M.; Castro, J.; Fernández-Ondoño, E. Conventional tillage versus cover crops in relation to carbon fixation in Mediterranean olive cultivation. Plant Soil. 2013, 365, 321–335. [Google Scholar] [CrossRef]
  3. Cramer, W.; Guiot, J.; Fader, M.; Garrabou, J.; Gattuso, J.P.; Iglesias, A.; Xoplaki, E. Climate change and interconnected risks to sustainable development in the Mediterranean. Nat. Clim. Chang. 2018, 8, 972–980. [Google Scholar] [CrossRef] [Green Version]
  4. Lu, J.; Carbone, G.J.; Grego, J.M. Uncertainty and hotspots in 21st century projections of agricultural drought from CMIP5 models. Sci. Rep. 2019, 9, 4922. [Google Scholar] [CrossRef] [PubMed]
  5. Philandras, C.M.; Nastos, P.T.; Kapsomenakis, J.; Douvis, K.C.; Tselioudis, G.; Zerefos, C.S. Long term precipitation trends and variability within the Mediterranean region. Nat. Hazards Earth Syst. Sci. 2011, 11, 3235–3250. [Google Scholar] [CrossRef] [Green Version]
  6. Bilbao, J.; Román, R.; De Miguel, A. Temporal and Spatial Variability in Surface Air Temperature and Diurnal Temperature Range in Spain over the Period 1950–2011. Climate 2019, 7, 16. [Google Scholar] [CrossRef] [Green Version]
  7. Jacob, D.; Petersen, J.; Eggert, B.; Alias, A.; Christensen, O.B.; Bouwer, L.M.; Georgopoulou, E. EURO-CORDEX: New high-resolution climate change projections for European impact research. Reg. Environ. Chang. 2014, 14, 563–578. [Google Scholar] [CrossRef]
  8. Arenas-Corraliza, M.G.; López-Díaz, M.L.; Moreno, G. Winter cereal production in a Mediterranean silvoarable walnut system in the face of climate change. Agric. Ecosyst. Environ. 2018, 264, 111–118. [Google Scholar] [CrossRef]
  9. Ribes, A.; Thao, S.; Vautard, R.; Dubuisson, B.; Somot, S.; Colin, J.; Soubeyroux, J.M. Observed increase in extreme daily rainfall in the French Mediterranean. Clim. Dyn. 2019, 52, 1095–1114. [Google Scholar] [CrossRef]
  10. IPCC. Climate Change 2013: The Physical Science Basis. In Contribution of Working Group I to the Fifth Assessment Report of the Intergovernmental Panel on Climate Change; Cambridge University Press: Cambridge, UK, 2013. [Google Scholar]
  11. Nguyen, Q.; Hoang, M.H.; Öborn, I.; van Noordwijk, M. Multipurpose agroforestry as a climate change resiliency option for farmers: An example of local adaptation in Vietnam. Clim. Chang. 2013, 117, 241–257. [Google Scholar] [CrossRef]
  12. Lobell, D.B.; Schlenker, W.; Costa-Roberts, J. Climate trends and global crop production since 1980. Science 2011, 333, 616–620. [Google Scholar] [CrossRef] [PubMed] [Green Version]
  13. Pautasso, M.; Döring, T.F.; Garbelotto, M.; Pellis, L.; Jeger, M.J. Impacts of climate change on plant diseases, opinions and trends. Eur. J. Plant Pathol. 2012, 133, 295–313. [Google Scholar] [CrossRef] [Green Version]
  14. Inurreta-Aguirre, H.D.; Lauri, P.É.; Dupraz, C.; Gosme, M. Yield components and phenology of durum wheat in a Mediterranean alley-cropping system. Agrofor. Syst. 2018, 1–14. [Google Scholar] [CrossRef]
  15. Moriondo, M.; Bindi, M. Impact of climate change on the phenology of typical Mediterranean crops. Ital. J. Agrometeorol. 2007, 3, 5–12. [Google Scholar]
  16. Ren, S.; Qin, Q.; Ren, H. Contrasting wheat phenological responses to climate change in global scale. Sci. Total Environ. 2019, 665, 620–631. [Google Scholar] [CrossRef] [PubMed]
  17. Gouache, D.; Le Bris, X.; Bogard, M.; Deudon, O.; Pagé, C.; Gate, P. Evaluating agronomic adaptation options to increasing heat stress under climate change during wheat grain filling in France. Eur. J. Agron. 2012, 39, 62–70. [Google Scholar] [CrossRef]
  18. Xiao, D.; Bai, H.; Liu, D. Impact of future climate change on wheat production: A simulated case for China’s wheat system. Sustainability 2018, 10, 1277. [Google Scholar] [CrossRef] [Green Version]
  19. Torralba, M.; Fagerholm, N.; Burgess, P.J.; Moreno, G.; Plieninger, T. Do European agroforestry systems enhance biodiversity and ecosystem services? A meta-analysis. Agric. Ecosyst. Environ. 2016, 230, 150–161. [Google Scholar] [CrossRef] [Green Version]
  20. McAdam, J.H.; Burgess, P.J.; Graves, A.R.; Rigueiro-Rodríguez, A.; Mosquera-Losada, M.R. Classifications and functions of agroforestry systems in Europe. In Agroforestry in Europe; Springer: Dordrecht, The Netherlands, 2009; pp. 21–41. [Google Scholar] [CrossRef]
  21. Bisht, N.; Sah, V.K.; Satyawali, K.; Tewari, S.; Kandpal, G. Assessment of soil quality and wheat yield under open and poplar based farming system in Tarai region of Uttarakhand. Indian J. Agric. Res. 2018, 52, 101–103. [Google Scholar] [CrossRef]
  22. Kay, S.; Crous-Duran, J.; Ferreiro-Domínguez, N.; De Jalón, S.G.; Graves, A.; Moreno, G.; Szerencsits, E. Spatial similarities between European agroforestry systems and ecosystem services at the landscape scale. Agrofor. Syst. 2018, 1–15. [Google Scholar] [CrossRef] [Green Version]
  23. Jo, H.K.; Park, H.M. Effects of Windbreak Planting on Crop Productivity for Agroforestry Practices in a Semi-Arid Region. J. For. Environ. Sci. 2017, 33, 348–354. [Google Scholar] [CrossRef]
  24. Schroth, G.; Sinclair, F.L. (Eds.) Trees, Crops, and Soil Fertility: Concepts and Research Methods; Cabi: Wallingford, UK, 2003. [Google Scholar]
  25. Tscharntke, T.; Clough, Y.; Bhagwat, S.A.; Buchori, D.; Faust, H.; Hertel, D.; Scherber, C. Multifunctional shade-tree management in tropical agroforestry landscapes—A review. J. Appl. Ecol. 2011, 48, 619–629. [Google Scholar] [CrossRef] [Green Version]
  26. Jose, S. Agroforestry for ecosystem services and environmental benefits: An overview. Agrofor. Syst. 2009, 76, 1–10. [Google Scholar] [CrossRef]
  27. Mbow, C.; Smith, P.; Skole, D.; Duguma, L.; Bustamante, M. Achieving mitigation and adaptation to climate change through sustainable agroforestry practices in Africa. Curr. Opin. Environ. Sustain. 2014, 6, 8–14. [Google Scholar] [CrossRef] [Green Version]
  28. Pinho, R.C.; Miller, R.P.; Alfaia, S.S. Agroforestry and the improvement of soil fertility: A view from Amazonia. Appl. Environ. Soil Sci. 2012, 1–11. [Google Scholar] [CrossRef]
  29. Jezeer, R.E.; Santos, M.J.; Boot, R.G.; Junginger, M.; Verweij, P.A. Effects of shade and input management on economic performance of small-scale Peruvian coffee systems. Agric. Sys. 2018, 162, 179–190. [Google Scholar] [CrossRef]
  30. Santos, P.Z.F.; Crouzeilles, R.; Sansevero, J.B.B. Can agroforestry systems enhance biodiversity and ecosystem service provision in agricultural landscapes? A meta-analysis for the Brazilian Atlantic Forest. Forest. Ecol. Manag. 2019, 433, 140–145. [Google Scholar] [CrossRef]
  31. Mbow, C.; Van Noordwijk, M.; Luedeling, E.; Neufeldt, H.; Minang, P.A.; Kowero, G. Agroforestry solutions to address food security and climate change challenges in Africa. Curr. Opin. Environ. Sustai. 2014, 6, 61–67. [Google Scholar] [CrossRef] [Green Version]
  32. Sida, T.S.; Baudron, F.; Kim, H.; Giller, K.E. Climate-smart agroforestry: Faidherbia albida trees buffer wheat against climatic extremes in the Central Rift Valley of Ethiopia. Agric. For. Meteorol. 2018, 248, 339–347. [Google Scholar] [CrossRef]
  33. Kuyah, S.; Whitney, C.W.; Jonsson, M.; Sileshi, G.W.; Öborn, I.; Muthuri, C.W.; Luedeling, E. Agroforestry delivers a win-win solution for ecosystem services in sub-Saharan Africa. A meta-analysis. Agron. Sustain. Dev. 2019, 39, 47. [Google Scholar] [CrossRef] [Green Version]
  34. Daoui, K.; Fatemi, Z.E.A. Agroforestry systems in Morocco: The case of olive tree and annual crops association in Sais region. In Science, Policy and Politics of Modern Agricultural System; Springer: Dordrecht, The Netherlands, 2014; pp. 281–289. [Google Scholar]
  35. Rao, K.P.C.; Verchot, L.V.; Laarman, J. Adaptation to climate change through sustainable management and development of agroforestry systems. J. SAT Agric. Res. 2007, 4, 1–30. [Google Scholar]
  36. Francis, G.; Oliver, J.; Mulpuri, S. High yielding and trait specific genotypes and genetic associations among yield and yield contributing traits in Jatropha curcas L. Agrofor. Syst. 2018, 92, 1417–1436. [Google Scholar] [CrossRef]
  37. Valencia, V.; García-Barrios, L.; Sterling, E.J.; West, P.; Meza-Jiménez, A.; Naeem, S. Smallholder response to environmental change: Impacts of coffee leaf rust in a forest frontier in Mexico. Land Use Policy 2018, 79, 463–474. [Google Scholar] [CrossRef]
  38. Ong, C.K.; Black, C.; Wilson, J. (Eds.) Tree-Crop Interactions: Agroforestry in a Changing Climate; CABI: Wallingford, UK, 2015. [Google Scholar]
  39. Thomas, S.C.; Halim, M.A.; Gale, N.V.; Sujeeun, L. Biochar enhancement of facilitation effects in agroforestry: Early growth and physiological responses in a maize-leucaena model system. Agrofor. Syst. 2018, 1–13. [Google Scholar] [CrossRef]
  40. Youkhana, A.H.; Idol, T.W. Leucaena-KX2 mulch additions increase growth, yield and soil C and N in a managed full-sun coffee system in Hawaii. Agrofor. Syst. 2016, 90, 325–337. [Google Scholar] [CrossRef]
  41. Mokgolodi, N.C.; Setshogo, M.P.; Shi, L.L.; Liu, Y.J.; Ma, C. Achieving food and nutritional security through agroforestry: A case of Faidherbia albida in sub-Saharan Africa. For. Stud. China 2011, 13, 123–131. [Google Scholar] [CrossRef]
  42. Sileshi, G.W. The magnitude and spatial extent of influence of Faidherbia albida trees on soil properties and primary productivity in drylands. J. Arid Environ. 2016, 132, 1–14. [Google Scholar] [CrossRef]
  43. Suárez, L.R.; Salazar, J.C.S.; Casanoves, F.; Bieng, M.A.N. Cacao agroforestry systems improve soil fertility: Comparison of soil properties between forest, cacao agroforestry systems, and pasture in the Colombian Amazon. Agric. Ecosyst. Environ. 2021, 314, 107349. [Google Scholar] [CrossRef]
  44. Deheuvels, O.; Avelino, J.; Somarriba, E.; Malezieux, E. Vegetation structure and productivity in cocoa-based agroforestry systems in Talamanca, Costa Rica. Agric. Ecosyst. Environ. 2012, 149, 181–188. [Google Scholar] [CrossRef]
  45. Deheuvels, O.; Rousseau, G.X.; Quiroga, G.S.; Franco, M.D.; Cerda, R.; Mendoza, S.J.V.; Somarriba, E. Biodiversity is affected by changes in management intensity of cocoa-based agroforests. Agrofor. Syst. 2014, 88, 1081–1099. [Google Scholar] [CrossRef]
  46. Lin, B.B. The role of agroforestry in reducing water loss through soil evaporation and crop transpiration in coffee agroecosystems. Agric. For. Meteorol. 2010, 150, 510–518. [Google Scholar] [CrossRef]
  47. Fagerholm, N.; Torralba, M.; Burgess, P.J.; Plieninger, T. A systematic map of ecosystem services assessments around European agroforestry. Ecol. Indic. 2016, 62, 47–65. [Google Scholar] [CrossRef]
  48. Panozzo, A.; Bernazeau, B.; Desclaux, D. Durum wheat in organic olive orchard: Good deal for the farmers? Agrofor. Syst. 2019, 1–11. [Google Scholar] [CrossRef]
  49. Panozzo, A.; Huang, H.; Bernazeau, B.; Vamerali, T.; Samson, M.F.; Desclaux, D. Morphology, phenology, yield, and quality of durum wheat cultivated within organic olive orchards of the Mediterranean area. Agronomy 2020, 10, 1789. [Google Scholar] [CrossRef]
  50. Delteil, A.; Gobbato, E.; Cayrol, B.; Estevan, J.; Michel-Romiti, C.; Dievart, A. Several wall-associated kinases participate positively and negatively in basal defense against rice blast fungus. BMC Plant Biol. 2016, 16, 17. [Google Scholar] [CrossRef]
  51. Mycocalc Software; Institut National de la Recherche Agronomique. Available online: https://www2.dijon.inra.fr/mychintec/Mycocalc-prg/download.html (accessed on 30 January 2022).
  52. Huler, S. Defining the Wind: The Beaufort Scale and How a 19th-Century Admiral Turned Science into Poetry; Crown: New York, NY, USA, 2007. [Google Scholar]
  53. Lin, B.B. Agroforestry management as an adaptive strategy against potential microclimate extremes in coffee agriculture. Agric. For. Meteorol. 2007, 144, 85–94. [Google Scholar] [CrossRef]
  54. Gosme, M.; Inurreta-Aguirre, H.D.; Dupraz, C. Microclimatic effect of agroforestry on diurnal temperature cycle. In Proceedings of the 3rd European Agroforestry Conference, European Agroforestry Federation, Montpellier, France, 23–25 May 2016; pp. 183–186. [Google Scholar]
  55. Kanzler, M.; Böhm, C.; Mirck, J.; Schmitt, D.; Veste, M. Microclimate effects on evaporation and winter wheat (Triticum aestivum L.) yield within a temperate agroforestry system. Agrofor. Syst 2019, 93, 1821–1841. [Google Scholar] [CrossRef]
  56. García, G.A.; Dreccer, M.F.; Miralles, D.J.; Serrago, R.A. High night temperatures during grain number determination reduce wheat and barley grain yield: A field study. Glob. Chang. Boil. 2015, 21, 4153–4164. [Google Scholar] [CrossRef]
  57. Grant, C.E.; Bailey, T.L.; Noble, W.S. FIMO: Scanning for occurrences of a given motif. Bioinformatics 2011, 27, 1017–1018. [Google Scholar] [CrossRef] [Green Version]
  58. Bos, H.J.; Neuteboom, J.H. Morphological analysis of leaf and tiller number dynamics of wheat (Triticum aestivum L.): Responses to temperature and light intensity. Ann. Bot. 1998, 81, 131–139. [Google Scholar] [CrossRef]
  59. Thorne, G.N.; Wood, D.W. Effects of radiation and temperature on tiller survival, grain number and grain yield in winter wheat. Ann. Bot. 1987, 59, 413–426. [Google Scholar] [CrossRef]
  60. Lin, B.B. Coffee (Cafe arabica var. Bourbon) fruit growth and development under varying shade levels in the Soconusco Region of Chiapas, Mexico. J. Sustain. Agric. 2009, 33, 51–65. [Google Scholar] [CrossRef]
  61. Jose, S.; Gillespie, A.R.; Pallardy, S.G. Interspecific interactions in temperate agroforestry. Agrofor. Syst. 2004, 61, 237–255. [Google Scholar] [CrossRef]
  62. Smith, J.; Pearce, B.D.; Wolfe, M.S. Reconciling productivity with protection of the environment: Is temperate agroforestry the answer? Renew. Agric. Food Syst. 2013, 28, 80–92. [Google Scholar] [CrossRef]
  63. Ong, W.Y.; Mackie, K. A light and electron microscopic study of the CB1 cannabinoid receptor in the primate spinal cord. J. Neurocytol. 1999, 28, 39–45. [Google Scholar] [CrossRef]
  64. Schoeneberger, M.; Bentrup, G.; De Gooijer, H.; Soolanayakanahally, R.; Sauer, T.; Brandle, J. Branching out: Agroforestry as a climate change mitigation and adaptation tool for agriculture. J. Soil Water Conserv. 2012, 67, 128A–136A. [Google Scholar] [CrossRef] [Green Version]
  65. Filella, I.; Peñuelas, J. Partitioning of water and nitrogen in co-occurring Mediterranean woody shrub species of different evolutionary history. Oecologia 2003, 137, 51–61. [Google Scholar] [CrossRef]
  66. Eliades, M.; Bruggeman, A.; Djuma, H.; Lubczynski, M. Tree water dynamics in a semi-arid Pinus brutia forest. Water 2018, 10, 1039. [Google Scholar] [CrossRef] [Green Version]
  67. Sun, S.J.; Meng, P.; Zhang, J.S.; Wan, X. Hydraulic lift by Juglans regia relates to nutrient status in the intercropped shallow-root crop plant. Plant Soil 2014, 374, 629–641. [Google Scholar] [CrossRef]
  68. Gillespie, A.R.; Jose, S.; Mengel, D.B.; Hoover, W.L.; Pope, P.E.; Seifert, J.R. Defining competition vectors in a temperate alley cropping system in the midwestern USA: 1. Production physiology. Agrofor. Syst. 2000, 48, 25–40. [Google Scholar] [CrossRef]
  69. Wanvestraut, R.H.; Jose, S.; Nair, P.R.; Brecke, B.J. Competition for water in a pecan (Carya illinoensis K. Koch)–cotton (Gossypium hirsutum L.) alley cropping system in the southern United States. Agrofor. Syst. 2004, 60, 167–179. [Google Scholar] [CrossRef]
  70. Miller, A.W.; Pallardy, S.G. Resource competition across the crop-tree interface in a maize-silver maple temperate alley cropping stand in Missouri. Agrofor. Syst. 2001, 53, 247–259. [Google Scholar] [CrossRef]
  71. Dal Cortivo, C.; Barion, G.; Ferrari, M.; Visioli, G.; Dramis, L.; Panozzo, A.; Vamerali, T. Effects of field inoculation with VAM and bacteria consortia on root growth and nutrients uptake in common wheat. Sustainability 2018, 10, 3286. [Google Scholar] [CrossRef] [Green Version]
  72. Zake, J.; Pietsch, S.A.; Friedel, J.K.; Zechmeister-Boltenstern, S. Can agroforestry improve soil fertility and carbon storage in smallholder banana farming systems? J. Plant Nutr. Soil Sci. 2015, 178, 237–249. [Google Scholar] [CrossRef]
  73. Hachiya, T.; Sakakibara, H. Interactions between nitrate and ammonium in their uptake, allocation, assimilation, and signalling in plants. J. Exp. Bot. 2017, 68, 2501–2512. [Google Scholar] [CrossRef]
  74. Peichl, M.; Thevathasan, N.V.; Gordon, A.M.; Huss, J.; Abohassan, R.A. Carbon sequestration potentials in temperate tree-based intercropping systems, southern Ontario, Canada. Agrofor. Syst. 2006, 66, 243–257. [Google Scholar] [CrossRef]
  75. Jose, S.; Gillespie, A.R.; Seifert, J.R.; Mengel, D.B.; Pope, P.E. Defining competition vectors in a temperate alley cropping system in the midwestern USA: 3. Competition for nitrogen and litter decomposition dynamics. Agrofor. Syst. 2000, 48, 61–77. [Google Scholar] [CrossRef]
  76. Benbi, D.K.; Khosa, M.K. Effects of temperature, moisture, and chemical composition of organic substrates on C mineralization in soils. Commun. Soil Sci. Plant Anal. 2014, 45, 2734–2753. [Google Scholar] [CrossRef]
  77. Querné, A.; Battie-laclau, P.; Dufour, L.; Wery, J.; Dupraz, C. Effects of walnut trees on biological nitrogen fixation and yield of intercropped alfalfa in a Mediterranean agroforestry system. Eur. J. Agron. 2017, 84, 35–46. [Google Scholar] [CrossRef]
  78. Jeffries, P.; Gianinazzi, S.; Perotto, S.; Turnau, K.; Barea, J.M. The contribution of arbuscular mycorrhizal fungi in sustainable maintenance of plant health and soil fertility. Biol. Fertil. Soils 2003, 37, 1–16. [Google Scholar] [CrossRef]
  79. Smith, S.E.; Read, D.J. Mycorrhizal Symbiosis; Academic Press: Cambridge, MA, USA, 2010. [Google Scholar]
  80. Laurindo, L.K.; de Souza, T.A.F.; da Silva, L.J.R.; Casal, T.B.; de Jesus Conceição Pires, K.; Kormann, S.; Siminski, A. Arbuscular mycorrhizal fungal community assembly in agroforestry systems from the Southern Brazil. Biologia 2021, 76, 1099–1107. [Google Scholar] [CrossRef]
  81. da Silva Maia, R.; Vasconcelos, S.S.; Viana-Junior, A.B.; Castellani, D.C.; Kato, O.R. Oil palm (Elaeis guineensis) shows higher mycorrhizal colonization when planted in agroforestry than in monoculture. Agrofor. Syst. 2021, 95, 731–740. [Google Scholar] [CrossRef]
  82. Bainard, L.D.; Klironomos, J.N.; Gordon, A.M. Arbuscular mycorrhizal fungi in tree-based intercropping systems: A review of their abundance and diversity. Pedobiologia 2011, 54, 57–61. [Google Scholar] [CrossRef]
  83. De Carvalho, A.M.X.; de Castro Tavares., R.; Cardoso, I.M.; Kuyper, T.W. Mycorrhizal Associations in Agroforestry Systems. In Soil Biology and Agriculture in the Tropics; Dion, P., Ed.; Springer: Berlin/Heidelberg, Germany, 2010; Volume 21. [Google Scholar] [CrossRef]
  84. Shukla, A.; Kumar, A.; Chaturvedi, O.P.; Nagori, T.; Kumar, N.; Gupta, A. Efficacy of rhizobial and phosphate-solubilizing bacteria and arbuscular mycorrhizal fungi to ameliorate shade response on six pulse crops. Agrofor. Syst. 2018, 92, 499–509. [Google Scholar] [CrossRef]
  85. Dobo, B.; Asefa, F.; Asfaw, Z. Effect of tree-enset-coffee based agro-forestry practices on arbuscular mycorrhizal fungi (AMF) species diversity and spore density. Agrofor. Syst. 2018, 92, 525–540. [Google Scholar] [CrossRef]
  86. Isaac, M.E.; Borden, K.A. Nutrient acquisition strategies in agroforestry systems. Plant Soil 2019, 444, 1–19. [Google Scholar] [CrossRef]
  87. Chifflot, V.; Rivest, D.; Olivier, A.; Cogliastro, A.; Khasa, D. Molecular analysis of arbuscular mycorrhizal community structure and spores distribution in tree-based intercropping and forest systems. Agric. Ecosyst. Environ. 2009, 131, 32–39. [Google Scholar] [CrossRef]
  88. Rillig, M.C.; Aguilar-Trigueros, C.A.; Bergmann, J.; Verbruggen, E.; Veresoglou, S.D.; Lehmann, A. Plant root and mycorrhizal fungal traits for understanding soil aggregation. New Phytol. 2015, 205, 1385–1388. [Google Scholar] [CrossRef]
  89. Li, F.; Meng, P.; Fu, D.; Wang, B. Light distribution, photosynthetic rate and yield in a Paulownia-wheat intercropping system in China. Agrofor. Syst. 2008, 74, 163–172. [Google Scholar] [CrossRef]
  90. Dufour, L.; Metay, A.; Talbot, G.; Dupraz, C. Assessing light competition for cereal production in temperate agroforestry systems using experimentation and crop modelling. J. Agron. Crop Sci. 2013, 199, 217–227. [Google Scholar] [CrossRef]
  91. Yang, T.; Duan, Z.P.; Zhu, Y.; Gan, Y.W.; Wang, B.J.; Hao, X.D.; Li, L.H. Effects of distance from a tree line on photosynthetic characteristics and yield of wheat in a jujube tree/wheat agroforestry system. Agrofor. Syst. 2019, 93, 1545–1555. [Google Scholar] [CrossRef]
  92. Li, H.; Jiang, D.; Wollenweber, B.; Dai, T.; Cao, W. Effects of shading on morphology, physiology and grain yield of winter wheat. Eur. J. Agron. 2010, 33, 267–275. [Google Scholar] [CrossRef]
  93. Artru, S.; Garré, S.; Dupraz, C.; Hiel, M.P.; Blitz-Frayret, C.; Lassois, L. Impact of spatio-temporal shade dynamics on wheat growth and yield, perspectives for temperate agroforestry. Eur. J. Agron. 2017, 82, 60–70. [Google Scholar] [CrossRef]
  94. Dupraz, C.; Blitz-Frayret, C.; Lecomte, I.; Molto, Q.; Reyes, F.; Gosme, M. Influence of latitude on the light availability for intercrops in an agroforestry alley-cropping system. Agrofor. Syst. 2018, 92, 1019–1033. [Google Scholar] [CrossRef]
  95. Yang, L.; Ding, X.; Liu, X.; Li, P.; Eneji, A.E. Impacts of long-term jujube tree/winter wheat–summer maize intercropping on soil fertility and economic efficiency—A case study in the lower North China Plain. Eur. J. Agron. 2016, 75, 105–117. [Google Scholar] [CrossRef]
  96. Carrier, M.; Gonzalez, F.A.R.; Cogliastro, A.; Olivier, A.; Vanasse, A.; Rivest, D. Light availability, weed cover and crop yields in second generation of temperate tree-based intercropping systems. Field Crops Res. 2019, 239, 30–37. [Google Scholar] [CrossRef]
  97. Pardon, P.; Reubens, B.; Mertens, J.; Verheyen, K.; De Frenne, P.; De Smet, G.; Reheul, D. Effects of temperate agroforestry on yield and quality of different arable intercrops. Agric. Syst. 2018, 166, 135–151. [Google Scholar] [CrossRef]
  98. Desclaux, D. Participatory Ecobreeding for Agroecology. In Proceedings of the “Innovative Research for Organic 3.0” 19th Organic World Congress, New Delhi, India, 9–11 November 2017; Volume 2, p. 654. [Google Scholar]
Figure 1. Photosynthetic active radiation (PAR; µmol s−1 m−2; mean ± S.E.) recorded in three treatments (C = Control, AF = yearly pruned olive grove, AF+ = never pruned olive grove) during 2015–16 (left) and 2016–17 (right) wheat-growing seasons at stem elongation (from sowing to 7 April), heading and anthesis (from 8 April to 10 May), and maturity (from 11 May to harvesting). Numbers above histograms indicate the percentage variation as compared to controls within each wheat cycle period. Within the same period and year, different letters indicate significant differences according to the Tukey’s HSD test (p ≤ 0.05).
Agronomy 12 00527 g001
Figure 2. Hourly dynamics of air temperature (temp; left) and relative humidity (RH; right) recorded in C and AF treatments expressed as AF and C difference: temp.AF-temp.C (°C) and RH.AF-RH.C (%) for each hour of the day during the 2016–17 wheat growing season, from sowing to harvesting. Above the x axis, day length is divided into 3 intervals: Time1 = 12 pm–5 am, Time2 = 6 am–12 am, Time3 = 1 pm–11 pm. For each hour of the day, asterisks indicate a significant difference between values recorded in C and AF treatments (p ≤ 0.05).
Agronomy 12 00527 g002
Figure 3. Soil water potential as hourly average pressure potential (KPa) recorded by tensiometers placed in the three treatments (C, AF and AF+) at four soil depths, i.e., 30 (top-left), 60 (top-right), 90 (bottom-left) and 110 (bottom-right) cm, during the 2nd year (2016–17) wheat growing season. Timeline in the x axis is divided into three wheat cycle periods: stem elongation (Stem elong) (from sowing to 7 April), heading and anthesis (Head_Anth) (from 8 April to 10 May) and maturity (Mat) (from 11 May to harvesting). The secondary vertical axis indicates daily rainfall (mm) within the same period.
Agronomy 12 00527 g003
Figure 4. Soil water potential as hourly average pressure potential (KPa) recorded by tensiometers placed in the three treatments (C, AF and AF+) at four soil depths, i.e., 30 (top-left), 60 (top-right), 90 (bottom-left) and 110 (bottom-right) cm, during the 1st year (2015–16) wheat growing season. Timeline in the x axis is divided into three periods: stem elongation (Stem elong) (from sowing to 7 April; data not available in 2015–16), heading and anthesis (Head_Anth) (from 8 April to 10 May) and maturity (Mat) (from 11 May to harvesting). The secondary vertical axis indicates daily rainfall (mm) within the same period.
Agronomy 12 00527 g004
Figure 5. NH4+ and NO3 concentration (mg Kg−1 TS, TS = total solids; mean ±S.E., n = 13) of the soil samples collected in the three treatments (C, AF and AF+) during February both in 2016 (left) and 2017 (right). Each soil sample was divided into three subsamples according to the depth: 0–30, 30–60 and 60–90 cm. Standard error bars refer to the average NH4+ and NO3 concentration of the entire samples (0–90 cm depth). For each year and each ion, different capital letters indicate significant difference between treatments considering the 0–90 cm soil profile; small letters indicate significant difference between treatments within each of the three-soil subsample (0–30, 30–60 and 60–90 cm), according to Tukey’s HSD test (p ≤ 0.05).
Agronomy 12 00527 g005
Table 1. Average wind speed and number of hours with means and maximum wind speed > 4.7 m s1(17 Km h−1) recorded in C, AF and AF+ treatments within 2016–17 growing season at stem elongation (from sowing to 7 April), heading and anthesis (from 8 April to 10 May) and maturity (from 11 May to harvesting). Within the same cycle period, means with different letters are significantly different according to the Tukey’s HSD test (p ≤ 0.05).
Cycle PeriodWind Speed
MeansHourly Mean
>4.7 m s1
Hourly Max
>4.7 m s1
m s1n. of Hoursn. of Hours
CAFAF+CAFAF+CAFAF+
Stem elongation2.17 a0.37 b0.01 c277 a11 b0 c1083 a142 b0 c
Heading and anthesis2.03 a0.25 b0.01 c37 a0 b0 b327 a13 b0 b
Maturity1.60 a0.12 b0.01 c9 a0 b0 b347 a6 b0 c
Average2.02 a0.29 b0.01 c323 a11 b0 c1757 a161 b0 c
Table 2. Mycorrhizal colonization of roots (0–30 cm of depth) of durum wheat growing in the three treatments (C, AF and AF+) collected at heading stage in 2017, expressed as: frequency of mycorrhiza in the root system (% of colonized fragments), intensity of mycorrhizal colonization (% of fragment length colonized) and arbuscular abundance (% of fragment length with arbuscular presence) (n = 18). Average results in AF and AF+ treatments are expressed also in percentage variation as compared to the C treatment. Within a column, means with different letters are significantly different according to Tukey’s HSD test (p ≤ 0.05).
TreatmentFrequencyIntensityArbuscular Abundance
Mean (%)%var./CMean (%)%var./CMean (%)%var./C
C96.4 b 43.8 b 17.2 b
AF100.0 a+4%66.0 a+51%30.0 a+74%
AF+99.8 a+4%61.7 a+41%28.6 a+66%
Table 3. Yield and yield components of the durum wheat cultivar 1 in three treatments (C, AF and AF+), as the average of 2015–16 and 2016–17 wheat growing seasons (n = 4). TGW: thousand-grain weight. Yield and yield components in AF and AF+ treatments are also expressed as percentage variation vs. controls. Means with different letters are significantly different according to the Tukey’s HSD test (p ≤ 0.05).
TreatmentYieldTillers/PlantSpikes/PlantGrains/SpikeTGWOne Plant Biomass
t ha−1% var./Cn.% var./Cn.% var./Cn.% var./Cg% var./Cg DM% var./C
C1.6 a 2.4 a 2.1 a 27.2 a 52.0 ab 119.9 a
AF0.8 ab–50%1.8 ab–26%1.5 a–27%4.3 b–84%58.1 a+12%31.1 b–74%
AF+0.4 b–76%1.4 b–39%1.1 a–49%4.6 b–83%36.6 b–30%23.6 b–80%
Publisher’s Note: MDPI stays neutral with regard to jurisdictional claims in published maps and institutional affiliations.

