Article

How Does Nitrogen Application Rate Affect Plant Functional Traits and Crop Growth Rate of Perennial Ryegrass-Dominated Permanent Pastures?

1
Grass and Forage Science/Organic Agriculture, Institute of Crop Science and Plant Breeding, Christian-Albrechts-University, 24118 Kiel, Germany
2
Grass Based Dairy Systems, Animal Production Systems Group, Wageningen University, 6708 WD Wageningen, The Netherlands
*
Author to whom correspondence should be addressed.
Agronomy 2021, 11(12), 2499; https://doi.org/10.3390/agronomy11122499
Submission received: 29 October 2021 / Revised: 30 November 2021 / Accepted: 6 December 2021 / Published: 9 December 2021
(This article belongs to the Section Grassland and Pasture Science)

Abstract

:
High doses of nitrogen (N) fertiliser input on permanent pastures are crucial in terms of N surplus and N losses. Quantitative analyses of the response of plant functional traits (PFT) driving crop growth rate (CGR) under low N input are lacking in frequently defoliated pastures. This study aimed to understand the significance of PFTs for productivity and N uptake in permanent grasslands by measuring dynamics in tiller density (TD), tiller weight (TW), leaf weight ratio (LWR), leaf area index (LAI), specific leaf area (SLA), as well as leaf N content per unit mass (LNCm) and per unit area (LNCa) in perennial ryegrass (Lolium perenne)-dominated pastures, in a simulated rotational grazing approach over two consecutive growing seasons. Annual N application rates were 0, 140 and 280 kg N ha−1. The phenological development of perennial ryegrass was the main driver of CGR, N uptake and most PFTs. The effect of N application rate on PFTs varied during the season. N application rate showed the greatest effect on TD, LAI and, to a lesser extent, on SLA and LNCm. The results of this study highlight the importance of TD and its role in driving CGR and N uptake in frequently defoliated permanent pastures.

1. Introduction

In temperate regions of Europe, perennial ryegrass (Lolium perenne) is the most common grass species used as forage for milk production, due to its high feeding quality and dry matter (DM) yield potential. However, both high nutritive value and DM yield require an adequate availability of nitrogen [1,2,3]. This is often realised by high inputs of nitrogen (N) fertiliser. Nonetheless, nitrogen use efficiency in dairy production systems is low [4,5,6] and high N inputs are a key factor for N surpluses and N leaching losses under permanent pastures [3,7]. Grass swards with higher plant N uptake showed significantly lower N leaching losses [7]. N uptake of fertilised grass swards is mainly driven by crop growth rate (CGR) [8]. Hence, further insights into the elements forming CGR in grass plants can help to understand dynamics of N uptake in response to N application rate in permanent pastures. Quantitative knowledge regarding the effects of fertiliser application is important to define sustainable and productive management strategies in grass-based production systems. This is crucial to reduce N surpluses, N losses and fulfil legislative requirements, e.g., EU Water Framework Directive [9] and EU Nitrates Directive [10].
In intensively grazed permanent pastures, plants are exposed to abiotic stress by high defoliation frequencies. Plant functional traits (PFTs) interact at plant and sward level, creating complex behavioural responses to variations in management strategies, such as defoliation frequency or nutrient supply [11,12]. For example, frequent defoliation results in low sward heights enabling light to reach the lower strata of the sward, which triggers the growth of new tillers [13]. The higher tiller density (TD) is usually compensated by the formation of small individual tillers [12,13,14]. Higher leaf area per leaf mass (specific leaf area, SLA) or higher leaf N content (LNC) both reflect a strategy to increase radiation absorption and net photosynthesis rates during short regrowth periods [8,15,16]. C and N allocation between different parts of the plant are key factors for N uptake [8]. Furthermore, the phenological development stage of the plant affects the expression of other functional traits; during reproductive growth, stem elongation lowers the ratio of leaf mass to plant mass (leaf weight ratio, LWR) [17]. Less self-shading due to stem elongation can also increase the leaf area index (LAI) [11].
Quantitative analyses of PFTs at sward and plant level are lacking in frequently defoliated pastures. Previous studies analysing PFTs in managed grasslands are limited to a comparison of grass species [18,19], the general importance of PFTs for grassland ecology and ecosystems [20,21], or focus on single individual PFTs such as TD [22] or the effect of PFTs on forage quality [23]. Furthermore, the effect of N application rate on the expression and development of PFTs in grass swards were rarely studied. Van Arendonk et al. [24] reported a higher SLA with higher nitrogen supply in four grasses of the Poa species. Trifolium repens seedlings also showed a higher SLA and a higher LNC with higher N application rates [25]. To our knowledge, no previous studies conducted quantitative analyses of various PFTs and their responses to N application rate in frequently defoliated permanent grasslands. This type of data can be valuable for broadening the current knowledge of growth processes in commercially managed grasslands and assisting in the rational identification of optimum N application rates.
This study examined the effect of N application rate on dynamics in PFT expression of perennial ryegrass-dominated pastures at sward and plant level, over two entire vegetation periods in a simulated grazing approach. The objective was to determine and understand the significance of individual PFTs for growth rate and N uptake at different levels of N application. We hypothesized that the observed traits vary considerably in response to N application rate.

2. Materials and Methods

2.1. Site Conditions

The experiment was conducted on permanent grassland pasture of a commercial dairy farm during the growing seasons of 2016 and 2017, in northern Germany (54°27′33.0″ N 10°00′07.6″ E). The soil type was Luvisol soil with a sandy-loam texture (14.8% clay, 24.2% silt and 61.0% sand), a usable field capacity of 80 mm (0–30 cm), and a low soil C/N ratio of 10. The grasslands were used for intensive forage production, mainly under grazing, for more than 20 years. Weather data were obtained from the weather station, Kiel-Holtenau, near the experimental site, by the German National Meteorological Service (DWD). Growing degree days (GDD) were calculated as the sum of the mean daily temperatures (Tmean) in a period; where Tmean is above the base temperature of 5 °C (Tbase) (GDD = ∑ Tmean − Tbase, if Tmean > Tbase).

2.2. Experimental Setup

Within the pastures, the experimental area (31 m × 19 m) was excluded from grazing and comprised 36 plots (1.5 m × 5 m) arranged in a randomized complete block design. In each block, four plots per treatment represented the series consecutively sampled after the methodology described by Corrall and Fenlon [26]. In each year, experimental sites for the measurement of each PFT under simulated grazing were moved within the farm pastures to an area grazed by dairy cows in the previous year in order to demonstrate responses of PFTs to long-term grazed swards. Due to this procedure, botanical composition varied slightly between years (Figure A1). Plant-specific trait measurements were conducted on the dominating plant species, perennial ryegrass. The experiment comprised the factors (i) N application rate and (ii) time of defoliation within the year. Three N application rates were tested in the present study: 0 (N0), 140 (N1) and 280 kg N ha−1 yr−1 (N2). N1 represented N application rates recommended for pastures according to the current best practice in northern Germany [27]; N2 represented the additional N potentially excreted by grazing dairy cows; N0 was included to determine the N release from the soil. Herbage samples of 4-week-old swards were taken in a weekly pattern, resulting in four plot series for each N application rate [26]. Before the start of each growing season, in week 10 of each year, 300 kg K2O ha−1, 53 kg P2O5 ha−1 and 30 kg S ha−1 were applied to ensure ideal soil fertility conditions [27,28]. Immediately after sampling, each plot was cut with a mower to a height of 4 cm. N application was divided into 8 equal fertiliser applications throughout the growing season. Each plot was fertilised according to the annual requirements of each N application rate with 0 g (N0), 48.6 g (1.75 g N m−2, N1) and 97.2 g (3.5 g N m−2, N2) calcium ammonium nitrate (13.5% nitrate and 13.5% ammonia N) per plot.

2.3. Herbage Production, Nitrogen Content and Nitrogen Uptake

A random cut of approximately 0.25 m2 per plot was made with lawn shears at a height of 4 cm to harvest plant material for the analysis of N content and PFTs. The DM content of the herbage was determined after oven drying at 60 °C for 48 h. The dried material was ground in a centrifugal mill to a size of 1 mm for estimating N content by near-infrared reflectance spectroscopy (NIRS) [29] with a NIRsystem 5000 monochromator (Foss, Silver Spring, USA). The DM yields were estimated non-destructively based on measurements of compressed sward height using a rising plate meter (Filips Manual Folding Platemeter, Jenquip Agriworks Ltd., Feilding, New Zealand) with five measurements per plot, and by applying a formula recommended by Trott et al. [30]:
DM yield (kg DM ha−1) = (208 × compressed sward height (cm)) − 1026.
Mean daily crop growth rate (CGR) was calculated as the moving average of four consecutive series [26]:
CGRt (kg DM ha−1 day−1) = (0.25 × DM yieldt + 0.25 × DM yieldt+1 + 0.25 × DM yieldt+2 + 0.25 × DM yieldt+3)/28 (days);
where t was the week of measurement. The mean N content for each week (NC; g N kg−1 DM) was calculated as the moving average of four consecutive series. Mean daily N uptake (Nupt, kg N ha−1 day−1) was calculated as a product of CGR and NC. Agronomic nitrogen efficiency (ANE; [31]) in N1 and N2 was estimated by subtracting herbage DM produced (kg DM ha−1) without N application from the herbage DM produced with N application (in each N1 and N2) and dividing this by the units of N applied (kg N ha−1).

2.4. Plant Functional Trait Measurements

In weekly intervals, 50 randomly chosen perennial ryegrass tillers per plot were cut at ground level and classified into phenological stages. To determine the mean phenological stage of each sward, the results were expressed as Mean Stage by Count (MSC), calculated with indices recommended by Moore et al. [32]. Tillers were classified into the following categories: leaf development (1.0–1.9), stem elongation (2.15–2.9), floral development (3.0–3.9) and seed development and ripening (4.0–4.9). As no variation in phenological development was observed between the different N application rates later in the season, measurement intervals were scheduled less frequently; either every two or four weeks from August onwards. The mean single tiller DM weight (TW) was calculated as the total tiller DM weight of all classified tillers divided by the number of tillers.
TD was analysed in four-week intervals. At the beginning of the growing season, two metal grids per plot, with 40 sections of 5 cm × 5 cm each, were placed in the sward 4 cm above ground level. In 6 sections in the centre of the grid, all tillers of all present grass species were counted to calculate the number of tillers per m2.
Leaf-related functional trait measurements were analysed in samples of 60–100 g DM of perennial ryegrass plants in four-weekly intervals. After separating each tiller into stem (including leaf sheaths) and leaf blades (hereafter referred to as ‘leaves’), the LWR (g leaf g−1 plant) was examined by weighing the individual plant parts of each sample. The leaf area (cm2) of each sample was measured using a LICOR LI-3000A leaf area meter (LI-COR Biosciences, Lincoln, NE, USA). All leaf samples were dried and processed using the same methods described above to analyse the leaf N content per unit mass (LNCm; g N kg−1 DM). The leaf area and mass of dried leaves of each sample were used to calculate N content per unit leaf area (LNCa), specific leaf area (SLA), and leaf area index (LAI) as follows:
LNCa (g N cm−2) = leaf N (g N)/leaf area (cm2),
SLA (cm2 g−1 DM) = leaf area (cm2)/leaf weight (g DM),
LAI (cm2 cm−2) = (LWR (g g−1) × DM yield (g cm−2)) × SLA (cm2 g−1 DM).

2.5. Statistical Analysis

Statistical analysis was conducted using R (Version 4.1.0, www.r-project.org, last accessed on 8 December 2021). We defined a mixed linear model [33] with N application rate, year, time of defoliation, their interactions as fixed factors and block as a random factor. For annual calculations, the following model was used:
Xjk = µ + Nj + Yk + (NY)jk + bl + ejkl,
where Xjk = the dependent variable, µ = the overall mean, Nj = the fixed effect of the jth N application rate, Yk = the fixed effect of the kth Year, (NK)jk = the fixed effect of the interaction between N application rate and Year, bl = the random effect of the lth blockand ejk = the residual error. For data measured on a weekly or four-weekly basis, the following model was used:
Xjkl = µ + Nj + Yk + Tl + (NY)jk + (NT)jl + (YT)k + (NYT)jkl + bm + ejklm,
where Tl = the fixed effect of the lth time of defoliation in the year. All other abbreviations are the same as above. Based on a graphical residual analysis [34], the data were assumed to be normally distributed and heteroscedastic. Based on this model, we conducted an analysis of variance (ANOVA) to calculate the effects of the fixed factors and their interactions on each dependent variable. Comparisons of means by multiple contrast test were conducted post hoc, to evaluate the effect of N application rate on each variable at different times of the year. The results were presented as means ± standard error. To analyse the relationships between the individual PFTs, CGR and Nupt, a linear regression analysis was conducted with year and N application rate included as random factors.

3. Results

3.1. Climate and Weather

The annual temperature means in the experimental years were higher compared to the long-term average (+0.6 °C in 2016 and +0.5 °C in 2017). GDD per year was 92 °C higher in 2016 compared to 2017 and 138 °C higher compared to the long-term average. Total annual rainfall was 173 mm higher in 2017 compared to 2016 and 135 mm higher compared to the long-term average. During the vegetation period, the monthly rainfall in 2017 was substantially higher than the long-term average, mainly during June and July where rainfall was 48% higher. Total solar radiation was lower than the long-term average during the experimental years (−82 MJ m−2 in 2016 and −106 MJ m−2 in 2017) but was similar between years (Table 1).

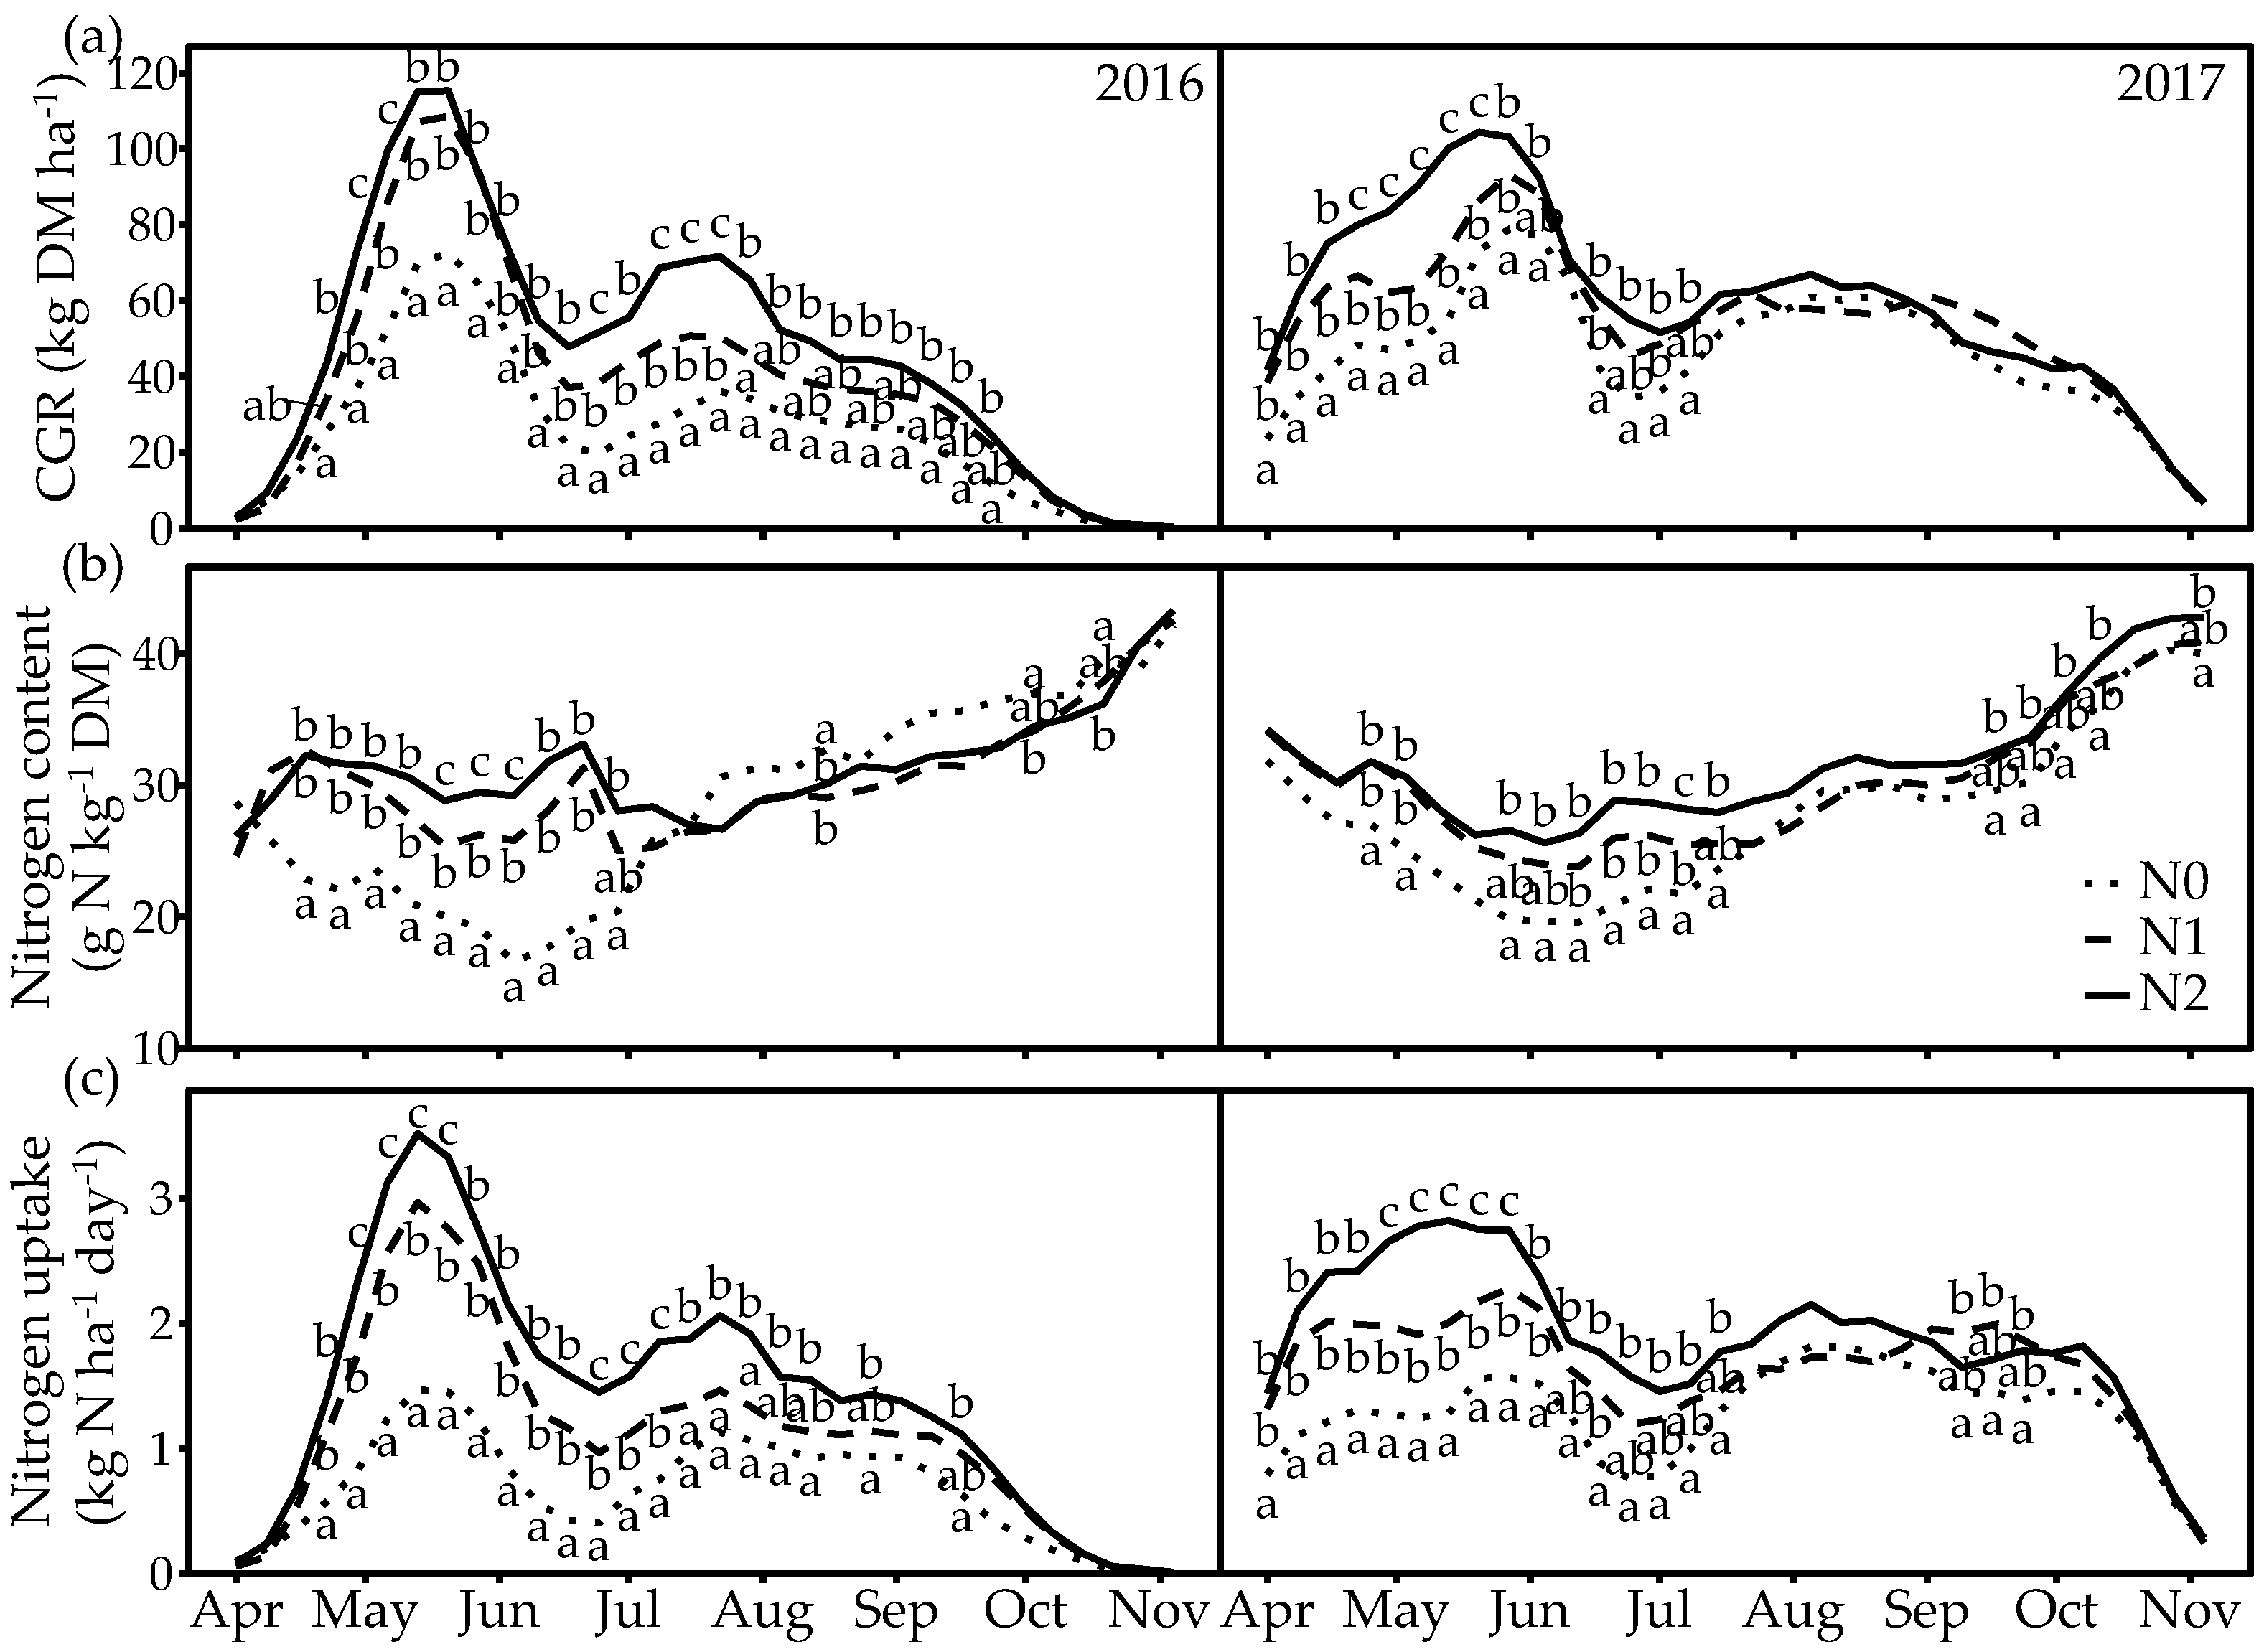
3.2. Herbage Production, Nitrogen Content and Nitrogen Uptake

Annual DM and N yields were, on average, 3.9 t DM ha−1 higher in 2017 compared to 2016 (p ≤ 0.05) in all N application rates. In both years, annual DM and annual N yields were highest in N2 and lowest in N0 (Figure 1). The development of each CGR, NC and Nupt showed a similar general pattern during each of the two vegetation periods (Figure 2). In both years, CGR peaked during the period of stem elongation. On 17 May 2016, CGR was highest in all N application rates with 73 ± 3.4, 109 ± 7.8 and 115 ± 8 kg DM ha−1 day−1 in N0, N1 and N2, respectively. In both years, ANE showed a tendency to be higher in N1 (20.4 and 14.1 kg DM kg−1 N) compared to N2 (16.5 and 11.7 kg DM kg−1 N in 2016 and 2017, respectively; p = 0.07).
In 2017, CGR peaked on 24 May with 79 ± 5.5 (N0) and 93 ± 2.7 kg DM ha−1 day−1 (N1), and, on 17 May 2017, in N2 with 104 ± 6.3 kg DM ha−1 day−1. The greatest differences between N application rates (p ≤ 0.05) were observed during reproductive growth in spring.
The general pattern of NC during the growing season was the opposite of the pattern of CGR, showing a decreasing trend during the reproductive growth period with a subsequent increase and the highest levels towards the end of the growing season. NC ranged between 17 and 46 g N kg−1 DM within the vegetation period. NC was only different between N1 and N2 at a few defoliation events (Figure 2b). Nupt followed the trend of CGR with values ranging between 0.5 and 3.5 kg N ha−1 day−1. Differences between N application rates were greater during the first half of the vegetation period compared to the second half of the vegetation period (Figure 2c).

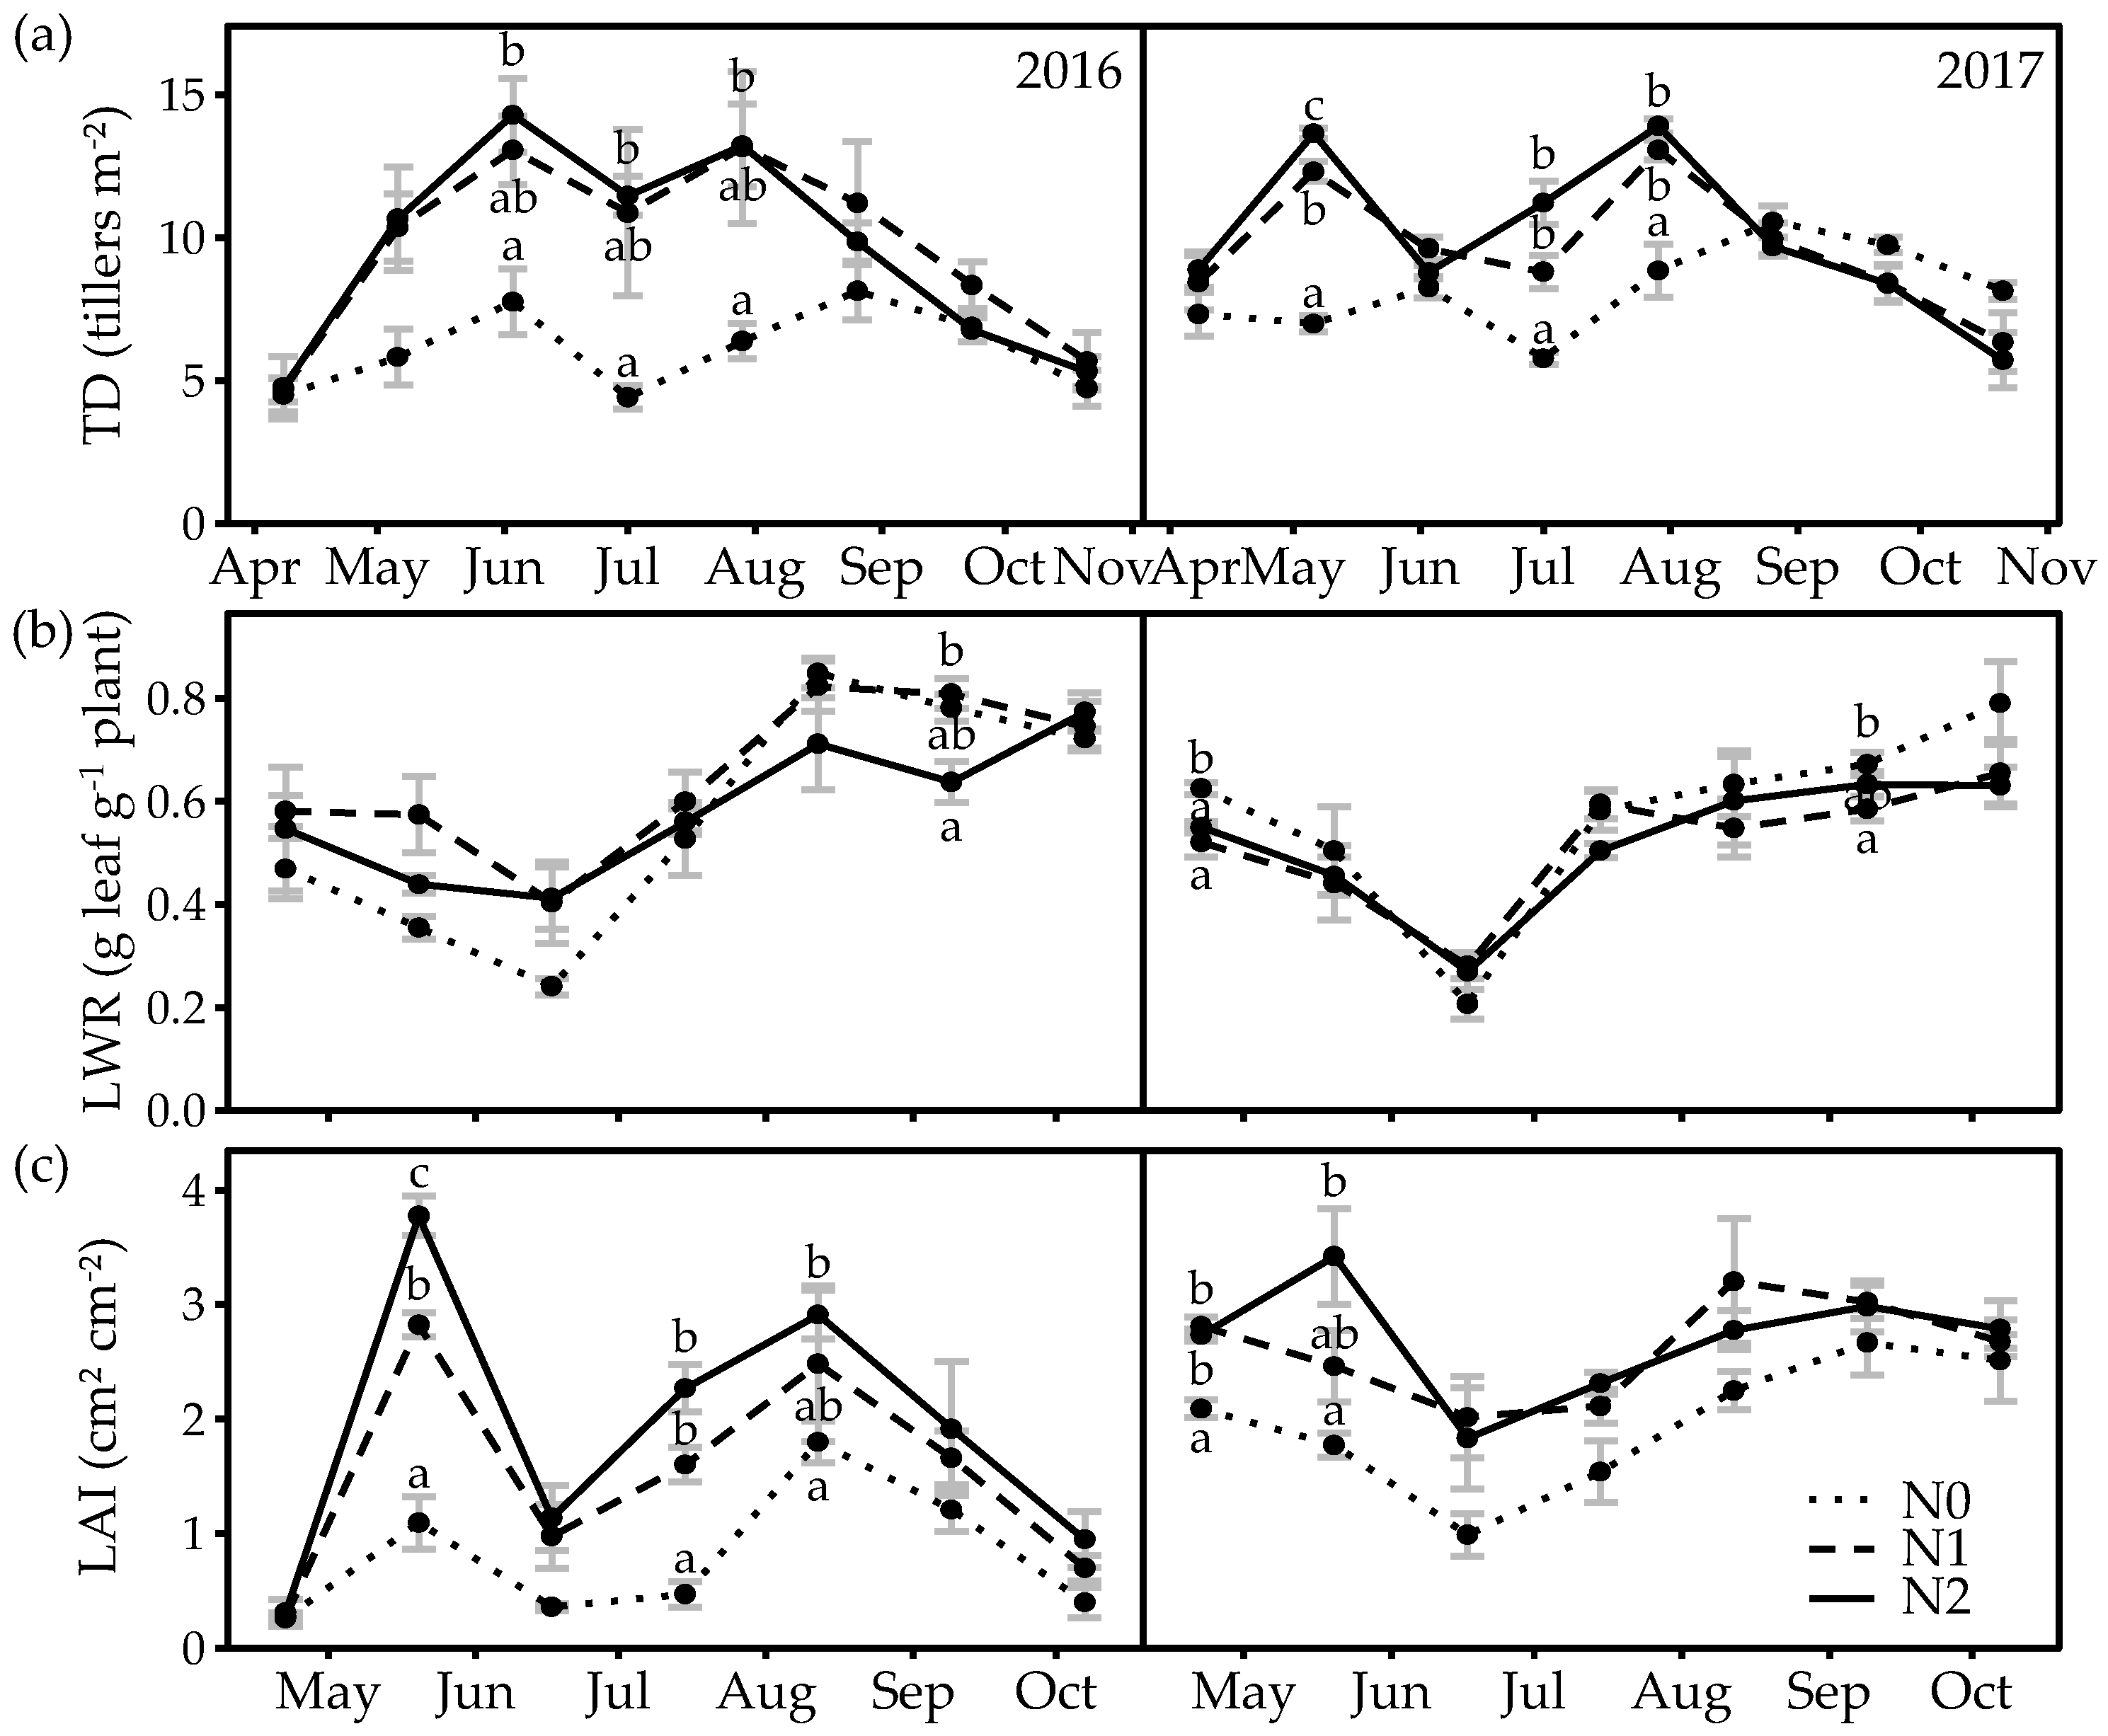
3.3. Phenology and Tiller Weight

The proportion of tillers in the stage of leaf development was highest in the beginning of the vegetation period and decreased during reproductive growth in spring. The number of flowering tillers was low in both years (mainly secondary reproductive tillers). Towards the second half of the vegetation period, the proportion of vegetative tillers increased. MSC peaked on 31 May in 2016 and on 7 June in 2017 (Figure 3a). The MSC remained between 1.6 and 2.3 (leaf development and stem elongation) until mid-August. From mid-August onwards, the MSC remained in the range of vegetative leaf development. There were only small differences between the N application rates in June of both years.
The general trend in TW was similar to the trend in CGR during both vegetation periods, with peak values of 0.137 ± 0.03 g DM tiller−1 in 2017 and 0.135 ± 0.02 g DM tiller−1 in 2016 during reproductive growth and around 0.05 g DM tiller−1 during vegetative growth in both years (Figure 3b).

3.4. Leaf- and Tiller-Related Plant Functional Traits

TD increased at the beginning of stem elongation to values above 13,000 tillers m−2 in N1 and N2 and values of 7755 (2016) and 6988 tillers m−2 (2017) in N0 (Figure 4a). TD declined in early July of 2016 and in June of 2017. A second peak occurred at the end of July in both years. N0 and N2 were mainly different during the summer months. TD in N1 and N2 was not different in 2016 (p > 0.05). At the beginning and the end of the vegetation period, TD was similar between all N application rates (p > 0.05). LWR followed an opposite trend to TW (Figure 4b). The lowest LWRs were observed during reproductive growth in spring with around 0.25 g leaf g−1 plant in 2017 and between 0.21 and 0.31 g leaf g−1 plant in 2016. During vegetative growth, LWR was between 0.5 and 0.8 g leaf g−1 plant. N application rate affected LWR only once at the beginning and towards the end of the vegetation period. LAI followed a more or less similar trend to CGR in both years (Figure 4c). Differences in LAI between N application rates were greatest during the period of reproductive growth in both years, were LAI peaked in all N application rates.
SLA was lowest at the beginning of the vegetation period in both years (Figure 5a). SLA was generally higher in 2017 (272 ± 38 cm2 g−1 DM) compared to 2016 (211 ± 31 cm2 g−1 DM) (p = 0.006) and in N1 and N2 compared to N0. In 2016, LNCm generally increased towards the end of the vegetation period with differences between N application rates mainly found in N0 and N2 (Figure 5b). In 2017, LNCm was on average 8.8 g N kg−1 DM higher than in 2016 (p = 0.02). LNCa ranged between 1.0 and 1.8 g N m−2, with higher values during spring and autumn compared to during mid-season in both years. Differences between N application rates were mainly found in 2016 and in one case in 2017 (Figure 5c).

3.5. Relationships of Each PFT to CGR and Nitrogen Uptake

Each PFT was positively associated with CGR and with Nupt. The strongest relationship between both CGR and Nupt and a PFT was with LAI (Figure 6 and Figure 7). SLA and TD showed a moderate association with both CGR and Nupt. MSC and TW were both more strongly associated with CGR, while the association with Nupt was weak (R2 > 0.22 for CGR vs. R2 < 0.08 for Nupt).

4. Discussion

Understanding the significance of PFTs and their interactions for driving the pattern of CGR on pastures is necessary in order to adapt management strategies for maximising productivity and N use efficiency. This study focused on intensively managed, old, permanent grasslands, predominantly used for grazing by dairy cows for more than two decades, on mineral soils in northern Germany. The abundance of various species in permanent grasslands makes a trait analysis more complex. Thus, we focused on monitoring the functional traits at plant level on perennial ryegrass, as this species is dominant in intensively used, temperate, permanent grasslands. The presence of other species as competitors for nutrients or light was considered indirectly, as the intensity of the competition also affect the expression of PFTs of perennial ryegrass plants.
Weather, sward characteristics and, as a result, herbage production, varied between years in the present study. Beneficial conditions for growth in the spring and autumn of 2017 resulted in higher CGR during these periods and in higher annual DM yields compared to 2016. PFT dynamics also varied between years and between the two areas of the grazed permanent grassland sward. Due to time and staff constraints, individual PFTs were measured at different dates in the present study. Hence, it was not possible to analyse direct interactions between individual PFTs from our dataset. This also explains the variation in datapoints present in the regression analysis. Nonetheless, this study aimed to analyse and determine the significance of each PFT for CGR and Nupt under various and representative conditions, as variations in growth and sward type are typical characteristics of grassland with multiple species.
The relatively high herbage production and Nupt from swards with no N application (N0) in the present study indicated a remarkably high N release due to long-term C and N accumulation in the soil and a close C/N ratio under intensive grazing management. According to Hassink [35] and Soussana and Lemaire [36], old permanent grasslands with a long history of grazing have a high potential for N mineralisation from the soil compared to young grasslands. High than average temperatures combined with sufficient precipitation during the experimental years of the present study further stimulated N mineralisation from the soil. This resulted in relatively high annual DM yields under no or moderate N application of 140 kg N ha−1 yr−1. The high N release from the soil may also explain why there was no significant effect of N application rate (140 vs. 280 kg N ha−1) on ANE. This is confirmed by results reported by Enriquez-Hidalgo et al. [1], who showed a herbage DM production of between 7.4 and 11.4 t DM ha−1 at no N application; between 8.5 and 14.9 t DM at an application rate of 120 kg N ha−1 in grass-only swards; and no effect of N application rate (0 to 240 kg N ha−1) on ANE under similar environmental conditions.

4.1. Seasonal Dynamics in CGR, Nitrogen Uptake and PFTs

Changes in the development of CGR were mainly driven by the phenological development (MSC) of perennial ryegrass plants in our study. During reproductive growth, stem elongation reduces self-shading and increases photosynthetic rates due to a higher radiation absorption [11]. The dynamics of CGR, NC and Nupt in the present study reflect the typical seasonal patterns observed in frequently defoliated, temperate grasslands [7,37,38,39]. Our study confirmed that N uptake of grass swards is mainly driven by crop growth rate (CGR) [8,40].
The observed values of each PFT were within ranges of results reported by previous studies investigating SLA [19,41,42], TD [11,43], LAI [19,41,42,44] and LNCa [8]. The dynamics in TW coincided with the development of MSC. The high proportion of heavier and stemmier reproductive tillers, up to 75% in early summer, reduced the proportion of smaller, leafy tillers, as represented by low LWR and higher TW during periods with a high CGR. Hence, the regrowth potential of tillers, following a defoliation of reproductive tillers, was lower [45], explaining our observations of a decrease in TD and LAI after the peak period of reproductive growth. However, due to short defoliation intervals in the present study, most tillers only reached the booting stage (MSC < 3.9), resulting in lower TW compared to swards with longer regrowth intervals [44,46]. SLA was lowest at the beginning of the vegetation period in both years, indicating a long residency time of those leaves during the winter period.

4.2. Effect of N Application Rate on Herbage Production and PFT

The positive effects of N fertilisation on CGR and herbage production of grass swards were extensively demonstrated in previous studies [8,41,47,48] and confirmed by our results. A higher N uptake and higher NC in the plant and leaf material at higher N application rates was also confirmed by previous studies [7,38,49].
Temperature and photoperiod are the most important factors driving the phenological development of grass plants [50]. This explains why N application rate only marginally affected MSC in the present study. In contrast to observations made by Joy Pearse and Wilman [49], we did not find significant differences between N application rates in TW. The results of our study clearly show that TW was solely affected by the phenological development of the grass plant. This is supported by the development of LWR in our study, which was also unaffected by N application rate. The frequent defoliation in our study promoted the development of relatively small individual tillers in all N application rates, as discussed above.
TD and LAI were the PFTs that were most affected by N application rate during the season. A higher N availability can increase the rate of leaf elongation and leaf appearance in grass plants, which can also increase the rate of the formation of new tiller buds, i.e., the site filling rate [12,51,52]. Nonetheless, significant differences between moderate (N1) and high (N2) N applications were rare. Especially during vegetative growth, deviations between N application rates of these traits were low. This may be due to high N mineralisation rates, which are usually present in the second half of the season in temperate regions, resulting in low responses to N fertilisation in this period [53,54].
SLA and LNCm were moderately increased by N application rate in our study. Similar results were reported in four grass species of the genus Poa [24]. Previous studies also explained this with an increase in leaf elongation rate [19,52] and an increase in the allocation of N into leaf material in swards with higher N availability [8,24]. A higher SLA is expressed as thinner but larger leaves that provide more area for the absorption of light and, hence, increase radiation-use efficiency. This also explains why LNCm was different but LNCa was more or less similar between N application rates in our study. In the thinner leaves of the N2 swards, the higher N content was distributed across a larger area, resulting in a similar N content per unit area [55].

4.3. Relationships of Each PFT to CGR and Nitrogen Uptake

The interrelation of MSC, TW, TD, SLA and LAI resulted in a multicausal influence of the PFTs on CGR. Hence, all measured PFTs were positively associated with CGR and Nupt. In each of the regressions of SLA, there were a few datapoints that were higher and more or less separate from the remaining cluster of datapoints. These represented samples taken during the peak of reproductive growth in 2016. In 2016, the peak in CGR and Nupt was higher and steeper compared to the peak in 2017, which also occurred later. This indicates that the relationship between CGR and SLA depended on the phenological development stage of the grass plant. This is most likely due to the changes in canopy structure and height during stem elongation. SLA and LAI are strong determinants for the potential of capturing light, and thus strongly drive the photosynthetic efficiency and productivity of grass swards [19,51]. Nevertheless, it is possible that the higher SLA increased LAI more than it increased biomass accumulation, as reported by Knops and Reinhart [56]. This could be an explanation for why the association between LAI and CGR was stronger than the association between SLA and CGR.
The positive effect of both TD and TW on CGR in our study is in contrast to the results reported by Matthew et al. [57], where TD was negatively associated with herbage mass as a result of tiller size/density compensation. However, it was also highlighted that frequently defoliated swards with a lower herbage mass can deviate from the compensation effects between TD and TW [58]. Similar to the results of our study, Garay et al. [59] highlighted the importance of TD for herbage production in grazed swards. The relationship between TD and LAI of frequently defoliated grass swards resulted in leafy and dense canopies [13,60]. Furthermore, the swards of the present study were not perennial ryegrass monoculture. Measurements of TD included all present grass species. This indicates that, in permanent pastures with multiple species, tiller size/density compensations may be less important. A further indication of the lower importance of TW for herbage production in the swards of our study was that the association between TW and Nupt was significantly weaker than between TD and Nupt, which was similar to the association between TD and CGR. Moreover, TW was almost unaffected by N application rate, while TD and LAI showed a good response to moderate N application in both years. The simultaneous increase in DM yield, CGR and Nupt with higher N application indicates that TD played an important role for herbage production in the frequently defoliated, permanent grassland swards of our study. Increasing N application from N1 to N2 did not result in differences in TD or ANE. As N1 represented N application rates currently recommended for pastures and N2 represented the additional N potentially excreted by grazing dairy cows, this supports the idea that moderate (140 kg N ha−1) mineral N fertilisation is sufficient for ensuring highly productive grass swards on permanent pastures for cattle grazing. High TD further provides a significant competitor against other species and weeds, which underlines the role of TD for yield stability [61]. Therefore, TD could be used as an easily recognizable measure of the growth and N uptake potential of permanent pastures similar to those analysed in the present study.

5. Conclusions

Frequent defoliation, as is the case in rotational grazing systems, promotes productive swards that are highly competitive for light. The results of our study highlighted that the phenological development of perennial ryegrass drives the dynamics in CGR, N uptake and most PFTs during the vegetation period of permanent grasslands. Hence, considering the phenological development stage of perennial ryegrass is crucial to understand the effects of N application on growth and N uptake dynamics in permanent grass swards. Within the PFTs analysed in the present study, we identified tiller density as one of the main drivers of growth rate and N uptake in frequently defoliated permanent pastures. In the present study, a moderate N application rate of 140 kg N ha−1 yr−1 was sufficient for the maximum tiller density. The results of this study highlight that focusing the management of permanent pastures on increasing tiller density can ensure high CGR and N uptake rates under moderate N application and increase the productivity of pastures.

Author Contributions

Conceptualization, T.P., F.T. and F.F.; methodology, T.P., T.R., R.L. and F.F.; validation, T.R., R.L. and F.F.; formal analysis, T.P., C.K. and F.F.; investigation, T.P. and F.F.; resources, T.R. and R.L.; data curation, C.K. and R.L.; writing—original draft preparation, T.P.; writing—review and editing, F.T., T.R. and F.F.; visualization, T.P., C.K. and F.F.; supervision, F.T., R.L. and T.R.; funding acquisition, F.T. and T.R. All authors have read and agreed to the published version of the manuscript.

Funding

This research was funded by the European Innovation Partnership (EIPagri) within the project “Optimised pasture management-smart grazing” (EU registration number FKZ: 704.06.EIP-06-2015). The APC was funded by the German Research Foundation (DFG) within the funding programme “Open Access Publizieren”.

Data Availability Statement

The data presented in this study are available upon reasonable request from the corresponding author.

Acknowledgments

The authors would like to acknowledge the help of Mario Hasler for statistical advice. The authors would like to thank the student staff of the Department of Grass and Forage Science/Organic Agriculture at Christian-Albrechts-University Kiel for their dedication and their work in the field and laboratory during the course of this study.

Conflicts of Interest

The authors declare no conflict of interest.

Appendix A

Figure A1. Share (%) of the four most dominant species in the swards examined in the study. Visual estimations in autumn 2016 and 2017 was conducted according to Klapp and Stählin [62].
Agronomy 11 02499 g0a1

References

  1. Enriquez-Hidalgo, D.; Gilliland, T.J.; Hennessy, D. Herbage and nitrogen yields, fixation and transfer by white clover to companion grasses in grazed swards under different rates of nitrogen fertilization. Grass Forage Sci. 2016, 71, 559–574. [Google Scholar] [CrossRef]
  2. Bryant, R.H.; Gregorini, P.; Edwards, G.R. Effects of N fertilisation, leaf appearance and time of day on N fractionation and chemical composition of Lolium perenne cultivars in spring. Anim. Feed Sci. Technol. 2012, 173, 210–219. [Google Scholar] [CrossRef]
  3. Trott, H.; Wachendorf, M.; Ingwersen, B.; Taube, F. Performance and environmental effects of forage production on sandy soils I. Impact of defoliation system and nitrogen input on performance and N balance of grassland. Grass Forage Sci. 2004, 59, 41–55. [Google Scholar] [CrossRef]
  4. Burchill, W.; Lanigan, G.J.; Li, D.; Williams, M.; Humphreys, J. A system N balance for a pasture-based system of dairy production under moist maritime climatic conditions. Agric. Ecosyst. Environ. 2016, 220, 202–210. [Google Scholar] [CrossRef]
  5. Powell, J.M.; Rotz, C.A. Measures of nitrogen use efficiency and nitrogen loss from dairy production systems. J. Environ. Qual. 2015, 44, 336–344. [Google Scholar] [CrossRef] [PubMed] [Green Version]
  6. Reinsch, T.; Loza, C.; Malisch, C.S.; Vogeler, I.; Kluß, C.; Loges, R.; Taube, F. Toward specialized or integrated systems in Northwest Europe: On-farm eco-efficiency of dairy farming in Germany. Front. Sustain. Food Syst. 2021, 5, 4348. [Google Scholar] [CrossRef]
  7. Moir, J.L.; Edwards, G.R.; Berry, L.N. Nitrogen uptake and leaching loss of thirteen temperate grass species under high N loading. Grass Forage Sci. 2013, 68, 313–325. [Google Scholar] [CrossRef]
  8. Gastal, F.; Lemaire, G. N uptake and distribution in crops: An agronomical and ecophysiological perspective. J. Exp. Bot. 2002, 53, 789–799. [Google Scholar] [CrossRef] [Green Version]
  9. European Union. Directive 2000/60/EC of the European Parliament and of the Council of 23 October 2000 establishing a framework for Community action in the field of water policy. Off. J. Eur. Union 2000, L327. Available online: http://data.europa.eu/eli/dir/2000/60/oj (accessed on 2 August 2021).
  10. European Union. Council Directive of 12 December 1991 concerning the protection of waters against pollution caused by nitrates from agricultural sources (91/676/EEC); amended by regulation (EC) No 1137/2008 on 22 October 2008. Off. J. Eur. Union 2008, 4, 144–197. Available online: http://data.europa.eu/eli/dir/1991/676/2008-12-11 (accessed on 2 August 2021).
  11. Parsons, A.; Chapman, D. The principles of pasture growth and utilization. In Grass, Its Production and Utilization, 3rd ed.; Hopkins, A., Ed.; Blackwell Science: Oxford, UK, 2000; pp. 31–89. [Google Scholar]
  12. Gastal, F.; Lemaire, G. Defoliation, shoot plasticity, sward structure and herbage utilization in pasture: Review of the underlying ecophysiological processes. Agriculture 2015, 5, 1146–1171. [Google Scholar] [CrossRef] [Green Version]
  13. Gautier, H.; Varlet-Grancher, C.; Hazard, L. Tillering responses to the light environment and to defoliation in populations of perennial ryegrass (Lolium perenne L) selected for contrasting leaf length. Ann. Bot. 1999, 83, 423–429. [Google Scholar] [CrossRef] [Green Version]
  14. Matthew, C.; Assuero, S.; Black, C.; Hamilton, N.S. Tiller dynamics of grazed swards. In Grassland Ecophysiology and Grazing Ecology; Lemaire, G., Hodgson, J., de Moraes, P.C., Nabinger, C., de Carvalho, P.C.F., Eds.; CABI Publishing: Wallingford, UK, 2000; pp. 127–150. [Google Scholar] [CrossRef]
  15. Violle, C.; Navas, M.-L.; Vile, D.; Kazakou, E.; Fortunel, C.; Hummel, I.; Garnier, E. Let the concept of trait be functional! Oikos 2007, 116, 882–892. [Google Scholar] [CrossRef]
  16. Laliberté, E.; Shipley, B.; Norton, D.A.; Scott, D. Which plant traits determine abundance under long-term shifts in soil resource availability and grazing intensity? J. Ecol. 2012, 100, 662–677. [Google Scholar] [CrossRef]
  17. Beecher, M.; Hennessy, D.; Boland, T.; McEvoy, M.; O’Donovan, M.; Lewis, E. The variation in morphology of perennial ryegrass cultivars throughout the grazing season and effects on organic matter digestibility. Grass Forage Sci. 2015, 70, 19–29. [Google Scholar] [CrossRef] [Green Version]
  18. Grassein, F.; Lemauviel-Lavenant, S.; Lavorel, S.; Bahn, M.; Bardgett, R.D.; Desclos-Theveniau, M.; Laine, P. Relationships between functional traits and inorganic nitrogen acquisition among eight contrasting European grass species. Ann. Bot. 2015, 115, 107–115. [Google Scholar] [CrossRef] [Green Version]
  19. Pontes, L.D.S.; Soussana, J.F.; Louault, F.; Andueza, D.; Carrère, P. Leaf traits affect the above-ground productivity and quality of pasture grasses. Funct. Ecol. 2007, 21, 844–853. [Google Scholar] [CrossRef]
  20. Schellberg, J.; Pontes, L.D.S. Plant functional traits and nutrient gradients on grassland. Grass Forage Sci. 2012, 67, 305–319. [Google Scholar] [CrossRef]
  21. Hanisch, M.; Schweiger, O.; Cord, A.F.; Volk, M.; Knapp, S. Plant functional traits shape multiple ecosystem services, their trade-offs and synergies in grasslands. J. Appl. Ecol. 2020, 57, 1535–1550. [Google Scholar] [CrossRef]
  22. Hendricks, S.; Donaghy, D.; Matthew, C.; Bretherton, M.; Sneddon, N.; Cosgrove, G.; Christensen, C.; Kaufononga, S.; Howes, J.; Osborne, M.; et al. Dry matter yield, nutritive value and tiller density of tall fescue and perennial ryegrass swards under grazing. J. N. Z. Grassl. 2016, 78, 149–156. [Google Scholar] [CrossRef]
  23. Komainda, M.; Isselstein, J. Effects of functional traits of perennial ryegrass cultivars on forage quality in mixtures and pure stands. J. Agric. Sci. 2020, 158, 173–184. [Google Scholar] [CrossRef]
  24. Van Arendonk, J.J.C.M.; Niemann, G.J.; Boon, J.J.; Lambers, H. Effects of nitrogen supply on the anatomy and chemical composition of leaves of four grass species belonging to the genus Poa, as determined by image-processing analysis and pyrolysis-mass spectrometry. Plant. Cell Environ. 1997, 20, 881–897. [Google Scholar] [CrossRef]
  25. An, H.; Shangguan, Z.P. Specific leaf area, leaf nitrogen content, and photosynthetic acclimation of Trifolium repens L seedlings grown at different irradiances and nitrogen concentrations. Photosynthetica 2008, 46, 143–147. [Google Scholar] [CrossRef]
  26. Corrall, A.J.; Fenlon, J.S. A comparative method for describing the seasonal distribution of production from grasses. J. Agric. Sci. 1978, 91, 61–67. [Google Scholar] [CrossRef]
  27. Düngung von Wiesen, D.L.G. Weiden und Feldfutter DLG-Merkblatt 433. 2018. Available online: https://www.dlg.org/fileadmin/downloads/landwirtschaft/themen/publikationen/merkblaetter/dlg-merkblatt_433.pdf (accessed on 3 May 2021).
  28. Whitehead, D.C. Nutrient Elements in Grassland: Soil-Plant.-Animal Relationships; CABI Publishing: Oxon, UK, 2000. [Google Scholar] [CrossRef] [Green Version]
  29. Baker, C.W.; Barnes, R. The application of Near Infra-Red Spectrometry to forage evaluation in the agricultural development and advisory service. In Feedstuff Evaluation; Wiseman, J., Cole, D.J.A., Eds.; Butterworth-Heinemann: Oxford, UK, 1990; pp. 337–351. [Google Scholar] [CrossRef]
  30. Trott, H.; Ingwersen, B.; Wachendorf, M.; Taube, F. Estimation of dry matter yield on permanent grassland by means of height assessment. Pflanzenbauwissenschaften 2002, 6, 78–83. [Google Scholar]
  31. Congreves, K.A.; Otchere, O.; Ferland, D.; Farzadfar, S.; Williams, S.; Arcand, M.M. Nitrogen use efficiency definitions of today and tomorrow. Front. Plant. Sci. 2021, 12, 7108. [Google Scholar] [CrossRef] [PubMed]
  32. Moore, K.J.; Moser, L.E.; Vogel, K.P.; Waller, S.S.; Johnson, B.E.; Pedersen, J.F. Describing and quantifying growth stages of perennial forage grasses. Agron. J. 1991, 83, 1073–1077. [Google Scholar] [CrossRef] [Green Version]
  33. Verbeke, G.; Molenberghs, G. Linear Mixed Models for Longitudinal Data; Springer: New York, NY, USA, 2013. [Google Scholar]
  34. Kozak, M.; Piepho, H.-P. What’s normal anyway? Residual plots are more telling than significance tests when checking ANOVA assumptions. J. Agron. Crop. Sci. 2018, 204, 86–98. [Google Scholar] [CrossRef]
  35. Hassink, J. Effects of soil texture and grassland management on soil organic C and N and rates of C and N mineralization. Soil Biol. Biochem. 1994, 26, 1221–1231. [Google Scholar] [CrossRef]
  36. Soussana, J.-F.; Lemaire, G. Coupling carbon and nitrogen cycles for environmentally sustainable intensification of grasslands and crop-livestock systems. Agric. Ecosyst. Environ. 2014, 190, 9–17. [Google Scholar] [CrossRef]
  37. Tilib, E.; Younger, S. The influence of fertilizer nitrogen, white clover content and environmental factors on the nitrate content of perennial ryegrass and ryegrass/white clover swards. Grass Forage Sci. 1999, 54, 275–285. [Google Scholar] [CrossRef]
  38. King, C.; McEniry, J.; Richardson, M.; O’Kiely, P. Yield and chemical composition of five common grassland species in response to nitrogen fertiliser application and phenological growth stage. Acta Agric. Scand. Sect. B Soil Plant. Sci. 2012, 62, 644–658. [Google Scholar] [CrossRef]
  39. Anslow, R.C.; Green, J.O. The seasonal growth of pasture grasses. J. Agric. Sci. 1967, 68, 109–122. [Google Scholar] [CrossRef]
  40. Lemaire, G.; Oosterom, E.v.; Sheehy, J.; Jeuffroy, M.H.; Massignam, A.; Rossato, L. Is crop N demand more closely related to dry matter accumulation or leaf area expansion during vegetative growth? Field Crops Res. 2007, 100, 91–106. [Google Scholar] [CrossRef]
  41. Nassiri, M.; Elgersma, A. Effects of nitrogen on leaves, dry matter allocation and regrowth dynamics in Trifolium repens L. and Lolium perenne L. in pure and mixed swards. Plant. Soil 2002, 246, 107–121. [Google Scholar] [CrossRef]
  42. Nassiri, M.; Elgersma, A. Competition in perennial ryegrass–white clover mixtures under cutting 2. Leaf characteristics, light interception and dry-matter production during regrowth. Grass Forage Sci. 1998, 53, 367–379. [Google Scholar] [CrossRef]
  43. Orr, R.J.; Parsons, A.J.; Treacher, T.T.; Penning, P.D. Seasonal patterns of grass production under cutting or continuous stocking managements. Grass Forage Sci. 1988, 43, 199–207. [Google Scholar] [CrossRef]
  44. Korte, C.J.; Watkin, B.R.; Harris, W. Tillering in ‘Grasslands Nui’ perennial ryegrass swards 1 Effect of cutting treatments on tiller appearance and longevity, relationship between tiller age and weight, and herbage production. N. Z. J. Agric. Res. 1985, 28, 437–447. [Google Scholar] [CrossRef] [Green Version]
  45. Ong, C.K.; Marshall, C. The growth and survival of severely-shaded Tillers in Lolium perenne L. Ann. Bot. 1979, 43, 147–155. [Google Scholar] [CrossRef]
  46. Taube, F. Growth characteristics of contrasting varieties of perennial ryegrass (Lolium perenne L.). J. Agron. Crop. Sci. 1990, 165, 159–170. [Google Scholar] [CrossRef]
  47. Cruz, P.; Boval, M. Effect of nitrogen on some morphogenetic traits of temperate and tropical perennial forage grasses. In Grassland Ecophysiology and Grazing Ecology; Lemaire, G., Hodgson, J., de Moraes, P.C., Nabinger, C., de Carvalho, P.C.F., Eds.; CABI Publishing: Wallingford, UK, 2000; pp. 151–168. [Google Scholar] [CrossRef]
  48. Akmal, M.; Janssens, M.J.J. Productivity and light use efficiency of perennial ryegrass with contrasting water and nitrogen supplies. Field Crops Res. 2004, 88, 143–155. [Google Scholar] [CrossRef]
  49. Joy Pearse, P.; Wilman, D. Effects of applied nitrogen on grass leaf initiation, development and death in field swards. J. Agric. Sci. 1984, 103, 405–413. [Google Scholar] [CrossRef]
  50. Heide, O.M. Control of flowering and reproduction in temperate grasses. New Phytol. 1994, 128, 347–362. [Google Scholar] [CrossRef]
  51. Macadam, J.W.; Volenec, J.J.; Nelson, C.J. Effects of nitrogen on mesophyll cell division and epidermal cell elongation in tall fescue leaf blades. Plant. Physiol. 1989, 89, 549–556. [Google Scholar] [CrossRef] [PubMed] [Green Version]
  52. Arredondo, J.T.; Schnyder, H. Components of leaf elongation rate and their relationship to specific leaf area in contrasting grasses. New Phytol. 2003, 158, 305–314. [Google Scholar] [CrossRef]
  53. Jamieson, N.; Barraclough, D.; Unkovich, M.; Monaghan, R. Soil N dynamics in a natural calcareous grassland under a changing climate. Biol. Fertil. Soils 1998, 27, 267–273. [Google Scholar] [CrossRef]
  54. Verloop, J.; Hilhorst, G.J.; Oenema, J.; van Keulen, H.; Sebek, L.B.J.; van Ittersum, M.K. Soil N mineralization in a dairy production system with grass and forage crops. Nutr. Cycl. Agroecosyst. 2014, 98, 267–280. [Google Scholar] [CrossRef]
  55. Garnier, E.; Cordonnier, P.; Guillerm, J.L.; Sonié, L. Specific leaf area and leaf nitrogen concentration in annual and perennial grass species growing in mediterranean old-fields. Oecologia 1997, 111, 490–498. [Google Scholar] [CrossRef] [PubMed]
  56. Knops, J.M.; Reinhart, K. Specific leaf area along a nitrogen fertilization gradient. Am. Midl. Nat. 2000, 144, 265–272. [Google Scholar] [CrossRef]
  57. Matthew, C.; Hernández-Garay, A.; Hodgson, J. Making sense of the link between tiller density and pasture production. Proc. N. Z. Grassl. Assoc. 1996, 57, 83–87. [Google Scholar] [CrossRef]
  58. Garay, A.H.; Mathew, C.; Hodgson, J. Tiller size/density compensation in perennial ryegrass miniature swards subject to differing defoliation heights and a proposed productivity index. Grass Forage Sci. 1999, 54, 347–356. [Google Scholar] [CrossRef]
  59. Garay, A.H.; Matthew, C.; Hodgson, J. Effect of spring grazing management on perennial ryegrass and ryegrass-white clover pastures. N. Z. J. Agric. Res. 1997, 40, 37–50. [Google Scholar] [CrossRef] [Green Version]
  60. Neuteboom, J.H.; Lantinga, E. Tillering potential and relationship between leaf and tiller production in perennial ryegrass. Ann. Bot. 1989, 63, 265–270. [Google Scholar] [CrossRef]
  61. Seefeldt, S.S.; Armstrong, L.M. Impact of perennial ryegrass seeding densities on weed emergence growth and development. N. Z. Plant. Prot. 2000, 53, 38–43. [Google Scholar] [CrossRef] [Green Version]
  62. Klapp, E.; Stählin, A. Standorte, Pflanzengesellschaften und Leistung des Grünlandes: Am Beispiel Thüringischer Wiesen; Ulmer: Stuttgart, Germany, 1936. [Google Scholar]
Figure 1. (a) Annual herbage dry matter production and (b) nitrogen yield in 2016 and 2017 for three N application rates (0 (N0), 140 (N1) and 280 (N2) kg N ha−1). Mean values with different superscripts differ between N application rates (p ≤ 0.05).
Agronomy 11 02499 g001
Figure 2. (a) Mean daily crop growth rate (CGR), (b) mean nitrogen content and (c) mean daily nitrogen uptake of the total herbage harvested during the vegetation period of 2016 and 2017 for three N application rates (0 (N0), 140 (N1) and 280 (N2) kg N ha−1). Mean values at the same harvest date with different superscripts differ between N application rates (p ≤ 0.05).
Agronomy 11 02499 g002
Figure 3. (a) Mean stage by count (MSC) and (b) tiller weight (TW) during the vegetation periods of 2016 and 2017 for three N application rates (0 (N0), 140 (N1) and 280 (N2) kg N ha−1). Mean values at the same date with different superscripts differ between N application rates (p ≤ 0.05).
Agronomy 11 02499 g003
Figure 4. (a) Tiller density (TD), (b) leaf weight ratio (LWR) and (c) leaf area index (LAI) during the vegetation period of 2016 and 2017 for three N application rates (0 (N0), 140 (N1) and 280 (N2) kg N ha−1). Mean values at the same date with different superscripts differ between N application rates (p ≤ 0.05). Error bars show the standard error of the mean of the interaction between defoliation date and N application rate.
Agronomy 11 02499 g004
Figure 5. (a) Specific leaf area (SLA), (b) leaf nitrogen content per unit mass (LNCm) and (c) leaf nitrogen content per unit area (LNCa) during the vegetation period of 2016 and 2017 for three N application rates (0 (N0), 140 (N1) and 280 (N2) kg N ha−1). Mean values at the same date with different superscripts differ between N application rates (p ≤ 0.05). Error bars show the standard error of the mean for the interaction between defoliation date and N application rate.
Agronomy 11 02499 g005
Figure 6. Linear relationships between crop growth rate (CGR) and (a) mean stage by count (MSC), (b) specific leaf area (SLA), (c) leaf area index (LAI), (d) tiller weight (TW) and (e) tiller density (TD) for three N application rates (0 (N0), 140 (N1) and 280 (N2) kg N ha−1) across two years (2016 and 2017).
Agronomy 11 02499 g006
Figure 7. Linear relationships between daily nitrogen uptake and (a) mean stage by count (MSC), (b) specific leaf area (SLA), (c) leaf area index (LAI), (d) tiller weight (TW) and (e) tiller density (TD) for three N application rates (0 (N0), 140 (N1) and 280 (N2) kg N ha−1) across two years (2016 and 2017).
Agronomy 11 02499 g007
Table 1. Mean temperature (°C), growing degree days above 5 °C (GDD; °C), total rainfall (mm), total solar radiation (MJ m−2) per month, year (Y) and vegetation period (VP; April to October) of 2016, 2017 and the long-term average (1991–2020).
YearJanFebMarAprMayJunJulAugSepOctNovDecYVP
Mean temperature (°C)
20161.13.54.57.213.617.117.817.117.59.84.64.89.914.3
20171.32.86.57.213.316.316.716.913.912.06.34.29.813.8
1991–20201.72.24.38.112.015.317.817.614.310.05.82.99.313.6
Growing degree days > 5 °C (°C)
201617162174267364396375375150323321192000
20170145771257339363368266218512320271882
1991–2020141431100218309394390277158542119811847
Rainfall (mm)
2016828528642794875441793243716446
2017395950474211810061761258983889569
1991–2020675152385064837862746571754449
Solar radiation (MJ m−2)
201653118235379610584536498379143744036472964
20176095269414613585528477309162704136232958
1991–20206011425943257558658849732018075443729
Publisher’s Note: MDPI stays neutral with regard to jurisdictional claims in published maps and institutional affiliations.

