Water-Use Efficiency of Forage Crops in the Southeastern United States
by
 ,
,
Christine H. Gelley
1, 
Amanda J. Ashworth
2 ,
,
Patrick D. Keyser
3,
Renata L. G. Nave
4,* and
Justin D. Rhinehart
5 1
Agriculture & Natural Resources Educator, Ohio State University Extension, Caldwell, OH 43724, USA
2
Poultry Production and Product Safety Research Unit, USDA-ARS, Fayetteville, AR 72701, USA
3
Department of Forestry, Wildlife and Fisheries, University of Tennessee, Knoxville, TN 37996, USA
4
Department of Plant Sciences, University of Tennessee, Knoxville, TN 37996, USA
5
Department of Animal Science, University of Tennessee, Knoxville, TN 37996, USA
*
Author to whom correspondence should be addressed.
Agronomy 2020, 10(9), 1377; https://doi.org/10.3390/agronomy10091377
Submission received: 28 July 2020
/
Revised: 9 September 2020
/
Accepted: 9 September 2020
/
Published: 12 September 2020
(This article belongs to the Special Issue Multifunctional Forages)
Abstract
:Preparing agricultural producers to cope with volatile weather changes, specifically drought, requires a better understanding of forage water-use efficiency (WUE) potentials. Options to improve farm resiliency to drought may include the use of C4 annual and perennial forages, which have greater production efficiency during drought than commonly used C3 forages. Our objective was to measure WUE through real-time gas exchange measurements of photosynthesis and transpiration in (1) a greenhouse study and (2) under field-grazing conditions. Growth parameters, instantaneous water use efficiency (iWUE), and mass-based WUE (mWUE) data were collected under greenhouse conditions in Study 1 for the following species: crabgrass (Digitaria sanguinalis cv. ‘Red River’), switchgrass (Panicum virgatum cv. ‘Alamo’), big bluestem (Andropogon gerardii cv. ‘OZ-70’), indiangrass (Sorghastum nutans cv. ‘Rumsey’), eastern gamagrass (Tripsacum dactyloides cv. ‘Pete’), bermudagrass (Cynodon dactylon cv. ‘Vaughn’s #1’), sorghum-sudangrass (Sorghum bicolor (L.) × Sorghum sudanese (P.) cv. ‘Greengrazer’), and tall fescue (Schedonorus arundinaceus (Schreb.) Dumort). Study 2 occurred from 2014 to 2016, and evaluated iWUE of crabgrass, switchgrass, bermudagrass, eastern gamagrass, and a big bluestem/indiangrass mix under field conditions. Overall, in situ iWUE of crabgrass, switchgrass, eastern gamagrass, and bermudagrass did not differ, while iWUE of the big bluestem/indiangrass was less than switchgrass and crabgrass, an advantage for these species if the standardized precipitation index drops below zero. Bermudagrass, switchgrass, sorghum-sudangrass, pearl millet, and indiangrass had comparable mWUE values under greenhouse-simulated drought. These results will aid in the development of forage species recommendations for mitigating drought and improving resiliency.
1. Introduction
The southeastern United States has been subjected to multiple severe droughts during the past decade and climatologists expect this trend to continue [1]. Drought conditions can drastically reduce availability of quality forage. In 2007, the southeast experienced an intense drought, forcing many beef producers to downsize or eliminate herds in response to forage deficits [2]. Increasing the use of warm-season forages in the southeastern region, which is primarily composed of cool-season forages, may minimize impacts of future droughts and assist in maintaining beef production, which is the United States’ largest agricultural sector [2]. Improved warm-season forage production could better prepare producers for stochastic weather events, thereby minimizing profit loss under drought conditions. This is particularly true for the animal industry across the southeastern United States, where the predominant forage grass is a C3 species—tall fescue. However, it remains unclear which warm-season forages have the greatest water-use efficiency (WUE) under water-limited and grazed conditions.
There are many grass species, especially C4 grasses, that may provide compensation for forage loss in traditional grazing systems under drought [3,4,5,6,7]. Introduced annual species, such as sorghum-sudangrass, pearl millet (Pennisetum glaucum), and crabgrass, can maintain a high stocking density, and produce forage of equivalent nutritive value to many commonly used cool-season grasses in the southeast, such as tall fescue [8]. Longevity of the stand may be a limitation for utilization of warm-season annuals, as biomass accumulation is fast, but short-lived, and stands require reseeding and fertilizer on a regular basis [8]. When compared to native warm-season perennial grasses, root mass is less extensive and may limit access to water deeper in the soil profile during drought. Native warm-season perennial grasses, such as switchgrass, big bluestem, indiangrass, and eastern gamagrass, may also be suitable candidates for maintaining production during droughts [3,4,5,6,7]. These species are well-adapted to the region’s climate, have few pest and disease problems, and have deep root systems [8]. In addition to large root masses, these species produce substantial aboveground herbage mass (HM), which, when managed for grazing or hay production, can provide enough energy to support animal growth and development, as they have yields greater than commonly used C3 grasses in the region and require fewer inputs for production [3,7,9].
Drought tolerance is a complex combination of physiological responses during times of inadequate soil moisture that preserve plant growth. Mass-based water use efficiency (mWUE), a ratio of water input to dry matter output, has been successfully used as an indicator of plant tolerance to drought [3,10,11,12,13,14,15]. However, measurements of whole stand mWUE are challenging in field studies due to variations in soil type, topography, stand densities, and soil water content. Instantaneous measurements of WUE (iWUE) can be made based on gas exchange rates in real-time using photosynthesis and transpiration rates directly from the leaf, while creating a controlled micro-environment [16]. Utilizing measurements of iWUE under ambient conditions in the field may be additionally helpful for screening drought-tolerant forages.
Previous WUE studies have used iWUE to make inferences about the drought tolerance of forage crops, but few have examined the species included in this experiment and most have been conducted in a greenhouse setting. Beale et al. [17] compared iWUE of two perennial C4 grasses (miscanthus (Miscanthus × giganteus) and big cordgrass (Spartina cynosuroides)) in a temperate climate, however, the results were inconclusive. A greenhouse experiment by Taylor et al. [13] studied many ecophysiological traits of C3 and C4 grasses including iWUE, which confirmed that C4 grasses have greater WUEs, photosynthetic rates, and can use nitrogen more efficiently than C3 grasses. Anyia and Herzog [12] conducted a greenhouse experiment that studied cowpea (Vigna unguiculata) under drought and showed that there were differences in WUE among varieties of cowpea, and that iWUE and mWUE are not necessarily correlated. Ghannoum et al. [11] conducted a greenhouse experiment using mWUE to measure drought resistance of Australian C4 grasses and found that drought enhanced mWUE. Jongen et al. [15] used iWUE and mWUE to investigate drought responses of mixed grasslands, as did Hussain et al. [14] but using only mWUE values. Both observed that WUE was enhanced when evapotranspiration rates increased.
These studies document that iWUE is worthy of further investigation in regard to forage crop management. By monitoring and using transpiration and photosynthesis to quantify iWUE, physiological differences and optimum pasture species for climate resiliency may be discovered for the southeastern United States.
Drought conditions with high temperatures and low rainfall are increasingly prevalent in this region during summer, thus drastically influencing forage availability. Decreased forage reduces livestock-carrying capacities and requires supplemental feeding of purchased or conserved feedstuffs to maintain herd health. Therefore, the objective of this experiment was to quantify WUE (mWUE and iWUE) in order to evaluate forage productive potential of commonly recommended pasture crops for enhanced drought resilience.
2. Materials and Methods
In this experiment, we tested WUE responses to various precipitation, temperature, light, and soil conditions in both a greenhouse and a field study via mWUE and iWUE.
The greenhouse study served as a preliminary test of potential species for the field experiment, necessary parameters, and responses to imposed drought. Due to a limited number of paddocks, only one annual warm-season grass could be selected for the field experiment. The field study implemented knowledge gained from the greenhouse study into a pasture system that was actively grazed by cattle and measured under ambient conditions.
It was hypothesized that WUE of native warm-season perennial species would be greatest, as would iWUEs of these grasses when compared to annuals due to shallower rooting depths. It was also predicted that WUE fluctuations would coincide with changes in soil moisture.
2.1. Greenhouse Experiment
2.1.1. Site Description
This study was divided into two experiments, one under controlled conditions and the other in field settings. The greenhouse study took place in a University of Tennessee greenhouse in Knoxville, TN, in a randomized complete block design and four replications. Five perennial warm-season grasses (switchgrass, big bluestem, indiangrass, eastern gamagrass, and bermudagrass), three annual warm-season grasses (crabgrass, sorghum-sudangrass, and pearl millet), and one cool-season perennial grass (tall fescue) were evaluated from 29 October 2013 to 19 February 2014. Tall fescue was the only C3 grass included to this study since it is the most widely grown forage in the region.
2.1.2. Measurements
In preparation for the greenhouse experiment, seedlings of each species were grown in plug trays of potting soil and then transplanted on 29 October 2013 into 10 × 10 × 23 cm pots (1.6 L). Etowah silt loam (fine-loamy, siliceous, semiactive, thermic Typic Paleudults), a moderately fine, well-drained soil formed in alluvium or colluvium that is commonly underlain by limestone residuum [18], was collected at the East Tennessee AgResearch and Education Center’s Plant Science Unit (35°54′ N 83°57′ W), autoclaved, and sifted for use. Pots were filled with soil, each to a consistent weight of 4.80 kg, with no supplementary nutrients applied. Upon transplanting, root material was washed and removed from trays. Subsequently, aboveground and belowground growth was trimmed to 14 cm (from the plant base to leaf tip and plant base to root tip) for all species, and total mass recorded thereafter. Seedlings of all species were in early vegetative stages with one tiller.
Immediately following transplanting, pots were watered until the soil was fully saturated and were left undisturbed over night to reach stable water-holding capacity (WHC), and then weighed. Weights served as a guide to determine appropriate saturation levels throughout the remainder of the experiment [19]. Four plants per species were randomly assigned to stressed (dry) and well-watered (wet) treatments. Stressed and well-watered treatments were dictated by pot WHC, which was equivalent to the maximum amount of water pots (averaged over all experimental units) could hold over 24 hours post soil saturation [19].
An additional set of plants (1 plant per species per treatment) was prepared in the same manner and observed separately under water stress conditions (defined as the WHC percentage at which plants were fully wilted, and when gas exchange measurements could no longer be taken from leaves). These observations were used to determine the appropriate percentage of WHC needed to induce drought stress and to determine photosynthetic cessation at the end of the experiment. Visual signs of drought stress included wilting, chlorosis, and reduced growth.
A random sample of each experimental unit (i.e., single pot with one plant) per species per treatment was weighed daily to determine water requirements for maintaining the prescribed percentage of WHC. Both wet and dry treatments were maintained at 90% WHC from 30 October through 22 November to monitor transplants and observe rate of tissue moisture loss (kg day−1). From 23 through 30 November, dry treatments were maintained at 60% WHC and wet treatments were maintained at 90% WHC. The appropriate amount of water (mm) was applied to reach the desired capacity. Expecting that the annual forages would consume water more quickly than the perennial forages, weights from perennials were pooled and annuals were pooled together to determine the appropriate amount of water needed for each group at each watering.
To simulate the onset of mild drought conditions, a sub-lethal dry down was implemented from 1 through 7 December to induce drought stress. During this period, dry treatments dropped from 60% to 40% WHC and wet treatments from 90% to 70% WHC. Following the sub-lethal dry-down period, dry and wet regimes returned to 60% and 90% respectively, from 8 December to 16 December to mimic recovery from mild drought. A lethal dry-down period was implemented beginning on 17 December, at which time watering was terminated for the remainder of the experiment, thus simulating extreme drought conditions for the remainder of the study period. Observations of plant tissue health, leaf turgidity, and iWUE were taken every three days and the date of photosynthesis cessation was recorded for each pot, with the last observation taken on 19 February 2014. Date of photosynthesis cessation was determined based on the ratio of necrotic leaves to healthy green leaves, which was determined based on the point at which the gas exchange data could no longer be collected from the leaves. Once the ratio reached 4:1, it was assumed that the plants were no longer photosynthetically active. Following plant death, herbage and root dry matter were recorded.
Gas exchange measurements were taken on four dates during the greenhouse study with the LI-6400 XT Portable Photosynthesis System equipped with the 6400-02B LED Light Source (Lincoln, NE, USA) [16]. On each sampling date, one gas exchange data point was taken per plant on each of the plants in the experiment. The mean of four replicates per treatment was used to represent the iWUE of each species per sampling date.
Throughout data collection, CO2 concentration in the leaf chamber was kept constant at 400 µmol CO2 mol air−1. Within the chamber, leaf temperature and photosynthetically active radiation (PAR) were adjusted to match ambient levels in the greenhouse on the day of sampling. Before each data point was recorded, a stabilization period of one to five minutes was implemented to reach consistently steady photosynthesis and iWUE rate values within one µmol CO2 mol H2O−1. As dictated by the greenhouse winter management plan, greenhouse temperatures were set to heat when temperatures decreased below 18 °C and to cool when temperatures increased above 29 °C. Average daily temperature in the greenhouse was 21 °C. Leaf temperature ranged from 24.0 to 33.0 °C and PAR from the artificial light and filtered natural light in the greenhouse ranged from 190.0 to 260.0 µmol m−2 s−1. The newest emerged, fully expanded, photosynthetically active leaf of each plant were used to record photosynthesis rate, transpiration rate, and leaf area [20]. All data points were collected between 10:00 and 15:00 hours. Using these data points, an iWUE value was calculated on each experimental unit. Dates of data collections were as follows: 22 November 2013, during the acclimation period (post-transplant, pre-treatment), 26 November 2013, during the wet and dry regime implementation, 3 December 2013, during sub-lethal dry down, and 16 December 2013, following rewetting (post sub-lethal, pre-lethal).
After all watering was terminated, plants were monitored every three days with date of photosynthesis cessation recorded to determine the length of survival in days post-watering (DPW). At the end of the experiment, aboveground and belowground plant material was collected to determine mWUE in total dry matter produced per liter of water applied for each plant (g DM kg−1 H2O). The average of the four replications per treatment and sampling date was used to represent the iWUE of each species (n = 32).
2.1.3. Statistical Analysis
Differences among least squares means were evaluated using the PROC MIXED procedures [21]. Dependent variables were iWUE, mWUE, and survival in DPW. Each dependent variable was analyzed separately. Fixed effects were species, water treatment, and lifecycle (annual vs. perennial), and replication was a random effect. Pearson correlation coefficients (PROC CORR) were used in SAS [21] to test relationships between iWUE, temperature, humidity, and PAR during leaf gas exchange measurements. PROC MIXED procedures were used to run analysis of covariance in SAS [21] for mass as a covariate with iWUE. All results were evaluated for significance at p < 0.05 and checked for normality.
2.2. Field Experiment
2.2.1. Site Description
The second experiment was conducted at Highland Rim AgResearch and Education Center (HRREC) in Springfield, TN (36°28′ N, 86°49′ W, 203 m elevation), and at Ames Plantation AgResearch and Education Center (APREC) in Grand Junction, TN (35°8′ N, 89°12′ W, 174 m elevation), during growing seasons of 2014–2016. Treatments (species) were assigned to paddocks with an area of 1.2 ha (experimental units) under a completely randomized design with three replications. At HRREC, treatments consisted of four species: switchgrass, crabgrass, and a mixed pasture of big bluestem and indiangrass, totaling 9 paddocks. At APREC, treatments consisted of six species: switchgrass, crabgrass, bermudagrass, eastern gamagrass, and a mixed pasture of big bluestem and indiangrass, totaling 15 paddocks. Crabgrass was selected as the annual comparison.
At both locations, experimental units were continuously grazed by weaned heifers from 16 May to 6 August 2014, 15 May to 17 August 2015, and 12 May to 1 September 2016 at HRREC, and 13 May to 6 August 2014, 8 May to 17 August 2015, and 6 May to 16 August 2016 at APREC. Crabgrass at both sites was offset by 30 days to allow for establishment of the annual forage crop. Stocking rate was adjusted as needed to keep forage at a manageable height and allow adequate animal intake. Target heights were 60–76 cm (switchgrass), 40–46 cm (big bluestem and indiangrass blend), 45–60 cm (eastern gamagrass), and 7–20 cm (bermudagrass and crabgrass). These forage heights were selected to balance pasture and animal productivity with stand persistence [8,22,23]. Target heights differed between grass species, owing to differences in plant morphology and grow point heights.
Bermudagrass paddocks were established in 2013 at a seeding rate of 11 kg pure live seed (PLS) ha−1 at both APREC and HRREC; however, following high seedling mortality resulting from an abnormally cold winter, bermudagrass was replanted at HRREC on 13 May 2014. Native perennial paddocks were established for a previous experiment in spring 2008 and 2009. Switchgrass and the indiangrass-big bluestem blend were seeded with a no-till drill at the following rates: indiangrass 4 kg PLS ha−1, big bluestem 7 kg PLS ha−1, and switchgrass 7 kg PLS ha−1. Eastern gamagrass was planted with a corn planter at 13 kg PLS ha−1. Crabgrass was seeded at 7 kg PLS ha−1 on the following dates: 8 May (HRREC) and 21 April (APREC) in 2014, 8 May (HRREC) and 6 May (APREC) in 2015, and 20 April (HRREC) and 8 May (APREC) in 2016.
The most prominent soil type in paddocks at HRREC was a Sango silt loam (coarse-silty, siliceous, semiactive, thermic Glossic Fragiudults), a moderately well-drained soil formed in residuum weathered from cherty limestone, pH = 6.6 [18]. The most prominent soil type in paddocks at APREC was a Memphis silt loam (fine-silty, mixed, active, thermic Typic Hapludalfs), a well-drained soil formed in loess deposits, pH = 6.6 [18].
2.2.2. Measurements
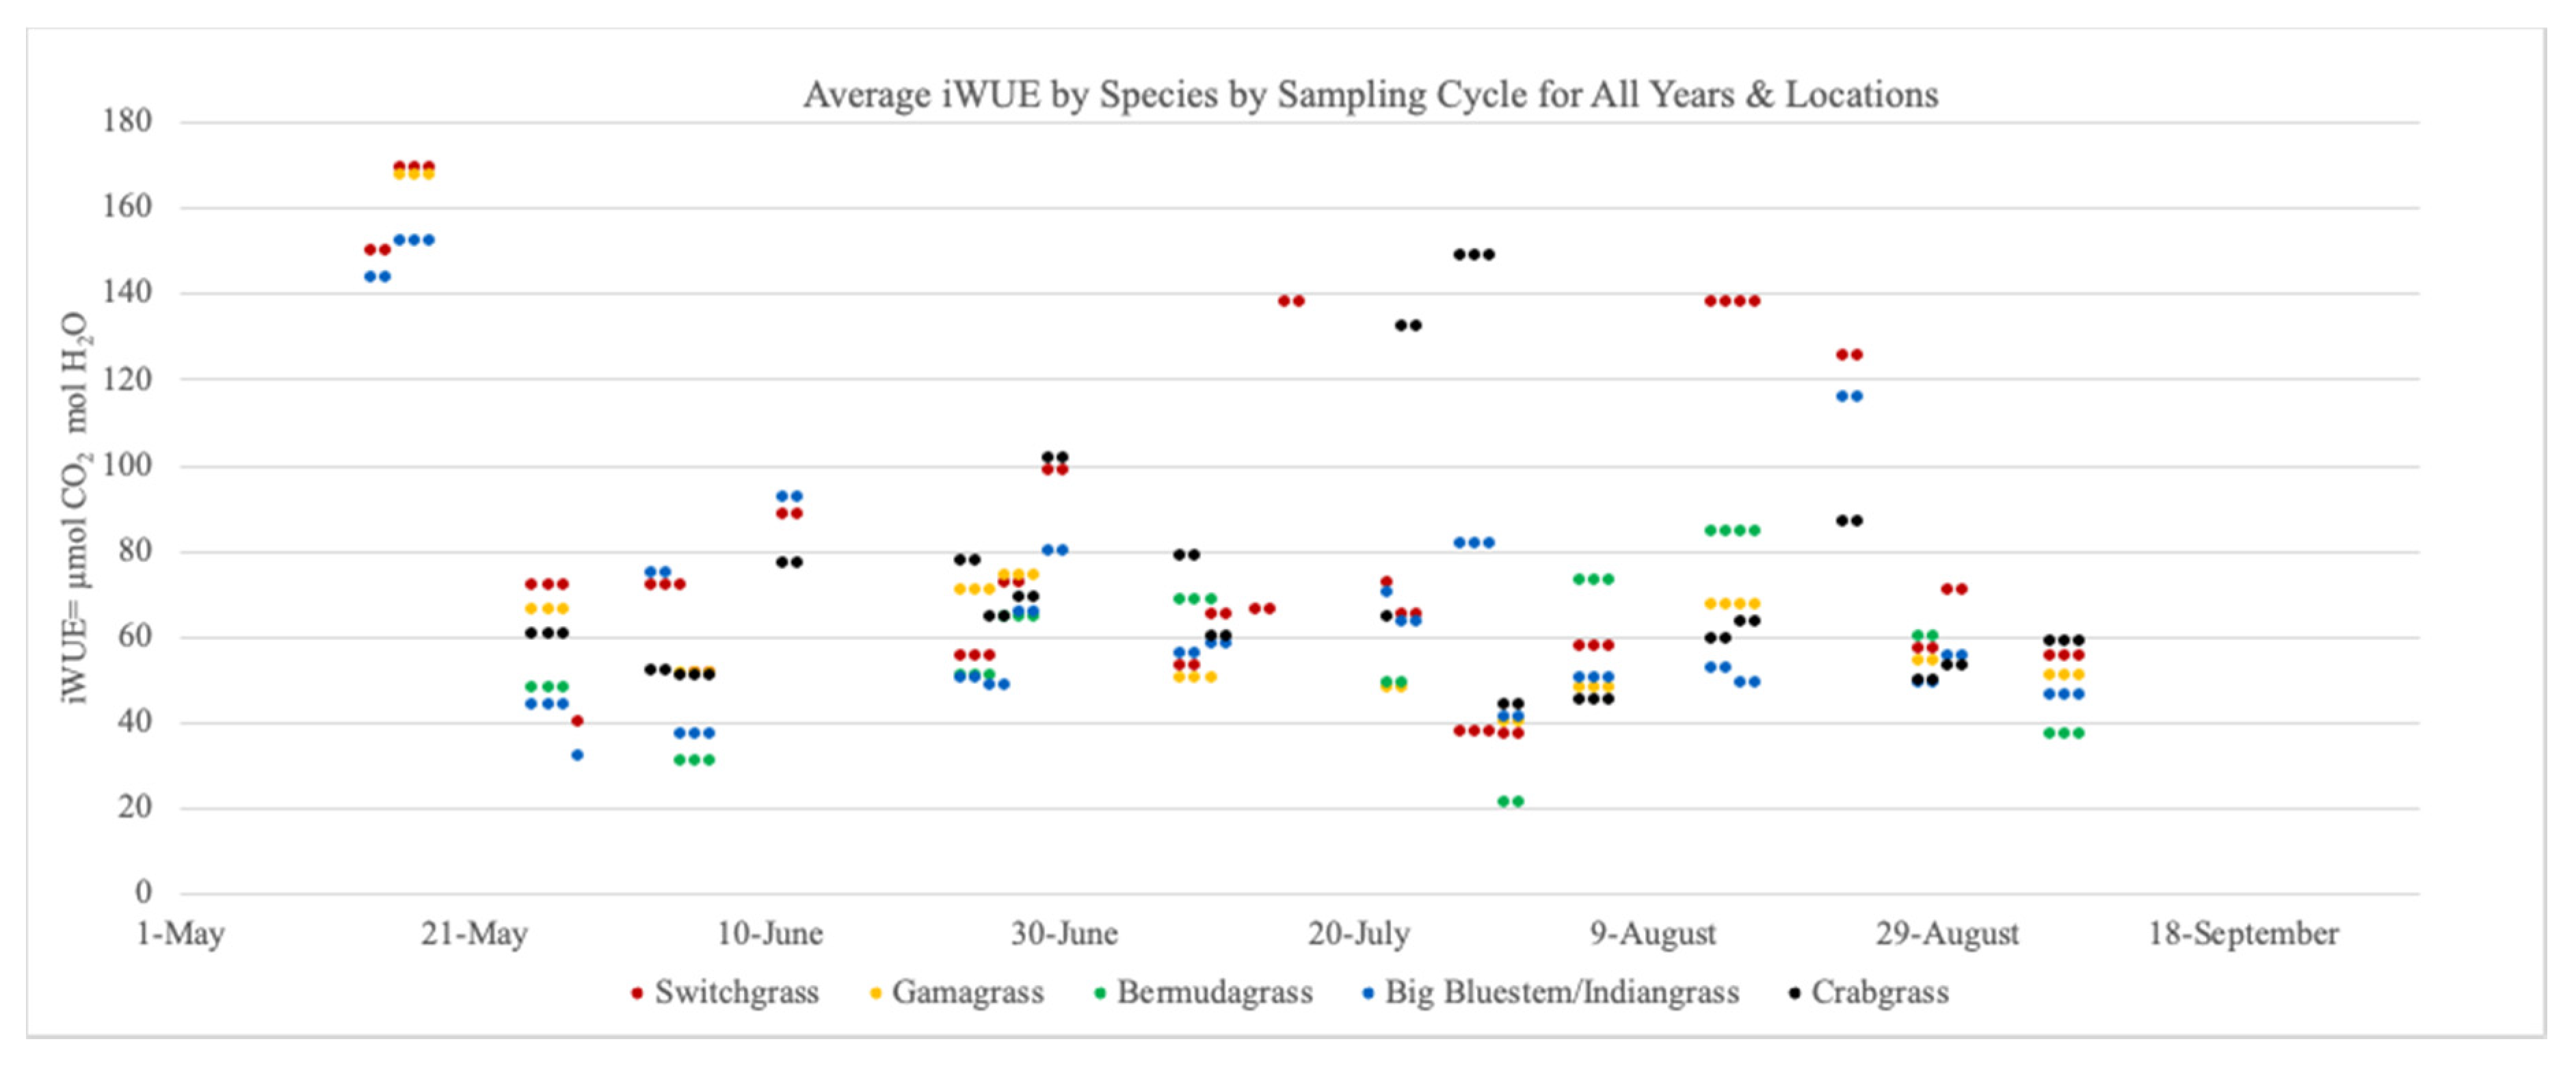
At both sites, iWUE was recorded approximately every 28 days. Measurements of iWUE were collected on four occasions per year at HRREC (28 May, 25–26 June, 23–24 July, and 29–30 August in 2014, 2–3 June, 29–30 June, 27–29 July, and 22–23 August in 2015, and 14–15 May, 11–12 June, 10–11 July, and 13–14 August in 2016) and at APREC (4–6 June, 8–10 July, 4–6 August, and 5–7 September in 2014, 25–27 May, 23–25 June, 22–23 July, and 13–16 August in 2015, and 16–18 May, 26–28 June, 30–31 July, and 27–28 August in 2016) (Figure 1).
Three iWUE samples were taken from each of three randomly placed exclusion cages per paddock. Cages protected leaves from defoliation by cattle and were randomly moved to new locations within the paddock two weeks before each sampling date to ensure that the forage measured had been exposed to grazing but also had two weeks to regrow after grazing. Moving the cages also prevented sampling the same plant twice, as well as allowed for sampling of non-damaged, fully emerged sampling for iWUE.
In April 2015, Watermark 200SS soil moisture sensors (The Irrometer Company, INC. Riverside, CA, USA) were placed at both HRREC and APREC in each paddock to take observations of soil tension throughout the experiment. Within each paddock, one sensor was placed at each of two soil depths, 0–20 cm and 20–40 cm, and at mid-slope positions. Readings of soil water tension (ranging from 0 to 239 kPa, with zero being fully saturated) were collected from each sensor concurrent with iWUE sampling. Prior to installation, all sensors were calibrated to read 0 kPa at 100% saturation.
Gas exchange measurements were taken with the LI-6400 XT Portable Photosynthesis System (Li-Cor, INC. Lincoln, NE, USA). Leaf readings were taken from the most recently emerged, non-injured, fully expanded, photosynthetically active central leaf of the plant between 10:00 and 15:00 h. CO2 (400 µmol CO2 mol air−1) and irradiance (1500 µmol m−2 s−1) were kept constant within the leaf chamber for all measurements. Appropriate PAR levels were established using data from light curves developed during the greenhouse experiment for each native species, with 1500 µmol m−2 s−1 being the average light saturation point and the light level used in the gas exchange chamber during sampling. Leaf temperature in the chamber was set based on the ambient temperatures at the start of each sampling day and kept constant until the end of daily sampling. Over the whole study, leaf temperature ranged between 17.6 and 39.1 °C. Leaf area was recorded for each data point.
Gas exchange measurements were used to calculate iWUE. Measurements per species were taken in random order (within replicates) and replicate order was also randomized on each sampling date to account for diurnal fluctuations.
2.2.3. Statistical Analysis
Differences among least squares means were evaluated using the PROC MIXED procedures, adjusted for Tukey’s method for least square means separation of SAS [21]. The dependent variables were mWUE and iWUE. Fixed effect was species. Random effects were year, location, date, and replicates. Residuals were checked for normality and interactions between year x species were not significant for all dependent variables, therefore data were analyzed across years. The PROC MIXED procedure was also used to run analysis of covariance in SAS [21], with soil moisture as a covariate for iWUE. All results were evaluated for significance at p < 0.05.
3. Results
3.1. Greenhouse Experiment
3.1.1. Water-Use Efficiency
iWUE differed (p < 0.05) by species, but there was no water treatment effect or species by water treatment interaction for iWUE (Table 1). Instantaneous WUE was significantly different when compared by species (p < 0.05). Therefore, iWUE by species did not change when subjected to the stressed and well-watered treatments. The three annual species did not differ, nor did they from switchgrass and eastern gamagrass (p ≥ 0.05). Likewise, iWUE was not different among perennials. Sorghum-sudangrass (47.2 µmol CO2 mol H2O−1) and pearl millet (46.0 µmol CO2 mol H2O−1) had greater iWUE values than indiangrass (28.1 µmol CO2 mol H2O−1), big bluestem (27.5 µmol CO2 mol H2O−1), bermudagrass (20.3 µmol CO2 mol H2O−1), and tall fescue (15.2 µmol CO2 mol H2O−1). Crabgrass, switchgrass, and eastern gamagrass were not different than any of the species evaluated.
Species and water treatment interacted to affect mWUE (Table 2). During the dry treatment, bermudagrass (25.9 g DM kg−1 H2O) accumulated greater mWUE than tall fescue (16.8 g DM kg−1 H2O), crabgrass (14.9 g DM kg−1 H2O), big bluestem (12.3 g DM kg−1 H2O), and eastern gamagrass (11.8 g DM kg−1 H2O), but was not greater than switchgrass, sorghum-sudangrass, pearl millet, or indiangrass (p > 0.05). Results of the wet treatment indicate that among perennials, only bermudagrass (14.9 g DM kg−1 H2O) and big bluestem (4.4 g DM kg−1 H2O) differed. Sorghum-sudangrass (23.9 g DM kg−1 H2O) had greater mWUE than bermudagrass, crabgrass (8.2 g DM kg−1 H2O), switchgrass (7.9 g DM kg−1 H2O), tall fescue (7.7 g DM kg−1 H2O), eastern gamagrass (7.5 g DM kg−1 H2O), indiangrass (6.7 g DM kg−1 H2O), and big bluestem. Pearl millet (17.0 g DM kg−1 H2O) had greater mWUE than crabgrass, switchgrass, tall fescue, eastern gamagrass, indiangrass, and big bluestem. Bermudagrass had greater mWUE than big bluestem.
3.1.2. Survival Length
Species affected (p < 0.05) survival length but water treatments did not (Table 3). Average survival length for all species ranged from 12 to 57 DPW. Eastern gamagrass (45.8 DPW), big bluestem (40.8 DPW), and indiangrass (39.6 DPW) survived longer than the remaining species, while switchgrass (29.8 DPW) survived longer than tall fescue (21.5 DPW), pearl millet (19.3 DPW), sorghum-sudangrass (18.1 DPW), bermudagrass (17.3 DPW), and crabgrass (15.8 DPW). There were no survival differences among annuals.
3.1.3. Correlations
Correlations of iWUE, dry or wet treatment, total mass, and length of survival were evaluated. Results indicated that total mass was positively correlated to iWUE (0.61) and negatively correlated to length of survival for all species (−0.56). Mass was then used as a covariate to iWUE, but despite a moderately strong relationship (R2 = 0.66), it was not significant for any species tested (p = 0.49).
3.2. Field Experiment
3.2.1. Weather
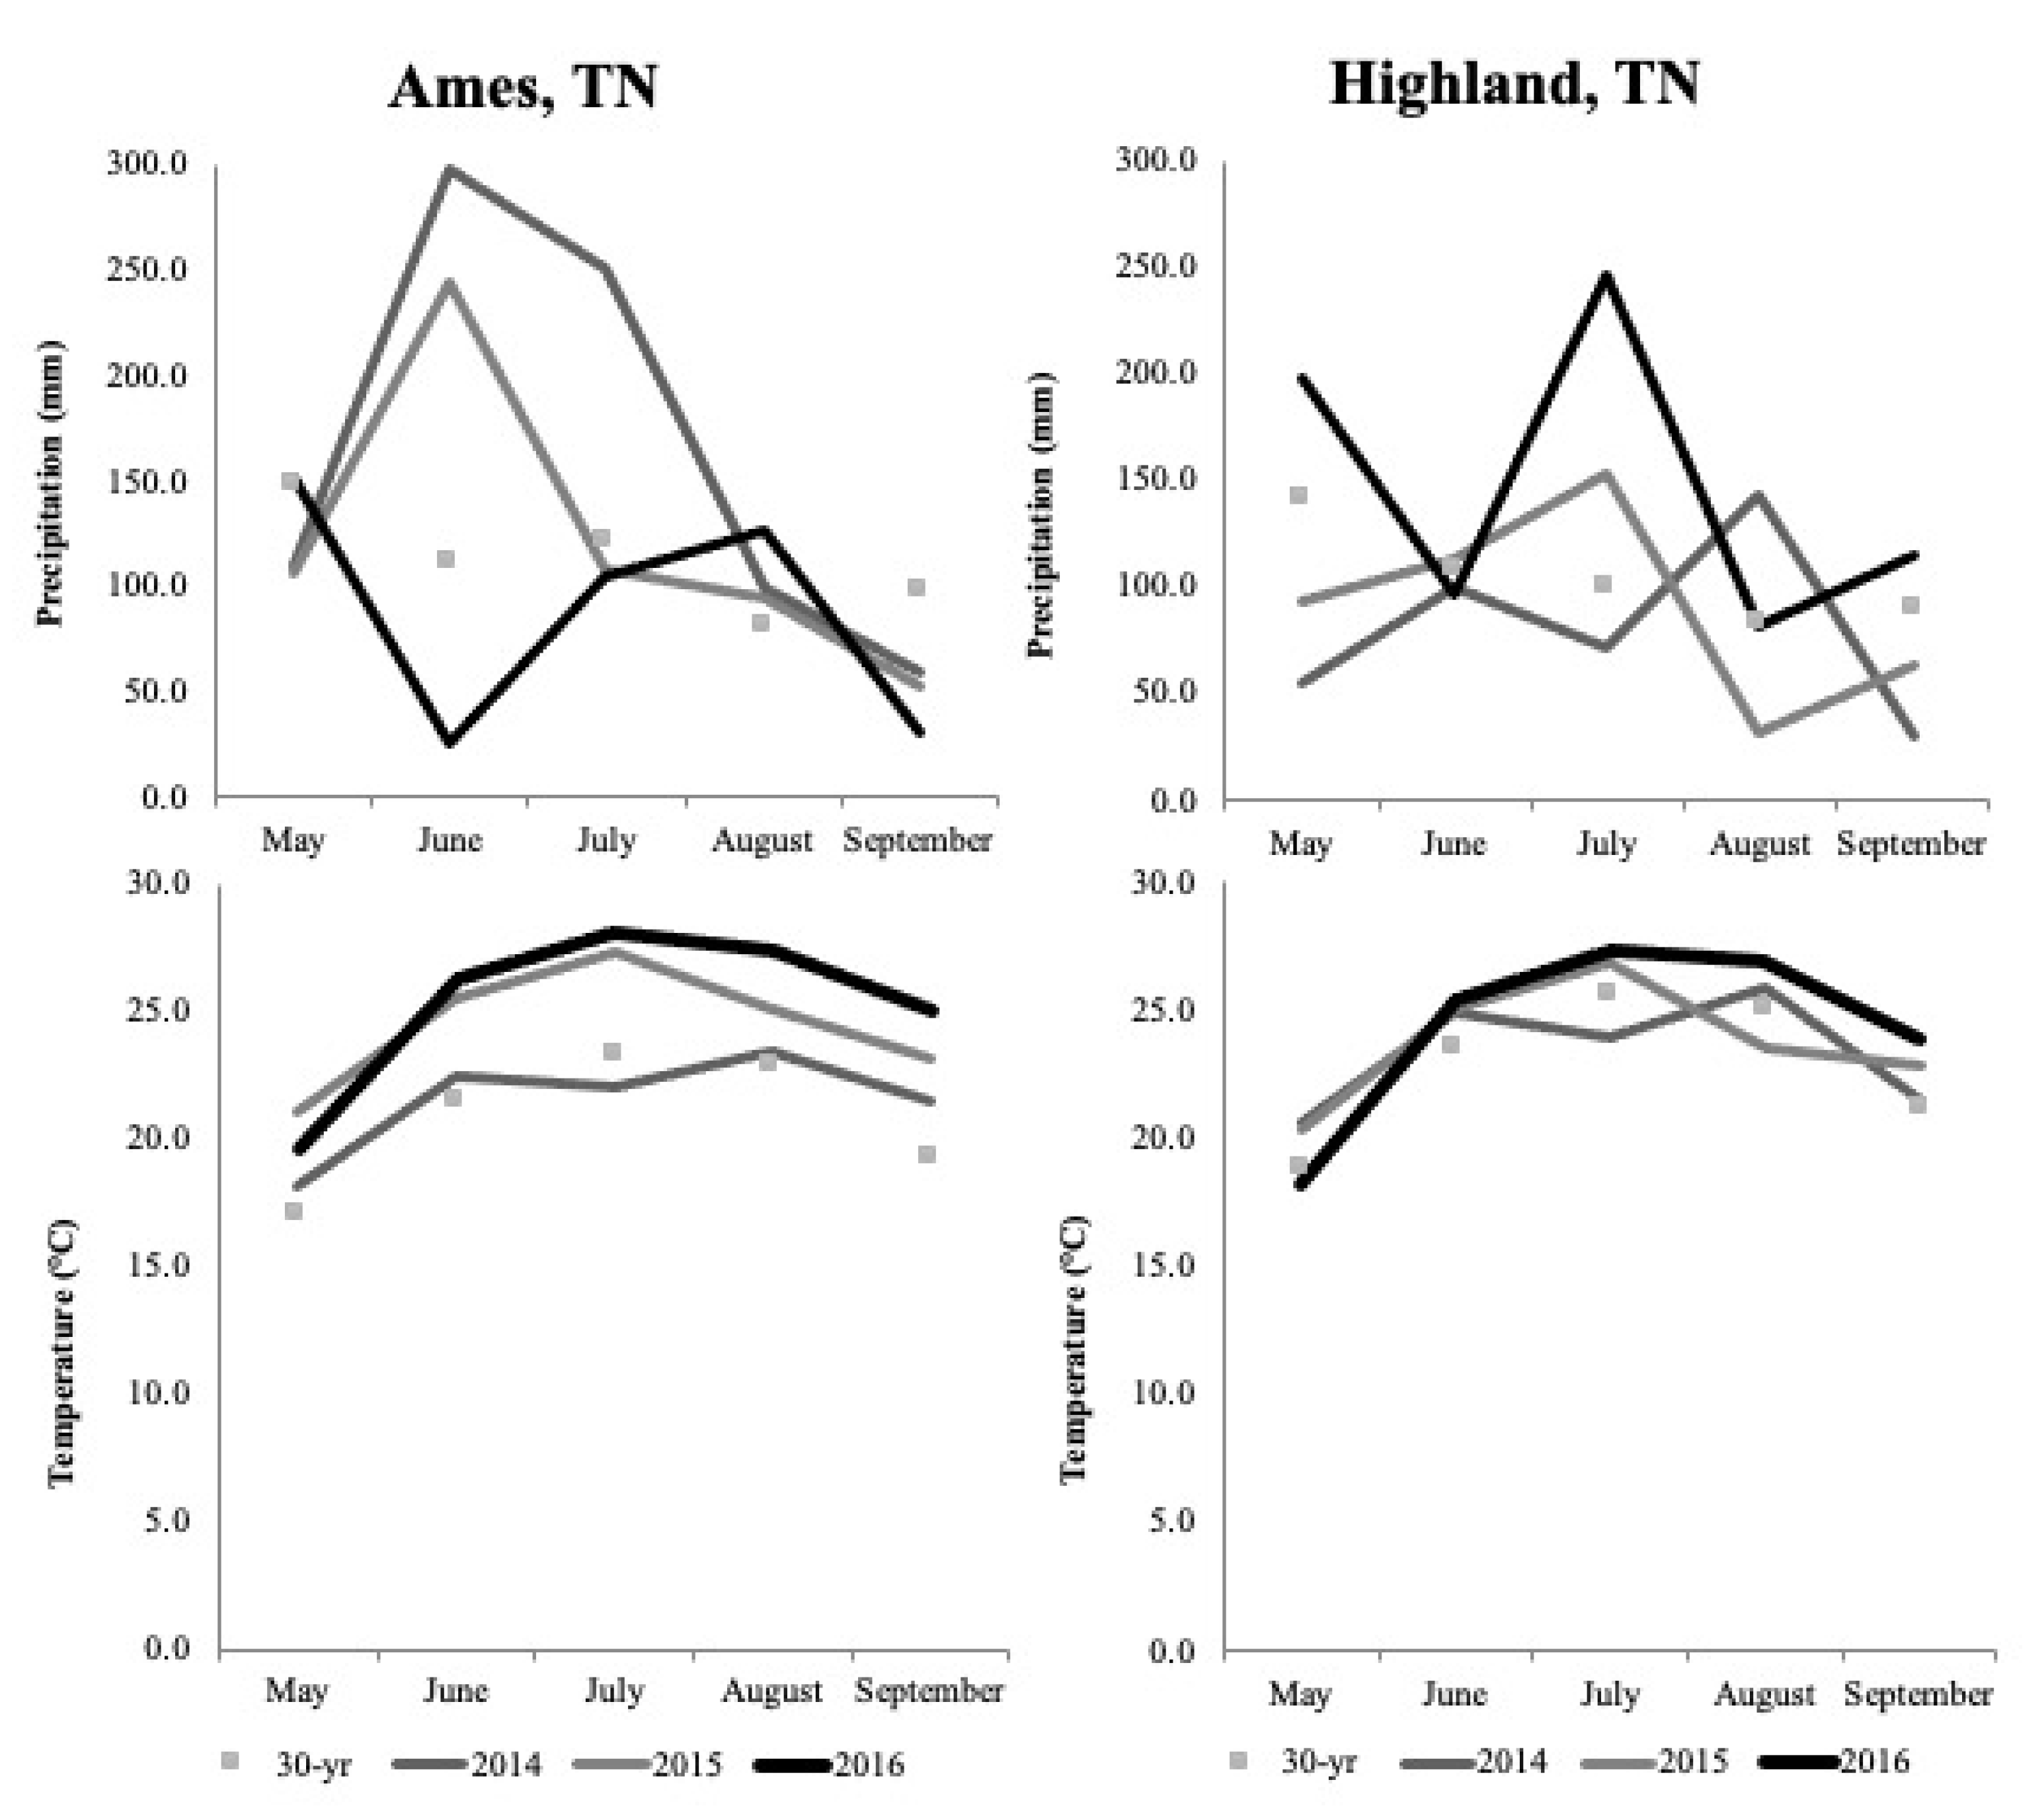
From May through September in 2014, precipitation at HRREC was 23% lower than average (525 mm) and precipitation at APREC was 46% greater than average (561 mm). In 2015, from May through September, precipitation at HRREC was 13% lower than average and at APREC, was 8% greater than average. In 2016, from May through September, precipitation at HRREC was 40% greater than average and at APREC, was 22% lower than average (Figure 2). Temperatures recorded at HRREC and APREC were near or somewhat above average during the study. In 2014, temperature from May through September at HRREC was 0.5 °C greater than average (22.9 °C), 0.9 °C greater than average in 2015, and 1.5 °C greater than average in 2016. In 2014, temperature from May through September at APREC was 0.2 °C lower than average (23.9 °C), 0.6 °C greater than average in 2015, and 1.42 °C greater than average in 2016.
3.2.2. Water Use Efficiency
Across both locations (as locations did not differ), differences (p < 0.05) were observed among species (Table 4). Switchgrass, crabgrass, eastern gamagrass, and bermudagrass performed similarly (µ > 70.0 µmol CO2 mol H2O−1). Eastern gamagrass, bermudagrass, and indiangrass did not differ (µ > 65.0 µmol CO2 mol H2O−1), neither did bermudagrass, indiangrass, or big bluestem (µ > 63.0 µmol CO2 mol H2O−1) (Table 4).
3.2.3. Soil Moisture
Throughout the experiment, soil moisture ranged from fully saturated to near the permanent wilting point (~200 kPa). However, plants did not exhibit drought symptoms, such as wilting or premature senescence (Table 5). On average, soil moisture was greater at the 20 cm depth (µ = 62.50 kPa) than at the 40 cm depth (µ = 82.15 kPa). Analysis of covariance did not indicate a consistent relationship between soil tension and iWUE among species.
4. Discussion
4.1. Greenhouse Experiment
4.1.1. Water-Use Efficiency
Plants tested in the greenhouse experiment were seedlings as opposed to the fully mature plants in the field experiment. All plants were planted and transplanted on the same dates. However, the annual plants grew leaf and root tissue more quickly than perennials. This was expected due to the physiological differences between annuals and perennials and the completion of their lifecycles [24]. Therefore, we evaluated water treatment separately for annuals and perennials. Initial statistical analysis revealed that lifecycle was not significant for iWUE, mWUE, or survival length, and therefore, was omitted from the final statistical analysis.
During the greenhouse experiment, PAR did not reach a level that would allow any of the plant species to reach their light saturation points. This was because light from the source to the leaf canopy in the greenhouse during late fall–early winter dissipated rapidly. During greenhouse measurements, PAR ranged from 190.0 to 260.0 µmol m−2 s−1, while most species had a light saturation point around 1500 µmol m−2 s−1. Mitchell et al. [22] documented reduced photosynthetic rates for switchgrass under cool temperatures and low light intensities in a controlled greenhouse environment, such as ours. Light in the greenhouse was a limiting factor for iWUE across all species. However, matching PAR in the gas exchange readings to the ambient levels of the greenhouse was representative of regional growing conditions.
Species varied for each variable tested, while water treatment (dry vs. wet) was only significant for mWUE (Table 2). These results suggest that the dry treatment did not impact the carbon assimilation rates of the species tested or their lengths of survival after termination of watering (Table 3). Anyia and Herzog [12] conducted an imposed drought study under greenhouse conditions which had variable results for different varieties of cowpea, some of which increased iWUE while some showed no change in iWUE under severe drought stress. It is possible that species evaluated in the greenhouse truly do not differ in iWUE under drought stress, or it could be that the drought imposed was not severe enough to trigger a significant response. Byrd and May encountered similar results when imposing drought on switchgrass in a greenhouse setting and measuring transpiration efficiency [19].
Imposed drought did impact mWUE, with greater g DM kg−1 H2O being obtained under drought conditions for all species, except for sorghum-sudangrass (21.5 g DM kg−1 H2O in the dry treatment and 23.9 g DM kg−1 H2O in the wet treatment) (Table 2). Similar responses were observed by Ghannoum et al. [11] on Australian C4 grasses in an imposed drought greenhouse study.
Survival length was more favorable to the native warm-season perennial grasses, eastern gamagrass, big bluestem, indiangrass, and switchgrass than to the annuals or the introduced perennials. The more prevalent natural wax coating on the leaves of these species likely gave them an advantage compared to the annuals and bermudagrass. Tall fescue, which also has a waxy cuticle, was not as persistent as the native warm-season perennials but was similar to the warm-season annuals and bermudagrass.
Tall fescue performed fairly well compared to the other species and variables evaluated in the greenhouse. Tall fescue is more drought-tolerant than other C3 grasses, which continues to lend it favor with livestock producers throughout the southeastern United States, despite the negative impacts of the fescue endophyte which can lead to vascular constriction in grazing animals that present symptoms including reproductive failure, difficulty regulating body heat, reduced appetite, and, in severe cases, the loss of hooves or tails [25]. The warm-season forages included in this study do not have endophyte issues and are often recommended to help mitigate the negative impacts of fescue endophyte along with drought conditions [25].
Correlations between variables suggest that as DM increases, plant iWUE increases. In addition, correlations from the greenhouse experiment suggest that as total DM accumulation increases, length of survival post-watering decreases. This corresponds with the theory that leaf expansion is highly sensitive to drought [26]. It has been repeatedly observed that when plants are under drought stress, leaves will have decreased surface areas compared to those produced when water is adequately available [12,14,26,27]. Producing leaves with smaller areas and less mass will reduce transpiration loss and thereby increase survival length during drought.
4.1.2. Summary
Throughout the greenhouse study, annuals were evaluated for logical inclusion in the field study. While there were no differences between sorghum-sudangrass, pearl millet, and crabgrass for iWUE or DPW, crabgrass only differed from the native warm-season perennials for mWUE in the wet treatment. Due to the commonalities observed between crabgrass and the native warm-season perennials and a need for additional field tests of grazed crabgrass in the region, crabgrass was selected to be included in the field experiment. Although, all three warm-season annuals studied have potential for success mitigating drought on grazing lands in the southeastern United States.
4.2. Field Experiment
4.2.1. Weather
Temperature and precipitation throughout the three years of field study were not conducive with drought conditions (Figure 2). Temperatures were similar to the 30-year average. Although precipitation varied between years and locations, soil moisture remained adequate for growth through all three summers.
4.2.2. Water-Use Efficiency
Dates of sampling cycles varied between locations and among years (Figure 1). Given that these plants reach peak productivity mid-summer [28], the date at which sampling occurred in relationship to peak growth was not consistent among years, which would create variation in iWUE [29]. Also, total precipitation per growing season was not consistent, which would have created a wider spread of iWUE values observed [30]. However, this variation did not result in differences with respect to year, location, or sampling cycle for species or interactions, hence year was evaluated as a random effect throughout the experiment.
The iWUE values observed in this experiment were similar to those reported for warm-season grasses [13,17,29,31,32,33]. Switchgrass and crabgrass performed similarly and yielded greater iWUE values than indiangrass and big bluestem (p ≤ 0.05). Bermudagrass iWUE was similar to all species tested (Table 4). These iWUE values for native species ordinated nearly the same in the field experiment as those observed in the greenhouse experiment, with the exception of bermudagrass (Table 1), suggesting that these may reflect real trends in iWUE.
Higher ratios of photosynthetic rate to transpiration rates were observed in the field at higher temperature and PAR, which is justified by the species light saturation points. The light saturation point is the point at which photosynthetic rate is maximized by PAR [34]. Although PAR can increase additionally, photosynthesis will not. Temperature is directly related to photosynthetic rate and therefore impacts WUE [35]. For C4 plants, if moisture is not limiting, peak photosynthesis occurs near 34 °C [28], which leads us to believe that peak photosynthesis could have been inhibited early in the growing season and in the greenhouse by temperature and PAR. Beale et al. [17] observed similar patterns of limited growth due to light levels and temperatures when testing C4 perennial grasses in the field in a temperate environment.
4.2.3. Soil Moisture
Precipitation at HRREC was slightly below average in 2014 and 2015 (Figure 2). Average soil water tension was less than 100 kPa at both locations and both soil depths (Table 5), confirming that moisture conditions were adequate for plant growth as deep as 40 cm throughout the growing seasons [36]. Gas exchange is reduced by plant-available water when drought ensues, although leaf expansion is more sensitive to drought and is visually noticeable [26]. Signs of plant stress indicating drought were not observed during any of the sampling dates. Had drought occurred in the years of study, there could have been additional iWUE differences among species, such as was observed by Hussain et al. [14] in managed grasslands in Germany and by Jongen et al. [15] on a Mediterranean grassland in Portugal.
4.2.4. Summary
The individual observations of iWUE from this study provided readings of what is physiologically occurring on one leaf of the plant at that moment, which can easily be influenced by small changes in the plant or environment, such as energy partitioning or soil moisture, that cannot be controlled within the leaf chamber of the infrared gas analyzer [30]. Therefore, additional investigations are needed in subsequent years during persistent drought conditions to gain an understanding of these interactions and how they influence iWUE. While iWUE is not a practical means of measuring drought tolerance or resilience by grazing managers in a typical farm or ranch setting, a dynamic dataset of iWUE values under various conditions could help farmers and ranchers make better decisions about what types of forages can improve grazing conditions during times of drought and heat stress. Though the moisture conditions during the years of this study were not considered droughty, there were still differences in WUE of the forages studied during 2014–2016 that could be helpful for future on-farm research.
5. Conclusions
Integration of perennial and annual warm-season grasses is of interest to beef cattle producers. Due to a lack of localized research on drought tolerance of many forages, this experiment tested multiple species in both a controlled greenhouse and a grazing field experiment. Data collected in the greenhouse confirmed that mWUE was enhanced by drought in all species tested. Overall results of the in-field grazing experiment were comparable to those of the greenhouse experiment. Switchgrass and crabgrass had the greatest iWUE compared to indiangrass and big bluestem. Eastern gamagrass and bermudagrass were intermediate among species tested. Results continue to support that native grasses have greater WUEs than cool-season grasses, which are commonly used in humid pastures of the southeastern United States. Based on these results, switchgrass and crabgrass are more efficient carbon assimilators than indiangrass and big bluestem. Further evaluation of these species should be conducted across a broader range of moisture conditions to detect differences between species during documented drought. In addition, dry matter production, leaf area, and whole canopy responses to drought are necessary for drawing field-landscape conclusions. Overall, results indicate that native warm-season grasses, bermudagrass, and crabgrass are complementary summer forages to help mitigate drought in pastures in the southeastern United States.
Author Contributions
Conceptualization, P.D.K. and J.D.R.; methodology, A.J.A.; software, C.H.G.; validation, C.H.G., A.J.A., and R.L.G.N.; formal analysis, C.H.G.; investigation, C.H.G., A.J.A., and R.L.G.N.; resources, P.D.K., R.L.G.N. and J.D.R.; data curation, C.H.G.; writing—original draft preparation, C.H.G.; writing—review and editing, C.H.G., A.J.A., R.L.G.N., and P.D.K.; visualization, C.H.G.; supervision, P.D.K. and R.L.G.N.; project administration, P.D.K. and R.L.G.N.; funding acquisition, P.D.K. and J.D.R. All authors have read and agreed to the published version of the manuscript.
Funding
This research was funded by USDA-NRCS-CIG.
Acknowledgments
The authors would like to thank the staff of Ames Plantation AgResearch and Education Center, and Highland Rim AgResearch and Education Center, Rondineli Barbero, Lilian Cordeiro, Thais Costa, David McIntosh, Ludmila Monteiro, Jessica Nelson, Leticia Tavares, and Aleksandra Wilson. We also thank Chuck West for providing helpful insights on data interpretation and project design.
Conflicts of Interest
The authors declare no conflict of interest.
References
- Fuhrman, C.; Konrad, C. A Trajectory Approach to Analyzing the Ingredients Associated with Heavy Winter Storms in Central North Carolina. Weather Forecas 2013, 28, 647–667. [Google Scholar] [CrossRef]
- NASS—National Agricultural Statistics Service. NASS National Agricultural Statistics Service; USDA: Washington, DC, USA, 2015.
- Koshi, P.T.; Stubbendieck, J.; Eck, H.V.; McCully, W.G. Switchgrasses: Forage yield, forage quality and water-use efficiency. J. Range Manag. 1982, 35, 623–627. [Google Scholar] [CrossRef] [Green Version]
- Anderson, B.; Matches, A.G. Forage yield, quality, and persistence of switchgrass and caucasian bluestem. Agron. J. 1983, 75, 119–124. [Google Scholar] [CrossRef]
- Sanderson, M.A.; Reed, R.L. Switchgrass growth and development: Water, nitrogen, and plant density effects. J. Range Manag. 2000, 53, 221–227. [Google Scholar] [CrossRef] [Green Version]
- Stroup, J.A.; Sanderson, M.A.; Muir, J.P.; McFarland, M.J.; Reed, R.L. Comparison of growth and performance in upland and lowland switchgrass types to water and nitrogen stress. Biores. Tech. 2003, 86, 65–72. [Google Scholar] [CrossRef]
- Temu, V.W.; Rude, B.J.; Baldwin, B.S. Nutritive value response of native warm-season forage grasses to harvest intervals and durations in mixed stands. Plants 2014, 3, 266–283. [Google Scholar] [CrossRef]
- Keyser, P.D.; Holcomb, E.D.; Lituma, C.M.; Bates, G.E.; Waller, J.C.; Boyer, C.N.; Mulliniks, J.T. Forage attributes and animal performance from native grass inter-seeded with red clover. Agron. J. 2015, 108, 373–383. [Google Scholar] [CrossRef]
- Griffen, J.L.; Jung, G.A. Leaf and stem forage quality of big bluestem and switchgrass. Agron. J. 1983, 75, 723–726. [Google Scholar] [CrossRef]
- Kramer, P.J. Water use efficiency. Water Relat. Plants 1983, 1, 383–387. [Google Scholar]
- Ghannoum, O.; Von Caemmerer, S.; Conroy, J.P. The effect of drought on plant water use efficiency of nine NAD-ME and nine NADP-ME Australian C4 grasses. Funct. Plant Biol. 2002, 29, 1337–1348. [Google Scholar] [CrossRef]
- Anyia, A.O.; Herzog, H. Water-use efficiency, leaf area and leaf gas exchange of cowpeas under mid-season drought. European J. Agron. 2004, 20, 327–339. [Google Scholar] [CrossRef]
- Taylor, S.H.; Hulme, S.P.; Rees, M.; Ripley, B.S.; Woodward, F.I.; Osborne, C.P. Ecophysiological traits in C3 and C4 grasses: A phytogenetically controlled screening experiment. New Phytolog. 2010, 185, 780–791. [Google Scholar] [CrossRef] [PubMed]
- Hussain, M.Z.; Grunwald, T.; Tenhunen, J.D.; Li, Y.L.; Mirzae, H.; Bernhofer, C.; Otieno, D.; Dinh, N.Q.; Schmidt, M.; Wartinger, M. Summer drought influence on CO2 and water fluxes of extensively managed grassland in Germany. Agricult. Ecosys. Environ. 2011, 141, 67–76. [Google Scholar] [CrossRef]
- Jongen, M.; Pereira, J.S.; Aires, L.M.; Pio, C.A. The effects of drought and timing of precipitation on the inter-annual variation in ecosystem-atmosphere exchange in a Mediterranean grassland. Agricult. Forest Meteorol. 2011, 151, 595–606. [Google Scholar] [CrossRef]
- LI-6400 XT Portable Photosynthesis Meter, LI-COR Biosciences Inc.: Lincoln, NE, USA.
- Beale, C.V.; Morison, J.I.L.; Long, S.P. Water use efficiency of C4 perennial grasses in a temperate climate. Agricult. Forest Meteorol. 1999, 96, 103–115. [Google Scholar] [CrossRef]
- NRCS. Web Soil Survey; NRCS—Natural Resource Conservation Service, USDA: Washington, DC, USA, 2014.
- Byrd, G.T.; May, P.A. Physiological comparisons of switchgrass cultivars differing in transpiration efficiency. Crop Sci. 2000, 40, 1271–1277. [Google Scholar] [CrossRef]
- Tucker, S.S.; Craine, J.M.; Nippert, J.B. Physiological drought tolerance and the structuring of tallgrass prairie assemblages. Ecosphere 2011, 2, 48. [Google Scholar] [CrossRef]
- SAS. Version 9.4.; SAS Institute Inc.: Cary, NC, USA, 2009. [Google Scholar]
- Mitchell, R.B.; Anderson, B.; Moser, L.E.; Waller, S.S. Switchgrass and Big Bluestem for Grazing and Hay; University of Nebraska: Lincoln, NE, USA, 1994. [Google Scholar]
- Burns, J.C.; Fisher, D.S. Eastern gamagrass management for pasture in the Mid-Atlantic region: I. Animal performance and pasture productivity. Agron. J. 2010, 102, 171–178. [Google Scholar] [CrossRef]
- Stern, K.R.; Bidlack, J.E.; Jansky, S. Introductory Plant Biology; McGraw-Hill Higher Education: Boston, MA, USA, 2008. [Google Scholar]
- Elbersen, H.W.; West, C.P. Growth and water relations of field-grown tall fescue as influenced by drought and endophyte. Grass Forage Sci. 1996, 51, 333–342. [Google Scholar] [CrossRef]
- Sadras, V.O.; Milroy, S.P. Soil-Water Thresholds for the Responses of Leaf Expansion and Gas Exchange: A Review. Field Crops Res. 1996, 47, 253–266. [Google Scholar] [CrossRef]
- Feng, R.; Zhang, Y.; Yu, W.; Hu, W.; Wu, J.; Ji, R.; Wang, H. Zhao. Analysis of the relationship between spectral characteristics of maize canopy and leaf area index under drought stress. Acta Ecol. Sinica 2013, 33, 301–307. [Google Scholar] [CrossRef]
- Yamori, W.; Hikosaka, K.; Way, D.A. Temperature response of photosynthesis in C3, C4, and CAM plants: Temperature acclimation and temperature adaptation. Photosynth. Res. 2013, 119, 101–117. [Google Scholar] [CrossRef] [PubMed]
- Ribeiro, R.V.; Lyra, G.B.; Santiago, A.V.; Pereira, A.R.; Machado, E.C.; Oliveira, R.F. Diurnal and seasonal patterns of leaf gas exchange in bahiagrass (Paspalum Notatum Flugge) growing in a subtropical climate. Grass Forage Sci. 2006, 61, 293–305. [Google Scholar] [CrossRef]
- Johnson, D.A.; Asay, K.A. Selection for improved drought response in cool-season grasses. Soc. Range Manag. 1993, 16, 194–202. [Google Scholar] [CrossRef]
- Hovenden, M. Growth and photosynthetic responses to elevated [CO2] in grasses from Tasmanian pasture. Papers Proceed. Royal Soci. Tasmania 2003, 137, 81–86. [Google Scholar] [CrossRef] [Green Version]
- Xu, B.; Li, F.; Shan, L.; Ma, Y.; Ichizen, N.; Huang, J. Gas exchange, biomass partition, and water relationships of three grass seedlings under water stress. Weed Biol. Manag. 2006, 6, 79–88. [Google Scholar] [CrossRef]
- Mantlana, K.B.; Veenendaal, E.M.; Arneth, A.; Grispen, V.; Bonyongo, C.M.; Heitkonig, I.G. Biomass and leaf-level gas exchange characteristics of three African Savanna C4 grasses under optimum growth conditions. Afr. J. Ecol. 2009, 47, 482–489. [Google Scholar] [CrossRef]
- Taiz, L.; Zeiger, E. Photosynthesis: Carbon reactions. Plant Physiology. 2002, 3, 70–145. [Google Scholar]
- Long, S.P. C4 photosynthesis at low temperature. Plant Cell Environ. 1983, 6, 345–363. [Google Scholar]
- Enciso, J.; Jifon, J.; Wiedenfeld, B. Subsurface drip irrigation of onions: Effects of drip tape emitter spacing on yield and quality. Agric. Water Manag. 2007, 92, 126–130. [Google Scholar] [CrossRef]
Figure 1.
Mean instantaneous water-use (iWUE) per experimental unit (paddock) by species and sampling cycle at Highland Rim AgResearch and Education Center, Springfield, TN, and Ames Plantation AgResearch and Education Center, Grand Junction, TN, 2014–2016.
Figure 1.
Mean instantaneous water-use (iWUE) per experimental unit (paddock) by species and sampling cycle at Highland Rim AgResearch and Education Center, Springfield, TN, and Ames Plantation AgResearch and Education Center, Grand Junction, TN, 2014–2016.

Figure 2.
Monthly total precipitation and average monthly temperature at Highland Rim AgResearch and Education Center, Springfield, TN and Ames Plantation AgResearch and Education Center, Grand Junction, TN, 2014–2016 and 30 year means.
Figure 2.
Monthly total precipitation and average monthly temperature at Highland Rim AgResearch and Education Center, Springfield, TN and Ames Plantation AgResearch and Education Center, Grand Junction, TN, 2014–2016 and 30 year means.


Table 1.
Least square means of iWUE (µmol CO2 mol H2O−1) by species in the greenhouse experiment across four sampling dates, for both dry and wet treatments, University of Tennessee, Knoxville, TN, 2013 (n = 32).
Table 1.
Least square means of iWUE (µmol CO2 mol H2O−1) by species in the greenhouse experiment across four sampling dates, for both dry and wet treatments, University of Tennessee, Knoxville, TN, 2013 (n = 32).
| Species | Mean | Minimum | Maximum | Standard Deviation |
|---|---|---|---|---|
| Sorghum-sudangrass | 47.2 a† | 31.9 | 64.9 | 11.5 |
| Pearl millet | 46.0 a | 25.0 | 54.2 | 9.1 |
| Crabgrass | 39.8 ab | 26.7 | 49.0 | 6.7 |
| Switchgrass | 35.2 ab | 21.0 | 52.1 | 8.2 |
| Eastern gamagrass | 34.8 ab | 31.2 | 39.2 | 2.4 |
| Indiangrass | 28.1 b | 21.0 | 36.0 | 4.9 |
| Big bluestem | 27.5 b | 21.5 | 37.4 | 4.6 |
| Bermudagrass | 20.3 b | 6.56 | 36.3 | 9.9 |
| Tall fescue | 15.2 b | 10.0 | 24.6 | 4.6 |
† Means within a column without a common superscript letter differ (p < 0.05).
Table 2.
Least square means mWUE (g DM kg−1 H2O) of each species averaged across four sampling dates, University of Tennessee, Knoxville, TN greenhouse, 2013. Species differed between dry (60% water-holding capacity) and wet (90% water-holding capacity) treatments (p < 0.0001). Values are comparable for both the dry and wet treatments by column (n = 16 per species).
| Treatment | Species | Mean | Minimum | Maximum | Standard Deviation |
|---|---|---|---|---|---|
| Dry regime | |||||
| Bermudagrass | 25.9 a† | 18.2 | 32.7 | 5.2 | |
| Switchgrass | 22.7 ab | 16.4 | 32.7 | 6.1 | |
| Sorghum-sudangrass | 21.5 ab | 17.5 | 26.7 | 4.1 | |
| Pearl millet | 18.4 abc | 16.0 | 20.9 | 1.9 | |
| Indiangrass | 16.8 abc | 12.7 | 23.6 | 4.1 | |
| Tall fescue | 16.8 bc | 9.1 | 21.8 | 4.9 | |
| Crabgrass | 14.9 bc | 13.1 | 16.0 | 1.1 | |
| Big bluestem | 12.3 bc | 9.1 | 14.5 | 2.4 | |
| Eastern gamagrass | 11.8 bc | 7.3 | 16.4 | 3.3 | |
| Wet regime | |||||
| Sorghum-sudangrass | 23.9 a | 11.4 | 36.8 | 12.4 | |
| Pearl millet | 17.0 ab | 15.1 | 20.8 | 2.3 | |
| Bermudagrass | 14.9 bc | 8.9 | 16.9 | 1.1 | |
| Crabgrass | 8.2 cd | 7.3 | 10.0 | 1.1 | |
| Switchgrass | 7.9 cd | 4.8 | 12.1 | 2.9 | |
| Tall fescue | 7.7 cd | 5.6 | 8.9 | 1.2 | |
| Eastern gamagrass | 7.5 cd | 3.2 | 16.9 | 5.5 | |
| Indiangrass | 6.7 cd | 3.2 | 10.5 | 2.8 | |
| Big bluestem | 4.4 d | 3.2 | 6.5 | 1.3 | |
† Means without a common superscript letter within dry treatment and the wet treatment differ (p < 0.05).
Table 3.
Least square means for length of survival (days post-watering) by species in greenhouse experiment, University of Tennessee, Knoxville, TN, 2013.
Table 3.
Least square means for length of survival (days post-watering) by species in greenhouse experiment, University of Tennessee, Knoxville, TN, 2013.
| Species | Mean | Minimum | Maximum | Standard Deviation |
|---|---|---|---|---|
| Eastern gamagrass | 45.8 a† | 34 | 57 | 7.5 |
| Big bluestem | 40.8 a | 29 | 47 | 5.8 |
| Indiangrass | 39.6 a | 29 | 50 | 7.7 |
| Switchgrass | 29.8 b | 22 | 39 | 6.3 |
| Tall fescue | 21.5 c | 20 | 22 | 0.9 |
| Pearl millet | 19.3 c | 18 | 22 | 1.5 |
| Sorghum-sudangrass | 18.1 c | 12 | 22 | 2.9 |
| Bermudagrass | 17.3 c | 15 | 18 | 1.3 |
| Crabgrass | 15.8 c | 15 | 18 | 1.3 |
† Means within a column without a common superscript letter differ (p < 0.05).
Table 4.
Least square means of iWUE (µmol CO2 mol H2O−1) by species during field experiment conducted at Highland Rim AgResearch and Education Center, Springfield, TN and Ames Plantation AgResearch and Education Center, Grand Junction, TN, across years (2014–2016) and locations.
Table 4.
Least square means of iWUE (µmol CO2 mol H2O−1) by species during field experiment conducted at Highland Rim AgResearch and Education Center, Springfield, TN and Ames Plantation AgResearch and Education Center, Grand Junction, TN, across years (2014–2016) and locations.
| Species | Mean | Minimum | Maximum | Standard Deviation |
|---|---|---|---|---|
| Switchgrass (n = 24) | 74.5 a† | 37.3 | 169.1 | 4.4 |
| Crabgrass (n = 21) | 74.1 a | 44.0 | 148.8 | 4.6 |
| Eastern gamagrass (n = 12) | 74.4 ab | 40.1 | 167.5 | 5.3 |
| Bermudagrass (n = 11) | 70.8 abc | 21.2 | 84.6 | 5.2 |
| Indiangrass (n = 24) | 65.1 bc | 29.7 | 104.8 | 4.4 |
| Big bluestem (n = 24) | 63.9 c | 32.1 | 152.1 | 4.4 |
† Means within a column without a common superscript letter differ (p < 0.05).
Table 5.
Soil tension (kPa) at two depths (20 and 40 cm) for experimental paddocks by species, 2015–2016 at Highland Rim AgResearch and Education Center, Springfield, TN, and Ames Plantation AgResearch and Education Center, Grand Junction, TN, across years and locations. Number of observations per species is represented by n.
| Depth | Crabgrass | Switchgrass | Bermudagrass | Eastern Gamagrass | Big Bluestem-Indiangrass |
|---|---|---|---|---|---|
| (n = 48) | (n = 48) | (n = 24) | (n = 24) | (n = 48) | |
| 20 cm | 60.1 | 67.6 | 64.9 | 60.5 | 61.7 |
| 40 cm | 68.2 | 97.7 | 67.3 | 90.9 | 86.5 |
© 2020 by the authors. Licensee MDPI, Basel, Switzerland. This article is an open access article distributed under the terms and conditions of the Creative Commons Attribution (CC BY) license (http://creativecommons.org/licenses/by/4.0/).
Share and Cite
MDPI and ACS Style
Gelley, C.H.; Ashworth, A.J.; Keyser, P.D.; Nave, R.L.G.; Rhinehart, J.D. Water-Use Efficiency of Forage Crops in the Southeastern United States. Agronomy 2020, 10, 1377. https://doi.org/10.3390/agronomy10091377
AMA Style
Gelley CH, Ashworth AJ, Keyser PD, Nave RLG, Rhinehart JD. Water-Use Efficiency of Forage Crops in the Southeastern United States. Agronomy. 2020; 10(9):1377. https://doi.org/10.3390/agronomy10091377
Chicago/Turabian StyleGelley, Christine H., Amanda J. Ashworth, Patrick D. Keyser, Renata L. G. Nave, and Justin D. Rhinehart. 2020. "Water-Use Efficiency of Forage Crops in the Southeastern United States" Agronomy 10, no. 9: 1377. https://doi.org/10.3390/agronomy10091377
Note that from the first issue of 2016, this journal uses article numbers instead of page numbers. See further details here.