Deep Phenotyping of Yield-Related Traits in Wheat


Chair of Plant Nutrition, Technical University of Munich, 85354 Freising, Germany
*
Author to whom correspondence should be addressed.
Agronomy 2020, 10(4), 603; https://doi.org/10.3390/agronomy10040603
Submission received: 17 March 2020
/
Revised: 15 April 2020
/
Accepted: 16 April 2020
/
Published: 23 April 2020
Abstract
:The complex formation of grain yield (GY) is related to multiple dry matter (DM) traits; however, due to their time-consuming determination, they are not readily accessible. In winter wheat (Triticum aestivum L.), both agronomic treatments and genotypic variation influence GY in interaction with the environment. Spectral proximal sensing is promising for high-throughput non-destructive phenotyping but was rarely evaluated systematically for dissecting yield-related variation in DM traits. Aiming at a temporal, spectral and organ-level optimization, 48 vegetation indices were evaluated in a high-yielding environment in 10 growth stages for the estimation of 31 previously compared traits related to GY formation—influenced by sowing time, fungicide, N fertilization, and cultivar. A quantitative index ranking was evaluated to assess the stage-independent index suitability. GY showed close linear relationships with spectral vegetation indices across and within agronomic treatments (R2 = 0.47–0.67 ***). Water band indices, followed by red edge-based indices, best used at milk or early dough ripeness, were better suited than the widely used normalized difference vegetation index (NDVI). Index rankings for many organ-level DM traits were comparable, but the relationships were often less close. Among yield components, grain number per spike (R2 = 0.24–0.34 ***) and spike density (R2 = 0.23–0.46 ***) were moderately estimated. GY was mainly estimated by detecting total DM rather than the harvest index. Across agronomic treatments and cultivars, seasonal index rankings were the most stable for GY and total DM, whereas traits related to DM allocation and translocation demanded specific index selection. The results suggest using indices with water bands, near infrared/red edge and visible light bands to increase the accuracy of in-season spectral phenotyping for GY, contributing organ-level traits, and yield components, respectively.
1. Introduction
In wheat, grain yield formation is influenced by various growth factors, including sowing date, fungicide intensity, N fertilization, and genotypic potential [1,2,3,4,5,6,7,8]. However, treatment effects strongly differ by environments, and interactions between these agronomic measures are relevant [2,9,10,11,12]. Therefore, numerous field trials are required to assess the optimum level of agronomic treatments in specific cropping regions. On the other hand, plant breeders are compelled to screen large numbers of genotypes for their yield potential under field conditions [13]. However, owing to the time- and cost-intensive determination of further traits, most of the trials focus on grain yield (GY) and a few other traits, such as plant height, anthesis date, and disease incidence. Thus, the primary effects of the considered treatments are often not addressed, which, however, could optimize the breeding process [14] or allow cultivar-specific fertilization and fungicide strategies [15,16]. Tested in common trials, these strategies can be further optimized when accounting for the characteristics of the cultivar and the cultivar group, i.e., line and hybrid cultivars. The use of non-destructive high-throughput phenotyping techniques could improve the understanding of GY-related mechanisms and allow low-cost objective assessments, thus widening the phenotyping bottleneck. However, it requires further evaluation with respect to sensor suitability, the selection of spectral vegetation indices (SVI), and optimum growth stages for measurements [17,18].
Yield formation depends on the photosynthetically active leaf area and biomass as well as its duration over time, thus demanding the detection of phenology and senescence status, which is often still visually evaluated [19,20,21]. However, approximately two-thirds of the vegetative biomass is allocated to the stems, partially contributing to GY via translocated DM [7,22]. Conversely, spike biomass at anthesis can be related to the sink size, which is often yield-limiting in wheat [23]. Furthermore, GY is a function of total dry matter (DM) and its efficient allocation to the grain (harvest index HI; [24]). Treatments, such as the timing of sowing and N fertilization applied early in the season, may affect total DM more than the HI, whereas fungicide level often has stronger effects on the HI, and cultivars differ in both traits [25]. Considering these different treatment effects with respect to biomass accumulation and allocation, to plant organs and to different growth stages, optimum dates for spectral measurements may differ; however, they were rarely compared systematically. The same applies to the suitability of different SVIs, leading to the question whether index selection based on data dominated by ‘agronomic’ treatments, i.e., fungicide, sowing time and N fertilization, can be transferred to data dominated by genotypic differences, representing breeding trial scenarios [26].
Several studies have reported the useful in-season estimation of GY in wheat [27,28,29,30,31,32,33,34,35,36]. Often, increasing correlations until milk ripeness were reported [26,28,37,38,39], but also heading and anthesis [39,40] as well as stem elongation–heading [41] were found to be useful, albeit predominantly for differentiating GY of genotypes. In spring barley, the DM of leaf blades, followed by culms, was mostly better estimated than that of spikes and leaf sheaths [42]. Studies on wheat breeding lines suggested red edge (RE)-based SVIs for DM at anthesis and maturity [41,43] and found better estimations in thin, less-saturated canopies. The detection of N fertilization effects is well established [44,45] whereas the previous applications of spectral sensing for disease detection focused on leaf level measurements and imaging techniques for guiding fungicide applications [15,46].
The present study evaluates the spectral estimation of DM data previously reported by Prey et al. (2019a) [25], including plant- and organ-level DM traits at anthesis and maturity, DM allocation and translocation as well as yield components in response to two levels of N fertilization, fungicide intensity and sowing dates for six winter wheat cultivars. It complements an analysis on index-based phenotyping of the dataset’s N traits [47]. This previous study reported a good estimation of grain N uptake in all treatment combinations by using RE indices, while the estimation of N translocation, partitioning and grain N concentration was restricted to the agronomic applications rather than genotypic differences. However, the index rankings for DM traits may likely differ from those for N traits. Thus, the present study aimed at evaluating (i) the ability to estimate GY-related DM traits, (ii) the suitability of vegetation indices, (iii) optimum growth stages, as well as (iv) the differences resulting (i–iii) from the contributing treatments.
2. Materials and Methods
2.1. Experiment and Plant Sampling
The field trial was conducted as a split-split-plot design with control (Cont)/reduced fungicide (RF)/early sowing (sowing date 1: SD1) on the main plot (MP), N level (N) on the sub-plot and cultivar (Cv) on the sub-sub-plot during the 2016/2017 growing season in southeastern Germany (48.406° N, 11.692° E). Thus, it represented genotypic and management effects, but not that of varying environments. The soil was homogeneous Cambisol of silty clay loam. The average annual temperature is 7.5 °C, and the annual precipitation is approximately 800 mm. The previous crop was grass-clover, resulting in high soil N content and dense canopies. Six cultivars (line cultivars Impression, JB Asano and Kerubino, and hybrid cultivars Hybred, Hyland and Hystar) of winter wheat (Triticum aestivum L.) were mechanically drilled at a depth of 3 cm with a row spacing of 12.5 cm at 350 kernels m−2. The plots were 1.5 m wide and 6.4 m long. The cultivars differed in yield components, disease susceptibility, and phenology. The sowing date was September 28 for SD1, and October 23 for Cont and RF. Each cultivar was treated at two N levels, applied in two doses (N1: 60 kg N ha−1; N2: 120 kg N ha−1) within each of the three MPs, and in four replicates per N level, resulting in four replicates for each factor combination (MP*N*Cv). Foliar fungicide was applied twice in Cont and SD1 plots but not in RF plots. The study year was characterized by overall favorable weather conditions with above-average temperatures and radiation during March, May and June in spite of the below-average conditions in April. Conversely, precipitation was above-average in April and July but below-average in May and June, leading to mild drought stress and accelerated senescence in some cultivars during the grain filling phase. See [25] for details on the field trials.
Biomass was sampled at mid-flowering as well as at physiological maturity and manually separated into flag leaves, flag leaves-1 (second leaf layer from above), ‘other leaves’ (remaining leaves), culms including leaf sheaths, and spikes. After final sampling, all plots were harvested (August 01–02) using a combine harvester. In addition to organ-level DM traits, derived plant traits were calculated, including yield components, the harvest index (HI), post-anthesis assimilation (PAA), dry matter translocation (DMT), DMT efficiency (DMTEff), contribution of PAA to grain filling (CPAA) as well as N utilization efficiency (NutEff) and N use efficiency (NUE) for total dry matter and GY at maturity, respectively. Although NutEff and NUE included total N uptake (Nup) and fertilized N in the calculation, they represent normalized DM traits. Additionally, anthesis date and plant height were included. Refer to [25] for details and Table S1 for a list of all traits.
2.2. Spectral Measurements and Data Preparation
Spectral measurements were performed on 10 measurement days during the main growth stages from leaf development at end of March until hard dough ripeness in the middle of July (Table 1). The measurements were conducted with the PhenoTrac 4 mobile sensor platform [42], using a hyperspectral bidirectional passive spectrometer (tec5, Oberursel, Germany), measuring at a nominal resolution of 3.3 nm between 300 and 1000 nm. The distance to the canopy was approximately 80 cm, and plot boundaries were excluded. A recording frequency of 5 Hz along with the RTK-based localization (real-time kinematic global positioning system; Trimble, Sunnyvale, CA, USA) allowed gapless coverage of the plots. The spectra were smoothed using a five-band moving average filter [44] to remove spectral noise.
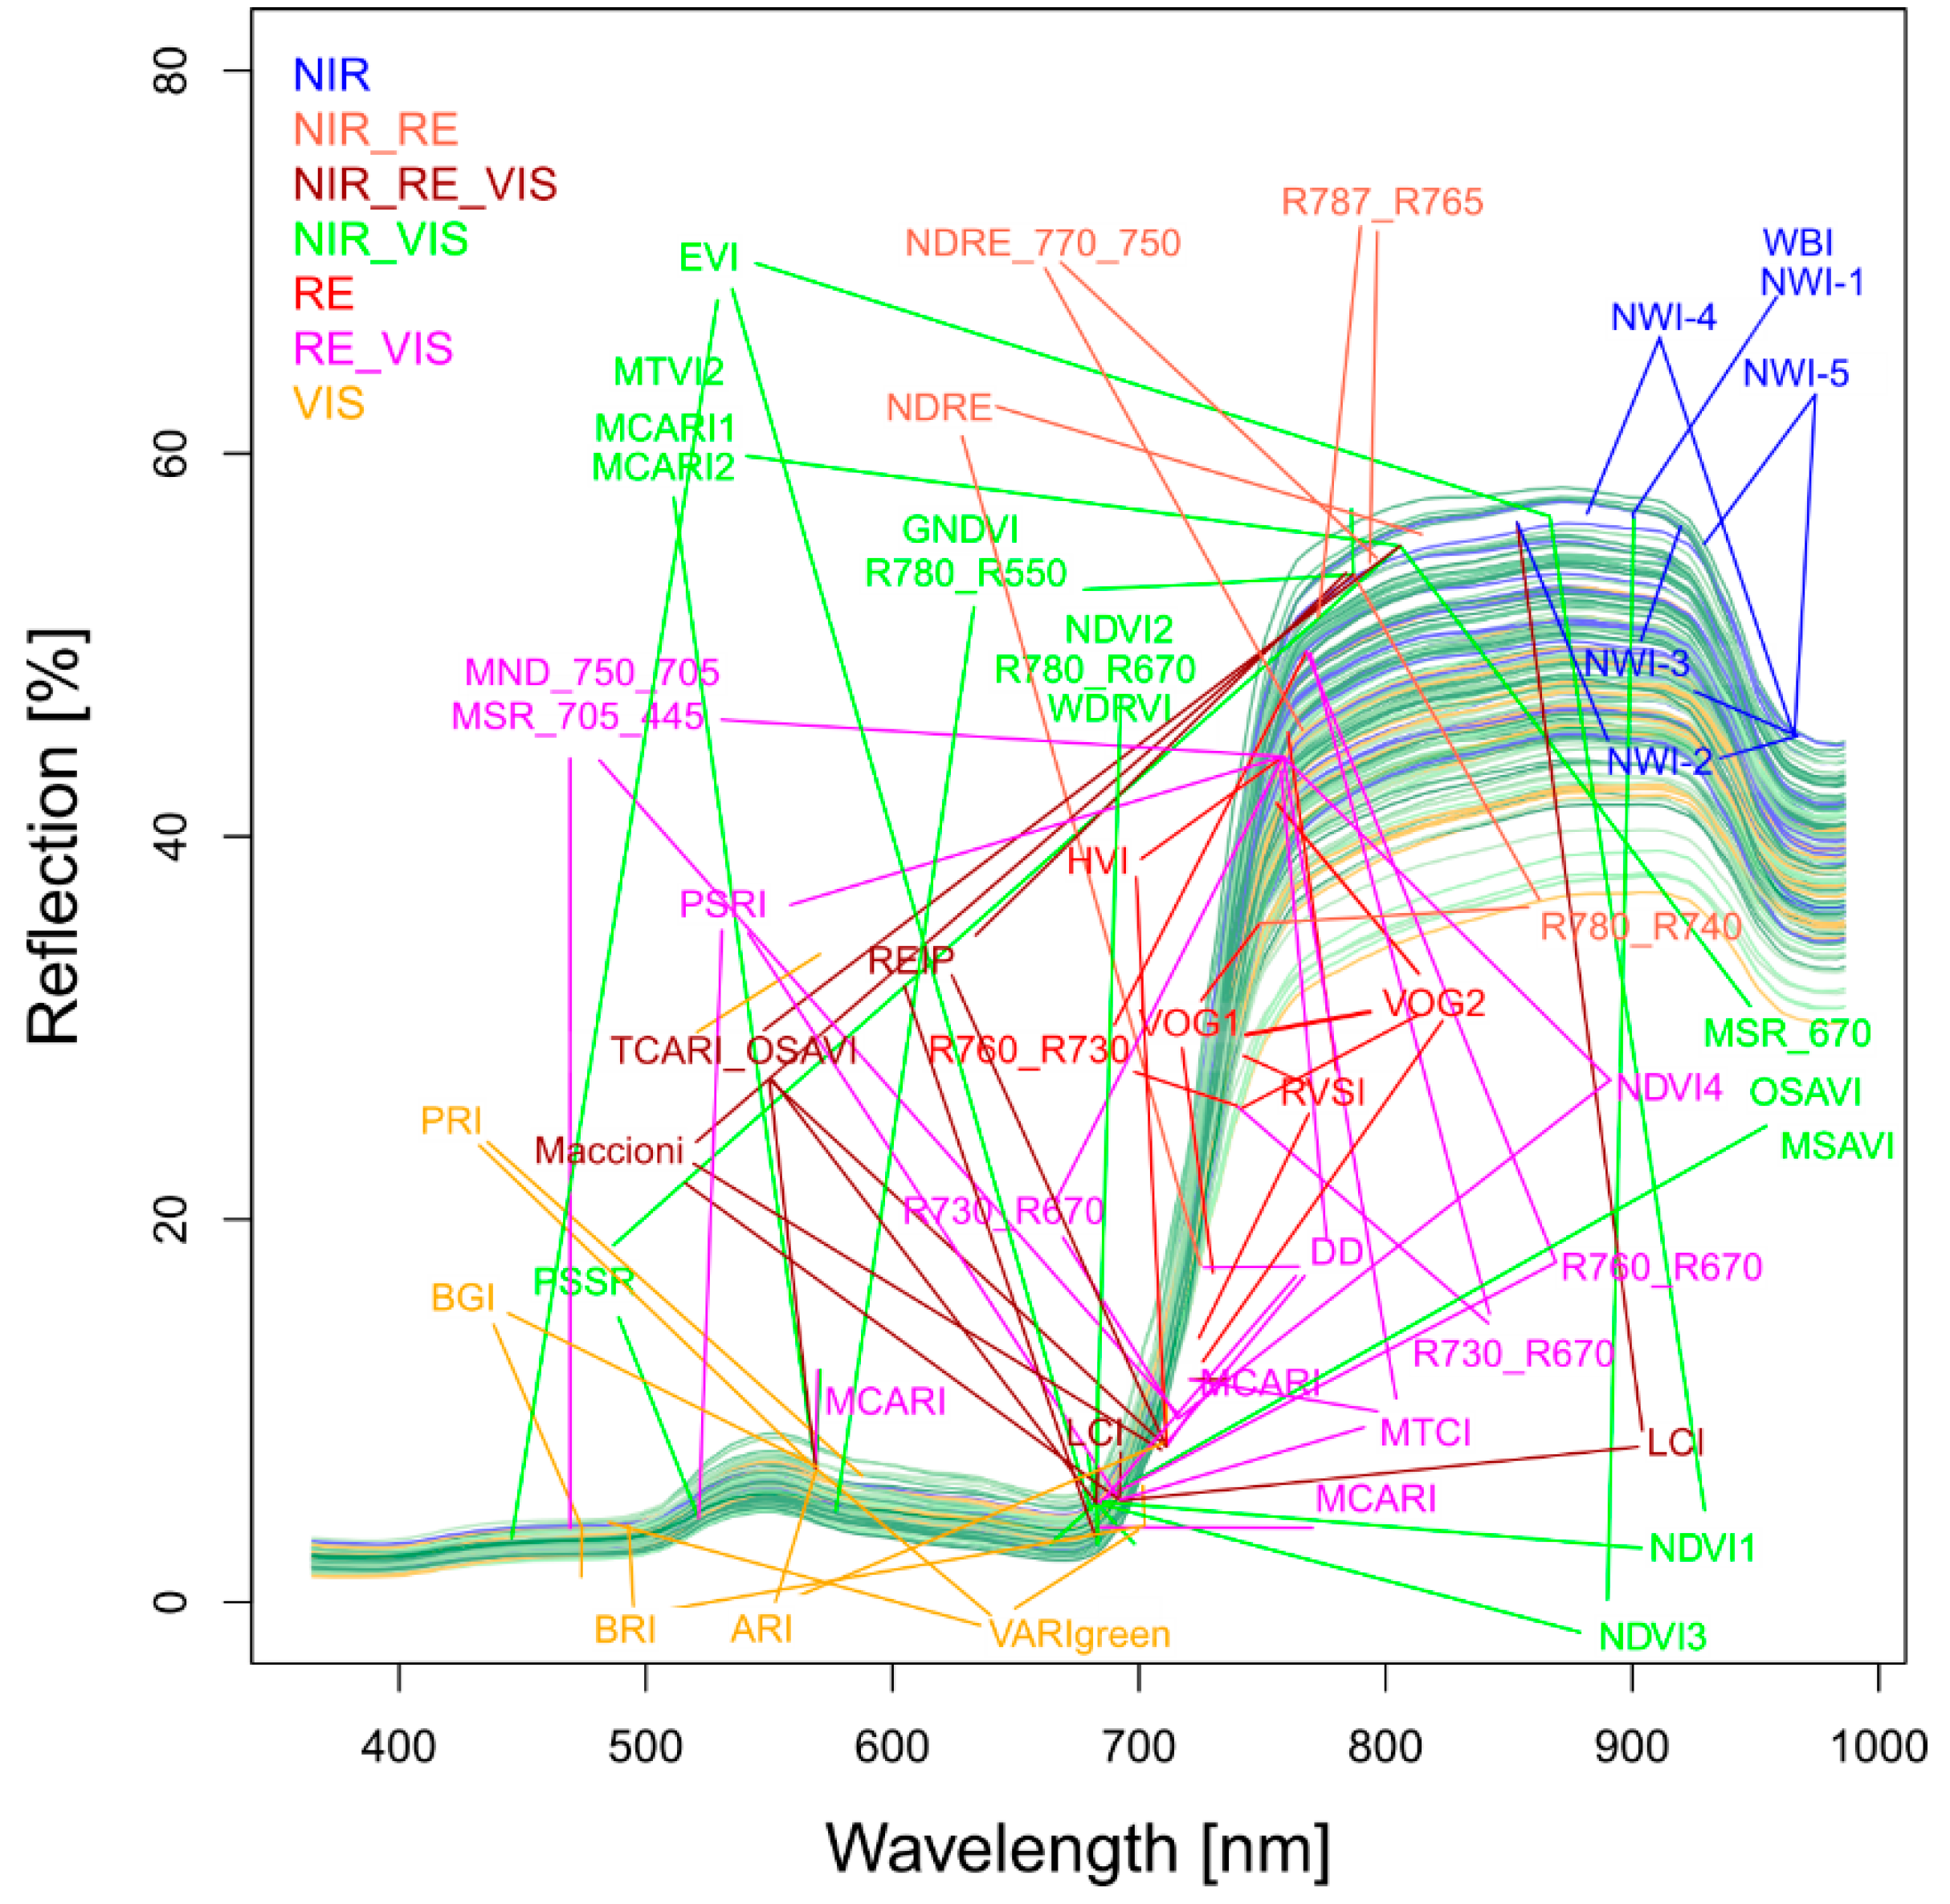
According to previous studies and similar to [47], 48 SVIs were selected from literature (Table S1). The indices were grouped per included spectral range (visible light VIS, red edge RE and near-infrared NIR), with VIS < 700 nm, ‘extended’ RE: 700–765 nm and NIR > 765 nm (Table S2, Figure 1). The upper RE boundary was higher than that in the common definition to include indices with a NIR/RE band closer to the RE than the normalized difference vegetation index (NDVI; NIR = 780 nm), because the reflection increased until approximately 770 nm (Figure 1). See Table S2 for the equations of all tested SVIs and Figure 1 for the position of the included bands.
2.3. Statistical Analysis
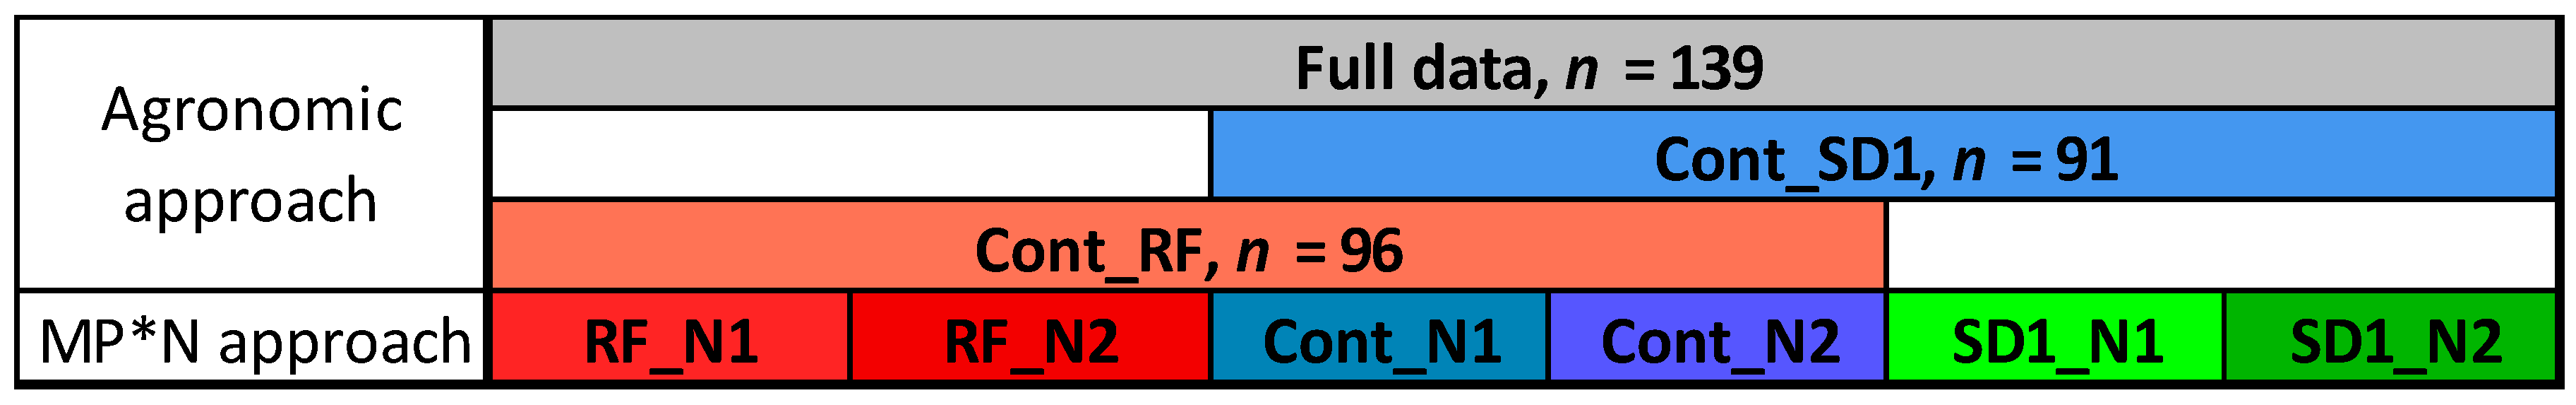
For each sampling date, SVIs were tested using simple linear regression with the DM traits across the values of the four replicates. The data analysis was conducted in R 3.4, using the lm-function (R Core Team, 2017). The coefficient of determination (R2) was used to compare the relationships. Significance levels correspond to p < 0.001 (***), p < 0.01 (**) and p < 0.05 (*). To assess the influence of the contributing treatments on the trait estimation, the relationships were compared for different data subsets to consider different treatment combinations either in agronomic factor trials or in breeding yards: (i) full data, (ii) combined Cont and SD1 data (‘Cont_SD1′), (iii) combined Cont and RF data (‘Cont_RF’), and (iv) six main plot*N level (MP*N) combinations (Figure 2). Considering the MP*N blocks as possible trial environments created by the main plot (MP) treatments in combination with N levels for assessing genotypic variation, as used by plant breeders, the results of these blocks were averaged and compared for the aggregated, averaged data (n = 6). Testing using different datasets aimed at assessing the potential for trait estimation under various influencing conditions. Thus, conditions in (iv) can simulate conditions for phenotyping genotypic variation, whereas those in i–iii are referred to as ‘agronomic’ conditions. The relationships were compared regarding the estimation potential by trait, the index ranking and optimum measurement stages.
To overcome the influence of differing growing conditions and the date-specific index ranking, indices were quantitatively ranked by their normalized performance for each trait in each dataset. The across-dates (n = 10) mean and maximum coefficients of determination (R2) values of each index were normalized to the trait-specific average mean and maximum R2 from all SVIs within each of the three ‘agronomic’ datasets and the MP*N data, respectively. A value > 1 indicated a comparative advantage of the index for the trait under consideration. Thereafter, the relationships (R2) and the index rankings were compared between datasets. Consequently, the within-dataset mean and maximum rankings were summed up (i) across the three ‘agronomic’ datasets and (ii) for the MP*N dataset, respectively, to achieve a more robust ranking across contributing treatments. The mean- and maximum-based rankings were combined by summing the rankings for identifying one index per trait. Considering a selection of indices robust towards date-specific suitability as more important, the mean-based ranking was double-weighted. These weighted mean/maximum-rank sums (WMMRS) were used to identify one trait-specific optimum index from the ‘agronomic’ approach, irrespective of the R2 level achieved, with WMMRS of < 9 indicating below-average and WMMRS of > 9 above-average index performance for a specific trait. The performance of the WMMRS-based best indices was compared over time both in the agronomic datasets and the MP*N dataset to validate the transferability of the index section between agronomic and breeding trials. In addition, the stability of the agronomic rankings was compared with the WMMRS-rankings of the MP*N approach using Spearman’s rank correlation coefficient.
3. Results
3.1. Optimized Index and Date Selection Considering the Contributing Treatments
The best relationships found for all trait * index combinations indicated considerable differences in the index suitability.
3.1.1. Grain Yield
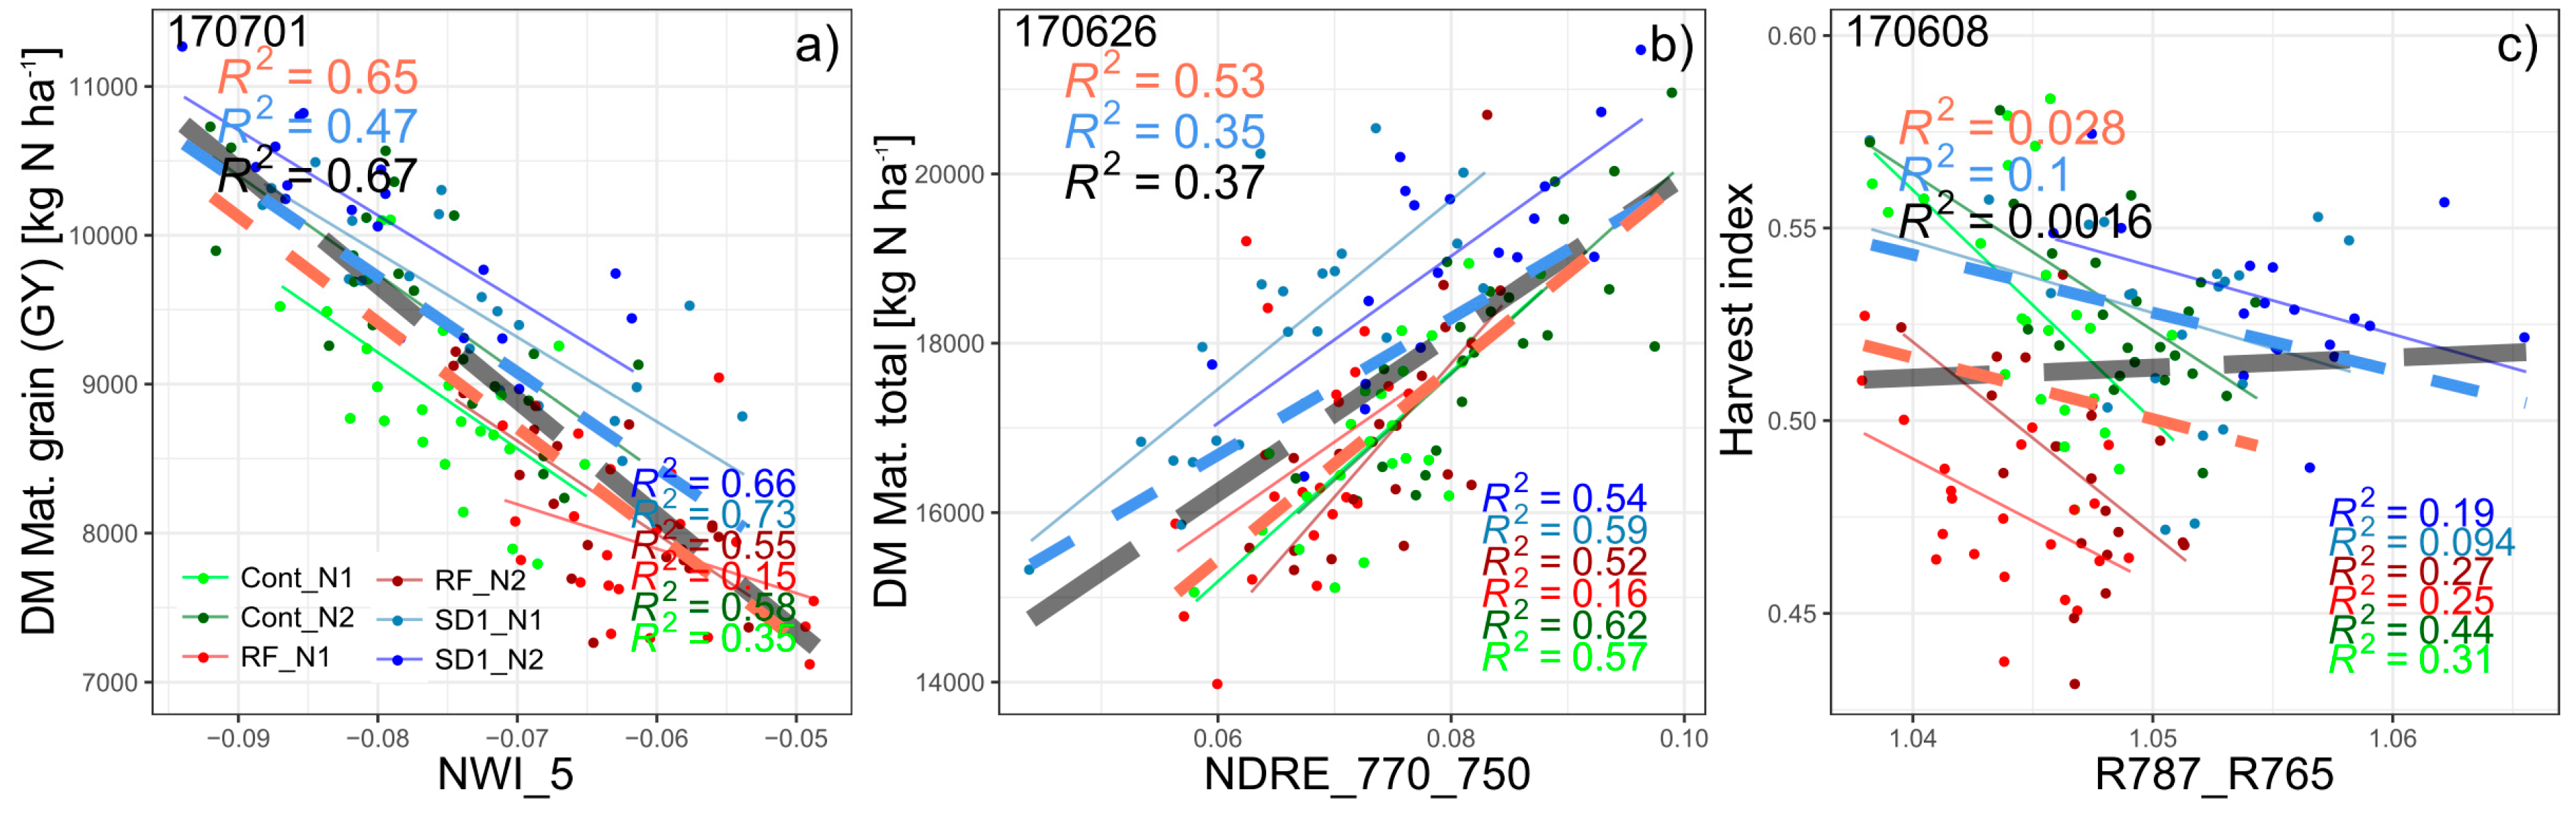
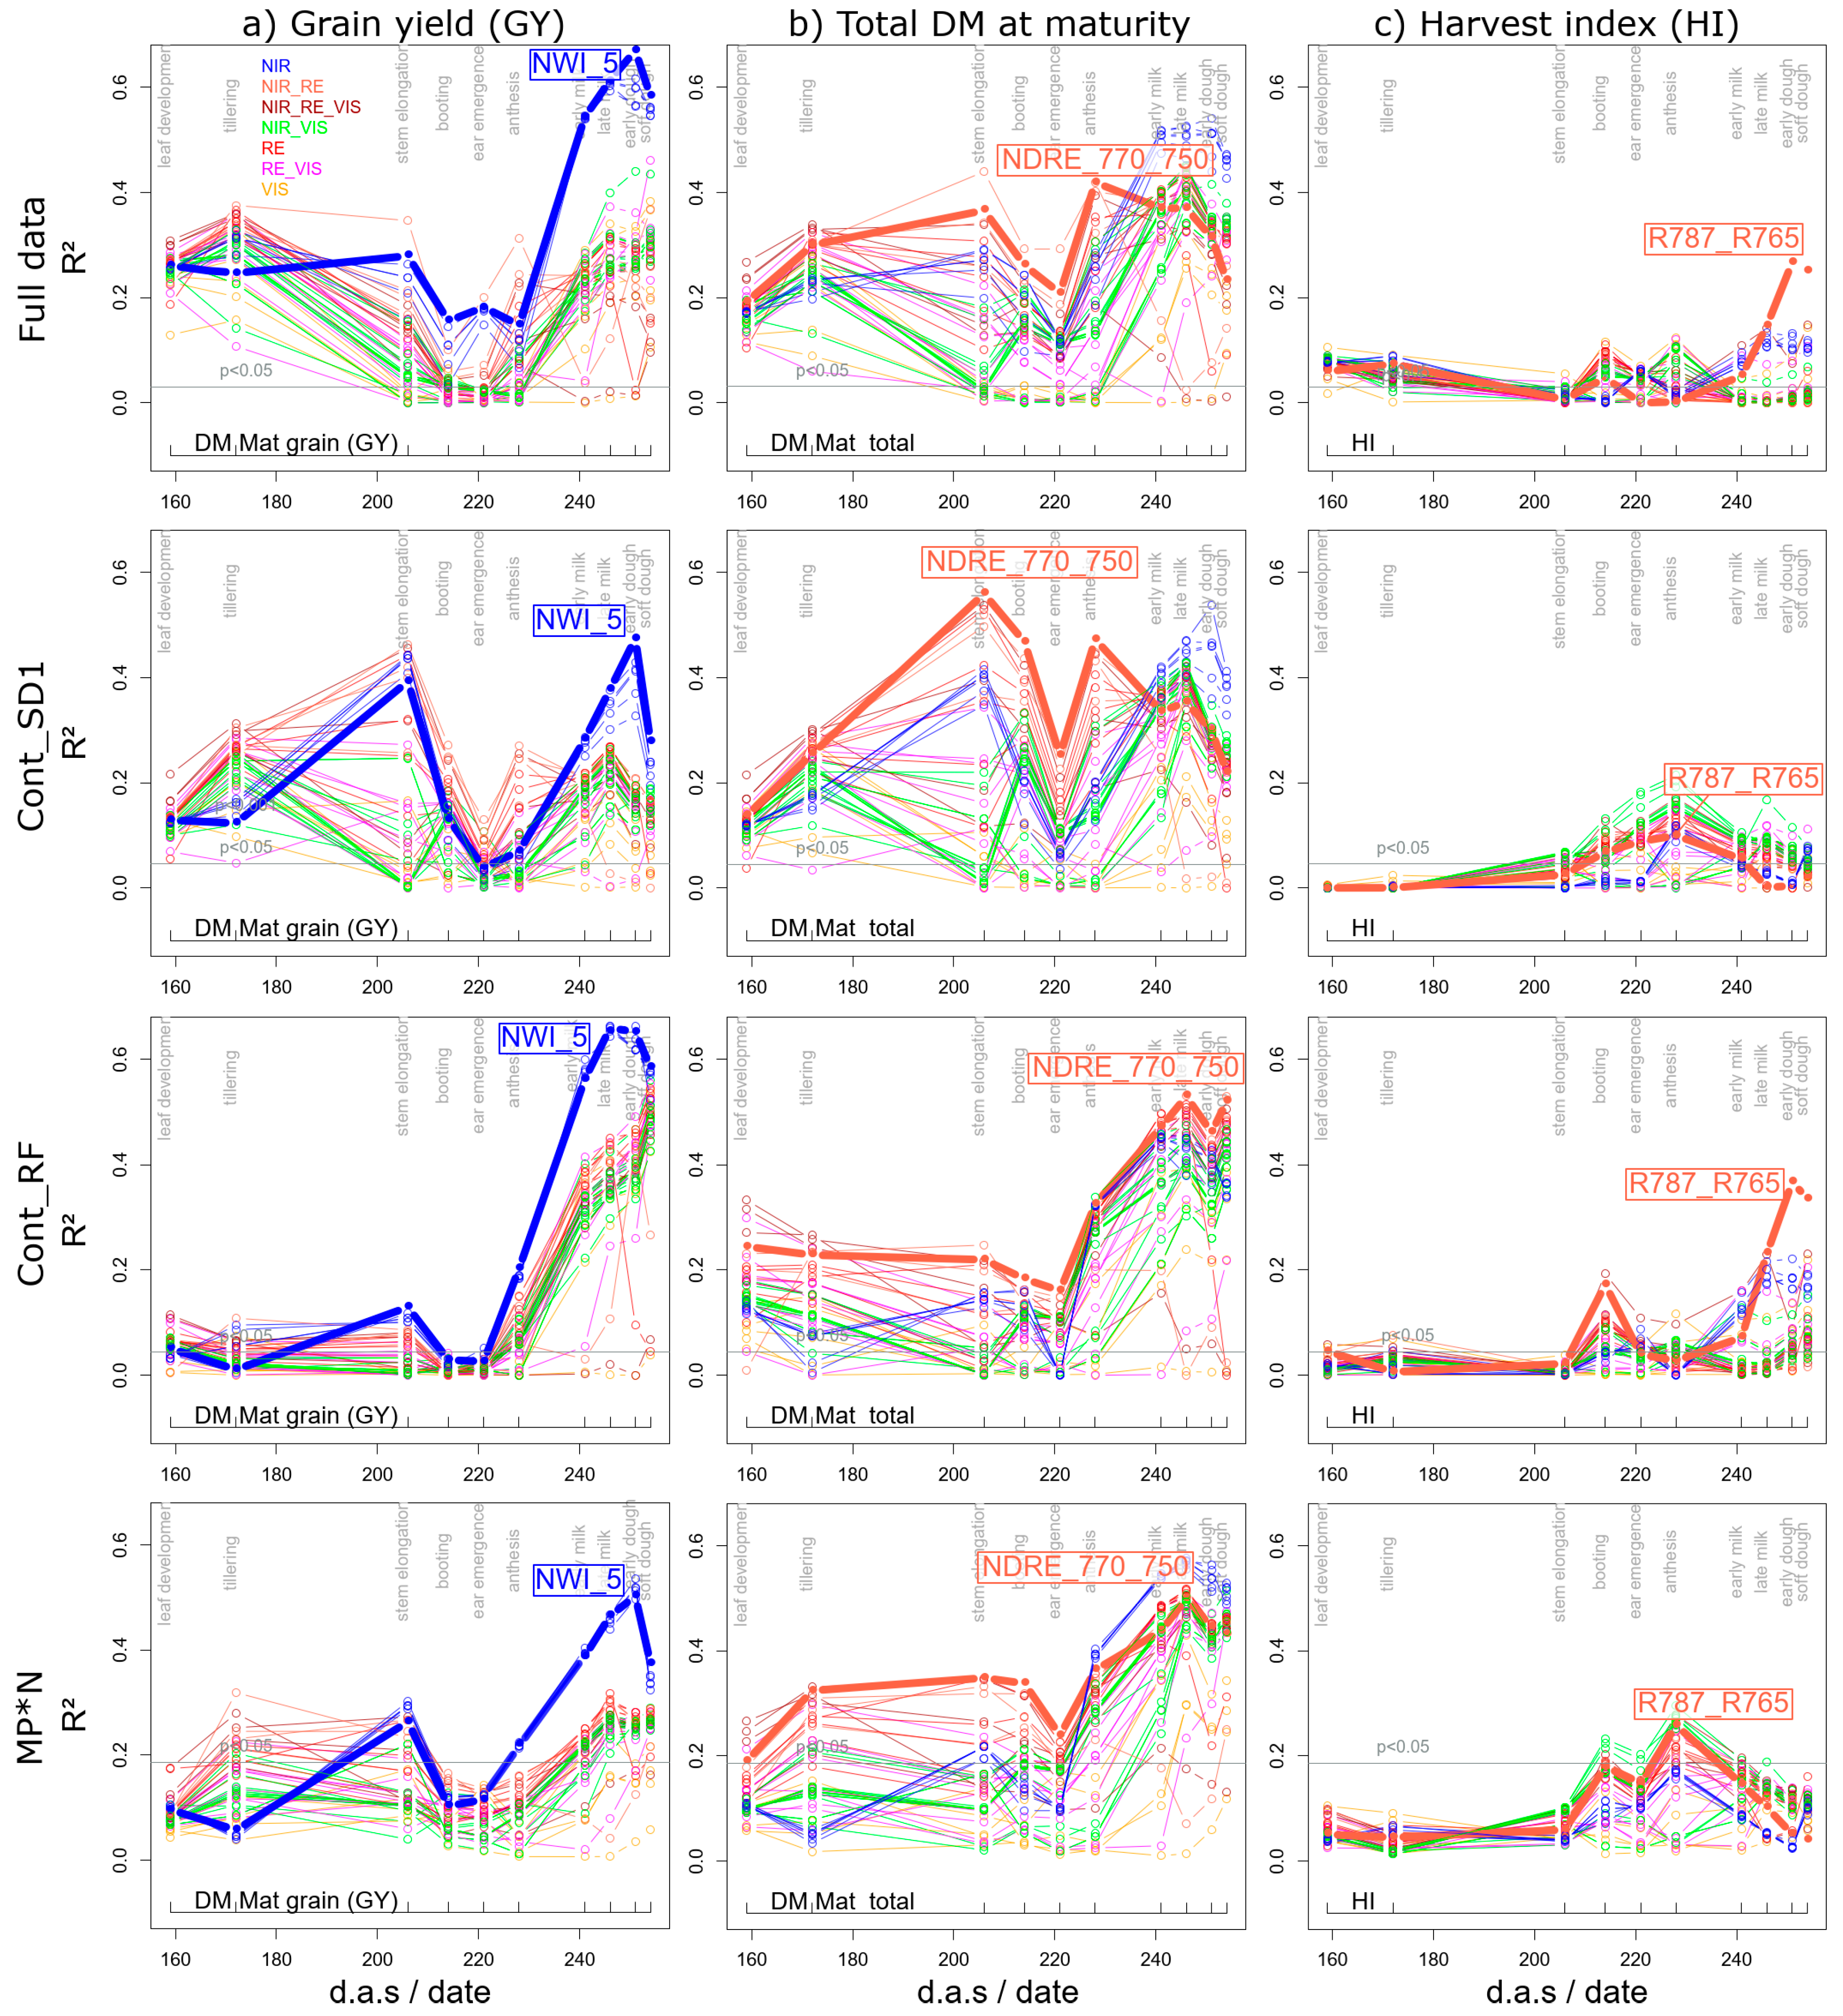
Both for the full data (Figure 3a, Figure 4a and Figure 5a), and the average results from the six MP*N combinations (Figure 3b, Figure 4a and Figure 5a), a strong advantage is visible from all NIR-based water band indices for grain yield (GY; DM grain) and total DM. In contrast, several other indices performed similarly well in the Cont_SD1 and Cont_RF subsets (Figure S1). Still, the NWI_5 ranked highest—with the weighted mean/max rank sum ranking (WMMRS) of 15 in the agronomic ranking being by two thirds better than the average of the tested index ensemble, and clearly above the best non-water band index (R780_740; WMMRS = 11). In contrast, the NWI_5 and the best NIR/RE indices ranked similarly for total DM at maturity with a slight advantage of the NDRE_770_750 (WMMRS = 13). In all four data subsets, one of both traits was the best estimated among the direct plant traits. The NWI_5 reached coefficients of determination (R2 ***: p < 0.001) of 0.67, 0.47, 0.65, and 0.50 for GY in the full dataset, Cont_SD1, Cont_RF and from the average of the six MP*N combinations, respectively (Table 2; Figure 4a), corresponding to RMSE-values of 404–549 kg ha–1 (not shown). For all subsets, the best measurement dates were either 07/01 (month/day; early dough ripeness) or 06/26 (milk ripeness) for GY (Table 2). Figure 5a depicts the seasonal R2-values in the four datasets for GY from all indices and the highlighted WMMRS-based best index NWI_5. The blue lines demonstrate a clear advantage of the NIR-based water band indices over all other indices during the most suited phase at grain filling. For all datasets, the phase of booting/ear emergence/anthesis was less suited. For the full data, Cont_SD1, and MP*N, already moderate relationships (R2 ≈ 0.30–0.40 ***) are visible during tillering and stem elongation. However, this was not confirmed in Cont_RF, and the index ranking was not stable in this phase. For total DM (Figure 5b), all datasets except Cont_RF confirmed the advantage of the water band indices only during the later grain filling with a slight outperformance over many other indices. Instead, the rank-best index NDRE_770_750 was more suited during the vegetative phase in all datasets. R2-values (≈0.50 ***) were highest in Cont_SD1 already during stem elongation, whereas as for GY, only the post-anthesis phase exhibited good relationships in Cont_RF and MP*N. With GY being a multiplicative function of total DM and its relative allocation to the grain (harvest index; HI), relationships with HI were tested as well, but showed low potential (Figure 5c). Only the R787_765 yielded useful relationships at dough ripeness in Cont_RF (R2 = 0.37 ***) and in the full data (R2 = 0.27 ***), as well as in MP*Nat anthesis, but not within all MP*N blocks (Figure 4c).
3.1.2. Further Direct DM Traits
In all four datasets, the level of the best relationships for organ-level DM traits was comparable for almost all NIR/VIS and RE-based indices (Figure 3 for the full data and MP*N; Figure S1 for Cont_RF and Cont_SD1). The R2-level was markedly higher in the MP*N subset and Cont_SD1 than in the full data and Cont_RF, and tended to be higher for maturity traits than that for anthesis traits. Notably, the DM of stems and spikes and total DM at anthesis were hardly detectable in the full data, Cont_SD1 and Cont_RF (R2 always < 0.20). The DM of leaves was better detected, both in the ‘agronomic’ datasets and in MP*N (Figure 3 and Figure 6; Table 2.). At anthesis, the relationships were closer for the flag leaf and flag leaf-1 than those for ‘all leaves’ and the lower leaf layer; however, they were approximately similar for maturity and anthesis leaf DM traits. Indices including green bands (GNDVI and R780_R550) ranked best for ‘all leaves’, ‘other leaves’ and ‘flag leaf-1′. The index rankings for the most direct DM traits were comparable between the ‘agronomic’ and MP*N approaches.
3.1.3. Derived DM Traits
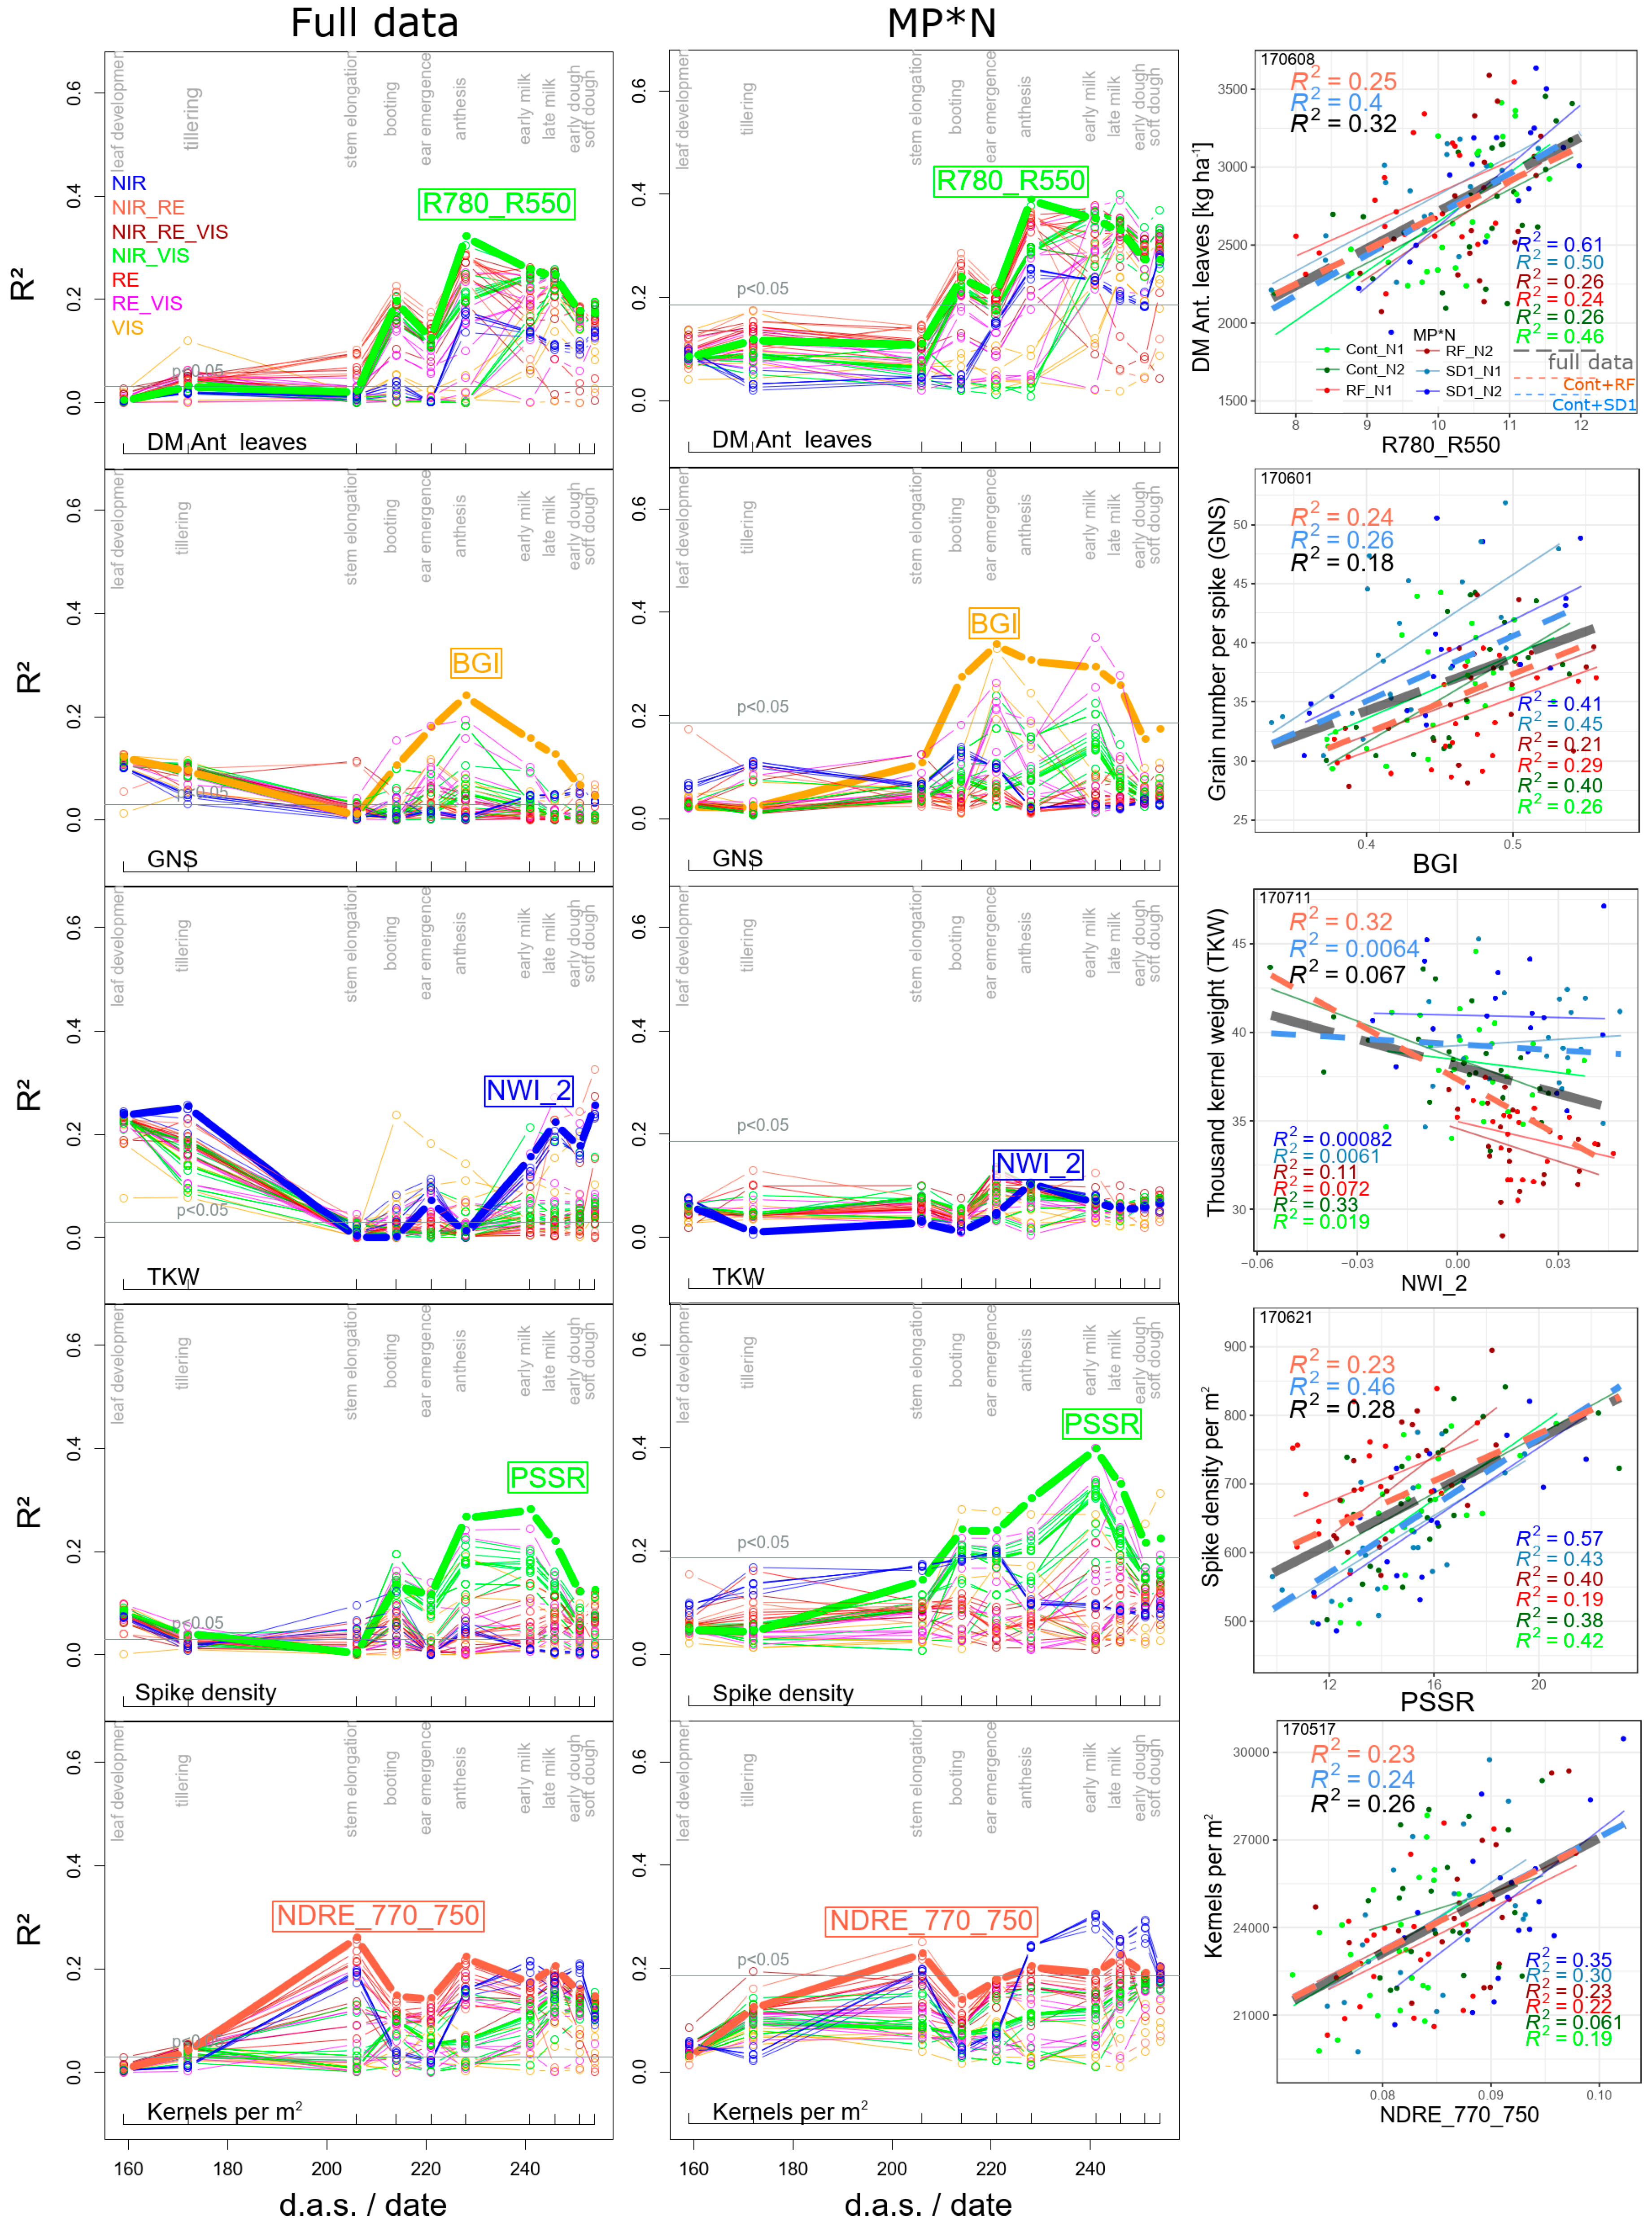
Neither for the ‘agronomic’ datasets nor for MP*N, any index assessed PAA, CPostAA, DMTEff, and DMT on a useful level. Among the yield components, moderate relationships were found for grain number per spike (GNS) in all datasets from the BGI (R2 = 0.24–0.34 from ear emergence to milk ripeness), as well as for the thousand kernel weight (TKW) only in the full dataset (R2 = 0.25) and Cont_RF (R2 = 43; both during early dough ripeness) from the NWI_2 (Figure 6; Table 2). Spike density was better detected by the PSSR index in Cont_SD1 (R2 = 0.46) and in MP*N (R2 = 0.40) than in the full data and Cont_RF, with R2-values peaking always at early milk ripeness (06/21). As for GNS, the BGI ranked highest for yield per spike (Table 2.). Moderate relations were found for kernels per m2 in all datasets, always being best during stem elongation (05/17); however, the NIR-based water band indices were better suited during grain filling in MP*N (Figure 6). With the N use efficiency (NUE) relating GY or total DM to fertilized N, R2-values (Figure 3) and index rankings were identical to those for GY and total DM, respectively, in the MP*N approach. In contrast, less close relationships were found in the full data (max. R2 = 0.38 for NUE_grain and R2 = 0.26 for NUE_total; Table 2)—only during later grain filling and with best relationships from the R787_765, RVSI, and TCARI_OSAVI indices. The ‘internal’ conversion efficiency, N utilization efficiency (NutEff), yielded better relationships with respect to grain DM than for total DM and was best assessed in Cont_SD1 (R2 = 0.46; Table 2). Thus, for a given red edge inflection point (REIP)-value, NutEff was lower in N2 than that in N1 and lower in RF than in the other main plots, respectively (not shown).
3.2. Index Ranking According to Traits and Datasets
For most traits, a good agreement was observed between maximum- and mean-based index rankings (example for GY in Figure 7), indicating that indices with the highest potential on the best dates (maximum ranks) were also better suited on less favorable dates. Aiming at an unequivocal index ranking, both measures were combined to weighted mean-maximum-based rank sums (WMMRS) by summing both rank values.
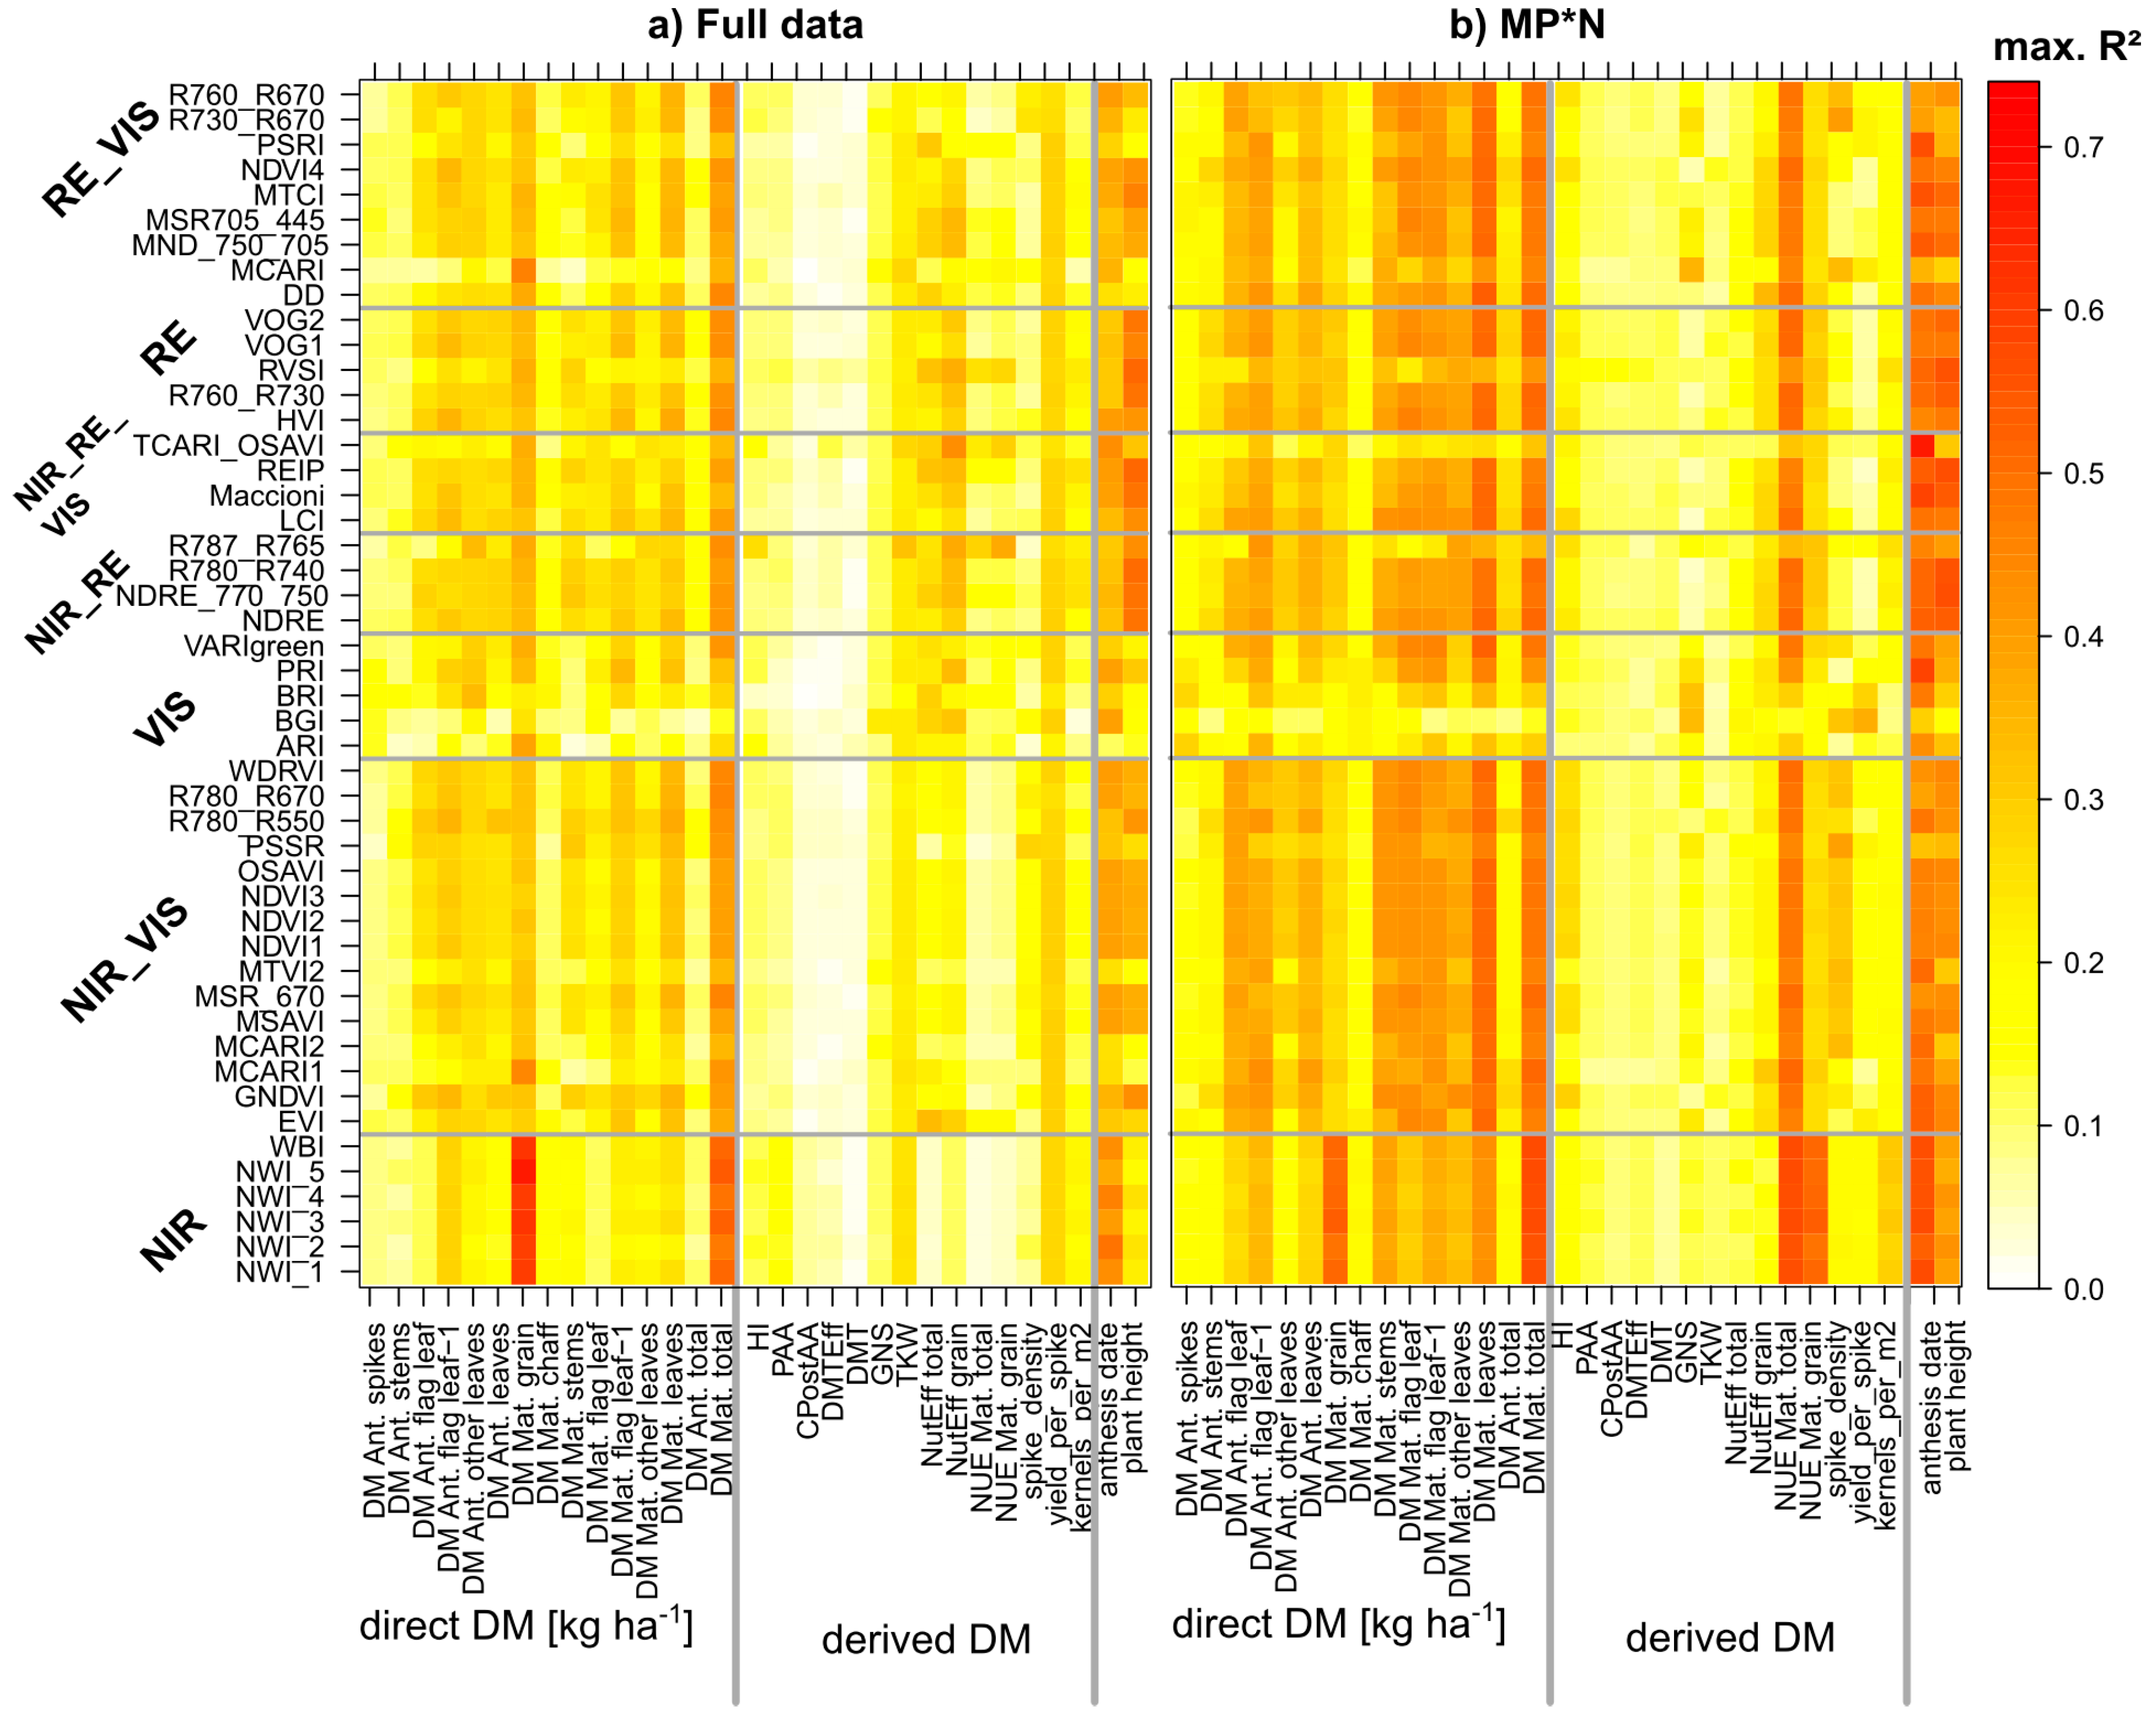
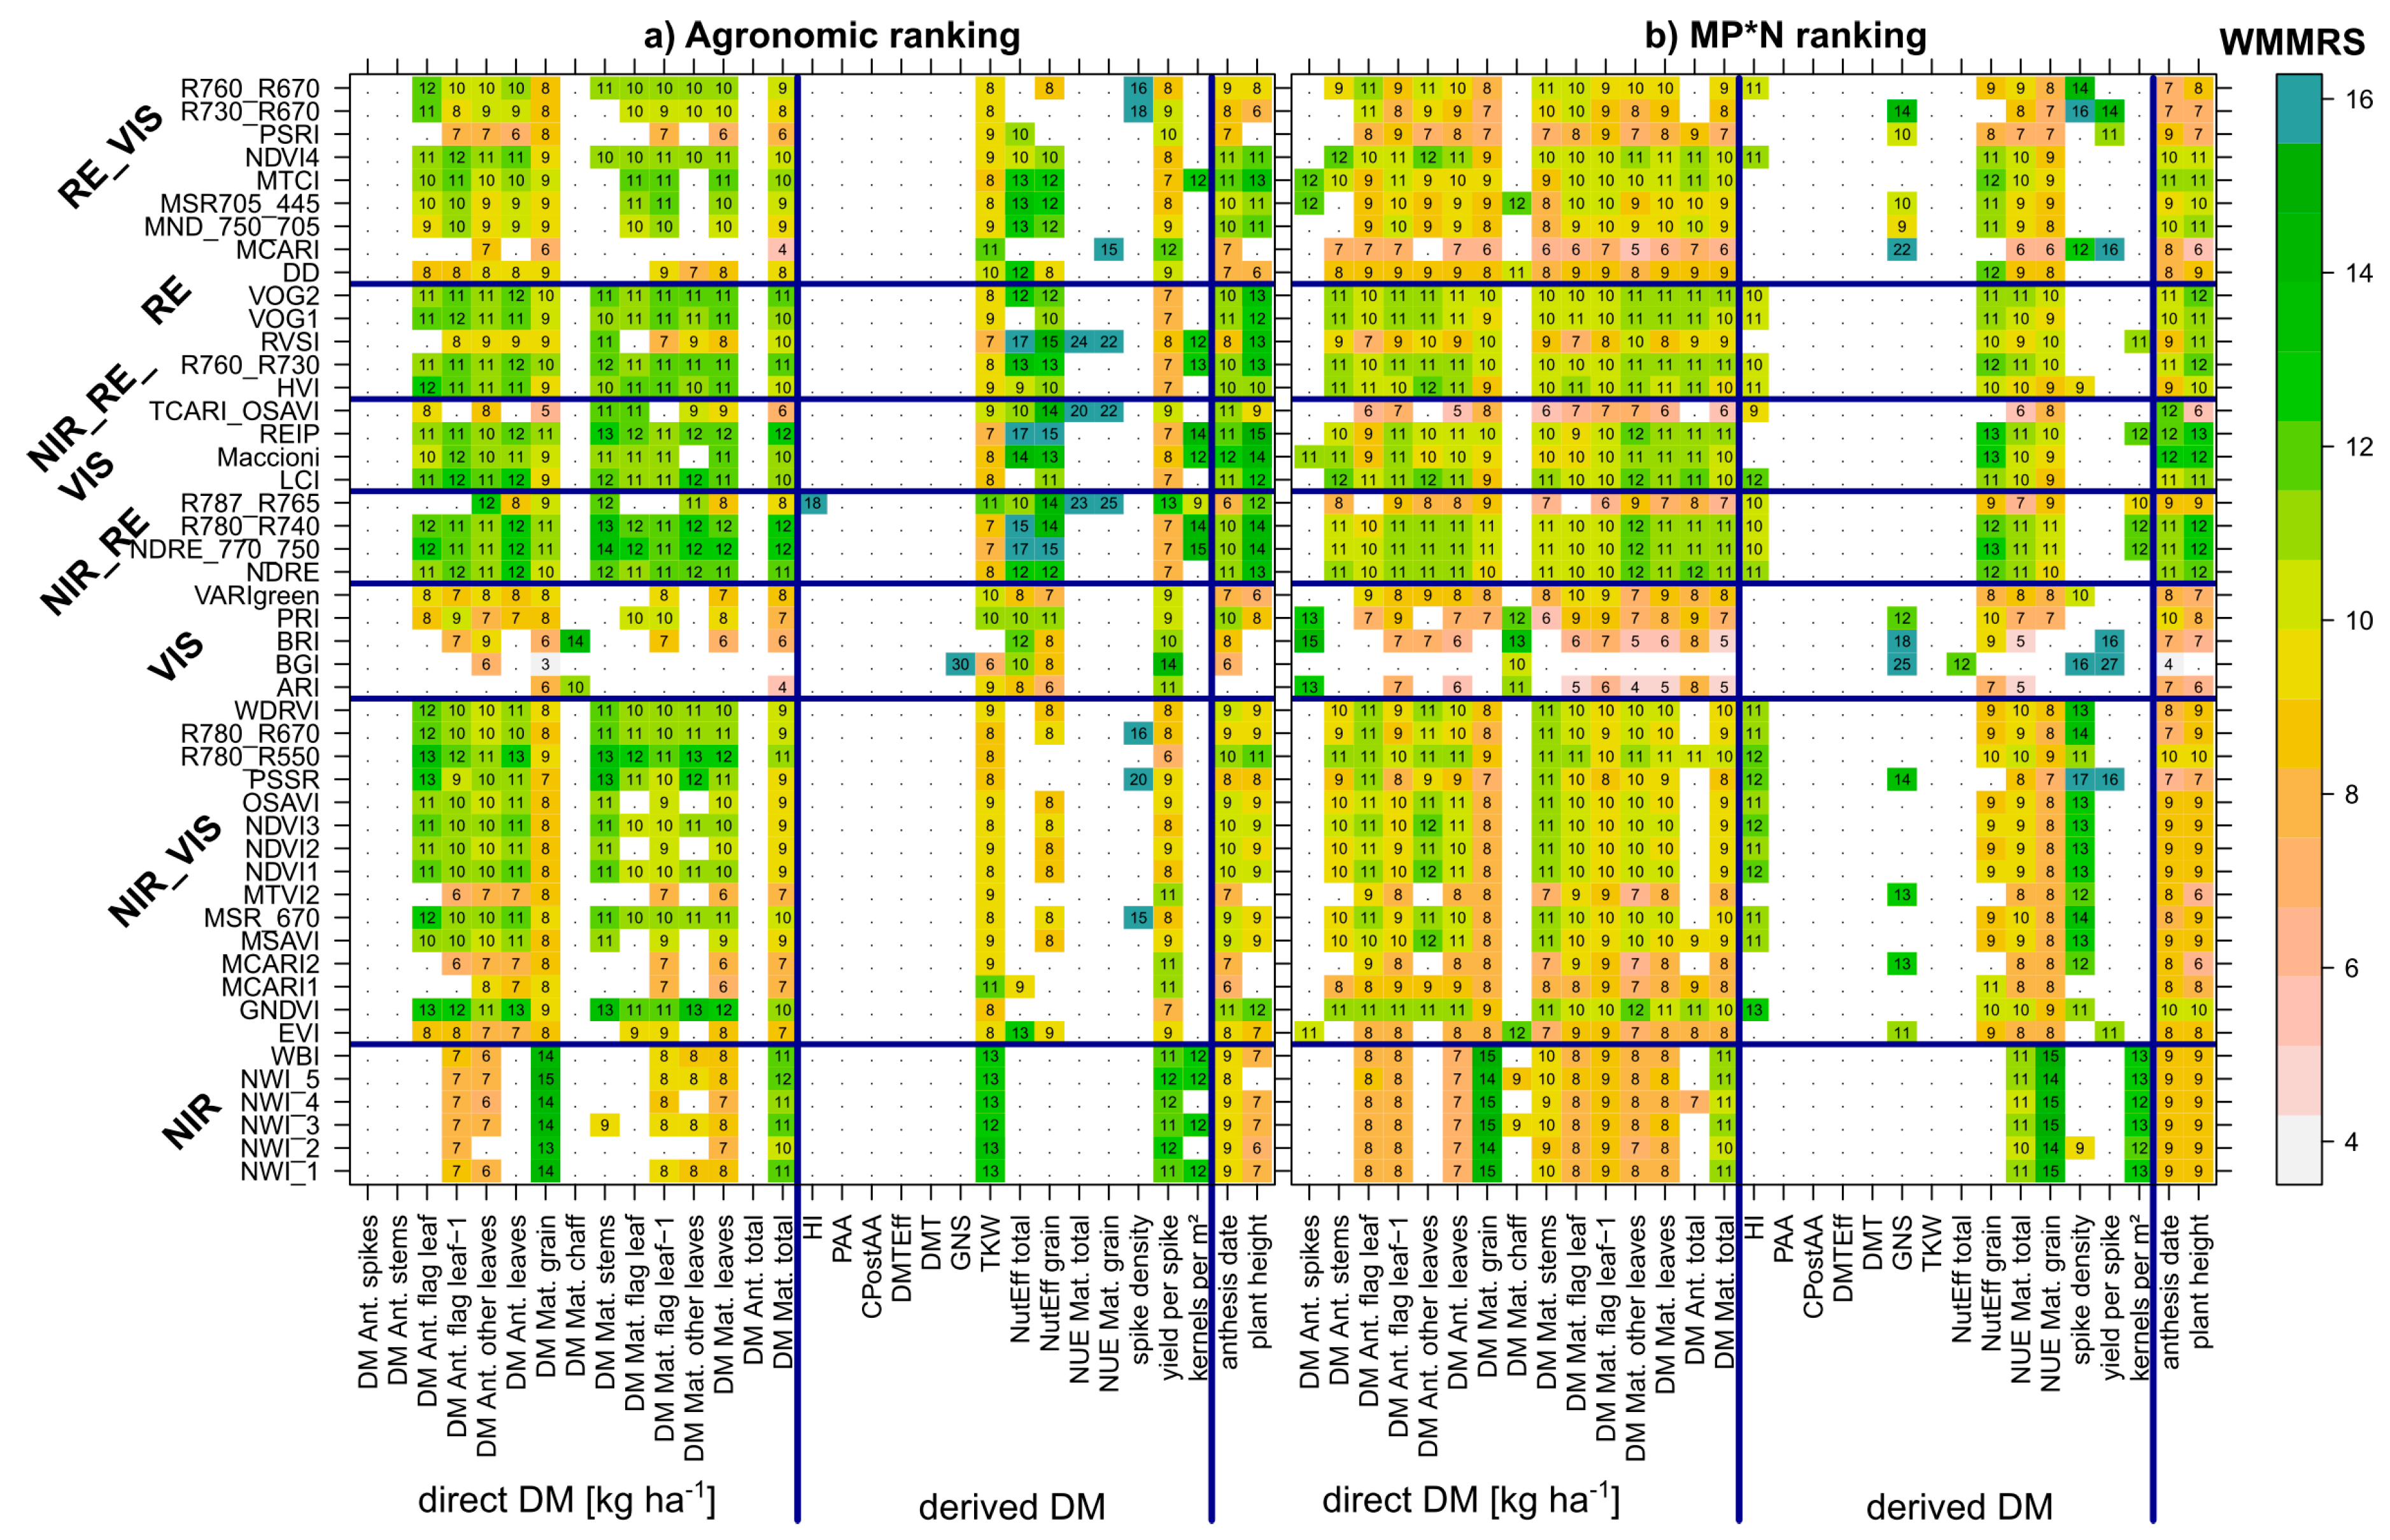
Figure 8 shows the WMMRS-values calculated for all evaluated trait*index combinations, for the combined rankings from the three ‘agronomic’ datasets (‘full data’, Cont_SD1 and Cont_RF; a), as well as for the rankings from the MP*N data (b), which were multiplied by three for direct comparison at the same numeric level. For each trait, the value of nine corresponds to the average ranking across SVIs. Due to some strong upper outliers, all values >15 were colored in the same blue shading for a better contrast of the other values. Considered irrelevant, rankings for trait*index combinations that did not exceed a threshold of R2-values of 0.20 are not shown (white cells). For the following traits, no index exceeded this threshold for the agronomic datasets: The DM of spikes and stems as well as total DM at anthesis, and the derived DM traits PAA, CPAA, DMTEff, and DMT. The mean and maximum-based rankings (Figure 7) and the combined rankings confirm the clear outperformance of the NIR-based water band indices, particularly for GY (WMMRS > 13; Figure 8), but also high rankings for total DM at maturity as well as for the yield components kernels per m2 in both rankings, TKW, and yield per spike in the agronomic ranking. However, for the other direct DM traits, most NIR/VIS indices except the EVI, MCARI1, MCARI2, and the MTVI2, and most RE indices, except the R787_765, TCARI_OSAVI, MCARI, DD, and PSRI yielded clearly higher and mostly similar rankings. The R787_765 and the TCARI_OSAVI reached high rank sums (WMMRS > 17) for the NUE traits in the agronomic ranking but not in the MP*N ranking, and the R787_R765 for HI in the agronomic ranking. Overall, only few indices reached relevant relationships (R2 > 0.20) in both rankings for most derived DM traits. In addition, this was observed partly for the direct DM traits in the agronomic approach, but the index rankings differed less in the MP*N approach. For each trait, the rankings from both matrices were correlated against each other for comparing the possibility of transferring the index selection optimized on one dataset to the other. As visible from the correlations between rankings (Table 3), the index rankings were relatively stable between both approaches for most direct DM traits, with Spearman’s ρ < 0.80 only for stem DM at both sampling dates, and flag leaf DM at maturity. Among the other traits, stable rankings (ρ > 0.86 ***) were found for the yield components GNS, spike density, and kernels per spike, as well as for plant height. Moderately stable rankings (ρ = 0.70 ***−0.82 ***) were found for PAA, NutEff total, NutEff grain, and anthesis date, but substantially differing rankings for the other trait.
4. Discussion
This study aimed at assessing the influence of the optimized selection of SVIs and of measurement stages/dates on the estimation of various DM traits, which influence the formation of GY as a function of the contributing treatments.
4.1. In-Season Estimation of Grain Yield and Contributing DM Traits
Grain yield can only be indirectly estimated by spectral measurements—both with respect to the temporal shift and the detected information at the organ level [42]. Although SVIs are primarily influenced by leaf area, chlorophyll content and leaf area distribution [48], seasonal influences are important as well, particularly post-flowering, which is the most important phase for grain filling [8], although it is influenced by progressive senescence. Therefore, this study included multiple DM traits that contribute to grain filling for elucidating the GY ~SVI relationships, and multiple measurement dates, given that the trial treatments influenced the traits in different phases [25]. Because of the effects of sowing date on the early development in terms of DM traits, canopy cover, and SVIs [49], and the positive yield effect of early sowing (SD1) [25], moderate relationships were found already during leaf development and tillering, but not in the datasets without varying sowing dates, corroborating results in a breeding population [26]. Moreover, given that R2-values again decreased to a minimum until ear emergence/anthesis, as also found in [26], this early discrimination confirms the spectral detection of early vigor [49,50], but should not be generalized for the prediction of grain yield. This seasonal pattern is in line with the previous GY estimation across the full trial data [51] and with the spectral estimation of the N traits [47]. Concerning the seasonal pattern in Cont_SD1, the SVI*date interaction (Figure 5) confirms the relative weakness of water band indices during the early phase [49] for ‘planar’, un-saturated canopies, being in line with [47]. However, already at tillering, the differentiation with a good performance of the water band indices and of most RE indices, but the failure of NIR/VIS indices, possibly indicates the advantage of a stronger sensitivity of the former groups for overcoming saturation in dense canopies, as also observed for wheat breeding lines [26], N fertilization in wheat cultivars [51], drought-stressed wheat [39] and barley [52]. The usefulness of the RE indices was in line with previous studies on cultivar discrimination during grain filling [53,54] and with the analysis of the N traits in the same experiment, for which, however, water band indices ranked relatively lower [47]. The overall suitability of the early dough and milk ripeness stages indicates that delayed senescence increased GY under favorable maturation conditions, as frequently observed [26,28,31,38,47]. The close relationships between yield and water band SVIs have been obtained on similar sites with multi-year wheat and barley experiments [39,55] and were further evidenced for wheat as well under non-drought conditions [26,51]. Unlike for GY, notably, NIR/RE indices clearly outperformed the water band indices for total DM during the vegetative phase. In turn, the better suitability of the water band indices for GY during grain filling indicates an advantage for senescence-influenced canopies. Water band indices ranked clearly behind ‘structural’ NIR/VIS and RE indices for leaf DM (Figure 6), indicating that the detection of leaf area index (LAI) is not sufficient for GY estimation, and the advantage for GY may be related to the detection of canopy water mass or rather senescence status. During grain filling, leaf senescence was captured by RGB-imaging and correlated with all possible spectral band combinations in normalized vegetation indices. On all dates, indices that included water band information significantly correlated with the leaf senescence status and did so mostly better than NIR/VIS and RE-combinations (not shown). Thus, lower GY in RF than in Cont and in N1 than in N2 was associated with accelerated leaf senescence.
The index rankings for both multiplicative GY components, total DM and harvest index (HI), were not indicative for the index ranking for GY. In spite of a significant reduction in HI in RF compared to Cont by 9% [25], the HI was moderately detected only by the R787_R765 during later grain filling, when the HI is actually determined as a result of the ongoing assimilation and translocation of assimilates. These findings are similar to those found for grain and total N uptake and N harvest index, respectively [47]. From a temporal perspective, the reaction in pre- and post-anthesis components of GY—i.e., DM translocation (DMT) and post-anthesis assimilation (PAA), including reduced PAA without fungicide, increased PAA but reduced DMT and translocation efficiencies in response to N fertilization [25]—could not be retraced by any index, confirming the results for genotypic differences [26]. On the one hand, these traits are ‘accumulated’ over time, which apparently cannot be captured by ‘snap-shot’ measurements on single days. On the other hand, their destructive determination was complex, including the sampling of various traits both at anthesis and maturity and possible errors in determining the exact anthesis time, so that these traits may be less stably referenced [25]. While, similarly as for PAA, post-anthesis N uptake was not sufficiently detected, moderate estimations (R2 = 0.26–0.33) had been achieved for N translocation [47].
4.2. In-Season Estimation of Yield Components
Kernel number per m2 was the most relevant yield component for explaining genotypic variation in GY in the six MP*N subsets (R2 = 0.65–0.85) [25]. Its moderate estimation in all datasets already during stem elongation from red edge indices was related to a similar R2-pattern as observed for total DM, possibly indicating an association between both traits [56]. Thus, Babar et al., (2006) reported similar correlations for total DM and kernels per m2 for wheat genotypes, but did not find useful relationships for spike density, GNS, and TKW. Instead, a more direct estimation is conceivable for spike density through the best-ranking pigment-specific simple ratio PSSR [57], which may detect the bright-colored spikes. In contrast, another study obtained good estimates only for spike density across environments but not for GNS and TKW [58]. Overall, likely indirect detections of most yield components must be carefully interpreted considering the growing conditions and contributing treatments.
4.3. Suitability of the R787_R765 and TCARI_OSAVI for the Agronomic Approach
Owing to the low reflection difference between both bands, the R787_R765′s index values were only slightly higher than one, but the index showed high rankings in the agronomic approach for several traits. This included HI, TKW, yield per spike, NUE and NutEff—along with the similarly performing TCARI_OSAVI. Despite the similar ranking, both indices use substantially different spectral bands (Figure 1), indicating that the initial index grouping based on the spectral regions is not sufficient for predicting similarities in the suitability to estimate the tested traits. The R787_R765 was previously found useful for detecting N concentration in grassland [59] and the TCARI_OSAVI for LAI-insensitive chlorophyll detection [60]. The correlation matrix between all band combinations and image-based leaf senescence status during grain filling (data not shown) indicates that the R787_R765 detected senescence too. While the index was positively correlated with the NDVI during the vegetative stages, the relationships turned negative during grain filling (data not shown). The negative relationships of R787_R765 (and inversely the positive relationships of the TCARI_OSAVI) with HI and its high rankings demonstrate its sensitivity to senescence, as introduced by the agronomic treatments, notably reduced fungicide [25], as well as to their concomitant effect on the plant traits—findings which largely agree with the analysis of the N traits [47]. In contrast, these traits were not reliably detected for the cultivar differences in the MP*N approach.
4.4. Stability of Index Rankings According to Dataset
This study aimed at comparing the index rankings retrieved from data dominated by variation introduced by ‘agronomic treatments’ to the index rankings based on data dominated by the difference between cultivars within MP*N subsets. Comparing the rankings on the same datasets holds the advantage of including the same environmental effects and possible errors during sampling and analysis, considering that environmental effects, especially on the derived DM traits, can be substantial [7]. The constant index rankings found for the important traits GY and total DM at maturity are especially promising, as is the case for most ‘direct’ traits (Table 3; green colored traits in Figure 9) and the corresponding N traits [47].
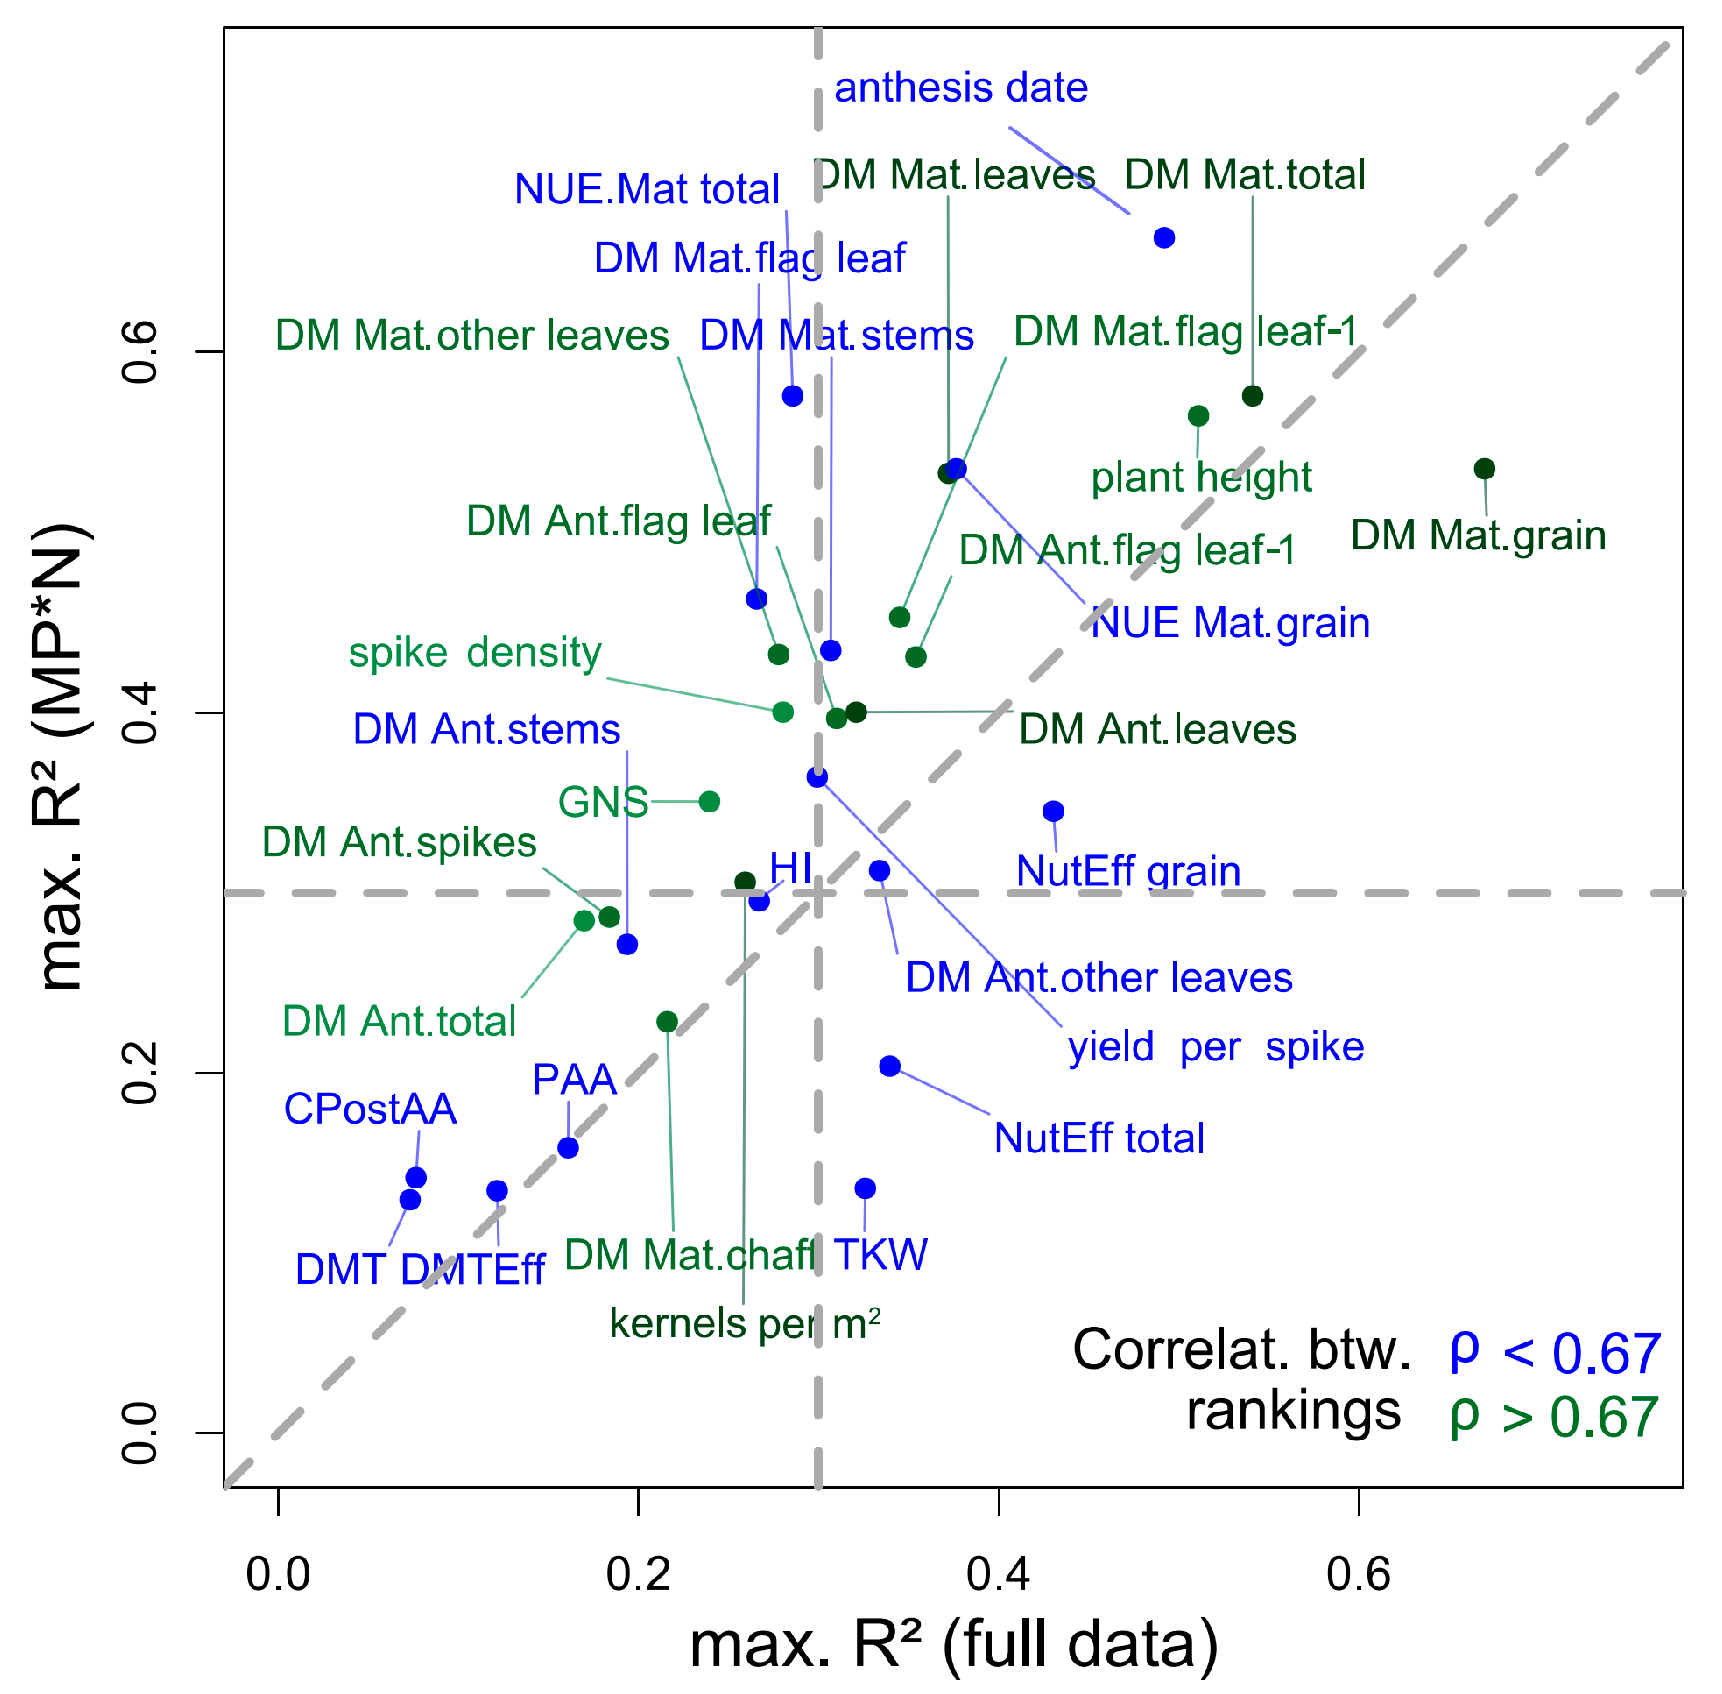
In contrast, rankings for weakly estimated traits in either of the approaches are less reliable, including traits related to the pre/post-anthesis contribution to grain filling (DMT, DMTEff, PAA and CPostAA), and HI (bottom left quadrant in Figure 9). Several traits, which were moderately estimated (max. R2 > 0.3) in both approaches, showed substantially differing index rankings, including NUE_Mat_grain, stem DM at maturity, NutEff_grain, and anthesis date, as visualized in Figure 9 by blue-colored traits (correlations between rankings < 0.67) in the upper right quadrant. Consequently, these ‘more specific’ traits would require an index selection more optimized by contributing treatments and/or trial environments, whereas indices selected for green-colored traits are promising for a more robust application.
5. Conclusions
The previous use of spectral proximal sensing in field trials either for plant breeding or agronomic factor optimization focused on the in-season estimation of the grain yield potential. Although analyzed using only the data from one year, the present study extended spectral methods to further traits, which were rarely tested before, especially for all relevant growth stages.
With respect to the initial research questions, the following conclusions are drawn:(i) The index-based estimation of notably GY and its cumulative component, total DM, is promising for applying sensor-based phenotyping. Additional information is gained on further yield-related traits, yet generally at a lower accuracy.
(ii) The comparison of many indices should not only serve for recommending specific indices, but rather ‘index types’, as grouped by the included spectral regions. The mostly similar performance of most indices within groups indicates close relationships between several indices, making the index selection more robust. This is relevant for transferring the results to sensors differing in band number, placement or narrowness [51]. As in previous analyses, water band indices followed by red edge indices outperformed the NDVI for most traits.
(iii) Overall, the milk ripeness stage was the most promising; however, for estimating the effects of sowing date and N fertilization, as included in the agronomic data, vegetative stages were also indicative. The suitability of the late, senescence-influenced grain filling phase may have been improved by the overall favorable maturing conditions.
(iv) The different agronomic treatments affected the target traits in different ways and in different growth stages, consequently altering the optimum measurement stages and affecting the accuracies in the different datasets.The present results can contribute to the optimization of sensors, the selection of measurement dates and specific SVIs, and should be evaluated on further datasets. Notably, the optimization of drone-based sensors can boost proximal sensing methods for field trials [61], but requires further evaluation.
Supplementary Materials
The following are available online at https://www.mdpi.com/2073-4395/10/4/603/s1: Table S1: List of plant traits considered in this study, grouped by trait groups. Table S2: List of spectral vegetation indices used in this study. ‘R’ denotes the reflection in indicated wavebands. Figure S1: The index suitability by target trait in the ’agronomic’ blocks Cont_RF and Cont_SD1: Maximum coefficients of determination (R2) found for each index x trait combination from 11 measurement dates. Gray lines delimit index and trait groups.
Author Contributions
L.P. and U.S. conceived and designed the experiment, L.P. conducted the experiment, L.P. analyzed the data, L.P. and U.S. wrote the manuscript. All authors have read and agreed to the published version of the manuscript.
Funding
This research was funded by the DFG (German Research Foundation)-funded project SCHM 1456/6-1 and was in part supported by funds of the Federal Ministry of Food and Agriculture (BMEL) based on a decision of the Parliament of the Federal Republic of Germany via the Federal Office for Agriculture and Food (BLE) under the innovation support program for the project 28-1-B3.030-16.
Acknowledgments
The authors gratefully acknowledge support with the analysis of reference traits by Claudia Buchhart and Moritz Germer as well as support with spectral measurements by Jürgen Plass.
Conflicts of Interest
The authors declare no conflict of interest.
References
- Ehdaie, B.; Waines, J. Sowing date and nitrogen rate effects on dry matter and nitrogen partitioning in bread and durum wheat. Field Crop. Res. 2001, 73, 47–61. [Google Scholar] [CrossRef]
- Ferrise, R.; Triossi, A.; Stratonovitch, P.; Bindi, M.; Martre, P. Sowing date and nitrogen fertilisation effects on dry matter and nitrogen dynamics for durum wheat: An experimental and simulation study. Field Crop. Res. 2010, 117, 245–257. [Google Scholar] [CrossRef]
- Gooding, M.J.; Gregory, P.J.; Ford, K.E.; Pepler, S. Fungicide and cultivar affect post-anthesis patterns of nitrogen uptake, remobilization and utilization efficiency in wheat. J. Agric. Sci. 2005, 143, 503–518. [Google Scholar] [CrossRef]
- Ruske, R.E.; Gooding, M.J.; Jones, S.A. The effects of triazole and strobilurin fungicide programmes on nitrogen uptake, partitioning, remobilization and grain N accumulation in winter wheat cultivars. J. Agric. Sci. 2003, 140, 395–407. [Google Scholar] [CrossRef]
- Parry, M.A.J.; Reynolds, M.; Salvucci, M.E.; Raines, C.; Andralojc, P.J.; Zhu, X.G.; Price, G.D.; Condon, A.G.; Furbank, R.T. Raising yield potential of wheat. II. Increasing photosynthetic capacity and efficiency. J. Exp. Bot. 2011, 62, 453–467. [Google Scholar] [CrossRef]
- Cormier, F.; Faure, S.; Dubreuil, P.; Heumez, E.; Beauchêne, K.; Lafarge, S.; Praud, S.; Le Gouis, J. A multi-environmental study of recent breeding progress on nitrogen use efficiency in wheat (Triticum aestivum L.). Theor. Appl. Genet. 2013, 126, 3035–3048. [Google Scholar] [CrossRef]
- Prey, L.; Kipp, S.; Hu, Y.; Schmidhalter, U. Nitrogen Use Efficiency and Carbon Traits of High-Yielding European Hybrid vs. Line Winter Wheat Cultivars: Potentials and Limitations. Front. Plant Sci. 2019, 9, 1988. [Google Scholar] [CrossRef] [Green Version]
- Prey, L.; Hu, Y.; Schmidhalter, U. Temporal dynamics and the contribution of plant organs in a phenotypically diverse population of high-yielding winter wheat: Evaluating concepts for disentangling yield formation and nitrogen use efficiency. Front. Plant Sci. 2019, 10, 1295. [Google Scholar] [CrossRef]
- Ding, D.; Feng, H.; He, J.Q.; Zou, F.; Jin, J.M. Modifying Winter Wheat Sowing Date as an Adaptation to Climate Change on the Loess Plateau. Agron. J. 2016, 53–63. [Google Scholar] [CrossRef] [Green Version]
- Yin, L.; Dai, X.; He, M. Delayed sowing improves nitrogen utilization efficiency in winter wheat without impacting yield. Field Crop. Res. 2018, 221, 90–97. [Google Scholar] [CrossRef]
- Rasmussen, I.S.; Thorup-Kristensen, K. Does earlier sowing of winter wheat improve root growth and N uptake? Field Crop. Res. 2016, 196, 10–21. [Google Scholar] [CrossRef]
- Milford, G.F.J.; Penny, A.; Prew, R.D.; Darby, R.J.; Todd, A.D. Effects of previous crop, sowing date, and winter and spring applications of nitrogen on the growth, nitrogen uptake and yield of winter wheat. J. Agric. Sci. 1993, 121, 1–12. [Google Scholar] [CrossRef]
- Van Eeuwijk, F.A.; Bustos-korts, D.; Millet, E.J.; Boer, M.P.; Kruijer, W. Modelling strategies for assessing and increasing the effectiveness of new phenotyping techniques in plant breeding. Plant Sci. 2018, 282, 23–39. [Google Scholar] [CrossRef] [PubMed]
- Rebetzke, G.J.; Jimenez-Berni, J.; Fischer, R.A.; Deery, D.M.; Smith, D.J. Review: High-throughput phenotyping to enhance the use of crop genetic resources. Plant Sci. 2019, 282, 40–48. [Google Scholar] [CrossRef]
- Sankaran, S.; Mishra, A.; Ehsani, R.; Davis, C. A review of advanced techniques for detecting plant diseases. Comput. Electron. Agric. 2010, 72, 1–13. [Google Scholar] [CrossRef]
- Schmid, A. Erfassung des Aktuellen Stickstoffstatus von Kulturpflanzen mit Berührungsloser Sensorik zur Optimierung der Teilflächenspezifischen Bestandesführung; Herbert Utz Verlag: Munich, Germany, 2008; ISBN 3831607745. [Google Scholar]
- Fiorani, F.; Schurr, U. Future scenarios for plant phenotyping. Annu. Rev. Plant Biol. 2013, 64, 267–291. [Google Scholar] [CrossRef] [Green Version]
- Araus, J.L.; Cairns, J.E. Field high-throughput phenotyping: The new crop breeding frontier. Trends Plant Sci. 2014, 19, 52–61. [Google Scholar] [CrossRef]
- Pommel, B.; Gallais, A.; Coque, M.; Quilleré, I.; Hirel, B.; Prioul, J.L.; Andrieu, B.; Floriot, M. Carbon and nitrogen allocation and grain filling in three maize hybrids differing in leaf senescence. Eur. J. Agron. 2006, 24, 203–211. [Google Scholar] [CrossRef]
- Gooding, M.J.; Dimmock, J.P.R.E.; France, J.; Jones, S.A. Green leaf area decline of wheat flag leaves: The influence of fungicides and relationships with mean grain weight and grain yield. Ann. Appl. Biol. 2000, 136, 77–84. [Google Scholar] [CrossRef]
- Vilmus, I.; Ecarnot, M.; Verzelen, N.; Roumet, P. Monitoring nitrogen leaf resorption kinetics by near-infrared spectroscopy during grain filling in durum wheat in different nitrogen availability conditions. Crop Sci. 2014, 54, 284–296. [Google Scholar] [CrossRef]
- Acquaah, G. Principles of Plant Genetics and Breeding; Blackwell Publishing Ltd: Malden, MA, USA, 2007; ISBN 1444309013. [Google Scholar]
- Foulkes, M.J.; Slafer, G.A.; Davies, W.J.; Berry, P.M.; Sylvester-Bradley, R.; Martre, P.; Calderini, D.F.; Griffiths, S.; Reynolds, M.P. Raising yield potential of wheat. III. Optimizing partitioning to grain while maintaining lodging resistance. J. Exp. Bot. 2011, 62, 469–486. [Google Scholar] [CrossRef] [PubMed] [Green Version]
- Unkovich, M.; Baldock, J.; Forbes, M. Variability in Harvest Index of Grain Crops and Potential Significance for Carbon Accounting. In Advances in Agronomy; Sparks, D.L., Ed.; Academic Press: Burlington, NC, USA, 2010; Volume 105, pp. 173–219. ISBN 9780123810236. [Google Scholar]
- Prey, L.; Germer, M.; Schmidhalter, U. Temporal and Organ-specific Responses in NUE Traits to N Fertilization, Fungicide Intensity and Early Sowing in Winter Wheat Cultivars. Agronomy 2019, 9, 313. [Google Scholar] [CrossRef] [Green Version]
- Prey, L.; Hu, Y.; Schmidhalter, U. High-Throughput Field Phenotyping Traits of Grain Yield Formation and Nitrogen Use Efficiency: Optimizing the Selection of Vegetation Indices and Growth Stages. Front. Plant Sci. 2020, 10, 1672. [Google Scholar] [CrossRef] [PubMed] [Green Version]
- Raun, W.R.; Solie, J.B.; Johnson, G.V.; Stone, M.L.; Lukina, E.V.; Thomason, W.E.; Schepers, J.S. In-Season Prediction of Potential Grain Yield in Winter Wheat Using Canopy Reflectance. Agron. J. 2001, 93, 131–138. [Google Scholar] [CrossRef] [Green Version]
- Freeman, K.W.; Raun, W.R.; Johnson, G.V.; Mullen, R.W.; Stone, M.L.; Solie, J.B. Late-season prediction of wheat grain yield and grain protein. Commun. Soil Sci. Plant Anal. 2003, 34, 1837–1852. [Google Scholar] [CrossRef]
- Babar, M.A.; van Ginkel, M.; Reynolds, M.P.; Prasad, B.; Klatt, A.R. Heritability, correlated response, and indirect selection involving spectral reflectance indices and grain yield in wheat. Aust. J. Agric. Res. 2007, 58, 432–442. [Google Scholar] [CrossRef]
- Babar, M.A.; van Ginkel, M.; Klatt, A.R.; Prasad, B.; Reynolds, M.P. The Potential of Using Spectral Reflectance Indices to Estimate Yield in Wheat Grown Under Reduced Irrigation. Euphytica 2006, 150, 155–172. [Google Scholar] [CrossRef]
- Babar, M.A.; Reynolds, M.P.; van Ginkel, M.; Klatt, A.R.; Raun, W.R.; Stone, M.L. Spectral Reflectance Indices as a Potential Indirect Selection Criteria for Wheat Yield under Irrigation. Crop Sci. 2006, 46, 578–588. [Google Scholar] [CrossRef]
- Prasad, B.; Carver, B.F.; Stone, M.L.; Babar, M.A.; Raun, W.R.; Klatt, A.R. Genetic Analysis of Indirect Selection for Winter Wheat Grain Yield Using Spectral Reflectance Indices. Crop Sci. 2007, 47, 1416–1425. [Google Scholar] [CrossRef] [Green Version]
- Prasad, B.; Carver, B.F.; Stone, M.L.; Babar, M.A.; Raun, W.R.; Klatt, A.R. Potential use of spectral reflectance indices as a selection tool for grain yield in winter wheat under great plains conditions. Crop Sci. 2007, 47, 1426–1440. [Google Scholar] [CrossRef] [Green Version]
- Gizaw, S.A.; Garland-Campbell, K.; Carter, A.H. Evaluation of agronomic traits and spectral reflectance in Pacific Northwest winter wheat under rain-fed and irrigated conditions. Field Crop. Res. 2016, 196, 168–179. [Google Scholar] [CrossRef] [Green Version]
- Gizaw, S.A.; Garland-Campbell, K.; Carter, A.H. Use of spectral reflectance for indirect selection of yield potential and stability in Pacific Northwest winter wheat. Field Crop. Res. 2016, 196, 199–206. [Google Scholar] [CrossRef] [Green Version]
- Montesinos-López, O.A.; Montesinos-López, A.; Crossa, J.; los Campos, G.; Alvarado, G.; Suchismita, M.; Rutkoski, J.; González-Pérez, L.; Burgueño, J. Predicting grain yield using canopy hyperspectral reflectance in wheat breeding data. Plant Methods 2017, 13, 4. [Google Scholar] [CrossRef] [Green Version]
- Gutierrez, M.; Reynolds, M.P.; Raun, W.R.; Stone, M.L.; Klatt, A.R. Spectral water indices for assessing yield in elite bread wheat genotypes under well-irrigated, water-stressed, and high-temperature conditions. Crop Sci. 2010, 50, 197–214. [Google Scholar] [CrossRef]
- Christopher, J.T.; Veyradier, M.; Borrell, A.K.; Harvey, G.; Fletcher, S.; Chenu, K. Phenotyping novel stay-green traits to capture genetic variation in senescence dynamics. Funct. Plant Biol. 2014, 41, 1035–1048. [Google Scholar] [CrossRef]
- Becker, E.; Schmidhalter, U. Evaluation of Yield and Drought Using Active and Passive Spectral Sensing Systems at the Reproductive Stage in Wheat. Front. Plant Sci. 2017, 8, 379. [Google Scholar] [CrossRef] [Green Version]
- Aparicio, N.; Villegas, D.; Casadesus, J.; Araus, J.L.; Royo, C. Spectral Vegetation Indices as Nondestructive Tools for Determining Durum Wheat Yield. Agron. J. 2000, 92, 83–91. [Google Scholar] [CrossRef]
- Pavuluri, K.; Chim, B.K.; Griffey, C.A.; Reiter, M.S.; Balota, M.; Thomason, W.E. Canopy spectral reflectance can predict grain nitrogen use efficiency in soft red winter wheat. Precis. Agric. 2015, 16, 405–424. [Google Scholar] [CrossRef]
- Barmeier, G.; Schmidhalter, U. High-Throughput Field Phenotyping of Leaves, Leaf Sheaths, Culms and Ears of Spring Barley Cultivars at Anthesis and Dough Ripeness. Front. Plant Sci. 2017, 8, 1920. [Google Scholar] [CrossRef] [Green Version]
- Frels, K.; Guttieri, M.; Joyce, B.; Leavitt, B.; Baenziger, P.S. Evaluating canopy spectral reflectance vegetation indices to estimate nitrogen use traits in hard winter wheat. Field Crop. Res. 2018, 217, 82–92. [Google Scholar] [CrossRef]
- Mistele, B.; Schmidhalter, U. Tractor-based quadrilateral spectral reflectance measurements to detect biomass and total aerial nitrogen in winter wheat. Agron. J. 2010, 102, 499–506. [Google Scholar] [CrossRef]
- Erdle, K.; Mistele, B.; Schmidhalter, U. Comparison of active and passive spectral sensors in discriminating biomass parameters and nitrogen status in wheat cultivars. Field Crop. Res. 2011, 124, 74–84. [Google Scholar] [CrossRef]
- Simko, I.; Jimenez-Berni, J.A.; Sirault, X.R.R. Phenomic approaches and tools for phytopathologists. Phytopathology 2016, 107, 6–17. [Google Scholar] [CrossRef] [Green Version]
- Prey, L.; Schmidhalter, U. Temporal and Spectral Optimization of Vegetation Indices for Estimating Grain Nitrogen Uptake and Late-Seasonal Nitrogen Traits in Wheat. Sensors 2019, 19, 4640. [Google Scholar] [CrossRef] [Green Version]
- Hatfield, J.L.; Gitelson, A.A.; Schepers, J.S.; Walthall, C.L. Application of Spectral Remote Sensing for Agronomic Decisions. Agron. J. 2008, 100, 117–131. [Google Scholar] [CrossRef] [Green Version]
- Prey, L.; von Bloh, M.; Schmidhalter, U. Evaluating RGB Imaging and Multispectral Active and Hyperspectral Passive Sensing for Assessing Early Plant Vigor in Winter Wheat. Sensors 2018, 18, 2931. [Google Scholar] [CrossRef] [Green Version]
- Kipp, S.; Mistele, B.; Baresel, P.; Schmidhalter, U. High-throughput phenotyping early plant vigour of winter wheat. Eur. J. Agron. 2014, 52, 271–278. [Google Scholar] [CrossRef]
- Prey, L.; Schmidhalter, U. Simulation of satellite reflectance data using high-frequency ground based hyperspectral canopy measurements for in-season estimation of grain yield and grain nitrogen status in winter wheat. ISPRS J. Photogramm. Remote Sens. 2019, 149, 176–187. [Google Scholar] [CrossRef]
- Rischbeck, P.; Elsayed, S.; Mistele, B.; Barmeier, G.; Heil, K.; Schmidhalter, U. Data fusion of spectral, thermal and canopy height parameters for improved yield prediction of drought stressed spring barley. Eur. J. Agron. 2016, 78, 44–59. [Google Scholar] [CrossRef]
- Erdle, K.; Mistele, B.; Schmidhalter, U. Spectral assessments of phenotypic differences in spike development during grain filling affected by varying N supply in wheat. J. Plant Nutr. Soil Sci. 2013, 176, 952–963. [Google Scholar] [CrossRef]
- Erdle, K.; Mistele, B.; Schmidhalter, U. Spectral high-throughput assessments of phenotypic differences in biomass and nitrogen partitioning during grain filling of wheat under high yielding Western European conditions. Field Crop. Res. 2013, 141, 16–26. [Google Scholar] [CrossRef]
- Elsayed, S.; Rischbeck, P.; Schmidhalter, U. Comparing the performance of active and passive reflectance sensors to assess the normalized relative canopy temperature and grain yield of drought-stressed barley cultivars. Field Crop. Res. 2015, 177, 148–160. [Google Scholar] [CrossRef]
- Shearman, V.J.; Sylvester-Bradley, R.; Scott, R.K.; Foulkes, M.J. Physiological processes associated with wheat yield progress in the UK. Crop Sci. 2005, 45, 175–185. [Google Scholar] [CrossRef]
- Ustin, S.L.; Gitelson, A.A.; Jacquemoud, S.; Schaepman, M.; Asner, G.P.; Gamon, J.A.; Zarco-tejada, P. Remote Sensing of Environment Retrieval of foliar information about plant pigment systems from high resolution spectroscopy. Remote Sens. Environ. 2009, 113, S67–S77. [Google Scholar] [CrossRef] [Green Version]
- Garriga, M.; Romero-Bravo, S.; Estrada, F.; Escobar, A.; Matus, I.A.; del Pozo, A.; Astudillo, C.A.; Lobos, G.A. Assessing Wheat Traits by Spectral Reflectance: Do We Really Need to Focus on Predicted Trait-Values or Directly Identify the Elite Genotypes Group? Front. Plant Sci. 2017, 8, 280. [Google Scholar] [CrossRef] [Green Version]
- Fava, F.; Colombo, R.; Bocchi, S.; Meroni, M.; Sitzia, M.; Fois, N.; Zucca, C. Identification of hyperspectral vegetation indices for Mediterranean pasture characterization. Int. J. Appl. Earth Obs. Geoinf. 2009, 11, 233–243. [Google Scholar] [CrossRef]
- Haboudane, D.; Miller, J.R.; Tremblay, N.; Zarco-Tejada, P.J.; Dextraze, L. Integrated narrow-band vegetation indices for prediction of crop chlorophyll content for application to precision agriculture. Remote Sens. Environ. 2002, 81, 416–426. [Google Scholar] [CrossRef]
- Yang, G.; Liu, J.; Zhao, C.; Li, Z.; Huang, Y.; Yu, H.; Xu, B.; Yang, X.; Zhu, D.; Zhang, X.; et al. Unmanned Aerial Vehicle Remote Sensing for Field-Based Crop Phenotyping: Current Status and Perspectives. Front. Plant Sci. 2017, 8, 1111. [Google Scholar] [CrossRef]
Figure 1.
Plot-level spectra obtained on June 21 with the band position of the tested spectral vegetation indices colored by index groups: Near infrared (NIR: > 765 nm), visible (VIS: < 700 nm), and extended red edge (RE: 700–765 nm). The spectra are colored, indicating differences in grain yield from the lowest yield (yellow) to the medium yield (green) and the highest yield (blue).

Figure 2.
Datasets used for testing trait~index relationships. The three ‘agronomic’ datasets correspond to the data of the whole trial (full data), the combined main plots control (Cont) and ‘reduced fungicide’ (RF -> Cont_RF) as well as the combined main plots Cont and sowing date 1 (SD1 -> Cont_SD1). Main plot*N (MP*N) represents the testing within the subplots as the interactions of main plots (MP) and N fertilization level (N1: 60 kg N ha−1; N2: 60 kg N ha−1). N denotes the number of included data points, which slightly differed after the removal of some outlier plots for all dates.

Figure 3.
Index suitability by target trait (full data (a) and averaged from the six MP*N datasets (b)): Maximum coefficients of determination (R2) found for all index*trait combinations from 10 measurement dates. Gray lines delimit the index and trait groups. See Figure S1 for results in Cont_SD1 and Cont_RF.

Figure 4.
Relationships of grain yield (a), total DM (b), and harvest index (c) on the most suited dates (selected based on Table 2.) with rank-based best indices. Colored thin lines correspond to linear regressions in the MP*N subsets, dashed blue and red lines to Cont_SD1 and Cont_RF, respectively, and dashed gray lines to the full datasets. R2-values are colored accordingly. Refer to Table 2 for the significance level.

Figure 5.
Seasonal coefficients of determination (R2) for all evaluated indices for grain yield (GY; DM Mat. Grain, a), total DM at maturity (b), and harvest index (HI, c). The lines are colored according to the index groupings based on the covered spectral regions (Figure 1). The results for the main plot*N (MP*N) combinations are averaged from the results within the six main plot*N combinations. Horizontal gray lines indicate the significance threshold (p < 0.05). Broad colored lines highlight results of the WMMRS-based best indices.

Figure 6.
Seasonal coefficients of determination (R2) for all evaluated indices for selected DM traits in the full data and in the MP*N approach. Scatterplots depict trait~index relationships from one of the best index/date combination. Refer to Figure 5 for the description of the seasonal line plots. Horizontal gray lines indicate the significance threshold (p < 0.05). In the scatterplots, colored thin lines correspond to linear regressions for the MP*N subsets, dashed blue and red lines to Cont_SD1 and Cont_RF, respectively, and the dashed gray lines to the full datasets. R2-values are colored accordingly. Thick colored lines highlight results of the WMMRS-based best indices.

Figure 7.
Mean-and maximum-based index rankings for grain yield (GY; DM Mat. Grain) combining (a) the rank-sums from the three ‘agronomic’ datasets ‘full data’, Cont_SD1 and Cont_RF, and (b) for the MP*N data. The value of three corresponds to the average ranking across all indices. The MP*N ranking was scaled to the same average numeric level for direct comparison. The colors indicate index groups based on the included spectral regions (Figure 1).

Figure 8.
Weighted mean/maximum-based rank sums (WMMRS) for all evaluated trait/index combinations, combining the rankings from (a) the three agronomic datasets (full data, Cont_SD1 and Cont_RF) and (b) from the six MP*N subsets. Rankings based on mean R2-values across dates were double-weighted. For each trait, the value 9 corresponds to the average ranking across all indices. Light blue cells indicate ranking values beyond 15. Blue lines delimit the index and trait groups. Rankings for trait*index combinations that did not exceed the threshold of maximum R2-values of 0.20 are not shown (white cells), being considered irrelevant. Label numbers were rounded for a more concise comparison.

Figure 9.
Relationship of maximum R2-values found by trait in the full data and the MP*N approach. The data is colored by Spearman’s ρ on the correlations between the WMMRS-rankings of the ‘agronomic’ and the MP*N approach. Dashed lines mark the 1:1 line and R2-thresholds (R2 = 0.30) for categorizing the traits by R2-values in both approaches.


Table 1.
Dates of spectral measurements with days after sowing (d.a.s) and predominant growth stage.
Table 1.
Dates of spectral measurements with days after sowing (d.a.s) and predominant growth stage.
| Date (Month/Day) | d.a.s. (Cont, RF) | Growth Stage |
|---|---|---|
| 03/31 | 159 | leaf development |
| 04/13 | 172 | tillering |
| 05/17 | 206 | stem elongation |
| 05/25 | 214 | booting |
| 06/01 | 221 | ear emergence |
| 06/08 | 228 | anthesis |
| 06/21 | 241 | early milk |
| 06/26 | 246 | late milk |
| 07/01 | 251 | early dough |
| 07/04 | 255 | soft dough |
Table 2.
Best spectral vegetation index (SVI) for each trait based on the weighted mean/max rank sums (WMMRS) from the ‘agronomic’ approach’ and its highest seasonal R2-value reached on the optimum date (month/day) in the different datasets: ‘Full data’, ‘Cont_SD1′, ‘Cont_RF’ as well as the six main plot*N level combinations (MP*N). Considering the six MP*N blocks as different environments, the results for MP*N are based on the average R2 matrices from the six MP*N subsets. Due to the slightly different number of data points, the significance for MP*N was re-calculated based on the significance thresholds in the six subsets. Trait abbreviations: dry matter (DM), anthesis (Ant), maturity (Mat), harvest index (HI), post anthesis assimilation (PAA), contribution of post anthesis assimilation to grain filling (CPostAA), DM translocation (DMT), DM translocation efficiency (DMTEff), grain number per spike (GNS), thousand kernel weight (TKW), nitrogen utilization efficiency (NutEff), and nitrogen use efficiency (NUE). The significance levels correspond to p < 0.001 (***), p < 0.01 (**) and p < 0.05 (*).
| Seasonal Best R2-Value | Optimum Date | ||||||||||||||
|---|---|---|---|---|---|---|---|---|---|---|---|---|---|---|---|
| Trait Group | Trait | Best SVI | WMMRS | Full Data | Cont_SD1 | Cont_RF | MP*N | Full Data | Cont_SD1 | Cont_RF | MP*N | ||||
| DM [kg ha−1] | Ant. spikes | BRI | 17 | 0.18 | *** | 0.26 | *** | 0.19 | *** | 0.28 | ** | 06/26 | 07/01 | 06/26 | 07/04 |
| Ant. stems | GNDVI | 13 | 0.16 | *** | 0.23 | *** | 0.17 | *** | 0.27 | ** | 05/25 | 05/25 | 06/08 | 06/08 | |
| Ant. flag leaf | R780_R550 | 13 | 0.31 | *** | 0.45 | *** | 0.26 | *** | 0.39 | *** | 06/26 | 06/21 | 06/26 | 07/04 | |
| Ant. flag leaf -1 | LCI | 12 | 0.34 | *** | 0.41 | *** | 0.33 | *** | 0.40 | *** | 06/08 | 06/08 | 06/08 | 06/21 | |
| Ant. other leaves | R787_R765 | 12 | 0.33 | *** | 0.34 | *** | 0.16 | *** | 0.29 | ** | 06/08 | 06/08 | 06/08 | 06/08 | |
| Ant. leaves | R780_R550 | 13 | 0.32 | *** | 0.40 | *** | 0.25 | *** | 0.39 | *** | 06/08 | 06/08 | 06/08 | 06/08 | |
| Mat. grain | NWI_5 | 15 | 0.67 | *** | 0.47 | *** | 0.65 | *** | 0.50 | *** | 07/01 | 07/01 | 06/26 | 07/01 | |
| Mat. chaff | BRI | 14 | 0.21 | *** | 0.22 | *** | 0.25 | *** | 0.22 | ** | 06/21 | 06/26 | 06/21 | 06/21 | |
| Mat. stems | NDRE_770_750 | 14 | 0.31 | *** | 0.37 | *** | 0.26 | *** | 0.36 | *** | 05/25 | 05/17 | 05/25 | 06/21 | |
| Mat. flag leaf | NDRE_770_750 | 12 | 0.27 | *** | 0.41 | *** | 0.20 | *** | 0.40 | *** | 07/04 | 07/01 | 07/04 | 07/04 | |
| Mat. flag leaf -1 | R780_R550 | 11 | 0.32 | *** | 0.37 | *** | 0.34 | *** | 0.39 | *** | 06/26 | 07/01 | 07/04 | 07/01 | |
| Mat. other leaves | GNDVI | 13 | 0.28 | *** | 0.30 | *** | 0.31 | *** | 0.43 | *** | 06/08 | 06/08 | 06/08 | 06/08 | |
| Mat. leaves | R780_R550 | 12 | 0.37 | *** | 0.46 | *** | 0.32 | *** | 0.50 | *** | 06/26 | 06/26 | 06/26 | 06/26 | |
| Ant. total | LCI | 13 | 0.16 | *** | 0.21 | *** | 0.18 | *** | 0.28 | ** | 06/08 | 06/01 | 06/08 | 06/08 | |
| Mat. total | NDRE_770_750 | 12 | 0.42 | *** | 0.56 | *** | 0.53 | *** | 0.50 | *** | 06/08 | 05/17 | 06/26 | 06/26 | |
| derived DM | HI | R787_R765 | 18 | 0.27 | *** | 0.10 | ** | 0.37 | *** | 0.26 | ** | 07/01 | 06/08 | 07/01 | 06/08 |
| PAA | NWI_3 | 16 | 0.16 | *** | 0.15 | *** | 0.12 | ** | 0.13 | n.s. | 07/01 | 05/17 | 05/17 | 06/26 | |
| CPostAA | NWI_2 | 18 | 0.08 | ** | 0.10 | ** | 0.09 | ** | 0.09 | n.s. | 05/17 | 05/17 | 05/17 | 06/26 | |
| DMTEff | TCARI_OSAVI | 25 | 0.12 | *** | 0.13 | *** | 0.11 | ** | 0.09 | n.s. | 06/26 | 06/26 | 07/01 | 06/26 | |
| DMT | TCARI_OSAVI | 21 | 0.07 | ** | 0.07 | * | 0.05 | * | 0.08 | n.s. | 07/04 | 07/04 | 06/08 | 06/08 | |
| GNS | BGI | 30 | 0.24 | *** | 0.27 | *** | 0.31 | *** | 0.34 | *** | 06/08 | 06/08 | 06/21 | 06/01 | |
| TKW | NWI_2 | 13 | 0.25 | *** | 0.11 | ** | 0.43 | *** | 0.10 | n.s. | 07/04 | 06/08 | 07/04 | 06/08 | |
| NutEff total | REIP | 17 | 0.32 | *** | 0.40 | *** | 0.31 | *** | 0.16 | * | 06/26 | 06/26 | 05/17 | 05/25 | |
| NutEff grain | REIP | 15 | 0.34 | *** | 0.46 | *** | 0.36 | *** | 0.26 | ** | 05/25 | 06/26 | 05/25 | 07/04 | |
| NUE Mat. total | RVSI | 24 | 0.26 | *** | 0.29 | *** | 0.19 | *** | 0.42 | *** | 07/01 | 07/01 | 07/01 | 06/21 | |
| NUE Mat. grain | R787_R765 | 25 | 0.38 | *** | 0.53 | *** | 0.30 | *** | 0.32 | *** | 06/26 | 06/26 | 06/26 | 04/13 | |
| spike density | PSSR | 20 | 0.28 | *** | 0.46 | *** | 0.23 | *** | 0.40 | *** | 06/21 | 06/21 | 06/21 | 06/21 | |
| yield per spike | BGI | 14 | 0.27 | *** | 0.30 | *** | 0.21 | *** | 0.36 | *** | 03/31 | 06/08 | 06/21 | 05/25 | |
| kernels per m2 | NDRE_770_750 | 15 | 0.26 | *** | 0.24 | *** | 0.23 | *** | 0.23 | ** | 05/17 | 05/17 | 05/17 | 05/17 | |
| others | anthesis date | Maccioni | 12 | 0.40 | *** | 0.54 | *** | 0.49 | *** | 0.59 | *** | 06/21 | 07/04 | 06/21 | 06/21 |
| plant height | REIP | 15 | 0.51 | *** | 0.55 | *** | 0.45 | *** | 0.56 | *** | 05/25 | 05/25 | 05/25 | 06/21 | |
Table 3.
Spearman’s ρ and significance level of the correlations between the agronomic and the MP*N index rankings (Figure 8) by target trait.
Table 3.
Spearman’s ρ and significance level of the correlations between the agronomic and the MP*N index rankings (Figure 8) by target trait.
| DM | Derived DM | ||||
|---|---|---|---|---|---|
| Ant. spikes | 0.90 | *** | HI | 0.23 | |
| Ant. stems | 0.77 | *** | PAA | 0.82 | *** |
| Ant. flag leaf | 0.90 | *** | CPostAA | −0.13 | |
| Ant. flag leaf-1 | 0.90 | *** | DMTEff | 0.16 | |
| Ant. other leaves | 0.82 | *** | DMT | 0.47 | *** |
| Ant. leaves | 0.98 | *** | GNS | 0.86 | *** |
| Mat. grain | 0.98 | *** | TKW | −0.24 | |
| Mat. chaff | 0.93 | *** | NutEff total | 0.70 | *** |
| Mat. stems | 0.76 | *** | NutEff grain | 0.81 | *** |
| Mat. flag leaf | 0.73 | *** | NUE Mat. total | −0.19 | |
| Mat. flag leaf-1 | 0.90 | *** | NUE Mat. grain | −0.03 | |
| Mat. other leaves | 0.92 | *** | spike density | 0.86 | *** |
| Mat. leaves | 0.94 | *** | yield per spike | 0.63 | *** |
| Ant. total | 0.86 | *** | kernels per m2 | 0.95 | *** |
| Mat. total | 0.97 | *** | |||
| other traits | |||||
| anthesis date | 0.81 | *** | |||
| plant height | 0.91 | *** |
© 2020 by the authors. Licensee MDPI, Basel, Switzerland. This article is an open access article distributed under the terms and conditions of the Creative Commons Attribution (CC BY) license (http://creativecommons.org/licenses/by/4.0/).
Share and Cite
MDPI and ACS Style
Prey, L.; Schmidhalter, U. Deep Phenotyping of Yield-Related Traits in Wheat. Agronomy 2020, 10, 603. https://doi.org/10.3390/agronomy10040603
AMA Style
Prey L, Schmidhalter U. Deep Phenotyping of Yield-Related Traits in Wheat. Agronomy. 2020; 10(4):603. https://doi.org/10.3390/agronomy10040603
Chicago/Turabian StylePrey, Lukas, and Urs Schmidhalter. 2020. "Deep Phenotyping of Yield-Related Traits in Wheat" Agronomy 10, no. 4: 603. https://doi.org/10.3390/agronomy10040603
Note that from the first issue of 2016, this journal uses article numbers instead of page numbers. See further details here.