Use of Gibberellic Acid to Increase the Salt Tolerance of Leaf Lettuce and Rocket Grown in a Floating System


Dipartimento Scienze Agrarie, Alimentari e Forestali, Università di Palermo, Viale delle Scienze 4, 90128 Palermo, Italy
*
Authors to whom correspondence should be addressed.
Agronomy 2020, 10(4), 505; https://doi.org/10.3390/agronomy10040505
Submission received: 6 March 2020
/
Revised: 17 March 2020
/
Accepted: 27 March 2020
/
Published: 2 April 2020
(This article belongs to the Special Issue Nitrogen Fertilization in Vegetable Crops)
Abstract
:Hydroponics need water of good quality to prepare a balanced nutrient solution that could allow plants to reach their maximum yield potential. The rising difficulties in finding water with good quality have led to the compelling necessity of identifying sustainable ways to use saline water, limiting its negative effect on crop yield and quality. The exogenous supplementation of plant growth regulators, such as gibberellic acid (GA3), can be effective in increasing plant growth and vigor, thus helping plants to better cope with salt stress. The aim of this study was to evaluate the feasibility to increase the salt tolerance of leaf lettuce and rocket grown in a floating system by adding GA3 (10−6 M) to mineral nutrient solutions (MNS) with increasing salinity (0, 10, and 20 mM NaCl). Leaf lettuce and rocket plants suffered a significant reduction of growth and yield, determined by the reduction of biomass, leaf number, and leaf area, even with moderate salt stress (10 mM NaCl). The supplementation of exogenous GA3 through the MNS allowed plants to substantially counterbalance salt stress by enhancing various morphological and physiological traits, such as biomass accumulation, leaf expansion, stomatal conductance and water and nitrogen use efficiency. The effects of salt stress and GA3 treatment varied according to the species, thus indicating that this interaction may improve salt tolerance by activating different adaptation systems.
1. Introduction
Currently, one of the major challenges of agricultural research is to meet the increasing food demand while protecting natural resources and improving environmental quality. Nevertheless, agricultural sustainability is threatened by the burgeoning human population and decreasing availability of land for cultivation. The most important factor causing the reduction in cultivated lands is the accumulation of soluble salts [1]. Soil and water salinity represents one of the major environmental stresses and determines severe reductions in crop productivity and quality [1,2]. Salinity negatively influences the germination, growth, physiology, and productivity of crop plants. These negative effects may be triggered by ionic and osmotic stresses, ion toxicity, oxidative damage, and membrane instability and permeability [3,4,5,6]; salt stress can also affect plant physiology, determining an increased respiration rate, changes in C and N metabolism, modification of mineral uptake and distribution, altered chlorophyll biosynthesis, and inefficiency of photosynthesis [7,8]. All these effects result in lowered yield and quality and reduced economic productivity of crops. Vegetable crops have a cash value usually higher than field crops, thus the salt tolerance of vegetable species is important for adequate fulfillment of vegetable demands and to limit the economic effects of salt stress on vegetable growers. Moreover, the high demand for water of vegetable crops, condensed in short production periods, increases their salinity problems [9].
Soilless cultivation systems (or hydroponics) have been adopted for many vegetable crops to overcome soil salinity and other abiotic and biotic stresses [10,11,12] and to increase yield and quality [11,13,14,15]. The quality of the water is of paramount importance in the hydroponic cultivation systems in which it is used to prepare nutrient solutions by adding mineral fertilizers that increase its electrical conductivity (EC). Hence, the availability of water with a high salt concentration leads to a nutrient solution with an EC level that trespasses the tolerance level of many vegetable crops [9]. The majority of high salinity irrigation water occurs in areas located along the sea, especially in Mediterranean areas with intensive agriculture, and in the hot seasons because the intensive use of underground water increases seawater infiltration in the groundwater [9].
The rising limitations in water quality and availability are increasing the attention in improving the efficiency of water use and enhancing crop tolerance to these stresses. Recently, the mechanisms of salt tolerance in plants has become the aim of many investigations [16,17], revealing that the response and adaptation of plants to salinity take place through the activation of stress response mechanisms, which control the ionic/hydraulic re-equilibrium and mediate the detoxification of reactive oxygen species, and the modulation of cell growth or cell division [18]. These mechanisms are mostly under hormonal control, and the adverse effect of salinity on seed germination and plant growth has been related to modifications of the endogenous levels of phytohormones. In fact, Wang et al. [19] found that salinity may determine an increase of abscisic acid (ABA) and jasmonic acid (JA) levels and a decrease of indole-3-acetic acid (IAA) and salicylic acid (SA) levels. This evidence suggested that the exogenous application of plant growth regulators (PGRs), such as auxins, gibberellins, or cytokinins, could have beneficial effects in mitigating the repressive effects of salt stress and also enhance germination, growth, development, yield, and quality [20,21,22].
Among these PGRs, gibberellins (GAs) are essential endogenous hormones produced by plants and fungi that control plant development by triggering several physiological mechanisms [23,24]. The response of plant tissue to the GA signal can be the modification in gene expression, plant physiology, and morphology [25]. These effects can also be determined by the application of exogenous gibberellins. Many investigations have focused the attention on the supplementation of gibberellic acid (GA3), with the aim to improve plant growth and yield and to enhance tolerance to abiotic stresses (e.g., drought, heat, salinity). Exogenous supplementation through foliar spray of GA3 solutions at low concentrations has proved to determine positive effects on the growth, quality, and salt tolerance of vegetables cultivated in soil or in hydroponic cultivation systems [26,27,28,29,30,31]. Yet, studies on the effects of gibberellic acid application on leafy vegetables grown in hydroponics are rather scant. Miceli et al. [24,32] found that the supplementation of 10−6 M GA3 through the nutrient solution of hydroponically grown leaf lettuce and rocket can exert a significant effect on the yield, quality, and post-harvest life of these vegetables. Thus, the exogenous application of GA3 trough the nutrient solution could also affect the salt tolerance of leafy vegetables. Therefore, the aim of this study was to evaluate the feasibility of adding gibberellic acid (10−6 M GA3) to the mineral nutrient solution to increase the salt tolerance of leaf lettuce and rocket grown in a floating system.
2. Materials and Methods
2.1. Leafy Vegetable Cultivation
The experiment was conducted during spring in a greenhouse situated at the Department of Agricultural, Food, and Forest Sciences (SAAF - University of Palermo, Italy) (38°6′28″ N 13°21′3″ E; altitude 49 m). The leafy vegetables tested in this study were leaf lettuce (Lactuca sativa L. var. Crispa) and rocket (Eruca sativa L.). Six treatments derived from a factorial combination of three NaCl concentrations (0, 10, and 20 mM NaCl) and two GA3 concentrations (0 and 10−6 M GA3 [24,32]; Gibrelex, Biolchim, Bologna, Italy) were tested for each species.
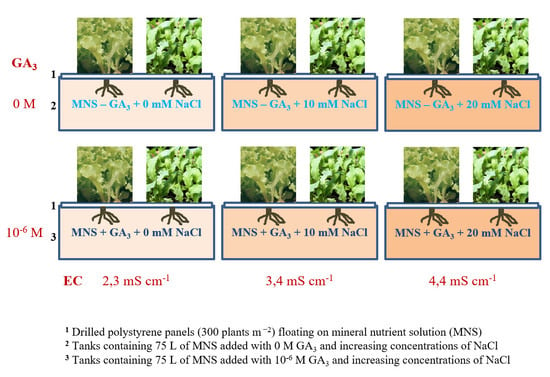
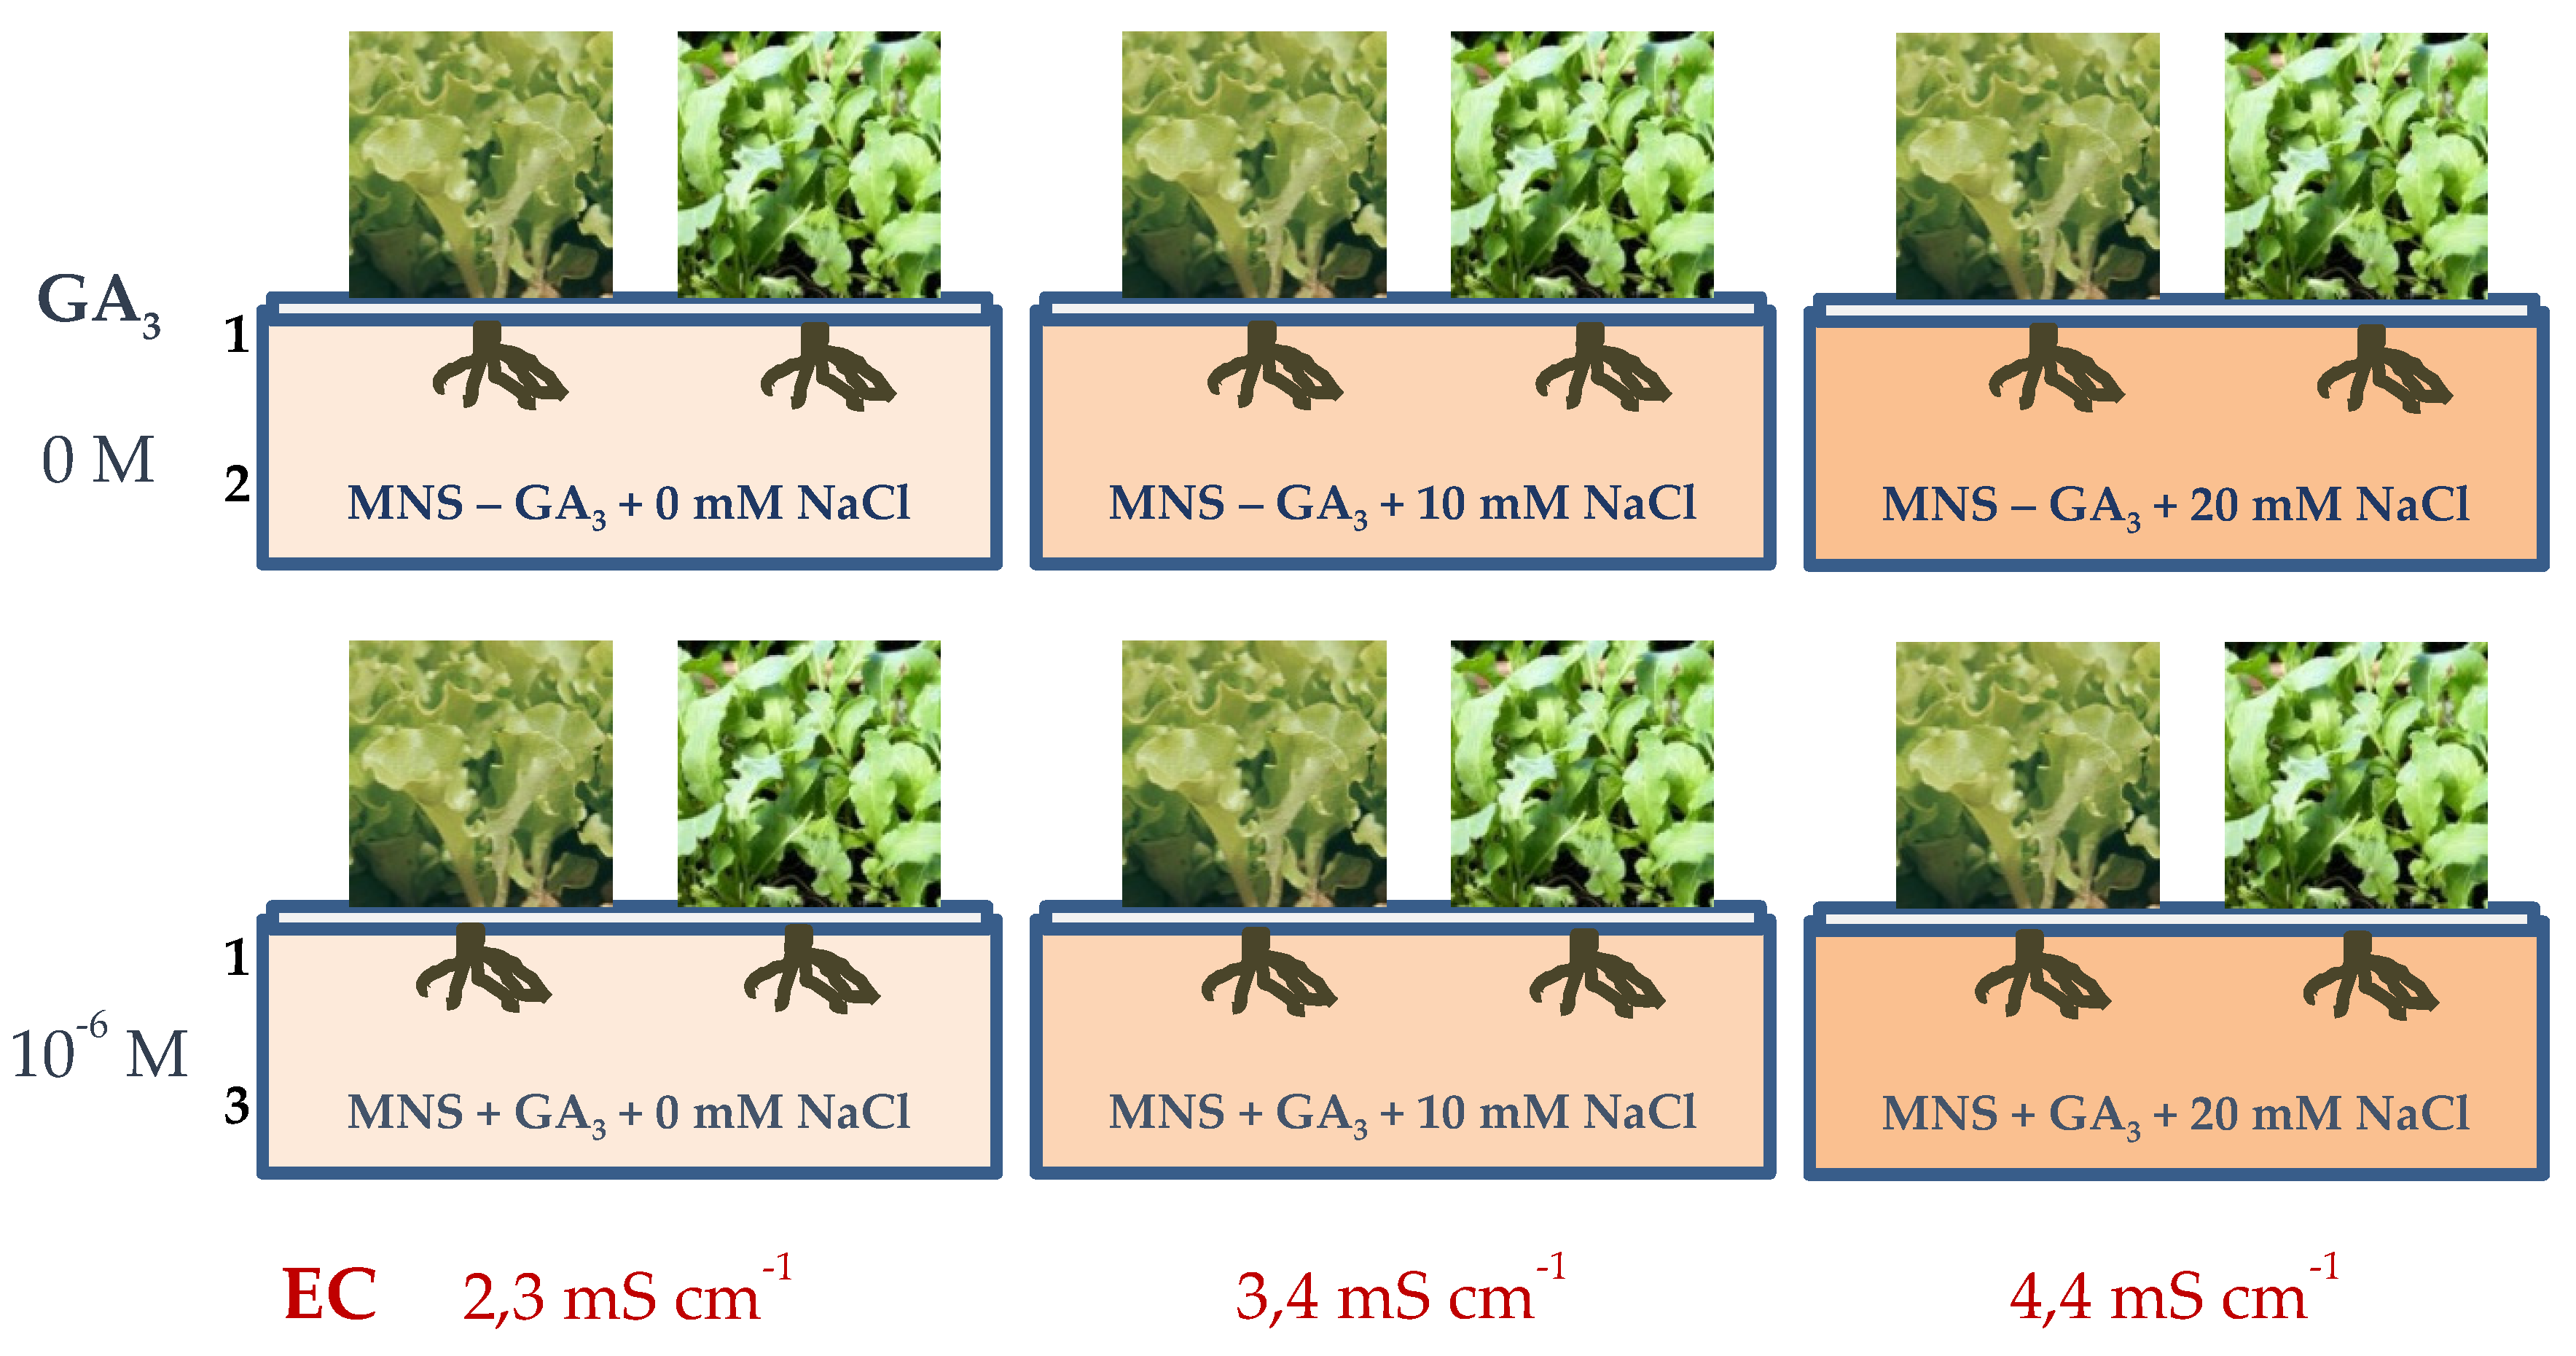
These species were cultivated in a hydroponic floating system using nutrient solutions prepared by adding to tap water (electrical conductivity—EC 0.48 mS cm−1; pH 7.6) 4.5 mmol L−1 of Ca2+, 2 mmol L−1 of H2PO4−, 1.25 mmol L−1 of NH4+, 1 mmol L−1 of Mg2+, 19 mmol L−1 of NO3−, 11 mmol L−1 of K+, 1.1 mmol L−1 of SO42−, 40 μmol L−1 of Fe3+, 5 μmol L−1 of Mn2+, 4 μmol L−1 of Zn2+, 30 μmol L−1 of BO33−, 0.75 μmol L−1 of Cu2+, and 0.50 µmol L−1 of Mo [33]. The nutrient solutions differed only in GA3 and NaCl concentration. The mineral nutrient solutions (MNSs) had pH 5.8 and an EC of 2.3, 3.4, and 4.4 mS cm−1 for 0, 10, and 20 mM NaCl, respectively. Four different tubs (100 cm long × 50 cm wide × 15 cm deep, containing 75 L) were filled with each nutrient solution for each leafy vegetable. Seedlings of leaf lettuce (cv. ‘Lattuga da Taglio a Foglia Liscia’, Sementi Dotto—SDD SPA, Udine—Italy) and rocket (cv. ‘Coltivata da orto’, Sementi Dotto—SDD SPA, Udine—Italy) were obtained in polystyrene trays (160 holes) and transplanted (27 March) in drilled polystyrene panels (300 plants m−2) at the stage of 3–4 true leaves. The panels were then immediately placed to float in the tubes (Figure 1).
Each treatment was composed of four replicated tubes for each combination of GA3 and NaCl (150 plants for each tube; 24 tubes for each species). The MNSs were not aerated during plant cultivation as leafy vegetables with fast growth and a short crop cycle do not need a high oxygen concentration in the nutrient solution [34]. The nutrient solutions were regularly monitored to evaluate water consumption and EC and pH changes. The tubes were replenished with new nutrient solutions, with the same GA3 and NaCl concentration, when the volume consumed overcame 20%. The consumption of nutrient solution was assessed for each experimental treatment. The polystyrene panels completely covered the nutrient solutions in the tubes, thus the loss of water due to evaporation was minimal and was not considered. This allowed calculation of the water use efficiency (WUE) as WUE (g DW L−1 H2O) = plant dry weight (g)/H2O (L). At harvest, the nutrient solution in the tubs was analyzed to calculate the remaining amount of N-NH4+ and N-NO3− (determined reflectometrically by a Merck RQflex10 reflectometer according to the company protocols (Merck, Darmstadt, Germany)), and the total N uptake during the cultivation cycle was determined. Nitrogen use efficiency (NUE) [35] was calculated as NUE (g DW g−1 N) = plant total dry weight (g)/plant N uptake (g).
Stomatal conductance was measured (15 days after transplant) with a diffusion porometer (AP4, Delta-T Devices Ltd., Cambridge, England) on two recently expanded unshaded leaves of 20 plants for each replicate.
Leaf lettuce and rocket plants were harvested 22 days after transplant, and the marketable yield was calculated after eliminating decayed or yellowed older leaves. Then, 20 plants were randomly selected for each replicate and destructively sampled. Plant height, plant weight, leaf number, leaf weight, main leaf width (leaf lettuce), petiole length (rocket), and leaf area were determined. Leaf weight was used to calculate the yield of minimally processed product (%). The leaf area was determined by digital image analysis. Soon after sampling, leaves were weighed and immediately scanned at 350 dpi (Epson Perfection 4180 Photo, Seiko Epson Corp., Suwa, Japan); the image analysis was performed with the ImageJ 1.52a software (National Institutes Health, Bethesda, MD, USA). Scanned leaves were dried at 85 °C to a constant weight and re-weighed in order to calculate the specific leaf area (SLA cm2 g−1) as leaf area/leaf dry weight. Afterward, another 20 plants randomly sampled for each replicate were separated into epigeal (stems and leaves) and hypogeal (roots) parts, weighed, and then dried to constant weight at 85 °C to determine the fresh and dry biomass.
A third sample of 20 plants for each replicate was used for leaf color measure and chemical determinations. Leaf color components L* (lightness), a* (positive values for reddish colors and negative values for greenish colors) and b* (positive values for yellowish colors and negative values for bluish colors), were recorded with a colorimeter (CR-400, Minolta corporation, Ltd., Osaka, Japan) at two areas of photosynthetic tissue on the upper part of 20 leaves, randomly selected for each leafy vegetable and each treatment. Hue angle (h°) and Chroma (C*) were calculated as h° = 180° + arctan(b*/a*) [36] and C* = (a*2 + b*2)1/2. Twenty grams of leaves from each sample were then homogenized with H2O (1:2 w/v) and the homogenates were centrifuged at 3500 rpm for 15 min. The extracts were used to determine soluble solids content (SSC), ascorbic acid and nitrate contents, and titratable acidity (TA). SSC (°Brix) determination was performed on the extracts with a digital refractometer (MTD-045nD, Three-In-One Enterprises Co. Ltd., New Taipei City, Taiwan) [37]. TA (expressed as mg of citric acid per 100 g of fresh weight) was determined by titrating 10 mL of the extract with 0.1 M NaOH up to pH 8.1 [38]. Ascorbic acid and nitrate contents (expressed as mg 100 g−1 and mg kg−1 of fresh weight, respectively) were determined reflectometrically by a Merck RQflex10 reflectometer according to the company protocols (Merck, Darmstadt, Germany) [39,40,41].
2.2. Statistics and Principal Component Analysis
The experimental layout consisted of four replicates for each combination of NaCl and GA3 levels and each leafy vegetable randomly assigned in four blocks. To determine the effect of the NaCl and GA3 on each leafy vegetable, a two-way ANOVA was carried out. Mean values were compared by the least significant differences (LSD) test at p ≤ 5% to identify significant differences among treatments and significant interactions between factors.
Principal components analysis (PCA) was performed on morphophysiological and phytochemical parameters to study the main parameters that were most effective in discriminating between salt stress levels and GA3 treatment. The input matrix for the analysis consisted of plant height, whole plant fresh weight (FW), shoot (S) FW, roots (R) FW, S/R FW, whole plant dry weight (DW), shoot DW, roots DW, S/R DW, plant dry matter, yield, minimal processing yield, WUE, NUE, leaf no., plant area, leaf area, SLA, stomatal conductance, L*, chroma, hue, SSC, TA, ascorbic acid, and N-NO3− content. The optimum number of principal components (PCs) was assessed by keeping the factors with eigenvalues higher than 1.0. Furthermore, the plot of the PCs allowed investigation of the correlations between the variables of the input data set. With this regard, the initial variables were projected into the subspace defined by the first and second PCs, and correlated variables were determined. The principal component analysis was performed with SPSS version 13.0 (SPSS Inc., Chicago, IL, USA).
3. Results
The average temperature outside the greenhouse, during the experiment, ranged between 21.0 ± 0.6 °C (day) and 12.9 ± 0.4 °C (night) and the average net solar radiation at noon was 687 W·m−2. The day length during the cultivation period (from sunrise to sunset) ranged between 12 and 14 h. Inside the greenhouse, the mean air and MNS temperatures were 20.6 ± 0.5 °C and 18.8 ± 0.4 °C, respectively. The air temperature ranged between 36.3 ± 0.8 °C (day) and 10.3 ± 0.4 °C (night); relative humidity was on average 60.6% and ranged between 20.2% and 100%. During the experiment, the highest light intensity inside the greenhouse was 56,020 lux on average, ranging from 72,599 to 10,222 lux as a function of the cloudiness.
The EC and pH values of the nutrient solutions in the tubes varied during plant growth. The pH increased up to 6.89 and 6.67 for lettuce and rocket, respectively, regardless of the GA3 or salt content. The EC of MNS had significant differences due to water absorption, as well as to refills of the tubes with MNS with different NaCl concentrations. The MNS of lettuce plants decreased their EC in control tubes (1.72 mS cm−1 on average for 0 mM NaCl), whereas it increased as increasing salinity of MNS (3.78 and 6.04 m mS cm−1 on average for 10 and 20 mM, respectively). A similar trend was found for the MNS of rocket plants at harvest, which had an EC of 2.13, 3.84, and 5.53 for 0, 10, and 20 mM NaCl, respectively.
3.1. Morphophysiological Parameters and Yield of Leaf Lettuce
The morphological characteristics of lettuce plants were modified by the salinity and GA3 content of the nutrient solution. At harvest, the height of leaf lettuce plants was found to be significantly influenced by the EC of the nutrient solution and by the presence of GA3 in the MNS (Table 1). A reduction of plant height was found, starting with moderate salt stress (−6% for plants grown with 10 mM NaCl in the nutrient solution), whereas plants grown with 10−6 M GA3 in the MNS were 2.3 cm higher than control plants (24.6 cm). The fresh biomass of lettuce plants was negatively affected by salt stress as it dropped from 13.5 g plant−1 in control plants to 11.6 g plant−1 on average for the plants grown in MNS with added NaCl. The fresh weight of the plants grown with 10−6 M GA3 in the MNS was 30.3% higher on average than plants grown without GA3 in the MNS (Table 1). The highest fresh biomass was produced by plants grown with GA3 and 0 mM NaCl in the MNS; control plants and plants treated with GA3 showed a similar decreasing trend in plant fresh weight (−16%), but the plants grown with GA3 at the highest NaCl concentration had a total fresh weight higher than the control plants (Table 1). The same effect of GA3 and NaCl was found considering the fresh weight of the shoot and the roots but to a different extent so that the S/R ratio significantly increased only as a function of GA3 (Table 1).
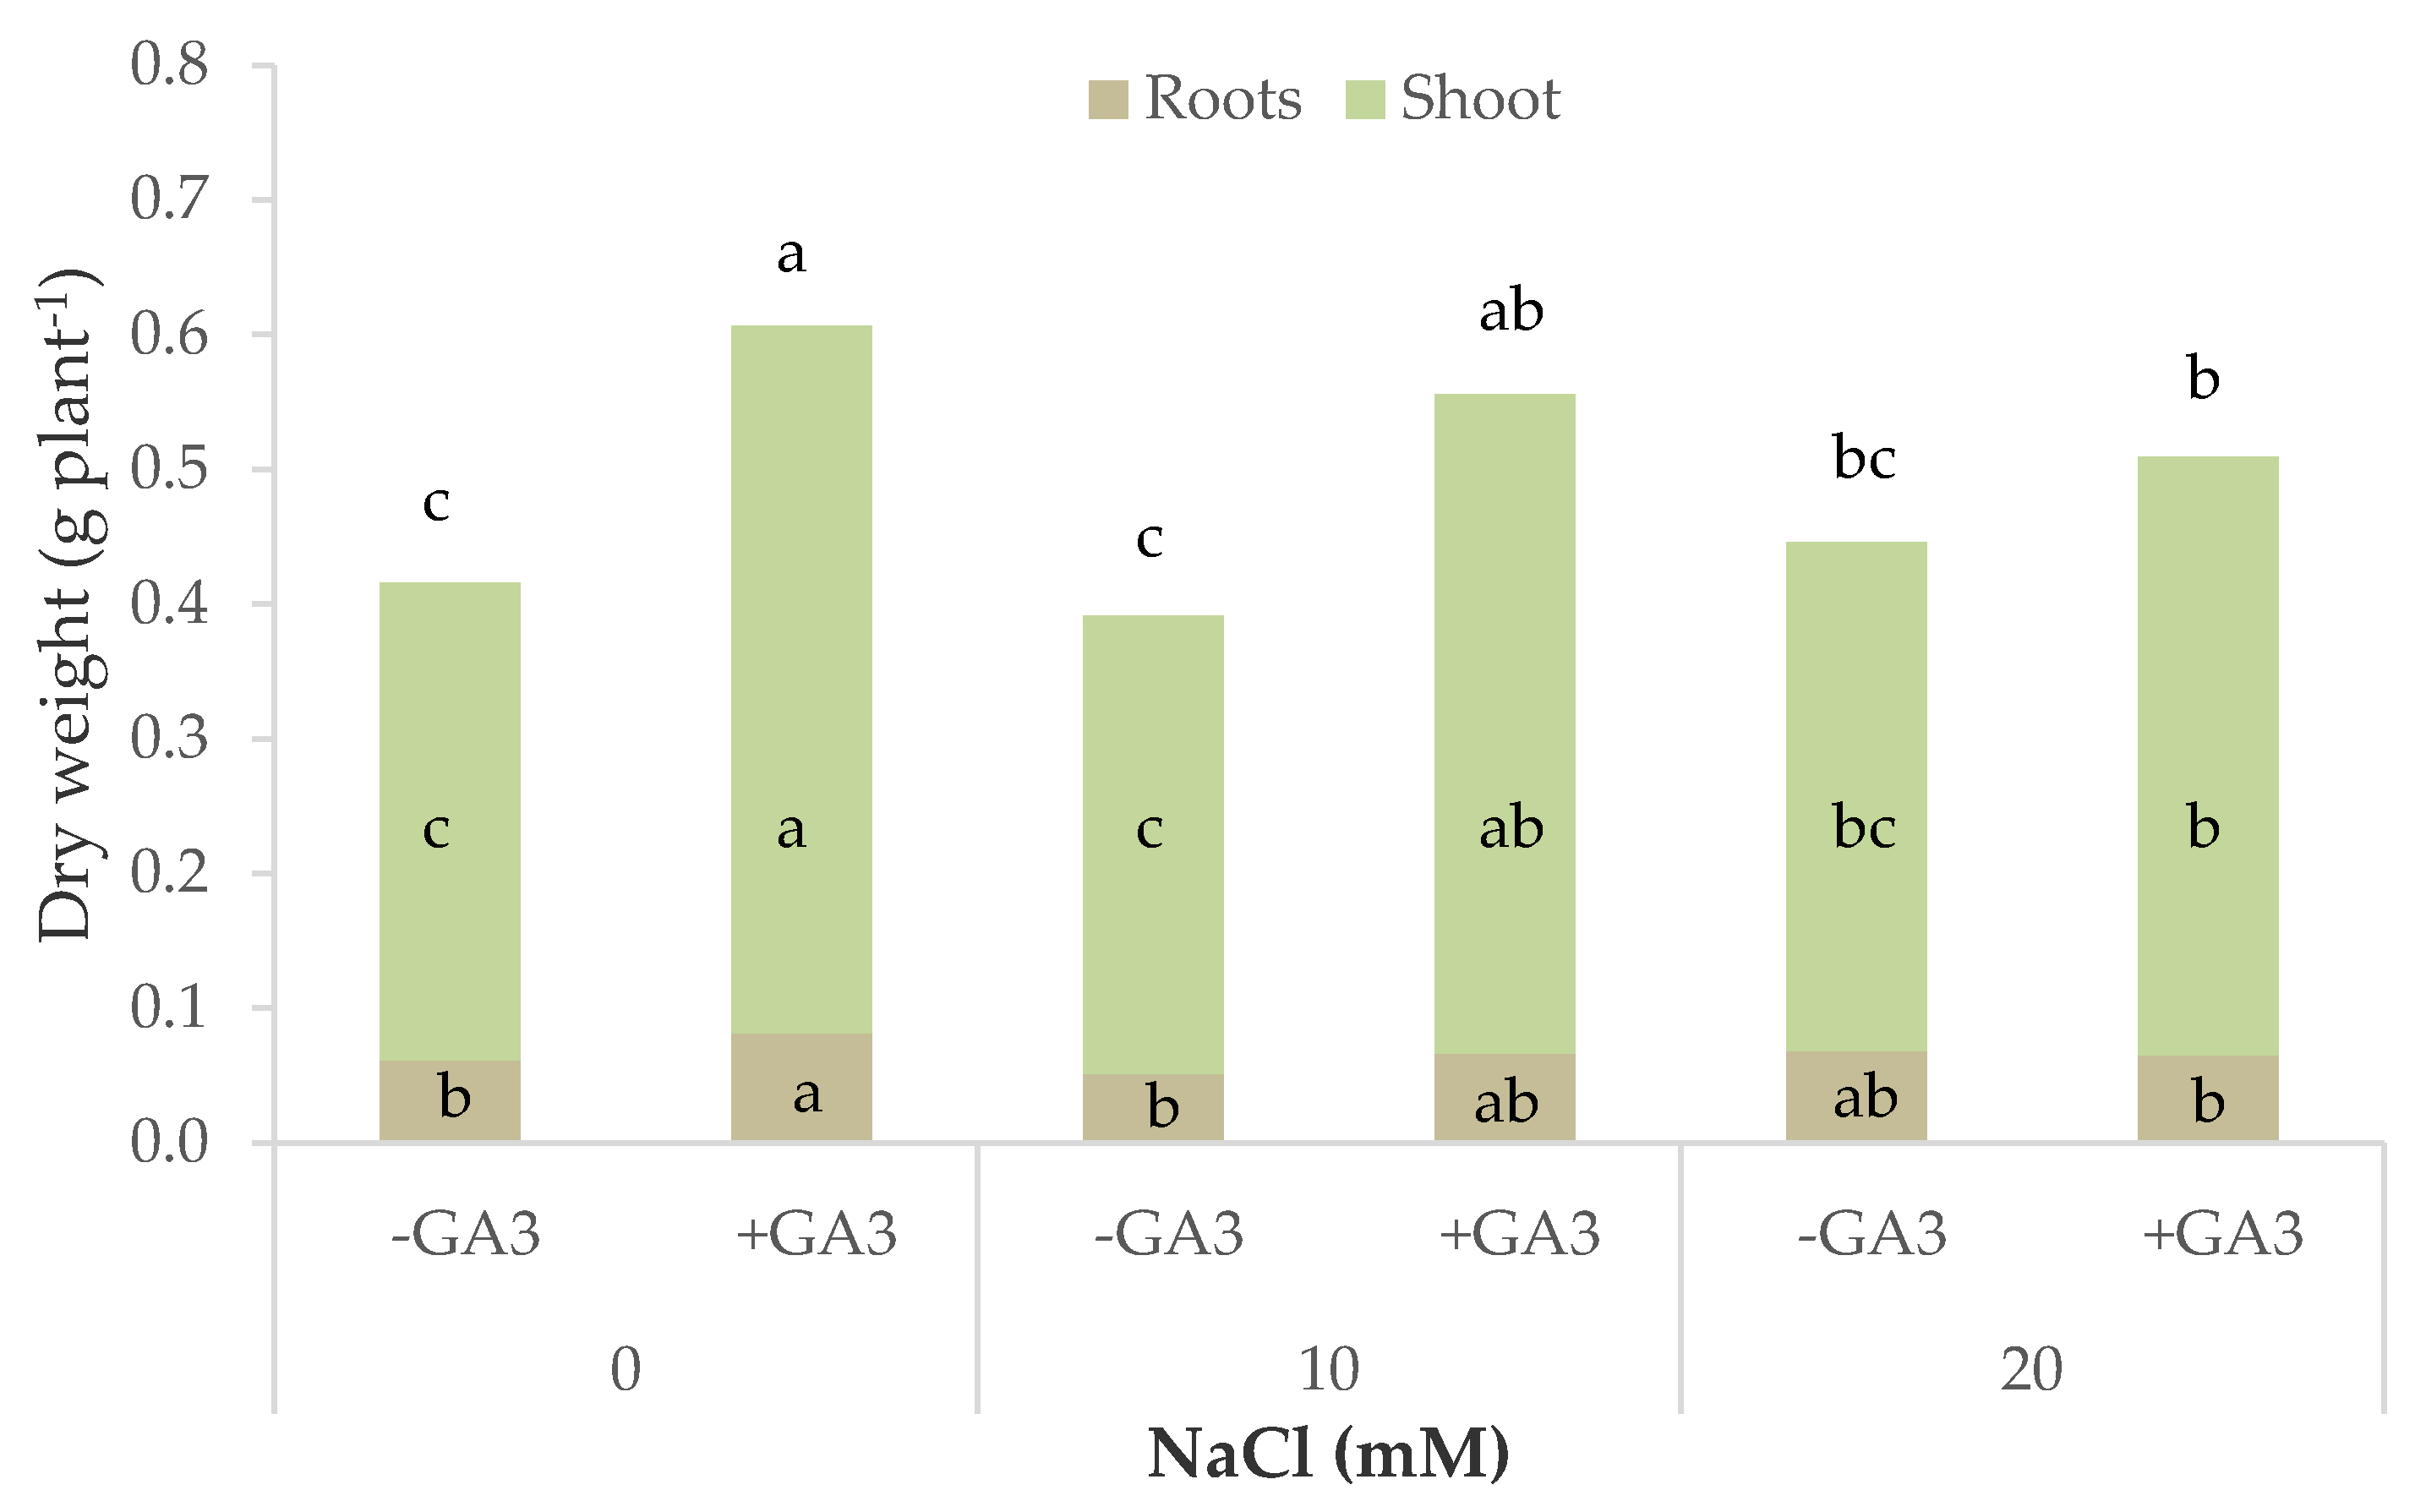
The dry biomass of lettuce plants was positively affected by GA3 treatment that significantly interacted with salt stress (Table 1, Figure 2). Increasing salt stress had no effect on the dry weight of control plants, whereas GA3-treated plants had a significantly higher dry weight than control plants at 0 and 10 mM NaCl and significantly reduced the dry biomass with the highest NaCl concentration to values similar to those of the untreated plants. A similar trend was recorded considering the shoot and the roots. An opposite trend was found after analyzing the dry matter percentage of the lettuce plants. In fact, the plants grown on MNS with GA3 had almost a constant dry matter percentage even when increasing the salt stress (4%), while control plants significantly increased their dry matter percentage from 3.6% at 0 mM NaCl to 4.5% at 20 Mm NaCl.
The plants of lettuce not subjected to salt stress yielded 3.6 kg m−2 on average; the use of MNS with NaCl determined a reduction of the crop yield that was similar for the two NaCl levels tested (−13.2% on average for 10 and 20 mM NaCl) (Table 2). The plants grown without GA3 yielded 2.9 kg m−2 on average, while the addition of GA3 to the MNS allowed a higher yield at each NaCl level (+31.7%) so that the supply of GA3 in brackish MNS allowed the plants to reach a crop yield similar to those grown without GA3 and 0 mM NaCl. The percentage of the yield suitable to become ready to eat produce was significantly affected by salt stress and GA3 supplementation. The minimal processing yield dropped below 90% on average at the highest salt stress level and was positively influenced by GA3 (89.2% and 91.3% for 0 M and 10−6 M GA3, respectively).
During plant growth, the MNS taken up by the plants was periodically replenished, and its consumption was recorded for each tube. From these data, we calculated the water use efficiency (WUE) and nitrogen use efficiency (NUE), which were, respectively, 3.9 g DW L−1 H2O and 12.3 g DW g−1 N on average in the plants not supplied with GA3. WUE and NUE increased by adding GA3 in the MNS (+31.5% and +34.2%, respectively) but were not influenced by salt stress (Table 2).
Gibberellic acid and salt stress also affected the leaf characteristics of lettuce plants (Table 3). The number of leaves per plant decreased due to increasing salt stress but was positively affected by the GA3 in the MNS. Gibberellic acid also significantly influenced the leaf morphology, enlarging leaf width. This determined an increase of the area of each leaf (+3.6 cm2 leaf−1, on average), resulting in a greater total leaf area per plant (+79.4 cm2 plant−1, on average). These parameters were higher in the plants grown without NaCl in the MNS (78.0 cm2 leaf−1, 721.5 cm2 plant−1), and decreased significantly in salt-stressed plants (−15.9% and −22.1% on average, respectively). The specific leaf area (SLA) was 703.2 cm2 g−1 DW on average in the unstressed plants and decreased significantly by adding 10 or 20 mM NaCl in the MNS. Leaf thickness was also influenced by the presence of GA3 in the MNS that raised SLA by 5.1% on average (Table 3).
Nutrient solutions added with NaCl and GA3 affected leaf physiology as well as leaf morphology as shown by the measures of stomatal conductance. This parameter was affected by the salinity of the nutrient solution that determined a reduction of 12.1% on average for saline MNS, against the value measured in the unstressed plants (567.5 mmol m−2 s−1) (Table 3). The plants supplied with GA3 had a significant increase of stomatal conductance that was on average 559.5 mmol m−2 s−1, 15.7% higher than those not supplied with GA3 (483.8 mmol m−2 s−1) (Table 3).
The leaves of lettuce also showed changes as a function of GA3 or salt stress in their color characteristics. The lightness of the leaf color (L*) ranged from 54.8 to 51.1 for the plants not subjected (0 mM NaCl) or subjected to the salt stress (20 mM NaCl), respectively (Table 4). The leaf color was significantly greener due to increasing salt stress and in the plants supplied with GA3; leaf saturation (Chroma) was lower in the plants not supplied with GA3 irrespective of salt stress, whereas the plants supplied with GA3 had a more vivid color with 0 mM NaCl and a less vivid color (lower chroma) in increasing salt stress.
The quality of lettuce plants at harvest was assessed by measuring the soluble solid content (SSC), titratable acidity (TA), and nitrate and ascorbic acid content of the leaves, which represent the edible part of this plant (Table 4). SSC was significantly influenced by salt stress only, which determined a significant increase at the highest concentration of NaCl in the MNS (3.4 °Brix, +23.6% than 0 mM NaCl), whereas TA had different trends as a function of both GA3 and salt stress; TA decreased in increasing salt stress in the plants supplied with GA3, while it had an opposite trend in the plants grown without GA3 in the MNS. The ascorbic acid content showed no difference in the leaves of lettuce plants at 0 mM NaCl (49.3 mg 100 g−1 FW on average), but it had a decreasing trend by increasing salt stress in the plants supplied with GA3 (30.5 mg 100 g−1 FW with 20 mM NaCl and 10−6 M GA3). Lettuce leaves accumulated a higher amount of nitrate when grown with GA3 in the MNS (2248.3 mg kg−1 FW on average, +34.0% than control plants) (Table 4).
3.2. Morphophysiological Parameters and Yield of Rocket
The morphological characteristics of rocket plants were affected to a different extent by the NaCl and GA3 content of the nutrient solution. Plant height was slightly affected only by salt stress, whereas fresh and dry biomass accumulation was affected by both salt stress and GA3 (Table 5). Total plant weight increased as a function of GA3 supplementation from 8.1 to 9.6 g plant−1 on average, whereas it dropped from 10.3 g plant−1 of the control plants to 7.8 g plant−1 with the highest salt stress (20 mM NaCl). This reduction was mainly due to the reduction of the shoot of the plant (S) as the root biomass (R) did not change due to increasing salt stress, whereas GA3 exerted its effect in opposite ways on shoot and roots: The first was positively affected by GA3 while the roots decreased their fresh weight in the presence of GA3 in the MNS (Table 5). These variations determined significant changes in the S/R ratio that was significantly lower than the control with 20 mM NaCl (−29.4%) but was higher when GA3 was added to the MNS (+52.6%).
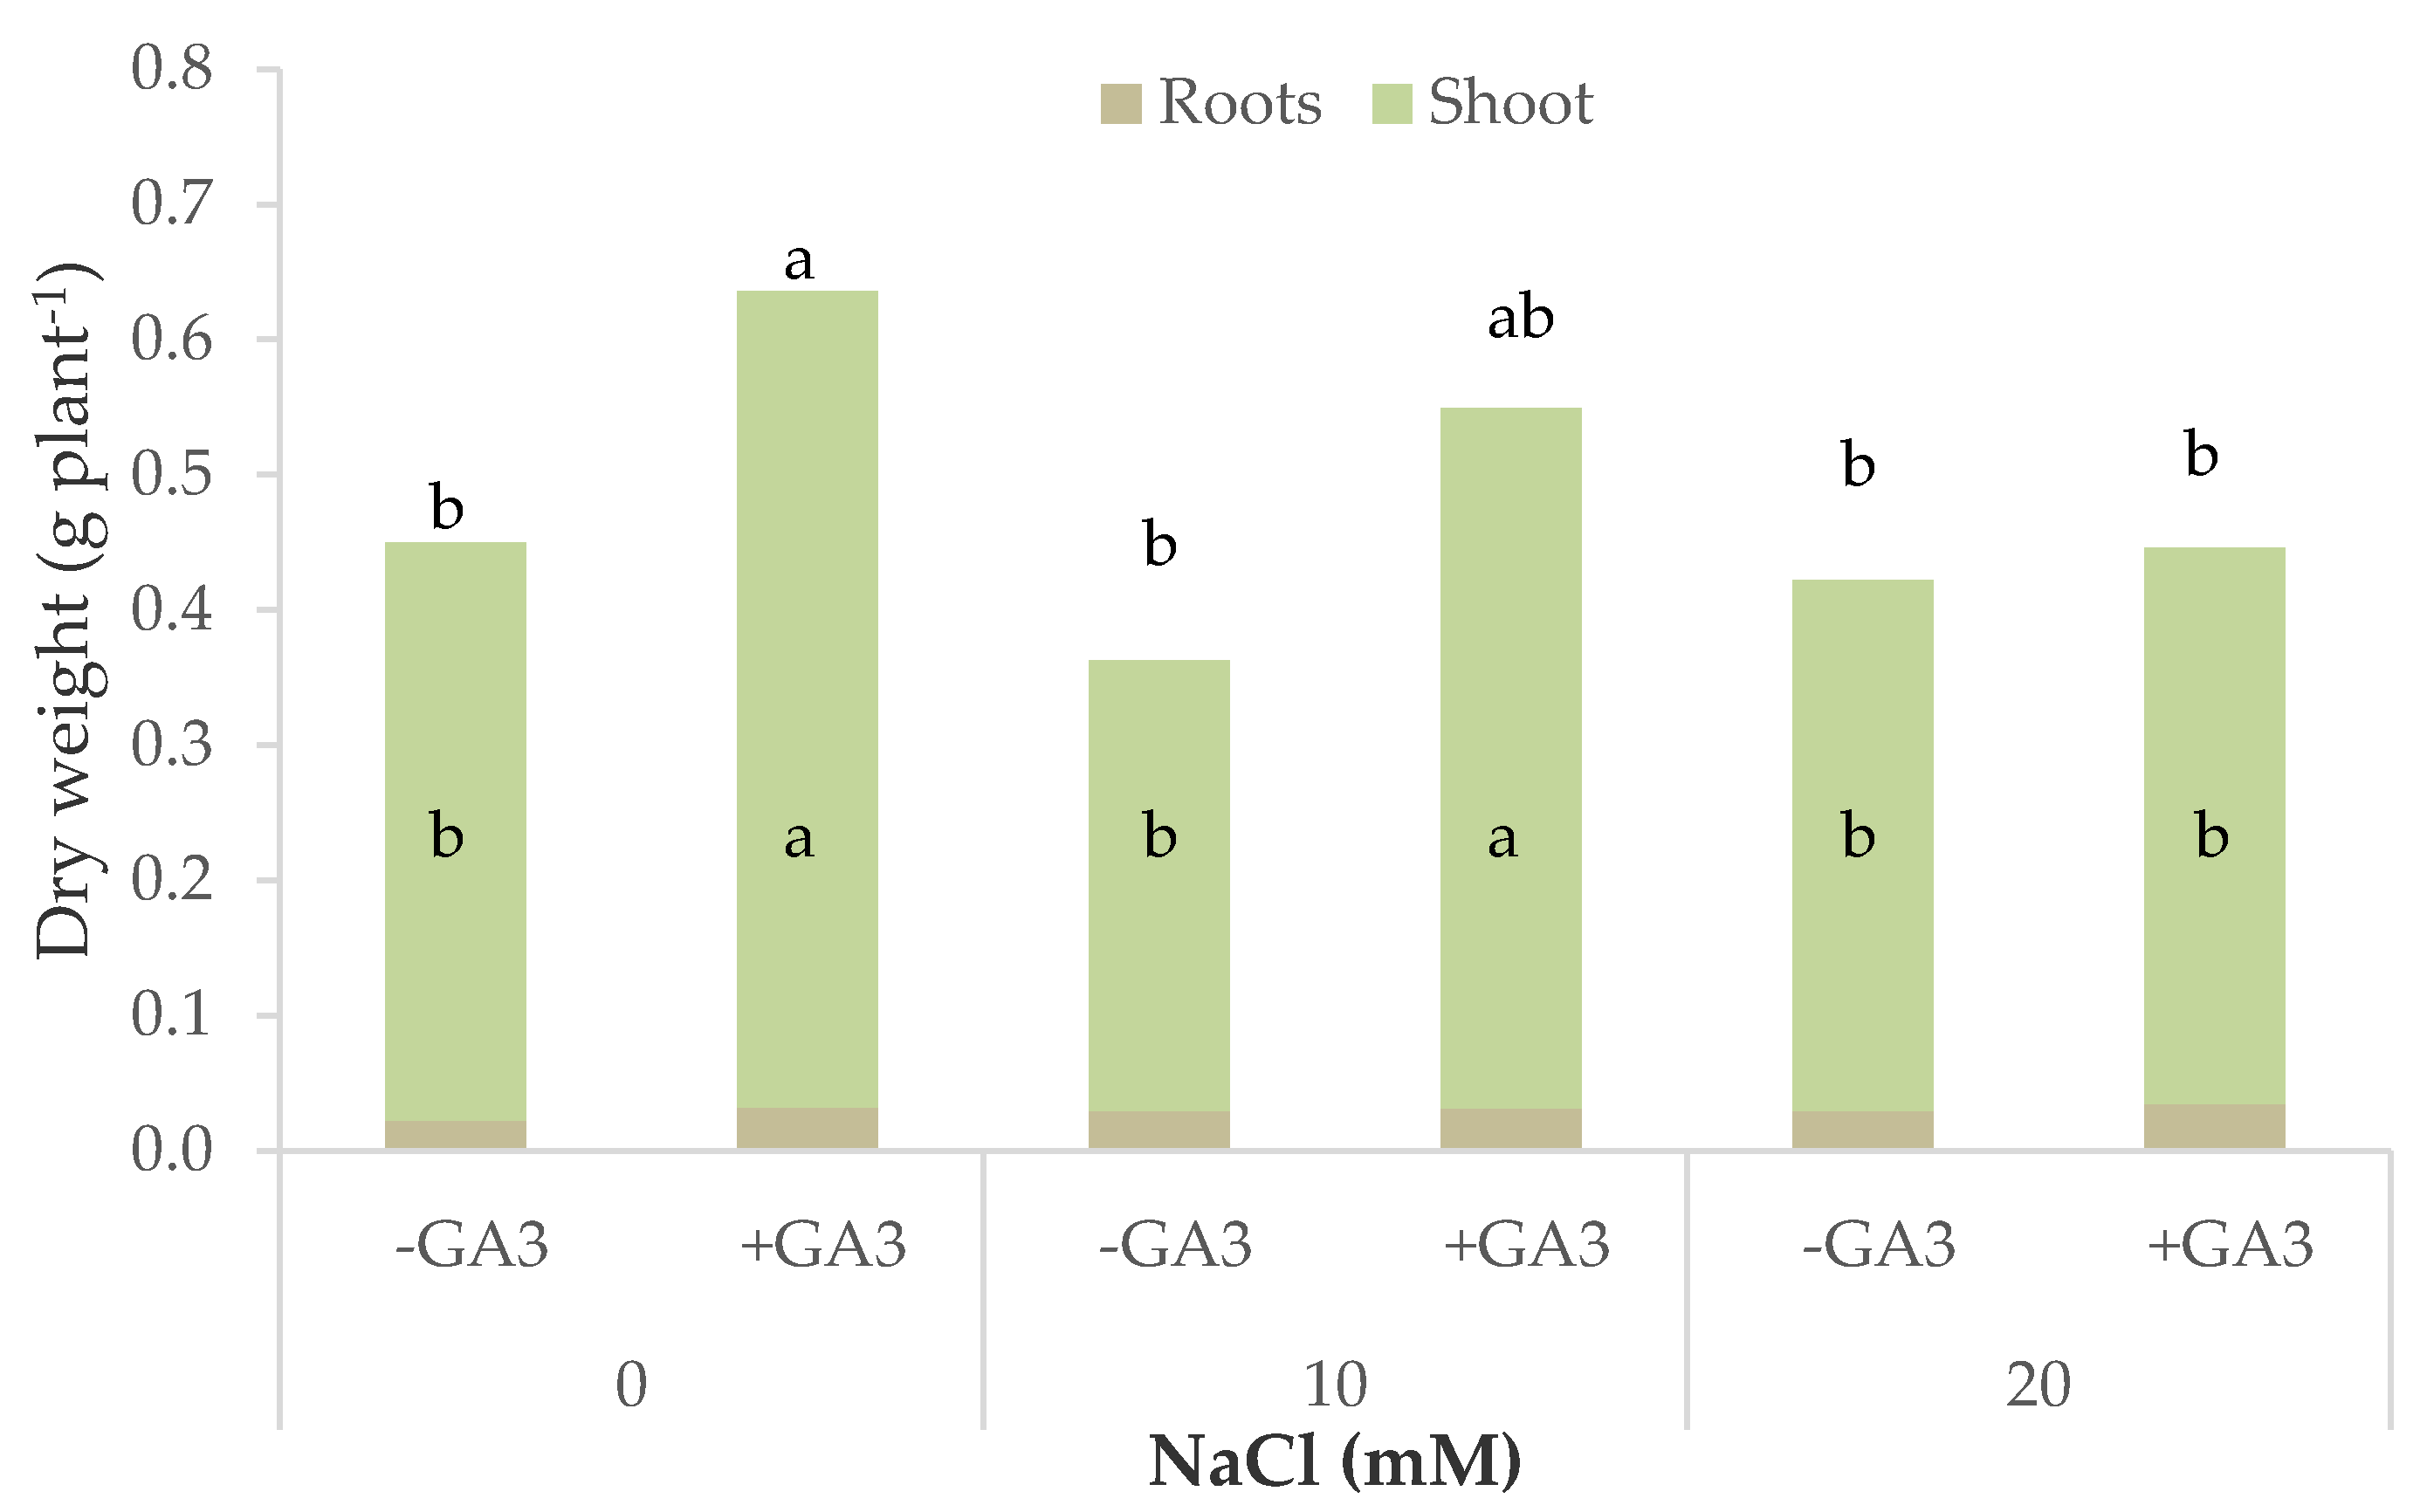
The dry biomass of rocket plants was influenced in different ways by salt stress as a function of the GA3 treatments. The plants grown on MNS without GA3 did not significantly change their dry weight due to increasing salt stress, whereas those supplied with GA3 had a significantly higher dry weight with 0 mM NaCl in the MNS (0.64 g DW plant−1) and slightly dropped down to 0.45 g DW plant−1 with 20 mM NaCl, a value that was not significantly different from the plants not treated with GA3 (Table 5, Figure 3). The epigeal part of the plants was similarly affected by the interaction NaCl × GA3, but they also accumulated higher dry biomass with 10 mM NaCl in the MNS while the roots were not affected by salt stress nor by GA3. The distribution of the dry matter between the shoot and roots was significantly affected only by the salt stress as shown by the S/R ratio, which decreased, on average, from 19.2 in the control plants down to 13.3 in the plants grown with 20 mM NaCl in the MNS (Table 5). The dry matter percentage of the rocket plants showed a significant interaction between salt stress and GA3. The highest salt stress (20 mM NaCl) determined a significant increase of the dry matter percentage in the plants not treated with GA3 (5.6%, +19.0% than control), whereas the plants supplied with GA3 had a high dry matter percentage irrespective of the salt stress level (5.6% on average).
As found for lettuce plants, the yield of rocket plants was positively affected by GA3 and negatively by salt stress. The plants of rocket not subjected to salt stress yielded 3.0 kg m−2 on average, while yield dropped by 17.4% and 25.4% with 10 and 20 mM NaCl, respectively. The plants grown on MNS added with GA3 showed a yield increase of 0.5 kg m−2 on average, as compared to controls (Table 6). The part of plants suitable to be minimally processed leaves was 93.7% on average of the plants grown with GA3 irrespective of salt stress. A similar minimal processing yield was calculated for the plants grown without GA3 and with 0 and 10 mM NaCl, while untreated plants grown at the highest salt stress level significantly reduced this parameter (87.4%) (Table 6).
A WUE of 1.7 g DW L−1 H2O was calculated for rocket plants grown in MNS with the lowest EC (0 mM NaCl) and without GA3. This parameter increased significantly up to 2.6 g DW L−1 H2O with only GA3 added to the MNS with 0 mM NaCl whereas it remained lower in all the other NaCl × GA3 combinations (2.1 g DW L−1 H2O on average) (Table 6). GA3 also exerted its positive effect on NUE of the unstressed rocket plants (0 mM NaCl), which increased from 5.9 g DW g−1 N in non-treated plants to 9.3 g DW g−1 N in GA3-treated plants (Table 6). The highest salt stress (20 mM NaCl) determined a significant increase of NUE in untreated plants (7.4 g DW g−1 N) whereas the NUE of the plants supplied with GA3 dropped from 9.3 down to 7.3 g DW g−1 N, on average, when grown in salt stress conditions (Table 6).
The morphological traits of rocket leaves were variously affected by the presence of gibberellic acid in the nutrient solution or by the salt stress (Table 7). The plants supplied with GA3 were leafier than the control plant and both treated and untreated plants slightly but significantly reduced the number of leaves in increasing salt stress (Table 7). The leaves showed modification in their morphology due to salt stress as regards the petiole length and leaf area, which were 8.7% and 16.9% smaller than the control, respectively. A similar negative effect of salt stress was also recorded on the total leaf area per plant that dropped from 206.8 to 161.1 cm2 plant−1 on average for 10 and 20 mM NaCl. Even if the average leaf area was not affected by GA3, the total leaf area per plant was significantly higher (195.5 cm2 plant−1 on average) in the GA3-treated plants than in the untreated plants (157.2 cm2 plant−1 on average) (Table 7).
Unstressed plants beneficiated from GA3 supplementation, which determined a significant increase of stomatal conductance from 227.3 to 298.5 mmol m2 s−1, but this positive effect was not maintained in salt-stressed plants (235.8 mmol m2 s−1 on average) (Table 7).
The color of rocket leaves at harvest was significantly affected by salt stress and GA3 supplementation. L* and Chroma both decreased under salt stress conditions and with GA3 supplementation, whereas the hue angle slightly increased in the stressed plant supplied with GA3. Thus, the leaf color tended to get darker and less vivid due to both salt stress and GA3 and tended to get greener in salt-stressed plants supplied with GA3 (Table 8).
The chemical characteristics of rocket leaves showed some modifications due to salt stress and/or GA3. The soluble solids content (SSC) was mainly affected by GA3 as this parameter dropped from 5.5 to 4.7 °Brix by adding GA3 in the MNS. Titratable acidity (TA) decreased in increasing salt stress in the plants not supplied with GA3, while the treated plants had an almost constant TA (Table 8). The ascorbic acid content of the unstressed plants was 162.0 mg 100 g−1 FW on average and was significantly lower in the stressed plants (138.7 and 113.2 100 g−1 FW on average for 10 and 20 mM NaCl, respectively). The plants supplied with GA3 had a higher ascorbic acid content than the untreated plants at each salinity level (+15.9% on average) (Table 8). A similar effect of salt stress was found for the nitrate content of rocket leaves, which decreased from 2235.0 to 1670.0 mg kg−1 FW on average, as increasing NaCl in the MNS from 0 to 20 mM, whereas GA3-treated plants had a significantly lower nitrate content (1486.7 mg kg−1 FW on average) than control plants (2400.0 mg kg−1 FW on average) (Table 8).
3.3. Principal Components Analysis
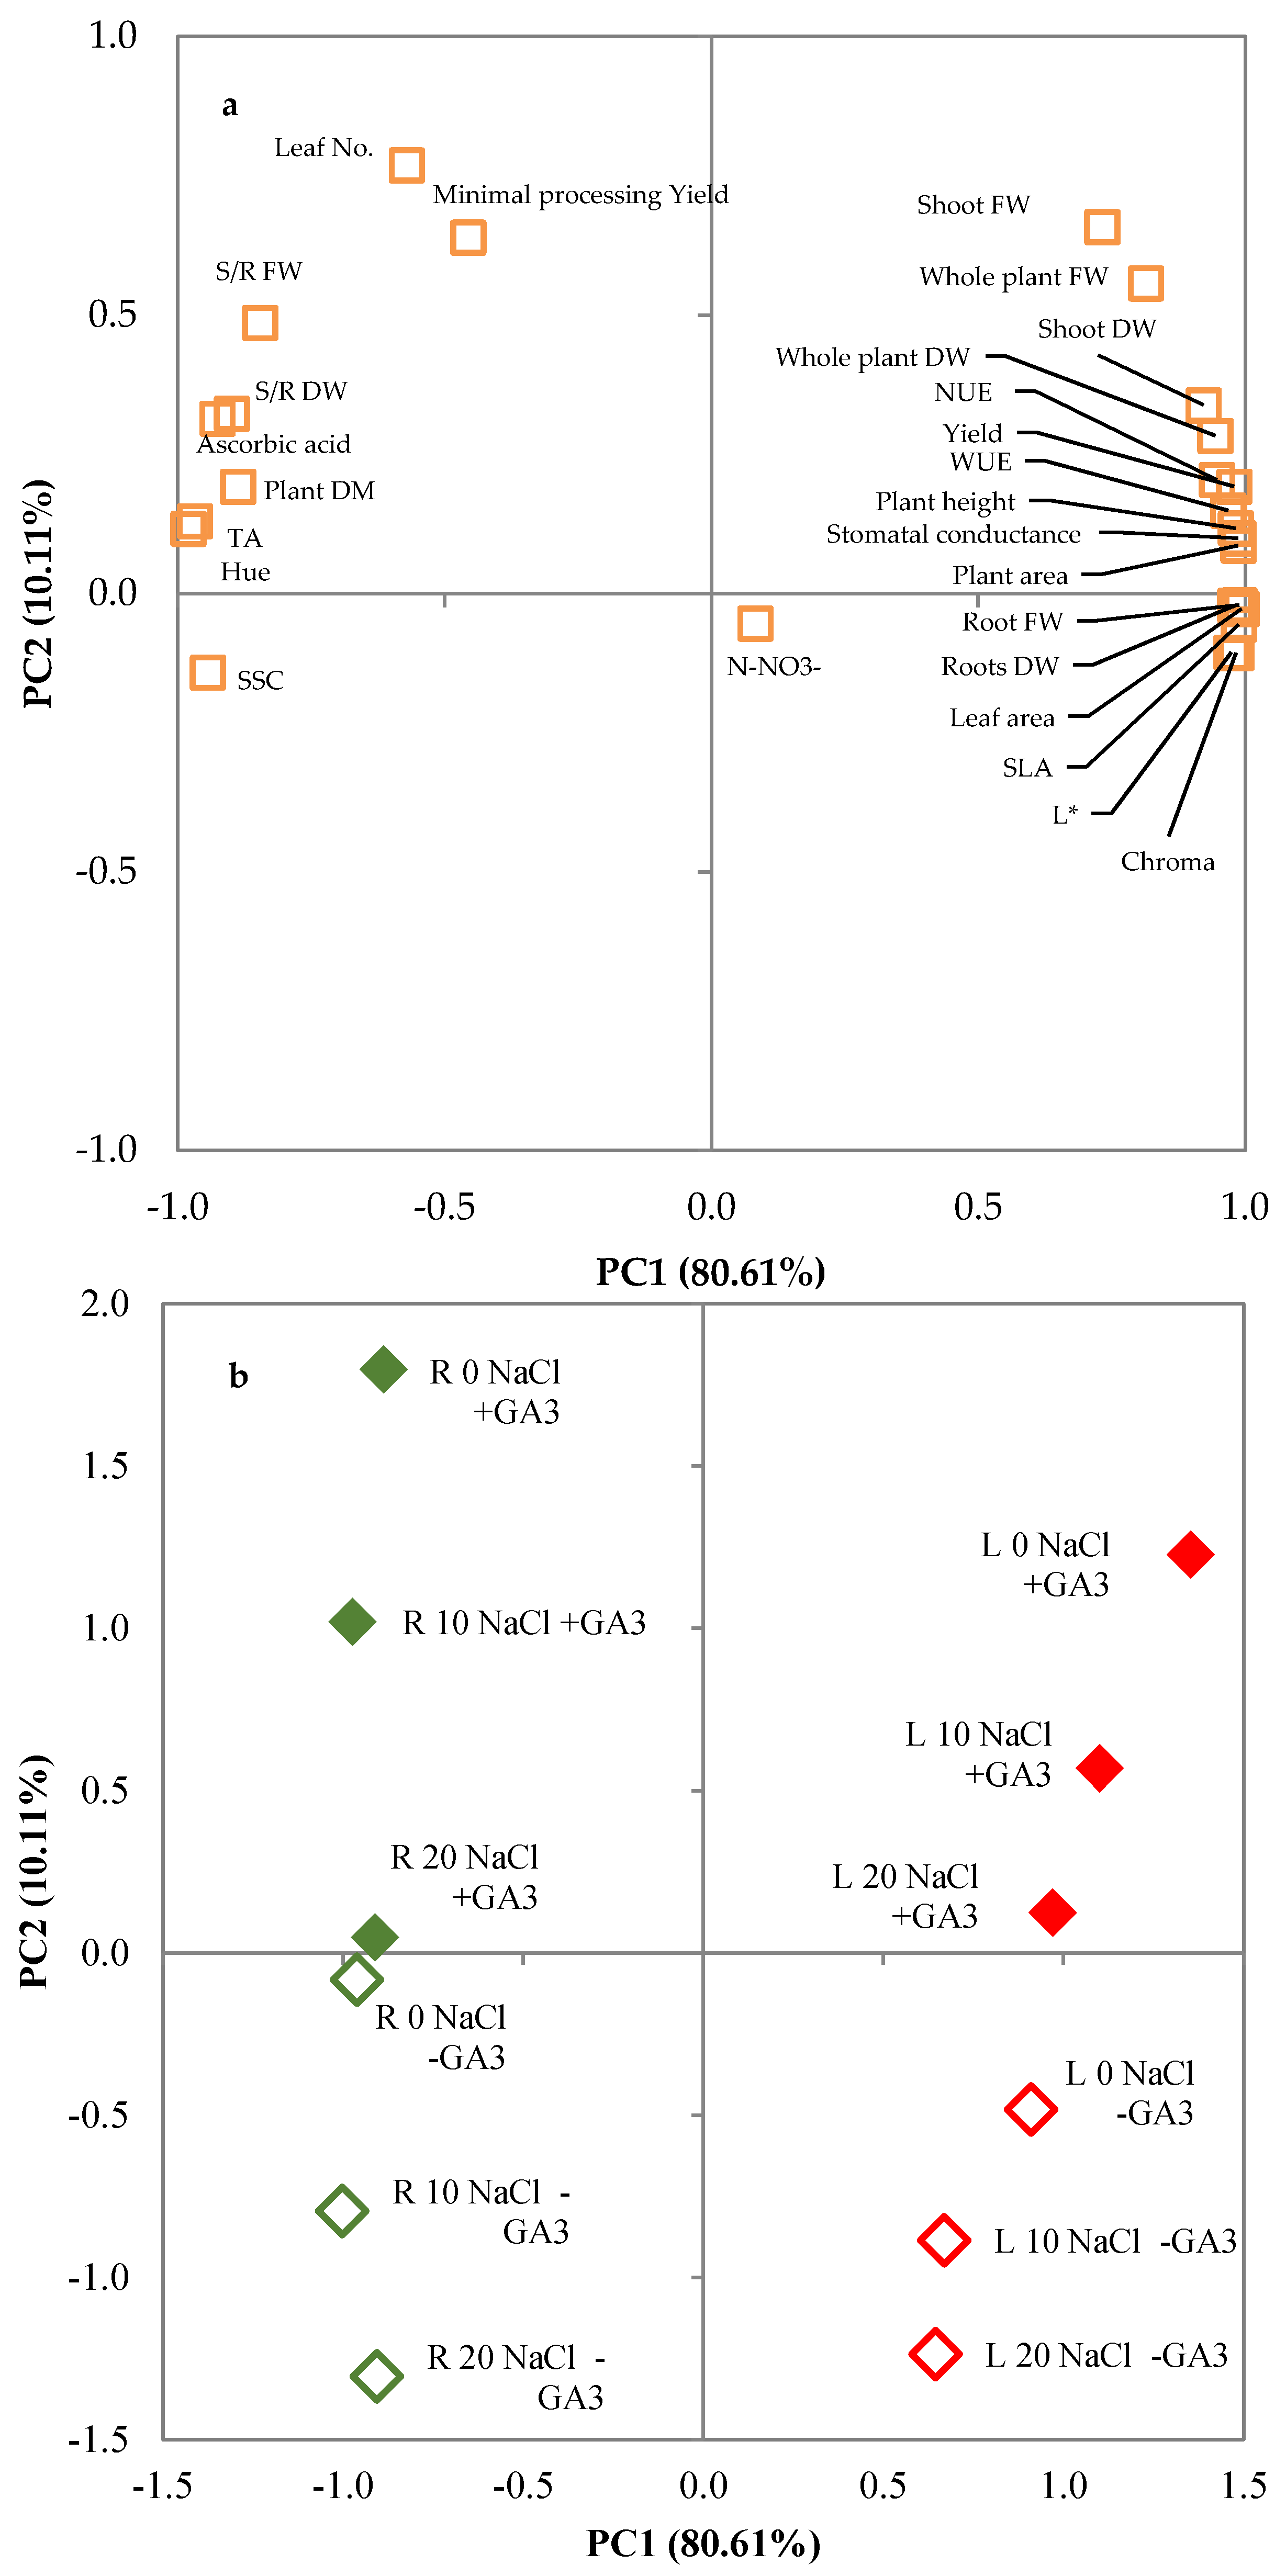
The principal component analysis (PCA) disclosed three principal components (PCs) with eigenvalues higher than 1 (Table 9), accounting for 80.61%, 10.11%, and 5.18% of the total variance, respectively. This indicated that the initial 26 variables could be expressed as a linear combination of three PCs, which explain 95.89% of the total variance. PC1 was mainly related to plant height, whole plant FW, shoot FW, root FW, S/R FW, whole plant DW, shoot DW, root DW, S/R DW, plant dry matter percentage, yield, WUE, NUE, plant and leaf area, SLA, stomatal conductance, leaf color components, SSC, TA, and ascorbic acid content; PC2 was related to minimal processing yield and leaf number; and PC3 was related to nitrate content (Table 9). The projection of the original variables on the plane of the two main PCs could demonstrate such a relationship, as reported in the plot of loadings (Figure 4a). The discrimination of the various NaCl concentrations × GA3 treatments applied to leaf lettuce and rocket plants can be seen in the plot of scores (Figure 4b), where two main clusters could be visibly distinguished. Rocket scores were located in the negative part of the PC1 axis and clearly separated from those of lettuce, located in the positive part of the PC1 axis. The scores of lettuce and rocket plants grown in MNS with added GA3 were in the positive part of the PC2 axis whereas untreated plants were in the negative part of the PC2 axis. The response of lettuce and rocket to salt stress was similar as it determined a decrease of the PC2 values of both vegetables. Lettuce plants showed smaller variations of PC2 values than rocket plants, which in turn were more responsive to the GA3 treatment.
Combining the data from the plot of loadings and scores, it can be concluded that NaCl levels and GA3 treatment influenced the tested species in different ways (Figure 4a,b). Lettuce was related to all parameters positively related to PC1, whereas rocket plants were related to all parameters negatively related to PC1. The presence of GA3 in the nutrient solution was positively related to PC2 and partially to PC1 in lettuce plants and only to PC2 in rocket plants. The increase of the NaCl concentration in the MNS was negatively related to PC2 in rocket and lettuce plants; the latter was also negatively related to PC1 as regards salt stress.
4. Discussion
The evidence that the salt tolerance mechanism in plants is primarily under hormonal control and that plants’ response to increased salinity is related to changes in endogenous phytohormone levels has led to studies that aimed to re-equilibrate the phytohormone levels of salt-stressed plants through the exogenous supplementation of plant growth regulators [18,20,29,42]. Considering the plants under field conditions, it has been shown that vigorous plants can better cope with salt stress, possibly by increasing the salinity tolerance threshold or delaying its onset [43]. The exogenous supplementation of plant growth regulators, such as gibberellic acid (GA3), can be effective in increasing plant growth and vigor and can affect plant metabolism by enhancing N uptake and assimilation and improving photosynthetic CO2 fixation [31,44,45], thus helping plants to better cope with salt stress. In a previous work [24], we found that leaf lettuce and rocket grown in a floating system showed enhanced growth and quality when 10−6 M GA3 was added to the MNS. In this experiment, we tested the possibility of increasing the salinity tolerance threshold of these species by supplying 10−6 M GA3 through the mineral nutrient solution of a floating system and evaluated the combined effects of salt stress and GA3 on growth and quality.
Leaf lettuce and rocket were shown to be affected by the salt stress applied to the plants even with a different salinity tolerance threshold. The main visible effect of salinity on vegetables is a reduction of the growth rate, which determines smaller leaves and fruits, shorter plants, and the alteration of other morphological attributes, and ending in a reduction of the plant biomass [46,47]. These effects were also found in the tested species. Plant height showed a significant reduction of about 5% in both lettuce and rocket, but the latter recorded this reduction only at the highest salt stress. The salinity of the MNS also affected the fresh biomass of the plants of both species, but even for this parameter, the reduction was slight and related to the salt stress level in rocket plants whereas it reached a significantly lower value at an intermediate salt stress level in lettuce, confirming that the effects of salinity on vegetables depend on its level [48]. The reduction of fresh biomass could be ascribed to the increased osmotic stress determined by the high EC of the MNS that reduced water uptake and to a modification of plant metabolism and nutrient uptake. Salinity negatively influences the availability of the nutrient elements in the nutrient solution, thus possibly leading to a severe reduction of root growth [47,48]. This reduction was more evident for the root fresh weight of lettuce plants and could thus depend on crops and salinity levels. Salt stress can also affect water and nutrient uptake and translocation from the roots to the shoot, determining changes in biomass fractions as shown by the S/R FW ratio of rocket plants. The reduction of the lettuce and rocket fresh biomass induced by the exposure to salinity was mainly due to osmotic effects and changes in the water status of the plants because salt stress did not significantly affect the dry biomass accumulated in the plants of both species. The relative water content of leaves generally decreases in increasing salt stress and this could be due to lower water availability under stress conditions or to disorders of the roots that are not able to sufficiently compensate for the water lost by transpiration [49,50].
Inhibition in plant growth was significantly mitigated by the addition of GA3 to the MNS; the supplementation of gibberellic acid through the nutrient solution was confirmed to have a positive effect on fresh and dry biomass accumulation of the unstressed lettuce and rocket plants [24] and maintained this positive effect in the 10 and 20 mM salt treatments, with the biomass close to the control plants (fresh weight) or even significantly higher as regards the dry biomass. Plant hormones play an important role in plant growth and development and can alleviate the negative effects of salt stress [51]; gibberellic acid was found to be helpful in improving the growth of various crops under saline conditions [18,31,51,52]. The exogenous supply of hormones during salt stress may reduce water loss rates and also determine the increase in the leaf water potential and carbon gain rates [53]. The exogenous supplementation of GA3 may exert a positive effect on the growth of the aerial part of the plants by influencing internal resource repartition. The increase of the biomass of aboveground parts may be determined by the rise of many important catabolic pathways (ribose and polyribosome multiplication; DNA, RNA, and protein synthesis) [54,55,56,57]. The biomass increase in salt-stressed plants treated with GA3 could also be due to enhanced uptake and use of water and mineral nutrients [27,58,59] and transport of photosynthates [60,61,62], which follow from increased membrane permeability [63,64].
The yield and quality of leafy vegetables are strictly related to the characteristics of the aboveground biomass accumulated by the plants, thus the negative effects of salt stress on plant morphology and development severely impact yield and its economic value. Leaf lettuce and rocket cultivated in soilless systems were shown to be sensitive to salinity [10,14,65,66,67,68], and this sensitivity was confirmed in this experiment as they overcame the tolerance threshold starting with the lower NaCl concentration (10 mM; 3.4 mS cm−1 EC), which determined a yield drop by 11.6% and 24.6% on average for lettuce and rocket, respectively. Moreover, lettuce and rocket plants recorded a significant drop in the minimal processing yield at 20 mM NaCl that further increased the reduction in yielded plants and consequently the marketable portion obtainable from salt-stressed plants.
Even for these parameters, GA3 treatment successfully mitigated salt stress and enhanced the salt tolerance of the tested crops. The supply of 10−6 M GA3 through the nutrient solution increased the yield parameters in salt-stressed plants to similar or even higher levels than control plants (0 mM NaCl; 0 M GA3). It is well known that the exposure of plants to salinity induces a proportional increase in abscisic acid (ABA) synthesis, which is often related to the leaf water potential [51]. Thus, the increase of the endogenous ABA may be due to a water deficit rather than specific salt effects [69]. Abscisic acid is considered the root-to-shoot stress signal and its increased concentration in the xylem was found to be correlated with reduced leaf conductance and general limitation of leaf growth. Since gibberellins stimulate the catabolism of ABA [70], the exogenous application of gibberellic acid might limit the ABA-mediated negative response of plants to salinity. Moreover, GA3 has been shown to have many positive direct effects on plant metabolism and plant growth [24,28,31,62]. Plants supplemented with exogenous GA3 have shown enhanced activity of carbonic anhydrase (CA), which plays a role in CO2 fixation in the chloroplast during photosynthesis [44]. This increased enzymatic activity may improve the CO2 supply at the site of its fixation and increases the net photosynthetic rate, thus increasing biomass accumulation and yield [44,71]. Another contribution that could have increased the photosynthetic rate of lettuce and rocket plants could be ascribed to the positive effect of GA3 on stomatal conductance. This effect was found in the unstressed plants of both leafy vegetables, and even in salt stress conditions in lettuce plants as also found in tomato grown in soilless cultivation at low salinity [18]. Plants grown under salt stress try to compensate for the reduced ability to take up water with stomatal closure, which reduces the volume of air exchanged with the environment. This mechanism can be an efficient system to have more economical water utilization and may limit the harmful salt ions’ uptake [72]. Nonetheless, the reduction in stomatal conductance and the low intercellular CO2 led to lower photosynthetic rates and limited growth [73], hence the positive effects of GA3 on stomatal opening and photosynthetic rates resulted in enhanced water use efficiency and consequently in improved nitrogen use efficiency even if to a different extent for the leafy vegetable tested.
As well as stomatal closure, salt stress affects the rate at which plants produce new leaves and influences other leaf characteristics that may determine a negative impact on photosynthesis and plant growth, such as leaf number and leaf expansion and mesophyll anatomy [74,75]. These modifications may vary among species as they can cope with salt stress through different tolerance strategies. Leaf morphology changes were also found in this experiment for lettuce and rocket floating on MNS with high EC. In fact, a reduction in the total leaf area per plant was recorded for both species and was due to variation of the leaf morphology (leaf width in lettuce and petiole length in rocket), leaf area, and leaf number per plant. Moreover, salt-stressed lettuce leaves were thicker than control leaves as shown by the lower SLA. Leaf thickening may negatively influence the diffusion of CO2 in the mesophyll and this parameter may have a role in limiting the photosynthesis of stressed leaves [75]. The differences determined by salt stress in SLA between lettuce and rocket could be due to differences in the mechanisms that species activate to overcome salt stress. GA3 supplementation helped salt-stressed plants in limiting the negative effect of salt stress on leaf development and morphology and confirmed an improvement of these characteristics in control plants [24]. The application of GA3 is often simultaneous with an increase in stomatal conductance and a decrease in intercellular CO2 partial pressure, which increases the net photosynthetic rate [45]. The positive effect of GA3 against salt stress could be ascribed to the morphological modifications that it determined in lettuce and rocket plants. These effects of GA3 supplementation could be very beneficial on leafy vegetables grown in hydroponic floating systems under salt stress, where a high plant density slows air movement inside the canopy, thus negatively affecting CO2 availability. Moreover, leafy vegetable quality is mostly based on leaf appearance, and the modifications induced by salt stress can negatively influence their market value. In addition to leaf size and morphology, salt stress may also affect leaf color as it can influence chlorophyll synthesis and degradation. Chlorophyll content may be lowered by increasing salinity, but this variation could depend on plant sensitivity or tolerance to salt stress. Leaf lettuce and rocket differed slightly in color changes due to NaCl, thus confirming the differences in species response. Generally, salt stress lowered color lightness and chroma and increased the hue angle, but these variations were very small in both species so that the variation in the photosynthetic pigment content was probably also small. Besides, the increase in leaf thickness recorded in salt-stressed lettuce plants could have determined a chlorophyll accumulation per unit leaf area [76] that could explain the increase of the hue angle under salt stress conditions.
Even if lettuce and rocket had a similar response to salt stress and GA3 treatment as regards plant growth and morphology, the experimental factors determined changes in the metabolism that differed in the tested species, as suggested by the differences in SSC, TA, ascorbic acid, and nitrate content. The presence of these chemical components could be modified in response to salt stress. In fact, many plants react to salinity by activating or improving some metabolic pathways or the biosynthesis of secondary metabolites; among these, soluble solids, sugars, organic acids, proteins, and amino acids may play a role in plant turgor maintenance, acting as osmolytes or osmoregulators [48,77]. These metabolites are often responsible for the nutritive quality of fruits and vegetables, thus their presence could enhance the market value of the products, offsetting the economic losses caused by yield reductions due to salinity [48,78]. The increase of SSC in salt-stressed lettuce leaves confirmed that this species reacted as others by accumulating soluble carbohydrates in response to salinity [78,79]. The increase of soluble solids in rocket leaves was very low, thus indicating that rocket plants activated other mechanisms to reduce their osmotic potential and to maintain plant turgor. Moreover, GA3 treatment determined a significant decrease of SSC in rocket plants irrespective of salt stress that could be due to increased growth promoted by the exogenous supply of GA3, which increased carbohydrate utilization.
Plants react to the increase of reactive oxygen species under salt stress by activating certain antioxidative enzymes (catalase, peroxidase, glutathione reductase, and superoxide dismutase) and the scavenging of free radicals could also cause a decrease in total ascorbate, total glutathione, and α-tocopherol levels [80,81]. Leaf lettuce and rocket showed a reduction of the ascorbic acid content in salt-stressed plants that was probably caused by the counteracting of reactive oxygen species. GA3 treatment acted with an opposite trend on the ascorbic acid content of lettuce and rocket, showing again that the contribution of gibberellic acid in counteracting salt stress could involve different mechanisms in different species. Moreover, ascorbic acid accumulation could strictly depend on nitrogen availability and translocation, thus the different responses of the ascorbic acid content to the GA3 treatment could be related to the differences in the nitrogen metabolism of lettuce and rocket plants determined by GA3 supplementation as revealed by the differing nitrate accumulation. High availability of nitrogen seems to be related to a lower concentration of vitamin C in some fruits and vegetables, with variations that could depend on species, climate, and other factors [82,83]. This was confirmed in this work as the level of ascorbic acid was negatively related to the nitrate content of the leaves.
As already stated, the salinity of soil solution or irrigation water can determine imbalances in nutrient uptake, making the absorption of essential cations and anions, such as K+ and NO3−, problematic to plants [84,85]. Leafy vegetables may accumulate a great amount of nitrates in the leaves, causing a reduction of their nutritional quality as nitrates can be harmful to human health [86,87,88]. Furthermore, if the nitrate content of lettuce and rocket overcomes the thresholds imposed by EU regulations, they can even lose marketability [89]. Salt stress can determine a reduction of nitrate reductase activity in some species, leading to nitrate accumulation [90]. Nevertheless, the reduction of nitrate uptake caused by moderate salinity could help in improving the nutritional quality and economic value of some leafy vegetables. This goal was obtained in rocket plants grown with 20 mM NaCl in the MNS whereas salt stress did not affect the nitrate content of lettuce, showing that the root system of these species could differ in uptake capacity. Differences were also found in their response to GA3 treatments as regards the nitrate content of the leaves as also found in previous works [24,32]. As already discussed, GA3 positively affected NUE and this may be due to the effect of gibberellic acid on improving nitrogen utilization by enhancing N metabolism and its redistribution in the plants [31]. The exogenous GA3 supplementation stimulated plant growth, thus increasing the needs of nitrogen for tissue development. It is known that GA3 has a role in regulating the distribution of the assimilates from the photosynthetic tissue to the shoot apex and the young leaves, aiding in the utilization of nitrogen and thus increasing plant biomass and yield [31]. Gibberellins can also influence the activity of nitrate reductase, an enzyme that is crucial for the nitrogen metabolism of plants [91,92]. The positive effect of GA3 on nitrate reductase of rocket plants could have determined a reduction of nitrate accumulation even under salt stress. On the contrary, lettuce plants supplied with GA3 could have increased the nitrate content during growth thanks to a more efficient translocation from roots to leaves where nitrate competed with sodium ions for accumulation in the vacuoles, alleviating ionic and osmotic stress and maintaining plant turgor [9].
The severity of salinity effects may vary greatly according to species or even to varieties within a species and it may be moderated or accentuated by environmental or agronomic factors [47]. These differences and the modification to salt tolerance were shown well by the PCA analysis that underlined the different responses of lettuce and rocket to salt stress and showed that the supply of exogenous GA3 counterbalanced the salinity, acting on different plant adaptation systems. Moreover, the effects of GA3 treatment had a different extent in the tested species, thus confirming that the response to exogenous GA3 may vary according to species [24,32,93].
5. Conclusions
Leaf lettuce and rocket plants floating on mineral nutrient solutions with an increasing level of NaCl suffered a significant reduction of growth and yield, determined by a reduction of the leaf number and leaf area, even with moderate salt stress (10 mM NaCl). The supplementation of exogenous GA3 through the MNS allowed substantial counterbalancing of the salt stress by enhancing various morphological and physiological traits, such as biomass accumulation, leaf expansion, stomatal conductance, WUE, NUE, etc. The effects of salt stress and GA3 treatment varied according to the species as also shown by the contrasting response in nitrate and soluble solid accumulation. This showed that GA3 may improve salt tolerance by activating different adaptation systems. The supplementation of 10−6 M GA3 through the nutrient solution is recommended for hydroponic cultivation of leaf lettuce and rocket when difficulties in finding water of good quality leads to the compelling necessity of identifying sustainable ways to use saline water (up to 20 mM NaCl), as it can limit their negative effect on crop yield and quality.
Author Contributions
Conceptualization, F.V., A.M. (Alessandra Moncada) and A.M. (Alessandro Miceli); Data curation, F.V., A.M. (Alessandra Moncada) and A.M. (Alessandro Miceli); Formal analysis, A.M. (Alessandra Moncada) and A.M. (Alessandro Miceli); Investigation, F.V., A.M. (Alessandra Moncada) and A.M. (Alessandro Miceli); Methodology, F.V. and A.M. (Alessandro Miceli); Supervision, F.V. and A.M. (Alessandro Miceli); Validation, F.V., A.M. (Alessandra Moncada) and A.M. (Alessandro Miceli); Writing—original draft, A.M. (Alessandro Miceli); Writing—review & editing, F.V., A.M. (Alessandra Moncada) and A.M. (Alessandro Miceli). All authors have read and agreed to the published version of the manuscript.
Funding
This research received no external funding.
Conflicts of Interest
The authors declare no conflict of interest.
References
- Shahbaz, M.; Ashraf, M. Improving Salinity Tolerance in Cereals. Crit. Rev. Plant Sci. 2013, 32, 237–249. [Google Scholar] [CrossRef]
- Yamaguchi, T.; Blumwald, E. Developing salt-tolerant crop plants: Challenges and opportunities. Trends Plant Sci. 2005, 10, 615–620. [Google Scholar] [CrossRef]
- Sudhir, P.; Murthy, S.D.S. Effects of salt stress on basic processes of photosynthesis. Photosynthetica 2004, 42, 481–486. [Google Scholar] [CrossRef]
- Marschner, H. Marschner’s Mineral Nutrition of Higher Plants; Academic Press: Cambridge, MA, USA, 2011; ISBN 0123849063. [Google Scholar]
- Iturbe-Ormaetxe, I.; Escuredo, P.R.; Arrese-Igor, C.; Becana, M. Oxidative damage in pea plants exposed to water deficit or paraquat. Plant Physiol. 1998, 116, 173–181. [Google Scholar] [CrossRef] [Green Version]
- Gupta, N.K.; Meena, S.K.; Gupta, S.; Khandelwal, S.K. Gas exchange, membrane permeability, and ion uptake in two species of Indian jujube differing in salt tolerance. Photosynthetica 2002, 40, 535–539. [Google Scholar] [CrossRef]
- Khan, N.A. NaCl-inhibited chlorophyll synthesis and associated changes in ethylene evolution and antioxidative enzyme activities in wheat. Biol. Plant. 2003, 47, 437–440. [Google Scholar] [CrossRef]
- Munns, R. Comparative physiology of salt and water stress. Plant. Cell Environ. 2002, 25, 239–250. [Google Scholar] [CrossRef] [PubMed]
- Mariani, L.; Ferrante, A. Agronomic management for enhancing plant tolerance to abiotic stresses—Drought, salinity, hypoxia, and lodging. Horticulturae 2017, 3, 52. [Google Scholar] [CrossRef] [Green Version]
- Miceli, A.; Moncada, A.; D’Anna, F. Effect of salt stress in lettuce cultivation. Acta Hortic. 2003, 609, 371–375. [Google Scholar] [CrossRef]
- Moncada, A.; Miceli, A.; D’Anna, F. Evaluation of strawberry cultivars in soilless cultivation in sicily. Acta Hortic. 2008, 801, 1121–1127. [Google Scholar] [CrossRef]
- Settanni, L.; Miceli, A.; Francesca, N.; Cruciata, M.; Moschetti, G. Microbiological investigation of Raphanus sativus L. grown hydroponically in nutrient solutions contaminated with spoilage and pathogenic bacteria. Int. J. Food Microbiol. 2013, 160, 344–352. [Google Scholar] [CrossRef] [PubMed] [Green Version]
- Moncada, A.; Miceli, A.; Sabatino, L.; Iapichino, G.; D’Anna, F.; Vetrano, F. Effect of molybdenum rate on yield and quality of lettuce, escarole, and curly endive grown in a floating system. Agronomy 2018, 8, 171. [Google Scholar] [CrossRef] [Green Version]
- D’Anna, F.; Miceli, A.; Vetrano, F. First results of floating system cultivation of Eruca sativa L. Acta Hortic. 2003, 609, 361–364. [Google Scholar] [CrossRef]
- Miceli, A.; Moncada, A.; Vetrano, F.; D’Anna, F. First results on yield and quality response of Basil (Ocimum basilicum L.) grown in a floating system. Acta Hortic. 2003, 609, 377–381. [Google Scholar] [CrossRef]
- DAJIC, Z. Salt stress. In Physiology and Molecular Biology of Stress Tolerance in Plants; Springer: Berlin/Heidelberg, Germany, 2006; pp. 41–99. [Google Scholar]
- Munns, R.; Tester, M. Mechanisms of salinity tolerance. Annu. Rev. Plant Biol. 2008, 59, 651–681. [Google Scholar] [CrossRef] [Green Version]
- Maggio, A.; Barbieri, G.; Raimondi, G.; de Pascale, S. Contrasting Effects of GA 3 Treatments on Tomato Plants Exposed to Increasing Salinity. J. Plant Growth Regul. 2010, 29, 63–72. [Google Scholar] [CrossRef]
- Wang, Y.; Mopper, S.; Hasenstein, K.H. Effects of salinity on endogenous ABA, IAA, JA, and SA in Iris hexagona. J. Chem. Ecol. 2001, 27, 327–342. [Google Scholar] [CrossRef]
- Egamberdieva, D. Alleviation of salt stress by plant growth regulators and IAA producing bacteria in wheat. Acta Physiol. Plant. 2009, 31, 861–864. [Google Scholar] [CrossRef]
- Khan, M.A.; Gul, B.; Weber, D.J. Action of plant growth regulators and salinity on seed germination of Ceratoides lanata. Can. J. Bot. 2004, 82, 37–42. [Google Scholar] [CrossRef]
- Afzal, I.; Basra, S.A.; Iqbal, A. The effects of seed soaking with plant growth regulators on seedling vigor of wheat under salinity stress. J. Stress Physiol. Biochem. 2005, 1, 6–14. [Google Scholar]
- Hooley, R. Gibberellins: Perception, transduction and responses. In Signals and Signal Transduction Pathways in Plants; Springer: Berlin/Heidelberg, Germany, 1994; pp. 293–319. [Google Scholar]
- Miceli, A.; Moncada, A.; Sabatino, L.; Vetrano, F. Effect of Gibberellic Acid on Growth, Yield, and Quality of Leaf Lettuce and Rocket Grown in a Floating System. Agronomy 2019, 9, 382. [Google Scholar] [CrossRef] [Green Version]
- Sun, T. Gibberellin signal transduction in stem elongation & leaf growth. In Plant Hormones; Springer: Berlin/Heidelberg, Germany, 2010; pp. 308–328. [Google Scholar]
- KHAN, M.M.A.; Gautam, C.; Mohammad, F.; Siddiqui, M.H.; Naeem, M.; Khan, M.N. Effect of gibberellic acid spray on performance of tomato. Turk. J. Biol. 2006, 30, 11–16. [Google Scholar]
- Khan, N.A.; Ansari, H.R. Effect of gibberellic acid spray during ontogeny of mustard on growth, nutrient uptake and yield characteristics. J. Agron. Crop Sci. 1998, 181, 61–63. [Google Scholar] [CrossRef]
- Pal, P.; Yadav, K.; Kumar, K.; Singh, N. Effect of gibberellic acid and potassium foliar sprays on productivity and physiological and biochemical parameters of parthenocarpic cucumber cv.‘Seven Star F1′. J. Hortic. Res. 2016, 24, 93–100. [Google Scholar] [CrossRef] [Green Version]
- Shah, S.H. Effects of Salt Stress on Mustard As Affected By Gibberellic Acid Application. Gen. Appl. Plant Physiol. 2007, 33, 97–106. [Google Scholar]
- Gelmesa, D.; Abebie, B.; Desalegn, L. Effects of gibberellic acid and 2,4-dichlorophenoxyacetic acid spray on fruit yield and quality of tomato (Lycopersicon esculentum Mill.). J. Plant Breed. Crop Sci. 2010, 2, 316–324. [Google Scholar]
- Khan, N.A.; Mir, R.; Khan, M.; Javid, S. Effects of gibberellic acid spray on nitrogen yield efficiency of mustard grown with different nitrogen levels. Plant Growth Regul. 2002, 38, 243–247. [Google Scholar] [CrossRef]
- Miceli, A.; Vetrano, F.; Sabatino, L.; D’Anna, F.; Moncada, A. Influence of preharvest gibberellic acid treatments on postharvest quality of minimally processed leaf lettuce and rocket. Horticulturae 2019, 5, 63. [Google Scholar] [CrossRef] [Green Version]
- Sonneveld, C.; Voogt, W. Plant Nutrition of Greenhouse Crops; Springer: Berlin/Heidelberg, Germany, 2009; ISBN 9789048125326. [Google Scholar]
- Goto, E.; Both, A.-J.; Albright, L.D.; Langhans, R.W.; Leed, A.R. Effect of dissolved oxygen concentration on lettuce growth in floating hydroponics. In Proceedings of the International Symposium on Plant Production in Closed Ecosystems, Narita, Japan, 26–29 August 1996; pp. 205–210. [Google Scholar]
- Fageria, N.K.; Baligar, V.C.; Li, Y.C. The role of nutrient efficient plants in improving crop yields in the twenty first century. J. Plant Nutr. 2008, 31, 1121–1157. [Google Scholar] [CrossRef]
- McGuire, R.G. Reporting of objective color measurements. HortScience 1992, 27, 1254–1255. [Google Scholar] [CrossRef] [Green Version]
- Magwaza, L.S.; Opara, U.L. Analytical methods for determination of sugars and sweetness of horticultural products—A review. Sci. Hortic. 2015, 184, 179–192. [Google Scholar] [CrossRef]
- Sadler, G.D.; Murphy, P.A. pH and Titratable Acidity. In Food Analysis; Springer: Boston, MA, USA, 2010; pp. 219–238. [Google Scholar]
- Rodrigo, M.C.; Ramos, C. Nitrate sap analysis as a tool to assess nitrogen nutrition in artichoke. In Proceedings of the VI International Symposium on Artichoke, Cardoon and Their Wild Relatives, Lorca, Spain, 28–31 March 2006; pp. 251–256. [Google Scholar]
- Miceli, A.; Miceli, C. Effect of nitrogen fertilization on the quality of swiss chard at harvest and during storage as minimally processed produce. J. Food Qual. 2014, 37, 125–134. [Google Scholar] [CrossRef]
- Caracciolo, G.; D’Anna, E.; Moncada, A.; D’Anna, F. Evaluation of the quality and antioxidant capacity of woodland strawberry biotypes in Sicily. J. Food Agric. Environ. 2013, 11, 522–525. [Google Scholar]
- Tuna, A.L.; Kaya, C.; Dikilitas, M.; Higgs, D. The combined effects of gibberellic acid and salinity on some antioxidant enzyme activities, plant growth parameters and nutritional status in maize plants. Environ. Exp. Bot. 2008, 62, 1–9. [Google Scholar] [CrossRef]
- Munns, R.; James, R.A.; Läuchli, A. Approaches to increasing the salt tolerance of wheat and other cereals. J. Exp. Bot. 2006, 57, 1025–1043. [Google Scholar] [CrossRef] [Green Version]
- Khan, N.A. Effect of gibberellic acid on carbonic anhydrase, photosynthesis, growth and yield of mustard. Biol. Plant. 1996, 38, 145. [Google Scholar] [CrossRef]
- Yuan, L.; Xu, D.-Q. Stimulation effect of gibberellic acid short-term treatment on leaf photosynthesis related to the increase in Rubisco content in broad bean and soybean. Photosynth. Res. 2001, 68, 39–47. [Google Scholar] [CrossRef]
- Shahbaz, M.; Ashraf, M.; Al-Qurainy, F.; Harris, P.J.C. Salt Tolerance in Selected Vegetable Crops. Crit. Rev. Plant Sci. 2012, 31, 303–320. [Google Scholar] [CrossRef]
- Shannon, M.C.; Grieve, C.M. Tolerance of vegetable crops to salinity. Sci. Hortic. 1998, 78, 5–38. [Google Scholar] [CrossRef]
- Grieve, C.M.; Grattan, S.R.; Maas, E.V. Plant salt tolerance. Agric. Salin. Assess. Manag. 2012, 2, 405–459. [Google Scholar]
- Shalhevet, J. Plants under salt and water stress. In Plant Adaptation to Environmental Stress; Fowden, L., Mansfield, T., Stoddart, J., Eds.; Chapman and Hall: London, UK, 1993; p. 133. [Google Scholar]
- Srivastava, J.P.; Gupta, S.C.; Lal, P.; Muralia, R.N.; Kumar, A. Effect of Salt Stress on Physiological and Biochemical Parameters of Wheat. Annu. Arid Zone 1988, 27, 197–204. [Google Scholar]
- Javid, M.G.; Sorooshzadeh, A.; Moradi, F.; Ali, S.; Modarres, M. Review article The role of phytohormones in alleviating salt stress in crop plants. Annu. Rev. Plant Biol. 2011, 5, 726–734. [Google Scholar]
- Shah, S.H.; Ahmad, I. Effect of gibberellic acid spray on growth, nutrient uptake and yield attributes during various growth stages of black cumin (Nigella sativa L.). Asian J. Plant Sci. 2006, 5, 881–884. [Google Scholar]
- Aldesuquy, H.S.; Ibrahim, A.H. Interactive effect of seawater and growth bioregulators on water relations, abscisic acid concentration and yield of wheat plants. J. Agron. Crop Sci. 2001, 187, 185–193. [Google Scholar] [CrossRef]
- Evins, W.H.; Varner, J.E. Hormonal control of polyribosome formation in barley aleurone layers. Plant Physiol. 1972, 49, 348–352. [Google Scholar] [CrossRef] [Green Version]
- Broughton, W.J.; McComb, A.J. Changes in the pattern of enzyme development in gibberellin-treated pea internodes. Ann. Bot. 1971, 35, 213–228. [Google Scholar] [CrossRef]
- Johri, M.; Varner, J.E. Enhancement of RNA synthesis in isolated pea nuclei by gibberellic acid. Proc. Natl. Acad. Sci. USA 1968, 59, 269. [Google Scholar] [CrossRef] [Green Version]
- ROTH-BEJERANO, N.; Lips, S.H. Hormonal regulation of nitrate reductase activity in leaves. New Phytol. 1970, 69, 165–169. [Google Scholar] [CrossRef]
- Al-Wakeel, S.A.M.; Dadoura, S.S.; Hamed, A.A. Interactive effects of water stress and gibberellic acid on mineral composition of fenugreek plant. Egypt. J. Rhysiol. Sci. 1994, 18, 269–282. [Google Scholar]
- Ansari, H. Effect of Some Phytohormones and NPK on Growth and Metabolism of Mustard. Ph.D. Thesis, Aligarh Muslim University, Aligarh, India, 1996. [Google Scholar]
- Daie, J.; Watts, M.; Aloni, B.; Wyse, R.E. In vitro and in vivo modification of sugar transport and translocation in celery by phytohormones. Plant Sci. 1986, 46, 35–41. [Google Scholar] [CrossRef]
- Estruch, J.J.; Peretó, J.G.; Vercher, Y.; Beltrán, J.P. Sucrose loading in isolated veins of Pisum sativum: Regulation by abscisic acid, gibberellic acid, and cell turgor. Plant Physiol. 1989, 91, 259–265. [Google Scholar] [CrossRef] [PubMed] [Green Version]
- Mulligan, D.R.; Patrick, J.W. Gibberellic-acid-promoted transport of assimilates in stems of Phaseolus vulgaris L. Planta 1979, 145, 233–238. [Google Scholar] [CrossRef] [PubMed]
- Wood, A.; Paleg, L.G. The influence of gibberellic acid on the permeability of model membrane systems. Plant Physiol. 1972, 50, 103–108. [Google Scholar] [CrossRef] [Green Version]
- Wood, A.; Paleg, L.G. Alteration of liposomal membrane fluidity by gibberellic acid. Funct. Plant Biol. 1974, 1, 31–40. [Google Scholar] [CrossRef]
- Hniličková, H.; Hnilička, F.; Martinkova, J.; Kraus, K. Effects of salt stress on water status, photosynthesis and chlorophyll fluorescence of rocket. Plant Soil Environ. 2017, 63, 362–367. [Google Scholar]
- Urlić, B.; Dumičić, G.; Romić, M.; Ban, S.G. The effect of N and NaCl on growth, yield, and nitrate content of salad rocket (Eruca sativa Mill.). J. Plant Nutr. 2017, 40, 2611–2618. [Google Scholar] [CrossRef]
- Kim, H.J.; Fonseca, J.M.; Choi, J.H.; Kubota, C.; Dae, Y.K. Salt in irrigation water affects the nutritional and visual properties of romaine lettuce (Lactuca sativa L.). J. Agric. Food Chem. 2008, 56, 3772–3776. [Google Scholar] [CrossRef]
- Al-Maskri, A.; Al-Kharusi, L.; Al-Miqbali, H.; Khan, M.M. Effects of salinity stress on growth of lettuce (Lactuca sativa) under closed-recycle nutrient film technique. Int. J. Agric. Biol. 2010, 12, 377–380. [Google Scholar]
- Zhang, J.; Jia, W.; Yang, J.; Ismail, A.M. Role of ABA in integrating plant responses to drought and salt stresses. Field Crops Res. 2006, 97, 111–119. [Google Scholar] [CrossRef]
- Gonai, T.; Kawahara, S.; Tougou, M.; Satoh, S.; Hashiba, T.; Hirai, N.; Kawaide, H.; Kamiya, Y.; Yoshioka, T. Abscisic acid in the thermoinhibition of lettuce seed germination and enhancement of its catabolism by gibberellin. J. Exp. Bot. 2004, 55, 111–118. [Google Scholar] [CrossRef]
- Khan, N.A. Variation in carbonic anhydrase activity and its relationship with photosynthesis and dry mass of mustard. Photosynthetica 1994, 30, 317. [Google Scholar]
- Stępień, P.; Kłbus, G. Water relations and photosynthesis in Cucumis sativus L. leaves under salt stress. Biol. Plant. 2006, 50, 610. [Google Scholar] [CrossRef]
- Downton, W.J.S.; Grant, W.J.R.; Robinson, S.P. Photosynthetic and stomatal responses of spinach leaves to salt stress. Plant Physiol. 1985, 78, 85–88. [Google Scholar] [CrossRef] [PubMed]
- Nawaz, K.; Hussain, K.; Majeed, A.; Khan, F.; Afghan, S.; Ali, K. Fatality of salt stress to plants: Morphological, physiological and biochemical aspects. Afr. J. Biotechnol. 2010, 9, 5475–5480. [Google Scholar]
- Delfine, S.; Alvino, A.; Zacchini, M.; Loreto, F. Consequences of salt stress on conductance to CO2 diffusion, Rubisco characteristics and anatomy of spinach leaves. Funct. Plant Biol. 1998, 25, 395–402. [Google Scholar] [CrossRef]
- Lacerda, C.F.; Assis Júnior, J.O.; Lemos Filho, L.C.A.; de Oliveira, T.S.; Guimarães, F.V.A.; Gomes-Filho, E.; Prisco, J.T.; Bezerra, M.A. Morpho-physiological responses of cowpea leaves to salt stress. Braz. J. Plant Physiol. 2006, 18, 455–465. [Google Scholar] [CrossRef]
- Ashraf, M.; Harris, P.J.C. Potential biochemical indicators of salinity tolerance in plants. Plant Sci. 2004, 166, 3–16. [Google Scholar] [CrossRef]
- Mizrahi, Y.; Pasternak, D. Effect of salinity on quality of various agricultural crops. Plant Soil 1985, 89, 301–307. [Google Scholar] [CrossRef]
- Parida, A.K.; Das, A.B. Salt tolerance and salinity effects on plants: A review. Ecotoxicol. Environ. Saf. 2005, 60, 324–349. [Google Scholar] [CrossRef]
- Mittova, V.; Tal, M.; Volokita, M.; Guy, M. Salt stress induces up-regulation of an efficient chloroplast antioxidant system in the salt-tolerant wild tomato species Lycopersicon pennellii but not in the cultivated species. Physiol. Plant. 2002, 115, 393–400. [Google Scholar] [CrossRef]
- Parvaiz, A.; Satyawati, S. Salt stress and phyto-biochemical responses of plants—A review. Plant Soil Environ. 2008, 54, 89. [Google Scholar] [CrossRef]
- Lee, S.K.; Kader, A.A. Preharvest and postharvest factors influencing vitamin C content of horticultural crops. Postharvest Biol. Technol. 2000, 20, 207–220. [Google Scholar] [CrossRef] [Green Version]
- Stefanelli, D.; Goodwin, I.; Jones, R. Minimal nitrogen and water use in horticulture: Effects on quality and content of selected nutrients. Food Res. Int. 2010, 43, 1833–1843. [Google Scholar] [CrossRef]
- Cova, A.M.W.; De Freitas, F.T.O.; Viana, P.C.; Rafael, M.R.S.; De Azevedo Neto, A.D.; Soares, T.M. Content of inorganic solutes in lettuce grown with brackish water in different hydroponic systems. Rev. Bras. Eng. Agric. Ambient. 2017, 21, 150–155. [Google Scholar] [CrossRef]
- Pérez-López, U.; Miranda-Apodaca, J.; Lacuesta, M.; Mena-Petite, A.; Muñoz-Rueda, A. Growth and nutritional quality improvement in two differently pigmented lettuce cultivars grown under elevated CO2 and/or salinity. Sci. Hortic. 2015, 195, 56–66. [Google Scholar] [CrossRef]
- Miceli, A.; Gaglio, R.; Francesca, N.; Ciminata, A.; Moschetti, G.; Settanni, L. Evolution of shelf life parameters of ready-to-eat escarole (Cichorium endivia var. latifolium) subjected to different cutting operations. Sci. Hortic. 2019, 247, 175–183. [Google Scholar] [CrossRef]
- Alfonzo, A.; Gaglio, R.; Miceli, A.; Francesca, N.; Di Gerlando, R.; Moschetti, G.; Settanni, L. Shelf life evaluation of fresh-cut red chicory subjected to different minimal processes. Food Microbiol. 2018, 73, 298–304. [Google Scholar] [CrossRef]
- Miceli, C.; Moncada, A.; Vetrano, F.; Iapichino, G.; D’anna, F.; Miceli, A. Effect of agronomic practices on Yield and Quality of Borage at Harvest and during Storage as Minimally Processed Produce. Agronomy 2020, 10, 242. [Google Scholar] [CrossRef] [Green Version]
- Union, E. Commission Regulation (EC) No. 1258/2011 of 2 December 2011 amending Regulation (EC) No. 1881/2006 as regards maximum levels for nitrates in foodstuffs. Off. J. Eur. Union 2011, 320, 15–17. [Google Scholar]
- Gouia, H.; Ghorbal, M.H.; Touraine, B. Effects of NaCl on flows of N and mineral ions and on NO3- reduction rate within whole plants of salt-sensitive bean and salt-tolerant cotton. Plant Physiol. 1994, 105, 1409–1418. [Google Scholar] [CrossRef] [Green Version]
- Zhang, M.; Liu, M.; Zhang, Y.; Ji, Y.; Zhao, M.; Wu, Z. Effect of different plant growth regulator added in nutrient solution on growth and development of summer tomato seedling. North Hortic 2017, 6, 8–13. [Google Scholar]
- Chanda, S.V.; Sood, C.R.; Reddy, V.S.; Singh, Y.D. Influence of plant growth regulators on some enzymes of nitrogen assimilation in mustard seedlings. J. Plant Nutr. 1998, 21, 1765–1777. [Google Scholar] [CrossRef]
- Cleland, R.E. Chapter 1 Introduction: Nature, occurrence and functioning of plant hormones. In Biochemistry and Molecular Biology of Plant Hormones; Hooykaas, P.J.J., Hall, M.A., Libbenga, K.R., Eds.; Elsevier: Amsterdam, The Netherlands, 1999; Volume 33, pp. 3–22. [Google Scholar]
Figure 1.
Graphical representation of the hydroponic floating system consisting of drilled polystyrene panels floating on mineral nutrient solutions with different combinations of gibberellic acid (GA3) and NaCl levels. 1 Drilled polystyrene panels (300 plants m−2) floating on mineral nutrient solution (MNS); Tanks containing 75 L of MNS added with increasing concentrations of NaCl and 2 0 M GA3 or 3 10−6 M GA3.

Figure 2.
Total, shoot, and root dry biomass of leaf lettuce plants grown in nutrient solutions containing different levels of NaCl and gibberellic acid (10−6 M GA3) (bars of the same color with different letters are significantly different at p < 0.05 according to the LSD test).
Figure 2.
Total, shoot, and root dry biomass of leaf lettuce plants grown in nutrient solutions containing different levels of NaCl and gibberellic acid (10−6 M GA3) (bars of the same color with different letters are significantly different at p < 0.05 according to the LSD test).

Figure 3.
Total, shoot, and root dry biomass of rocket plants grown in nutrient solutions containing different levels of NaCl and gibberellic acid (10−6 M GA3) (bars of the same color with different letters are significantly different at p < 0.05 according to the LSD test).
Figure 3.
Total, shoot, and root dry biomass of rocket plants grown in nutrient solutions containing different levels of NaCl and gibberellic acid (10−6 M GA3) (bars of the same color with different letters are significantly different at p < 0.05 according to the LSD test).

Figure 4.
Plot of (a) loadings (morphophysiological and quality characteristics of lettuce and rocket plants) and (b) scores (trials) formed by the two principal components from the Principal Component Analysis (PCA). L: leaf lettuce plants; R: rocket plants; 0 NaCl, 10 NaCl, 20 NaCl: mM of NaCl in the nutrient solution; -GA3: nutrient solutions not supplemented with gibberellic acid; +GA3: nutrient solutions not supplemented with 10−6 M gibberellic acid.


Table 1.
Morphological parameters of leaf lettuce plants grown in nutrient solutions containing different levels of NaCl and GA3.
Table 1.
Morphological parameters of leaf lettuce plants grown in nutrient solutions containing different levels of NaCl and GA3.
| Source of Variance | Plant Height (cm) | Plant Fresh Weight | Plant Dry Weight | Dry Matter (%) | |||||||||||||||||
|---|---|---|---|---|---|---|---|---|---|---|---|---|---|---|---|---|---|---|---|---|---|
| Whole Plant (g) | Shoot (g) | Roots (g) | S/R Ratio | Whole Plant (g) | Shoot (g) | Roots (g) | S/R Ratio | ||||||||||||||
| NaCl (mM) | |||||||||||||||||||||
| 0 | z 26.8 | a | 13.5 | a | 12.2 | a | 1.3 | a | 9.3 | 0.51 | 0.44 | 0.07 | 6.1 | 3.8 | |||||||
| 10 | 25.2 | b | 11.9 | b | 10.8 | b | 1.1 | b | 10.0 | 0.47 | 0.41 | 0.06 | 7.1 | 4.0 | |||||||
| 20 | 25.4 | b | 11.3 | b | 10.3 | b | 1.0 | b | 10.4 | 0.48 | 0.41 | 0.07 | 6.2 | 4.2 | |||||||
| GA3 (M) | |||||||||||||||||||||
| 0 | 24.6 | b | 10.6 | b | 9.6 | b | 1.0 | b | 9.2 | b | 0.42 | 0.36 | 0.06 | 6.0 | b | 4.0 | |||||
| 10−6 | 26.9 | a | 13.8 | a | 12.6 | a | 1.2 | a | 10.6 | a | 0.56 | 0.49 | 0.07 | 7.0 | a | 4.0 | |||||
| NaCl × GA3 | |||||||||||||||||||||
| 0 | 0 | 26.2 | 11.7 | 10.5 | 1.2 | 8.9 | 0.42 | c | 0.35 | c | 0.06 | b | 5.8 | 3.6 | b | ||||||
| 10−6 | 27.4 | 15.2 | 13.8 | 1.4 | 9.8 | 0.60 | a | 0.53 | a | 0.08 | a | 6.5 | 4.0 | ab | |||||||
| 10 | 0 | 23.6 | 10.3 | 9.3 | 1.0 | 9.0 | 0.39 | c | 0.34 | c | 0.05 | b | 6.6 | 3.8 | b | ||||||
| 10−6 | 26.8 | 13.4 | 12.3 | 1.1 | 10.9 | 0.56 | ab | 0.49 | ab | 0.07 | ab | 7.6 | 4.1 | ab | |||||||
| 20 | 0 | 24.1 | 9.8 | 8.9 | 0.9 | 9.8 | 0.45 | bc | 0.38 | bc | 0.07 | ab | 5.5 | 4.5 | a | ||||||
| 10−6 | 26.6 | 12.8 | 11.7 | 1.1 | 11.1 | 0.51 | b | 0.44 | b | 0.07 | b | 6.9 | 4.0 | ab | |||||||
| Significance x | |||||||||||||||||||||
| NaCl | ** | ** | ** | *** | ns | ns | ns | * | ns | ** | |||||||||||
| GA3 | *** | *** | *** | ** | * | *** | *** | ** | ** | ns | |||||||||||
| NaCl × GA3 | ns | ns | ns | ns | ns | * | * | * | ns | ** | |||||||||||
z Each value is the mean of 4 replicated samples of 20 plants each. For each factor, values in a column followed by the same letter are not significantly different, according to the LSD test. x Significance: ns = not significant; * significant at p < 0.05; ** significant at p < 0.01; *** significant at p < 0.001.
Table 2.
Yield parameters of leaf lettuce plants grown in nutrient solutions containing different levels of NaCl and GA3.
Table 2.
Yield parameters of leaf lettuce plants grown in nutrient solutions containing different levels of NaCl and GA3.
| Source of Variance | Crop Yield (kg m2) | Minimal Processing Yield (%) | WUE (g DW L−1 H2O) | NUE (g DW g−1 N) | |||||
|---|---|---|---|---|---|---|---|---|---|
| NaCl (mM) | |||||||||
| 0 | z 3.6 | a | 91.0 | a | 4.5 | 14.4 | |||
| 10 | 3.2 | b | 90.6 | a | 4.6 | 15.0 | |||
| 20 | 3.1 | b | 89.1 | b | 4.3 | 13.7 | |||
| GA3 (M) | |||||||||
| 0 | 2.9 | b | 89.2 | b | 3.9 | b | 12.3 | b | |
| 10−6 | 3.8 | a | 91.3 | a | 5.1 | a | 16.5 | a | |
| NaCl × GA3 | |||||||||
| 0 | 0 | 3.2 | 90.0 | 3.9 | 12.2 | ||||
| 10−6 | 4.1 | 92.0 | 5.2 | 16.7 | |||||
| 10 | 0 | 2.8 | 90.1 | 4.0 | 12.7 | ||||
| 10−6 | 3.7 | 91.1 | 5.3 | 17.3 | |||||
| 20 | 0 | 2.7 | 87.6 | 3.8 | 11.9 | ||||
| 10−6 | 3.5 | 90.7 | 4.8 | 15.5 | |||||
| Significance x | |||||||||
| NaCl | ** | ** | ns | ns | |||||
| GA3 | *** | *** | *** | *** | |||||
| NaCl × GA3 | ns | ns | ns | ns | |||||
z Each value is the mean of 4 replicated tubs with 150 plants each. For each factor, values in a column followed by the same letter are not significantly different, according to the LSD test. x Significance: ns = not significant; ** significant at p < 0.01; *** significant at p < 0.001.
Table 3.
Leaf characteristics of leaf lettuce plants grown in nutrient solutions containing different levels of NaCl and GA3.
Table 3.
Leaf characteristics of leaf lettuce plants grown in nutrient solutions containing different levels of NaCl and GA3.
| Source of Variance | Number of Leaves | Leaf Width (cm) | Leaf Area (cm2 Plant−1) | Leaf Area (cm2 Leaf−1) | SLA (cm2 g DW−1) | Stomatal Conductance (mmol m2 s−1) | |||||||
|---|---|---|---|---|---|---|---|---|---|---|---|---|---|
| NaCl (mM) | |||||||||||||
| 0 | z 9.3 | a | 11.7 | 721.5 | a | 78.0 | a | 703.2 | a | 567.5 | a | ||
| 10 | 8.7 | ab | 11.1 | 574.8 | b | 66.2 | b | 645.5 | b | 511.8 | b | ||
| 20 | 8.4 | b | 11.3 | 548.9 | b | 65.1 | b | 637.7 | b | 485.6 | b | ||
| GA3 (M) | |||||||||||||
| 0 | 8.5 | b | 11.0 | b | 575.4 | b | 67.9 | b | 645.7 | b | 483.8 | b | |
| 10−6 | 9.1 | a | 11.8 | a | 654.8 | a | 71.6 | a | 678.5 | a | 559.5 | a | |
| NaCl × GA3 | |||||||||||||
| 0 | 0 | 8.9 | 11.4 | 680.4 | 76.7 | 683.7 | 497.9 | ||||||
| 10−6 | 9.6 | 12.0 | 762.6 | 79.3 | 722.8 | 637.1 | |||||||
| 10 | 0 | 8.4 | 10.7 | 527.9 | 63.2 | 624.6 | 487.9 | ||||||
| 10−6 | 9.0 | 11.6 | 621.8 | 69.1 | 666.3 | 535.8 | |||||||
| 20 | 0 | 8.1 | 10.9 | 517.8 | 63.9 | 628.9 | 465.6 | ||||||
| 10−6 | 8.8 | 11.8 | 579.9 | 66.3 | 646.5 | 505.6 | |||||||
| Significance x | |||||||||||||
| NaCl | * | ns | *** | *** | *** | ** | |||||||
| GA3 | * | ** | *** | ** | * | *** | |||||||
| NaCl × GA3 | ns | ns | ns | ns | ns | ns | |||||||
z Each value is the mean of 4 replicated samples of 20 plants each. For each factor, values in a column followed by the same letter are not significantly different, according to the LSD test. x Significance: ns = not significant; * significant at p < 0.05; ** significant at p < 0.01; *** significant at p < 0.001.
Table 4.
Leaf color and chemical characteristics of leaf lettuce plants grown in nutrient solutions containing different levels of NaCl and GA3.
Table 4.
Leaf color and chemical characteristics of leaf lettuce plants grown in nutrient solutions containing different levels of NaCl and GA3.
| Source of Variance | L* | Chroma | Hue° | SSC (°Brix) | TA y (mg 100 g−1 FW) | Ascorbic Acid (mg 100 g−1 FW) | N-NO3− (mg kg−1 FW) | ||||||||
|---|---|---|---|---|---|---|---|---|---|---|---|---|---|---|---|
| NaCl (mM) | |||||||||||||||
| 0 | z 54.8 | a | 44.2 | 119.2 | c | 2.8 | b | 23.7 | 49.3 | a | 1922.5 | ||||
| 10 | 53.4 | a | 44.0 | 119.8 | b | 3.0 | ab | 22.6 | 47.8 | b | 1925.0 | ||||
| 20 | 51.1 | b | 43.5 | 120.6 | a | 3.4 | a | 22.2 | 36.5 | b | 2042.5 | ||||
| GA3 (M) | |||||||||||||||
| 0 | 53.5 | 43.8 | 119.6 | b | 3.1 | 22.8 | 49.7 | a | 1678.3 | b | |||||
| 10−6 | 52.7 | 44.0 | 120.1 | a | 2.9 | 22.9 | 39.3 | b | 2248.3 | a | |||||
| NaCl × GA3 | |||||||||||||||
| 0 | 0 | 55.7 | 43.4 | b | 118.8 | 2.8 | 22.6 | ab | 50.5 | ab | 1650.0 | ||||
| 10−6 | 53.8 | 45.0 | a | 119.6 | 2.7 | 24.8 | a | 48.0 | ab | 2195.0 | |||||
| 10 | 0 | 53.4 | 44.1 | ab | 119.7 | 3.1 | 20.9 | b | 56.0 | a | 1695.0 | ||||
| 10−6 | 53.5 | 43.9 | ab | 120.0 | 2.8 | 24.3 | ab | 39.5 | bc | 2155.0 | |||||
| 20 | 0 | 51.5 | 43.9 | ab | 120.5 | 3.5 | 24.8 | a | 42.5 | b | 1690.0 | ||||
| 10−6 | 50.8 | 43.1 | b | 120.7 | 3.3 | 19.6 | b | 30.5 | c | 2395.0 | |||||
| Significance x | |||||||||||||||
| NaCl | *** | ns | *** | * | ns | *** | ns | ||||||||
| GA3 | ns | ns | * | ns | ns | *** | *** | ||||||||
| NaCl × GA3 | ns | * | ns | ns | *** | * | ns | ||||||||
z Each value is the mean of 4 replicated samples of 20 plants each. For each factor, values in a column followed by the same letter are not significantly different, according to the LSD test. x Significance: ns = not significant; * significant at p < 0.05; *** significant at p < 0.001; y Titratable acidity expressed as citric acid.
Table 5.
Morphological parameters of rocket plants grown in nutrient solutions containing different levels of NaCl and GA3.
Table 5.
Morphological parameters of rocket plants grown in nutrient solutions containing different levels of NaCl and GA3.
| Source of Variance | Plant Height (cm) | Plant Fresh Weight | Plant Dry Weight | Dry Matter (%) | |||||||||||||||||
|---|---|---|---|---|---|---|---|---|---|---|---|---|---|---|---|---|---|---|---|---|---|
| Whole Plant (g) | Shoot (g) | Roots (g) | S/R Ratio | Whole Plant (g) | Shoot (g) | Roots (g) | S/R Ratio | ||||||||||||||
| NaCl (mM) | |||||||||||||||||||||
| 0 | z 19.8 | a | 10.3 | a | 10.0 | a | 0.32 | 33.9 | a | 0.54 | 0.52 | 0.03 | 19.2 | a | 5.2 | ||||||
| 10 | 19.1 | ab | 8.6 | ab | 8.2 | ab | 0.33 | 28.9 | ab | 0.46 | 0.43 | 0.03 | 15.5 | ab | 5.3 | ||||||
| 20 | 18.8 | b | 7.8 | b | 7.4 | b | 0.32 | 23.9 | b | 0.43 | 0.40 | 0.03 | 13.3 | b | 5.6 | ||||||
| GA3 (M) | |||||||||||||||||||||
| 0 | 19.0 | 8.1 | b | 7.8 | b | 0.37 | a | 22.9 | b | 0.41 | 0.38 | 0.03 | 16.0 | 5.1 | |||||||
| 10−6 | 19.5 | 9.6 | a | 9.3 | a | 0.27 | b | 34.9 | a | 0.54 | 0.51 | 0.03 | 16.0 | 5.6 | |||||||
| NaCl × GA3 | |||||||||||||||||||||
| 0 | 0 | 20.1 | 9.5 | 9.2 | 0.39 | 24.9 | 0.45 | b | 0.43 | b | 0.02 | 19.3 | 4.7 | b | |||||||
| 10−6 | 19.5 | 11.0 | 10.8 | 0.26 | 42.9 | 0.64 | a | 0.60 | a | 0.03 | 19.1 | 5.8 | a | ||||||||
| 10 | 0 | 18.5 | 7.3 | 6.9 | 0.37 | 22.7 | 0.36 | b | 0.33 | b | 0.03 | 14.4 | 5.0 | b | |||||||
| 10−6 | 19.8 | 9.9 | 9.6 | 0.28 | 35.1 | 0.55 | ab | 0.52 | a | 0.03 | 16.7 | 5.6 | a | ||||||||
| 20 | 0 | 18.5 | 7.6 | 7.2 | 0.35 | 21.1 | 0.42 | b | 0.39 | b | 0.03 | 14.2 | 5.6 | a | |||||||
| 10−6 | 19.2 | 7.9 | 7.7 | 0.29 | 26.8 | 0.45 | b | 0.41 | b | 0.03 | 12.3 | 5.6 | a | ||||||||
| Significance x | |||||||||||||||||||||
| NaCl | * | *** | *** | ns | * | *** | *** | ns | * | * | |||||||||||
| GA3 | ns | *** | *** | ** | *** | *** | *** | ns | ns | *** | |||||||||||
| NaCl × GA3 | ns | ns | ns | ns | ns | ** | ** | ns | ns | * | |||||||||||
z Each value is the mean of 4 replicated samples of 20 plants each. For each factor, values in a column followed by the same letter are not significantly different, according to the LSD test. x Significance: ns = not significant; * significant at p < 0.05; ** significant at p < 0.01; *** significant at p < 0.001.
Table 6.
Yield parameters of rocket plants grown in nutrient solutions containing different levels of NaCl and GA3.
Table 6.
Yield parameters of rocket plants grown in nutrient solutions containing different levels of NaCl and GA3.
| Source of Variance | Crop Yield (kg m2) | Minimal Processing Yield (%) | WUE (g DW L−1 H2O) | NUE (g DW g−1 N) | |||||
|---|---|---|---|---|---|---|---|---|---|
| NaCl (mM) | |||||||||
| 0 | z 3.0 | a | 93.7 | 2.2 | 7.6 | ||||
| 10 | 2.5 | b | 93.4 | 1.9 | 6.7 | ||||
| 20 | 2.2 | b | 90.8 | 2.2 | 7.4 | ||||
| GA3 (M) | |||||||||
| 0 | 2.3 | b | 91.5 | 1.9 | 6.6 | ||||
| 10−6 | 2.8 | a | 93.7 | 2.3 | 8.0 | ||||
| NaCl × GA3 | |||||||||
| 0 | 0 | 2.7 | 93.5 | a | 1.7 | b | 5.9 | c | |
| 10−6 | 3.2 | 93.8 | a | 2.6 | a | 9.3 | a | ||
| 10 | 0 | 2.1 | 93.6 | a | 1.9 | b | 6.4 | c | |
| 10−6 | 2.9 | 93.2 | a | 2.0 | b | 7.1 | b | ||
| 20 | 0 | 2.2 | 87.4 | b | 2.1 | b | 7.4 | b | |
| 10−6 | 2.3 | 94.1 | a | 2.2 | b | 7.5 | b | ||
| Significance x | |||||||||
| NaCl | *** | * | ns | ns | |||||
| GA3 | *** | * | *** | *** | |||||
| NaCl × GA3 | ns | ** | ** | ** | |||||
z Each value is the mean of 4 replicated tubs with 150 plants each. For each factor, values in a column followed by the same letter are not significantly different, according to the LSD test. x Significance: ns = not significant; * significant at p < 0.05; ** significant at p < 0.01; *** significant at p < 0.001.
Table 7.
Leaf characteristics of rocket plants grown in nutrient solutions containing different levels of NaCl and GA3.
Table 7.
Leaf characteristics of rocket plants grown in nutrient solutions containing different levels of NaCl and GA3.
| Source of Variance | Number of Leaves | Leaf Width (cm) | Leaf Area (cm2 Plant−1) | Leaf Area (cm2 Leaf−1) | SLA (cm2 g DW−1) | Stomatal Conductance (mmol m2 s−1) | ||||||
|---|---|---|---|---|---|---|---|---|---|---|---|---|
| NaCl (mM) | ||||||||||||
| 0 | z 10.8 | a | 9.1 | a | 206.8 | a | 19.4 | a | 408.1 | 262.9 | ||
| 10 | 10.4 | ab | 8.3 | b | 166.4 | b | 15.9 | b | 395.0 | 233.4 | ||
| 20 | 9.6 | b | 8.3 | b | 155.9 | b | 16.3 | b | 390.7 | 238.2 | ||
| GA3 (M) | ||||||||||||
| 0 | 9.3 | b | 8.6 | 157.2 | b | 16.9 | 411.3 | 234.7 | ||||
| 10−6 | 11.2 | a | 8.6 | 195.5 | a | 17.5 | 384.5 | 254.9 | ||||
| NaCl × GA3 | ||||||||||||
| 0 | 0 | 9.6 | 9.3 | 190.2 | 19.8 | 446.3 | 227.3 | b | ||||
| 10−6 | 12.0 | 9.0 | 223.3 | 19.0 | 369.9 | 298.5 | a | |||||
| 10 | 0 | 9.1 | 8.1 | 131.6 | 14.5 | 402.0 | 233.1 | b | ||||
| 10−6 | 11.7 | 8.6 | 201.2 | 17.4 | 388.1 | 233.6 | b | |||||
| 20 | 0 | 9.2 | 8.4 | 149.8 | 16.4 | 385.7 | 243.8 | ab | ||||
| 10−6 | 10.0 | 8.3 | 162.0 | 16.2 | 395.7 | 232.7 | b | |||||
| Significance x | ||||||||||||
| NaCl | * | * | *** | * | ns | * | ||||||
| GA3 | *** | ns | *** | ns | ns | ns | ||||||
| NaCl × GA3 | ns | ns | ns | ns | ns | * | ||||||
z Each value is the mean of 4 replicated samples of 20 plants each. For each factor, values in a column followed by the same letter are not significantly different, according to the LSD test. x Significance: ns = not significant; * significant at p < 0.05; *** significant at p < 0.001.
Table 8.
Leaf color and chemical characteristics of rocket plants grown in nutrient solutions containing different levels of NaCl and GA3.
Table 8.
Leaf color and chemical characteristics of rocket plants grown in nutrient solutions containing different levels of NaCl and GA3.
| Source of Variance | L* | Chroma | Hue° | SSC (°Brix) | TA y (mg 100 g−1 FW) | Ascorbic Acid (mg 100 g−1 FW) | N-NO3− (mg kg−1 FW) | ||||||||
|---|---|---|---|---|---|---|---|---|---|---|---|---|---|---|---|
| NaCl (mM) | |||||||||||||||
| 0 | z 41.4 | a | 25.7 | a | 128.9 | 5.0 | 51.0 | 162.0 | a | 2235.0 | a | ||||
| 10 | 40.1 | b | 24.0 | b | 128.8 | 5.2 | 50.0 | 138.7 | b | 1925.0 | ab | ||||
| 20 | 40.6 | b | 23.8 | b | 129.1 | 5.2 | 48.5 | 113.2 | b | 1670.0 | b | ||||
| GA3 (M) | |||||||||||||||
| 0 | 41.0 | a | 25.2 | a | 128.8 | 5.5 | a | 50.7 | 127.8 | b | 2400.0 | a | |||
| 10−6 | 40.3 | b | 23.8 | b | 129.1 | 4.7 | b | 49.0 | 148.1 | a | 1486.7 | b | |||
| NaCl × GA3 | |||||||||||||||
| 0 | 0 | 41.5 | 25.7 | 129.2 | ab | 5.4 | 53.4 | a | 150.7 | 2860.0 | |||||
| 10−6 | 41.3 | 25.8 | 128.5 | b | 4.6 | 48.7 | b | 173.3 | 1610.0 | ||||||
| 10 | 0 | 40.7 | 25.0 | 128.5 | b | 5.4 | 50.4 | ab | 132.0 | 2500.0 | |||||
| 10−6 | 39.5 | 23.0 | 129.1 | ab | 4.9 | 49.5 | b | 145.3 | 1350.0 | ||||||
| 20 | 0 | 41.0 | 25.0 | 128.6 | ab | 5.8 | 48.2 | b | 100.7 | 1840.0 | |||||
| 10−6 | 40.1 | 22.5 | 129.6 | a | 4.5 | 48.7 | b | 125.7 | 1500.0 | ||||||
| Significancex | |||||||||||||||
| NaCl | ** | ** | ns | ns | * | *** | * | ||||||||
| GA3 | * | ** | ns | *** | * | * | *** | ||||||||
| NaCl × GA3 | ns | ns | ** | ns | * | ns | ns | ||||||||
z Each value is the mean of 4 replicated samples of 20 plants each. For each factor, values in a column followed by the same letter are not significantly different, according to the LSD test. x Significance: ns = not significant; * significant at p < 0.05; ** significant at p < 0.01; *** significant at p < 0.001; y Titratable acidity expressed as citric acid.
Table 9.
Correlation of variables to the factors of the principal components analysis (PCA) based on factor loadings.
Table 9.
Correlation of variables to the factors of the principal components analysis (PCA) based on factor loadings.
| Variables | PC1 | PC2 | PC3 |
|---|---|---|---|
| Plant height | 0.982 | 0.117 | 0.057 |
| Whole plant FW | 0.814 | 0.557 | 0.089 |
| Shoot FW | 0.732 | 0.658 | 0.092 |
| Root FW | 0.989 | −0.021 | 0.076 |
| S/R FW | −0.846 | 0.486 | −0.158 |
| Whole plant DW | 0.944 | 0.283 | −0.034 |
| Shoot DW | 0.922 | 0.338 | −0.025 |
| Roots DW | 0.981 | −0.022 | −0.052 |
| S/R DW | −0.899 | 0.323 | 0.181 |
| Plant DM | −0.887 | 0.192 | −0.272 |
| Yield | 0.979 | 0.192 | 0.039 |
| Minimal processing Yield | −0.456 | 0.639 | 0.320 |
| WUE | 0.968 | 0.149 | −0.020 |
| NUE | 0.947 | 0.204 | −0.024 |
| Leaf No. | −0.571 | 0.769 | −0.253 |
| Plant area | 0.987 | 0.086 | −0.030 |
| Leaf area | 0.993 | −0.028 | −0.033 |
| SLA | 0.988 | −0.056 | 0.073 |
| Stomatal conductance | 0.987 | 0.099 | −0.025 |
| L* | 0.974 | −0.106 | −0.038 |
| Chroma | 0.983 | −0.107 | −0.015 |
| Hue | −0.980 | 0.116 | 0.070 |
| SSC | −0.944 | −0.142 | 0.159 |
| TA | −0.968 | 0.130 | 0.122 |
| Ascorbic acid | −0.926 | 0.314 | 0.051 |
| N-NO3− | 0.082 | −0.054 | 0.979 |
Values in bold within the same factor indicate the variable with the largest correlation.
© 2020 by the authors. Licensee MDPI, Basel, Switzerland. This article is an open access article distributed under the terms and conditions of the Creative Commons Attribution (CC BY) license (http://creativecommons.org/licenses/by/4.0/).
Share and Cite
MDPI and ACS Style
Vetrano, F.; Moncada, A.; Miceli, A. Use of Gibberellic Acid to Increase the Salt Tolerance of Leaf Lettuce and Rocket Grown in a Floating System. Agronomy 2020, 10, 505. https://doi.org/10.3390/agronomy10040505
AMA Style
Vetrano F, Moncada A, Miceli A. Use of Gibberellic Acid to Increase the Salt Tolerance of Leaf Lettuce and Rocket Grown in a Floating System. Agronomy. 2020; 10(4):505. https://doi.org/10.3390/agronomy10040505
Chicago/Turabian StyleVetrano, Filippo, Alessandra Moncada, and Alessandro Miceli. 2020. "Use of Gibberellic Acid to Increase the Salt Tolerance of Leaf Lettuce and Rocket Grown in a Floating System" Agronomy 10, no. 4: 505. https://doi.org/10.3390/agronomy10040505
Note that from the first issue of 2016, this journal uses article numbers instead of page numbers. See further details here.