A Comparative Cost-Benefit Analysis of Conventional and Organic Hazelnuts Production Systems in Center Italy


 ,
,  , ,
, ,  ,
,  and
and
Abstract
:1. Introduction
2. Materials and Methods
2.1. Description of the Crop Cycle
- (1)
- Soil Preparation (Year 0):
- (a)
- Soil ripping: This preliminary operation is carried using a ripper and aims to prepare the soil for the subsequent tillage. During the ripping, soil crusts are broken, stones and roots are removed from the soil surface, and the deeper soil layers are tilled and aerated.
- (b)
- Stone crushing: On average, in 33% of new implantations, after ripping, the soil breaks into blocks of rock or big stones. In these cases, stone crushing is necessary to crush the blocks of rock into little pieces in order to prepare the soil for planting.
- (c)
- Heavy harrowing: this operation is performed in 1/3 of hazelnut orchards when the soil is too tophaceous after the ripping.
- (d)
- Leveling: In 33% of new plantings, in soil with few stones, stone crushing and heavy harrowing are not performed. In these cases, leveling is performed.
- (e)
- Installation of an irrigation system: This system is installed only in conventional orchards of hazels located in areas where the rainfall level does not reach a certain value (about 60% of the farmed area considered in this study).
- (2)
- Planting (Year 0)
- (a)
- Only for organic hazelnut cultivation, organic fertilization using 50 t/ha of cow manure is performed.
- (b)
- Planting: This operation is performed by a transplanter machine equipped with GPS (global positioning system). The orchards have a plant density of 500 plants per hectare and a plant layout of 5 m × 5 m between rows and on the row.
- (c)
- Harrowing: After planting, an inter-row harrowing is carried out using a rotary harrow in order to control weeds.
- (3)
- Cultivation (from Year 1 to Year 50):
- (a)
- Harrowing and heavy harrowing: Each of these operations is performed once per year from Year 1 to Year 5.
- (b)
- Hoeing: Performed twice per year from Year 1 to Year 5, this operation is manual and takes place until the hazels become productive. It aims to remove weeds around each plant to help them grow better and faster.
- (c)
- Fertilization: Performed twice per year from Year 1 to Year 50, with an increasing quantity of fertilizers applied in the first 5 years. It provides the soil with nutrients to adequately support plant growth and productivity. Fertilization is carried out using a broadcaster spreader coupled with a tractor. In conventional hazelnut cultivation, 150 kg/ha of diammonium phosphate 18-46 and 50 kg/ha of N30 are applied from Year 1 to Year 5, and then, from Year 6 to Year 50, 550 kg/ha of 20-10-10 is applied. In organic hazelnut cultivation, besides the basal fertilization in the year of planting, from Year 1 to Year 5, 150 kg/ha of Bio Enne (12% N) is applied, and then 800 kg/ha of Bio Enne and 200 kg/ha of phosphonature (26% P2O5) are applied from Year 6 to Year 50;
- (d)
- Breeding pruning: This operation is performed manually once only in the third year of life of the hazel, and it aims to reach the selected form of breeding (“bushy”, “a cespuglio”).
- (e)
- Pruning: This operation is performed manually from Year 4 to Year 50.
- (f)
- Removal of basal shoots: This operation takes place from the third year. In conventional farming systems, in half of the cases, the operation is performed manually, and, in the other half of the cases, it is carried out by an herbicide (3.75 L/ha) applied using a sprayer equipped with bell spray nozzles for local application on the row. In the case of organic cultivation, the operation is always performed manually.
- (g)
- Pest control: Insecticide and fungicide treatments are carried out using a sprayer. In the case of conventional farming, the following products are applied: deltamethrin (0.250 g/ha), lamba-cyhalothrin (0.250 g/ha), thiophanate-methyl (0.90 L/ha), boscalid + pyraclostrohin (0.50 L/ha); the operations are performed on average three times per year, and the quantities applied on average per year are indicated. In the case of organic orchards, the insecticide and fungicide treatments do not use any kind of synthetic chemical substances. The substances utilized on average per year as insecticide and fungicide treatments are 15 L of water/ha with a composition of 13 g per liter of “Cuthiol by Mormino”, whose composition is 20 g of copper and 14 g of sulfur on 100 g of product, and 6 kg/ha of a leaf stimulant called “Blackjak”.
- (4)
- Harvesting (from Year 6 to Year 50):
- (a)
- Shredding: This operation is performed three times per year starting from the sixth year when the hazel enters into the productive phase. It substitutes the harrowing and milling as the “surface cleaning” operation. It is performed with a lateral mulcher machine coupled with a tractor.
- (b)
- Weeding preharvesting: It aims to clean the soil in order to facilitate the mechanized harvesting operations, and it is performed once per year.
- (c)
- Harvesting: The hazelnuts that have fallen on the soil are gathered using a self-propelled machine. This harvesting solution is, by far, the most applied in the studied area [18]. The hazelnuts that have fallen to the ground are windrowed by two contrarotating brushes. The harvester is equipped with a lateral blower, which, using the aspiration air, collects the hazelnuts near the plant stems. The fruits are moved by the brushes to an aspirating pipe. Once aspirated in a depression chamber, they are separated from heavier materials (soil, stones). Finally, the product is collected in a conveyor, where, thanks to the airflow generated by a ventilator, leaves and other impurities are removed.
- (5)
- Postharvesting Phase (from Year 6 to Year 50):
- (a)
- Transportation: Using farm trailers coupled with tractors, the hazelnuts are transported to the collection center; the average distance between the hazels and the collection centers is 10 km. An empty return was considered in this study.
- (b)
- Drying: Using a dryer, the moisture content of the hazelnuts is reduced from 13% to 6%.
2.2. Cost-Benefit Analysis
- t = the time period (year);
- Rt = revenues of the year t (€/ha);
- Ct = costs of the year t (€/ha);
- N = 50;
- r = discount rate (%).
- A is the last year number with negative cumulative cash flow;
- B is the absolute value of discounted cumulative net cash flow at the end of Period A;
- D is the total discounted cash inflow during the period following Period A. Discounted cumulative net cash flow is the discounted difference between flows and inflows over time;
- -
- DUH (dry unshelled hazelnuts, kg/ha) represent the mass of dry and cleaned (by removal of unwanted materials such as stones and pieces of wood and leaves) unshelled nuts harvested at the farm and transported to the collection center;
- -
- EP (processing efficiency) is achieved by shelling a sample of DUH, removing all shells and all the bugged and rotten nuts, and, finally, weighing the remaining dry shelled hazelnuts (DSH, kg). It is expressed as a percentage and can be calculated asEP = DSH/DUH
- -
- PCONV and PORG (selling price, €/kg of DSH) are the selling prices for conventional and organic dry shelled hazelnuts; the prices are the average wholesale prices of the last ten years;
- -
- S (subsidy, €/ha) is the subsidy granted for organic hazelnut farming in the first 5 years of the crop cycle.
2.3. Data Collection
3. Results
3.1. Cost Analysis
3.2. Economic Indicators
3.3. Sensitivity Analysis
4. Discussion
- -
- A reduction of the price (from 10% up to 40%) of the organic fertilizer “Bio-Enne”, aiming to assess whether cheaper organic nitrogen fertilizers could enhance the profitability and economic sustainability of organic hazelnut;
- -
- At which level of increase in hazelnut selling price can the profitability of organic cultivation practices be improved to match conventional production performance;
- -
- At which level of increase in organic production yield can the same profitability as in the conventional production system be reached.
5. Conclusions
Author Contributions
Funding
Conflicts of Interest
References
- Industry Research. Global Hazelnut Market—Growth, Trends and Forecast (2019–2024). 2019, p. 128. Available online: https://www.industryresearch.co/global-hazelnut-market-14244187 (accessed on 1 July 2020).
- Negi, A. A brief review on hazelnuts. Int. J. Recent Sci. Res. 2018, 9, 23680–23684. [Google Scholar]
- Piacentini, L.; Colantoni, A.; Delfanti, L.M.P.; Monarca, D.; Cecchini, M.; Bedini, R. The hazelnut sector of the Monti Cimini agro-industrial district: Economic analysis and development perspectives. Rep. Econ. Financ. 2015, 1, 1–10. [Google Scholar] [CrossRef]
- Cristofori, V.; Pica, A.; Silvestri, C.; Bizzarri, S. Phenology and yield evaluation of hazelnut cultivars in Latium region. Acta Hortic. 2018. [Google Scholar] [CrossRef]
- Van Stappen, F.; Loriers, A.; Mathot, M.; Planchon, V.; Stilmant, D.; Debode, F. Organic Versus Conventional Farming: The Case of wheat Production in Wallonia (Belgium). Agric. Agric. Sci. Procedia 2015, 7, 272–279. [Google Scholar] [CrossRef] [Green Version]
- Bacenetti, J.; Fusi, A.; Negri, M.; Bocchi, S.; Fiala, M. Organic production systems: Sustainability assessment of rice in Italy. Agric. Ecosyst. Environ. 2016, 225, 33–44. [Google Scholar] [CrossRef]
- MacCormack, H. Sustainable agriculture versus organic farming. In “What Is Sustainable Agriculture?” Planting the Future: Developing an Agriculture That Sustains Land and Community; Bird, B.G., Ed.; Iowa State University Press: Ames, IA, USA, 1995; Chapter 3; pp. 60–61. [Google Scholar]
- Karata, S.; Islam, A.; Tonkaz, T.; Özkutlu, F.; Rovira, M.; Romero, A.; Cristofori, V.; Silvestri, C.; Speranza, S.; Çetin, S.; et al. Examination of modern and traditional applications in hazelnut production. Acta Hortic. 2018. [Google Scholar] [CrossRef]
- Rigby, D.; Cáceres, D. Organic farming and the sustainability of agricultural systems. Agric. Syst. 2001, 68, 21–40. [Google Scholar] [CrossRef]
- Mercati, V. Organic Agriculture as a Paradigm of Sustainability: Italian Food and its Progression in the Global Market. Agric. Agric. Sci. Procedia 2016, 8, 798–802. [Google Scholar] [CrossRef] [Green Version]
- Canavari, M.; Ghelfi, R.; Olson, K.D.; Rivaroli, S. A Comparative Profitability Analysis of Organic and Conventional Farms in Emilia-Romagna and in Minnesota. Org. Food 2007. [Google Scholar] [CrossRef]
- Demiryurek, K.; Ceyhan, V. Economics of organic and conventional hazelnut production in the Terme district of Samusn, Turkey. Acta Hortic. 2008, 845, 739. [Google Scholar]
- Aydoğan, M.; Demiryürek, K.; Abacı, N. World hazelnut trade networks. Acta Hortic. 2018. [Google Scholar] [CrossRef]
- Kouchaki-Penchah, H.; Sabzevari, A.; Navavi-Pelesaraei, A. Investigation of Life Cycle Assessment of hazelnut production in Guilan province of I.R. Irab based on orchards size levels. Biol. Forum 2015, 7, 807–813. [Google Scholar]
- Aertens, J.; Steurbaut, W.; de Backer, E.; Vergucht, S. Assessing the ecological soundness of organic and conventional agriculture by means of life cycle assessment (LCA). Br. Food J. 2009, 111, 1028–1061. [Google Scholar]
- Song Lee, K.; Chan Choe, Y.; Park, S.H. Measuring the environmental effects of organic farming: A meta-analysis of structural variables in empirical research. J. Environ. Manag. 2015, 162, 263–274. [Google Scholar]
- Bartzas, G.; Vamvuka, D.; Komnitsas, K. Comparative life cycle assessment of pistachio, almond and apple production. Inf. Process. Agric. 2017, 4, 188–198. [Google Scholar] [CrossRef]
- Pascuzzi, S.; Santoro, F. Analysis of the Almond Harvesting and Hulling Mechanization Process: A Case Study. Agriculture 2017, 7, 100. [Google Scholar] [CrossRef] [Green Version]
- Shively, G.; Galopin, M. An Overview of Benefit-Cost Analysis. 2013. Available online: http://www.agecon.purdue.edu/staff/shively/COURSES/AGEC406/reviews/bca.htm (accessed on 1 July 2020).
- Bacenetti, J. Heat and cold production for winemaking using pruning residues: Environmental impact assessment. Appl. Energy 2019, 252, 113464. [Google Scholar] [CrossRef]
- Zinnanti, C.; Schimmenti, E.; Borsellino, V.; Paolini, G.; Severini, S. Economic performance and risk of farming systems specialized in perennial crop: An analysis of Italian hazelnut production. Agric. Syst. 2019, 176, 1–11. [Google Scholar] [CrossRef]
- De Franchi, M.; Boubaker, K. Valorization of hazelnut biomass framework in Turkey: Support and model guidelines from the Italian experience in the field of renewable energy. Int. J. Sustain. Energy Environ. Res. 2014, 3, 130–144. [Google Scholar]
- Moneti, M.; Delfanti, L.M.P.; Marucci, A.; Bedini, R.; Gambella, F.; Proto, A.R.; Gallucci, F. Simulations of a Plant with a Fluidized Bed Gasifier WGS and PSA. Contemp. Eng. Sci. 2015, 8, 1461–1473. [Google Scholar] [CrossRef]
- Valiante, D.; Sirtori, I.; Cossa, S.; Corengia, L.; Pedretti, M.; Cavallaro, L.; Vignoli, L.; Galvagni, A.; Gomarasca, S.; Pesce, G.R.; et al. Environmental impact of strawberry production in Italy and Switzerland with different cultivation practices. Sci. Total Environ. 2019, 664, 249–261. [Google Scholar] [CrossRef] [PubMed]


| Operation | Year | Nn | Tractor | Operating Machine | Notes |
|---|---|---|---|---|---|
| Ripping | 0 | 1 | 235 kW | Ripper | Crawler tractor |
| Implanting Harrowing | 0 | 1 | 235 kW | Heavy Rotary Harrow | Crawler tractor; it is performed, on average, on 30% of the cases |
| Stone crushing | 0 | 1 | 235 kW | Crusher | Crawler tractor; it is performed, on average, on 30% of the cases |
| Leveling | 0 | 1 | 70 kW | Rotary harrow | It is performed, on average, on 30% of the cases |
| Installation of Irrigation system. | 0 | 1 | n/a | n/a | Foreseen in 60% of the conventional area. Not installed in organic hazel |
| Planting | 0 | 1 | 70 kW | Transplanter | |
| Planting Fertilization | 0 | 1 | 70 kW | Spreader | It is performed only in organic farming |
| Manual Hoeing | 1–5 | 2 | n/a | n/a | Performed manually around the plants |
| Harrowing and Heavy Harrowing | 0–5 | 1 | 70 kW | Disc harrow | |
| Rotary harrow | |||||
| Fertilizing | 1–50 | 2 | 70 kW | Spreader | One per year from 1st to 5th year in organic farming |
| Breeding Pruning | 3 | 1 | n/a | n/a | It is performed manually |
| Pruning | 4–50 | 1 | n/a | n/a | It is performed manually |
| Shredding | 6–50 | 3 | 70 kW | Shredder | |
| Removal of basal shoots (suckering) | 3–50 | 1 | 70 kW | Sprayer | In 50% of cases, it is performed manually without any machinery. In organic farming, it is always performed manually |
| Weeding preharvesting | 6–50 | 1 | 70 kW | Disc Ripper | |
| Treatments | 6–50 | 3 | 70 kW | Atomizer | |
| Harvesting | 6–50 | 1 | n/a | Self-propelled harvesting machine | |
| Transport | 6–50 | 1 | 70 kW | Farm trailer | Average distance: 10 km |
| Drying | 6–50 | 1 | n/a | n/a | From 13% to 6% of moisture content |
| Commercial Product or Active Substance | Operation | Amount |
|---|---|---|
| Diammonium Phosphate 18-46 | Fertilizing (Years 1 to 5) | 150 kg/ha |
| Fertilizer (30% N) | Fertilizing (Years 1 to 5) | 50 kg/ha |
| Fertilizer (20-10-10) | Fertilizing (from Year 6) | 550 kg/ha |
| Herbicide | Removal of Basal Shoots | 3.75 L/ha |
| Insecticide (Deltamethrin) | Insecticide Application | 0.250 g/ha |
| Insecticide (Lambda-cyhalothrin) | Insecticide Application | 0.250 g/ha |
| Fungicide (Thiophanate-Methyl) | Fungicide Application | 0.90 L/ha |
| Fungicide (Boscalid + Pyraclostrobin) | Fungicide Application | 0.50 L/ha |
| Product | Operation | Amount |
|---|---|---|
| Cattle Manure | Basal Fertilization | 50,000 kg/ha |
| “Bio Enne” (12 N) | Fertilizing (Years 1 to 5) | 150 kg/ha |
| “Bio Enne” (12 N) | Fertilizing (from Year 6) | 800 kg/ha |
| “Fosfonature” (26 P) | Fertilizing (from Year 6) | 200 kg/ha |
| “Cuthiol” by “Mormino” (20% copper + 14% sulfur) | Treatments | 13 g/L of water |
| 15 L of water/ha | ||
| Leaf stimulant “Blackjak” | Treatments | 6 kg/ha |
| Farming Systems | Dry Commercial Unshelled Yield (DUH) | Processing Efficiency (EP) | Price (P) |
|---|---|---|---|
| Conventional | 2363 kg/ha | 42.25% | 5.9 €/kgDSH |
| Organic | 954 kg/ha | 43.25% | 7.5 €/kgDSH |
| Scenario | Discount Rate | Yearly Price Increase | Yearly Inflation |
|---|---|---|---|
| Baseline Scenario | 2% | 1% | 0 |
| Scenario 2 | 2% | 2% | 0 |
| Scenario 3 | 2% | 2% | 1% |
| Scenario 4 | 2% | 3% | 0 |
| Scenario 5 | 2% | 3% | 1% |
| Scenario 6 | 4% | 0 | 0 |
| Scenario 7 | 4% | 2% | 0 |
| Scenario 8 | 4% | 2% | 1% |
| Scenario 9 | 4% | 3% | 0 |
| Scenario 10 | 4% | 3% | 1% |
| Operation | Cost | Source |
|---|---|---|
| Ripping | 2000 €/ha | Interview |
| Heavy harrowing | 535 €/ha | |
| Stone crushing | 535 €/ha | |
| Leveling | 535 €/ha | |
| Planting | 600/ha | |
| Irrigation system installation | 1650 €/ha | Producer |
| Postplanting fertilization | 100 €/ha | Interview |
| Breeding and pruning | 500 €/ha | |
| Pruning | 300 €/ha | |
| Hoeing | 200 €/ha | |
| Harrowing | 200 €/ha | |
| Milling | 200 €/ha | |
| Fertilizing | 35 €/ha | |
| Shredding | 200 €/ha | |
| Manual and chemical (herbicide) removal of basal shoots | 300 €/ha | |
| Weeding preharvest | 240 €/ha | |
| Treatments | 100 €/ha | |
| Harvesting | 25 € × 100 kg unshelled nuts | |
| Transport and drying | 10 € × 100 kg unshelled nuts | |
| Land cost opportunity | 500 €/ha |
| Product | Unitary Cost | Source |
|---|---|---|
| Seedlings | 1.20 €/plant | Interview |
| Fertilizer (20-10-10) | 0.54 €/kg | Producer |
| Fertilizer (30-0-0) | 0.60 €/kg | |
| Fertilizer Diammonicum | 0.54 €/kg | |
| “Bio Enne” (12-0-0) | 1 €/kg | |
| “Fosfonature” (0-26-0) | 0.60 €/kg | |
| Herbicide “Basta” | 1.88 €/L | |
| Pesticide with Deltamethrin | 40 €/L | |
| Pesticide with Lambda-cyhalothrin | 20 €/L | |
| Thiophanate-Methyl | 30 €/L | |
| Boscalid Pyraclostrobin | 80 €/L | |
| Sulfur and Copper “Cuthiol” | 10 €/L | |
| Leaf Stimulant “Blackjak” | 13.5 €/L |
| Average Value | Conventional | Organic |
|---|---|---|
| Dry Unshelled Hazelnuts (DUH) | 2363 kg | 954 kg |
| Damaged by insects (% of DUH) | 15.8% | 15.5% |
| Rotten (% of DUH) | 1.8% | 1.9% |
| Processing efficiency (% of DUH) | 42.25% | 43.25% |
| Cost Item | Discounted Cost (€/ha) | Share |
|---|---|---|
| Preplanting operations and planting | 5920 | 5.38% |
| Shredding | 10,684.06 | 9.71% |
| Removal of basal shoots | 8844.61 | 8.04% |
| Pruning | 8561.92 | 7.78% |
| Treatments for pest control | 8013.04 | 7.28% |
| Fertilizing | 2199.65 | 2% |
| Chemical weed control | 2611.18 | 2.37% |
| Weeding preharvest | 6410.44 | 5.83% |
| Harvesting and transport | 17,361.60 | 15.80% |
| Drying | 6944.64 | 6.31% |
| Rent opportunity cost | 13,355.07 | 12.14% |
| Fertilizers | 7932.91 | 7.21% |
| Pesticides | 6009.78 | 5.46% |
| Breeding operations | 5165.12 | 4.69% |
| Total | 110,014 | 100% |
| Cost Item | Discounted Cost (€/ha) | Share |
|---|---|---|
| Preplanting operations and planting | 4470 | 4.18% |
| Shredding | 10,684.06 | 9.98% |
| Removal of basal shoots | 8844.61 | 8.26% |
| Pruning | 8561.92 | 8% |
| Treatments for pest control | 8013.04 | 7.49% |
| Fertilizing | 2199.65 | 2.05% |
| Weeding preharvest | 6410.44 | 5.99% |
| Harvesting and transport | 7078.19 | 6.61% |
| Drying | 2671.01 | 2.50% |
| Rent opportunity cost | 13,355.07 | 12.48% |
| Fertilizers (production phase) | 24,573.33 | 22.94% |
| Pesticides | 4835.00 | 4.52% |
| Breeding operations | 5348.95 | 5% |
| Total | 107,046 | 100% |
| Scenario | NPV | PBT (years) | IRR |
|---|---|---|---|
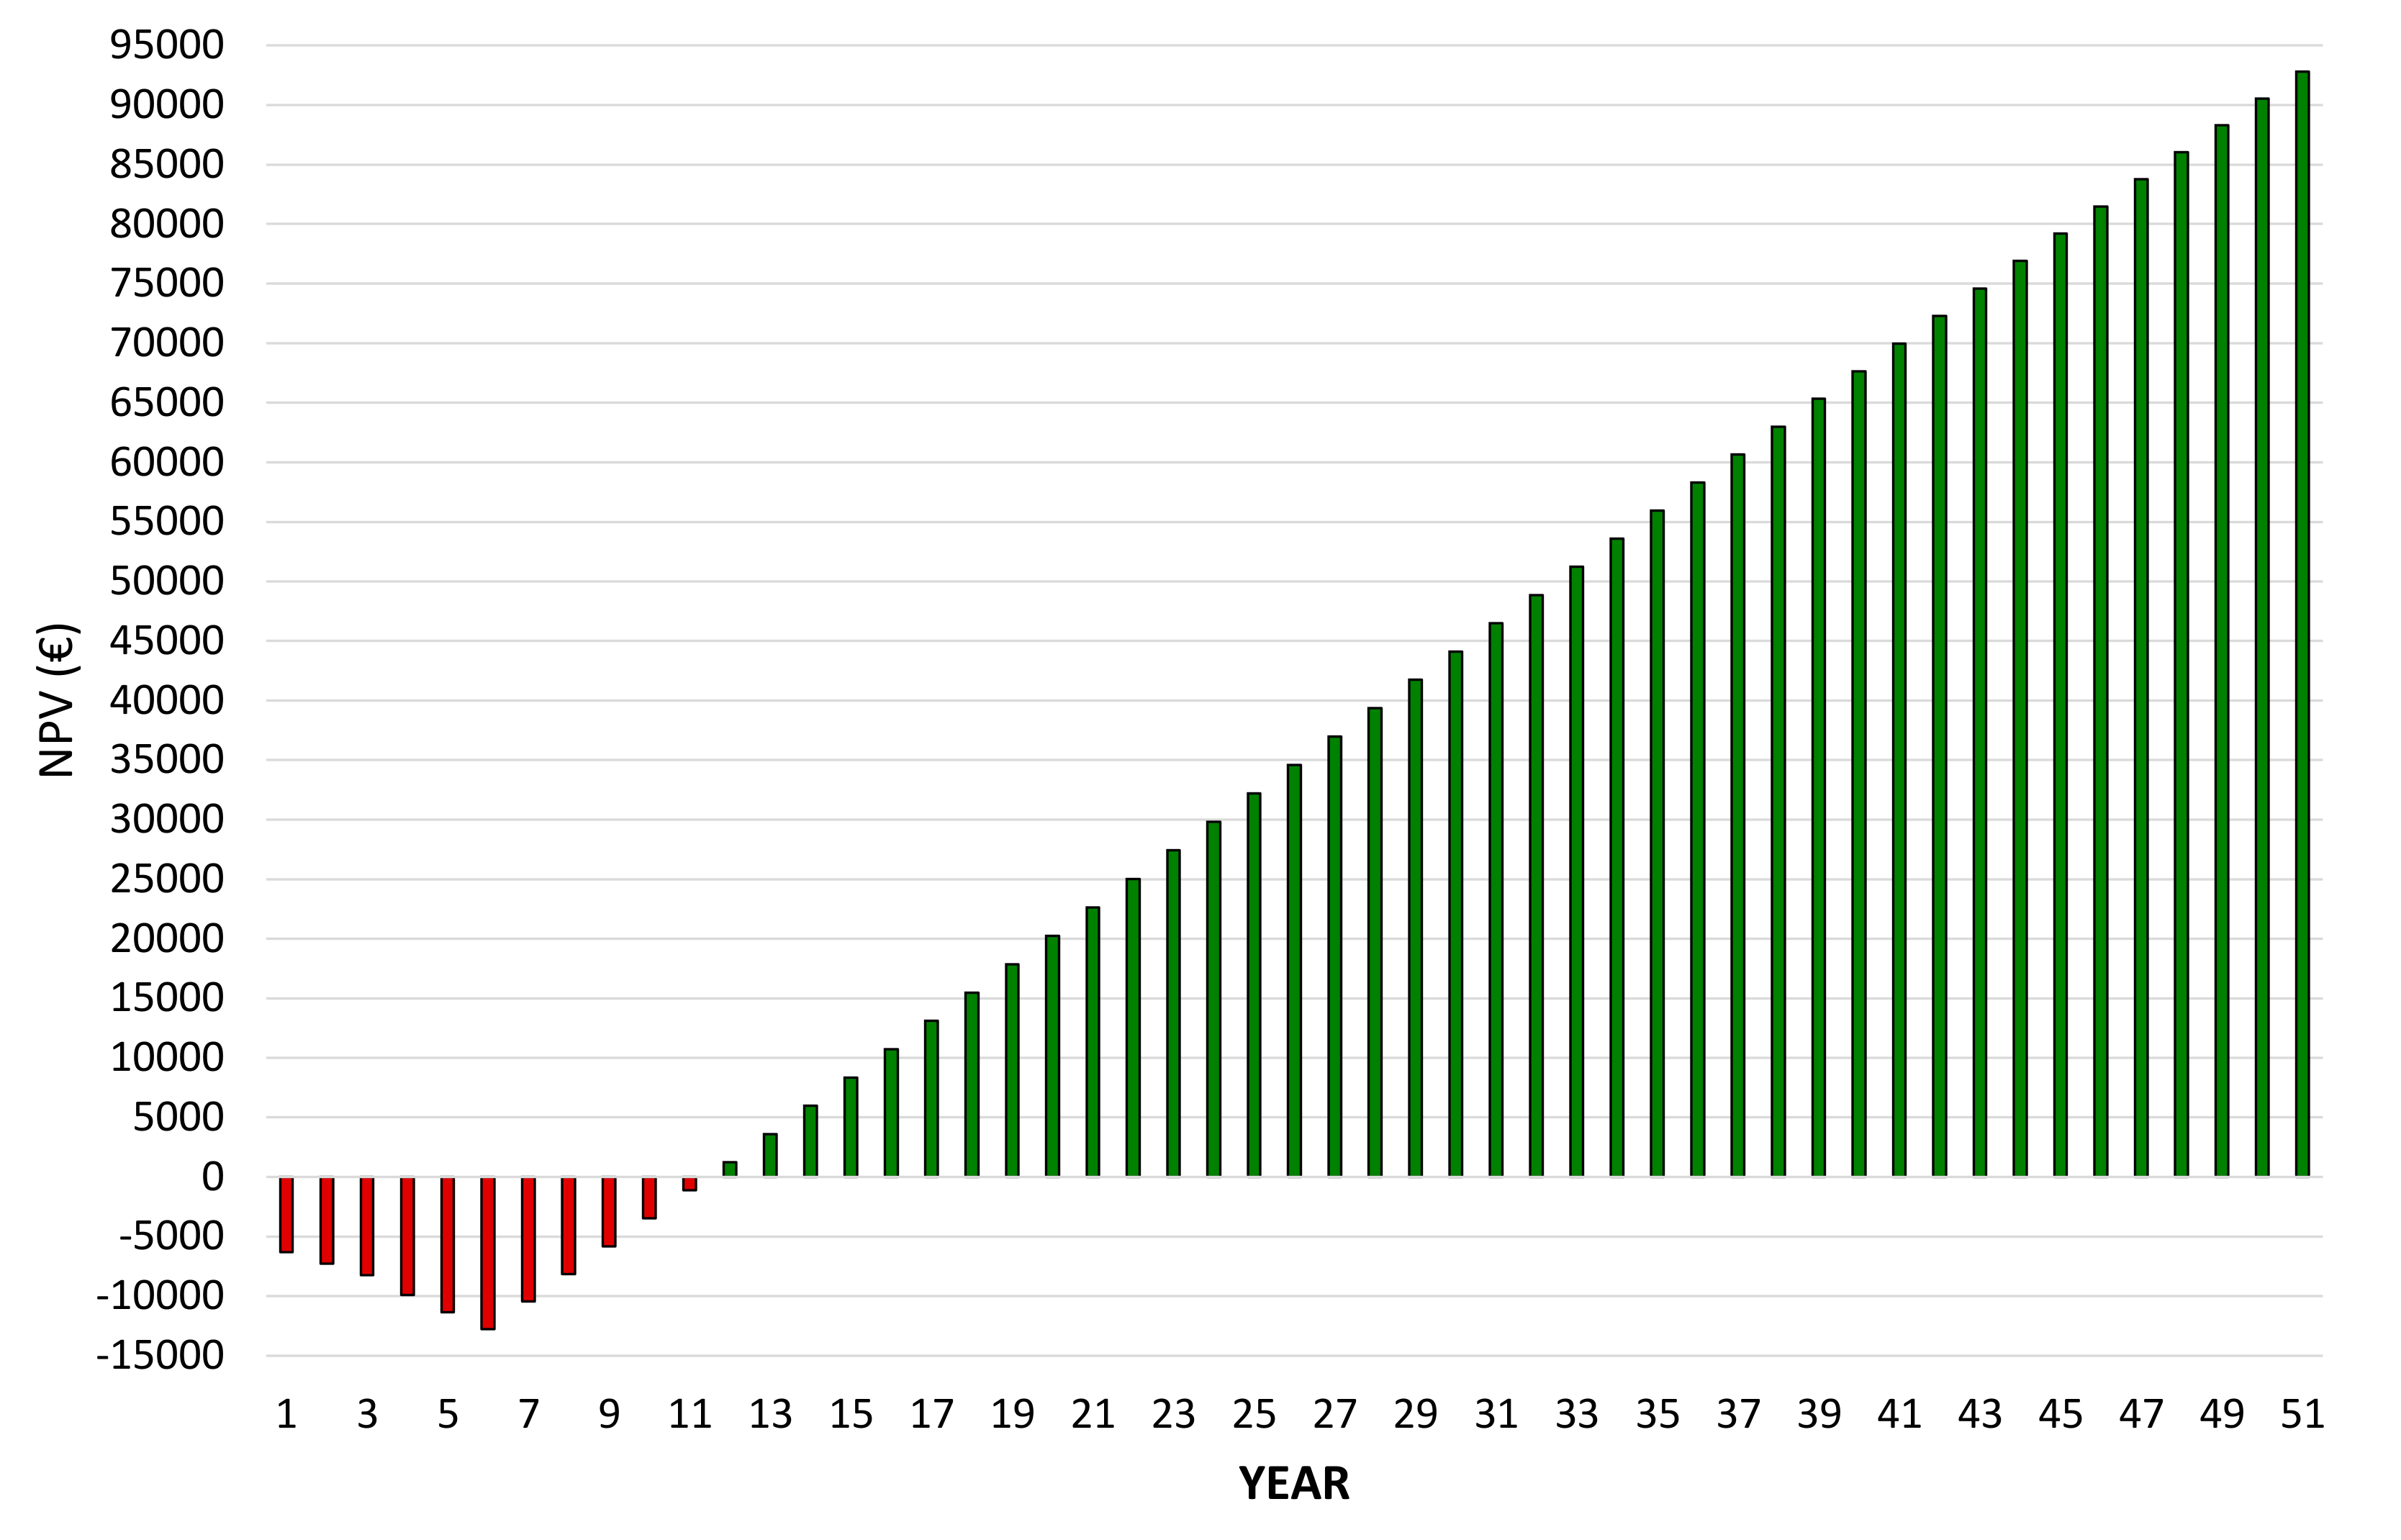
| Baseline r: 2% Price increase: 1% Inflation: 0% | 92,800 € | 10.47 years | 12% |
| r: 2% Price increase: 1% Inflation: 1% | 127,466 € Δ: +37% | 10.13 years Δ: −3.2% | 13.3% Δ: +10.8% |
| r: 2% Price increase: 0% Inflation: 0% | 47,319 € Δ: -49% | 11.77 years Δ: +12.4% | 9.4% Δ: −21.6% |
| r: 2% Price increase: 0% Inflation: 1% | 64,484 € Δ: −30.5% | 11.29 years Δ: +7.8% | 10.5% Δ: −12.5% |
| r: 2% Price increase: 2% Inflation: 0% | 155,053 € Δ: +67% | 9.61 years Δ: −8.2% | 14.5% Δ: +20% |
| r: 2% Price increase: 2% Inflation: 1% | 214,832 € Δ: +131% | 9.35 years Δ: -10% | 15.7% Δ: +30.8% |
| r: 4% Price increase: 1% Inflation: 0% | 51,026 € Δ: −45% | 11.26 years Δ: −7.5% | 10% Δ: −20% |
| r: 4% Price increase: 0% Inflation: 0% | 25,924 € Δ: −72% | 12.96 years Δ: +23% | 7.3% Δ: −39% |
| r: 4% Price increase: 1% Inflation: 1% | 69,124 € Δ: −25% | 10.83 years Δ: −3.4% | 11.1% Δ: −3.4% |
| r: 4% Price increase: 2% Inflation: 0% | 84,445 € Δ: - 9% | 10.20 years Δ: −2.5% | 12.3% Δ: +2.5% |
| r: 4% Price increase: 2% Inflation: 1% | 114,783 € Δ: +23% | 9.88 years Δ: −5.6% | 13.5% Δ: +12.5% |
| Scenario | NPV | PBT (years) | IRR |
|---|---|---|---|
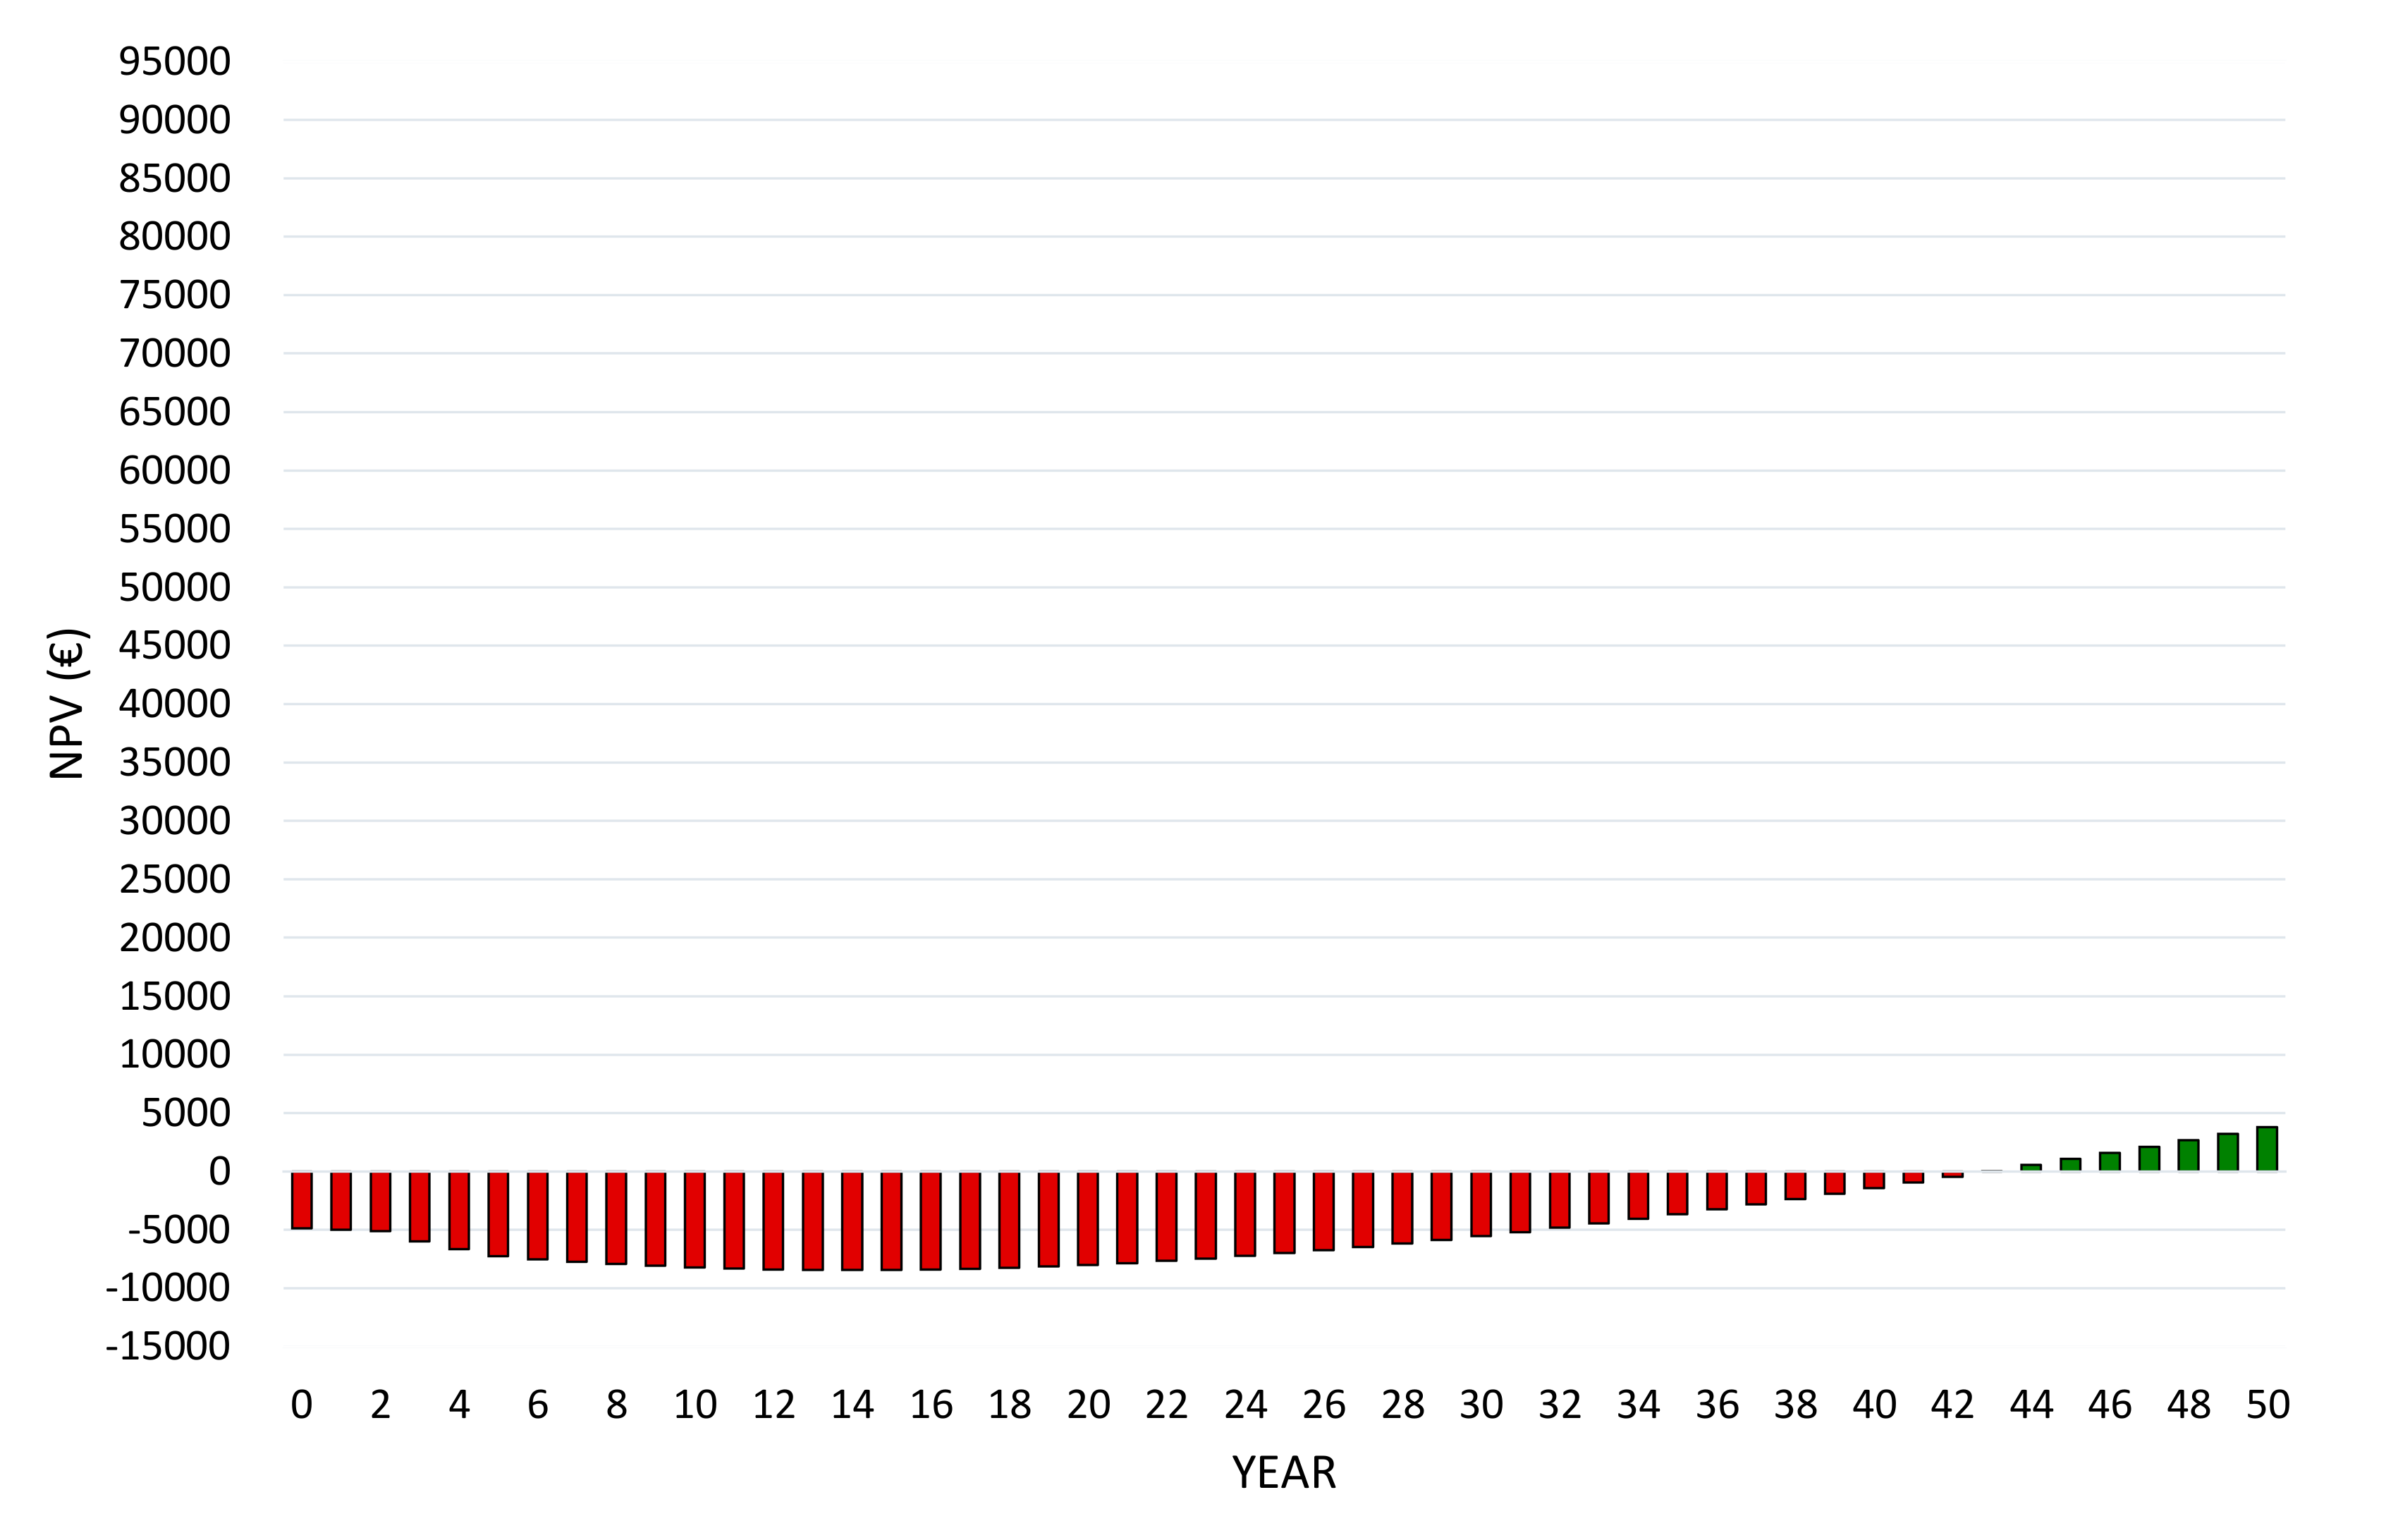
| Baseline r:2% Price increase: 1% Inflation: 0% | 3778 € | 42.94 years | 1.1% |
| r: 2% Price increase: 1% Inflation: 1% | 9177 € Δ: +142% | 38.63 years Δ: −10% | 2.1% Δ: +90.9% |
| r: 2% Price increase: 0% Inflation: 0% | −20,147 € Δ: −633% | n/a 1 | n/a 1 |
| r: 2% Price increase: 0% Inflation: 1% | −23,955 € Δ: −734% | n/a 1 | n/a 1 |
| r: 2% Price increase: 2% Inflation: 0% | 35,535 € Δ: +840% | 23.06 years Δ: −46% | 6% Δ: +445% |
| r: 2% Price increase: 2% Inflation: 1% | 55,120 € Δ: +1358% | 21.75 years Δ: −49% | 7.1% Δ: +545% |
| r: 4% Price increase: 1% Inflation: 0% | −15,321 € Δ: −505% | n/a 1 | n/a 1 |
| r: 4% Price increase: 0% Inflation: 0% | −2096 € Δ: −155% | 61 years 2 +42% | -0.934% Δ: −184% |
| r: 4% Price increase: 1% Inflation: 1% | 343 € Δ: −90.9% | 49 years Δ: +14% | 0.1% Δ: −90.9% |
| r: 4% Price increase: 2% Inflation: 0% | 15,500 € Δ: +310% | 26.53 years Δ: −38% | 4% Δ: +263% |
| r: 4% Price increase: 2% Inflation: 1% | 24,372 € Δ: +545% | 24.56 years Δ: −42.8% | 5% Δ: +354% |
© 2020 by the authors. Licensee MDPI, Basel, Switzerland. This article is an open access article distributed under the terms and conditions of the Creative Commons Attribution (CC BY) license (http://creativecommons.org/licenses/by/4.0/).
Share and Cite
Coppola, G.; Costantini, M.; Orsi, L.; Facchinetti, D.; Santoro, F.; Pessina, D.; Bacenetti, J. A Comparative Cost-Benefit Analysis of Conventional and Organic Hazelnuts Production Systems in Center Italy. Agriculture 2020, 10, 409. https://doi.org/10.3390/agriculture10090409
Coppola G, Costantini M, Orsi L, Facchinetti D, Santoro F, Pessina D, Bacenetti J. A Comparative Cost-Benefit Analysis of Conventional and Organic Hazelnuts Production Systems in Center Italy. Agriculture. 2020; 10(9):409. https://doi.org/10.3390/agriculture10090409
Chicago/Turabian StyleCoppola, Giuseppe, Michele Costantini, Luigi Orsi, Davide Facchinetti, Francesco Santoro, Domenico Pessina, and Jacopo Bacenetti. 2020. "A Comparative Cost-Benefit Analysis of Conventional and Organic Hazelnuts Production Systems in Center Italy" Agriculture 10, no. 9: 409. https://doi.org/10.3390/agriculture10090409