Evaluation of Chemical Composition of Some Silphium L. Species as Alternative Raw Materials


1
Department of Tourism and Recreation, University of Life Sciences in Lublin, 15 Akademicka Street, 20-950 Lublin, Poland
2
Department of Analysis and Evaluation of Food Quality, University of Life Sciences in Lublin, 8 Skromna Street, 20-704 Lublin, Poland
*
Author to whom correspondence should be addressed.
Agriculture 2020, 10(4), 132; https://doi.org/10.3390/agriculture10040132
Submission received: 16 March 2020
/
Revised: 7 April 2020
/
Accepted: 15 April 2020
/
Published: 17 April 2020
(This article belongs to the Section Agricultural Product Quality and Safety)
Abstract
:The chemical composition of three Silphium species in the aspect of the possibility of their use for various purposes has been evaluated. The plant material of three Silphium species (S. perfoliatum, S. trifoliatum and S. integrifolium) was acquired from cultivation located in eastern Poland. The vegetative propagating material consisted of seeds and rhizomes. Content of protein (up to 22.9% in leaves of S. perfoliatum), amino acids (aspartic acid—up to 12.0%, glutamic acid—up to 9.5%, and leucine—up to 9.4%), fat (up to 4.2% in inflorescences of S. perfoliatum), cellulose (up to 42.9% in stems of S. trifoliatum), water-soluble sugars (up to 26.7% in rhizomes of S. perfoliatum) and mineral substances (ash up to 20.9% in stems of S. integrifolium, with significant levels of elements such as K, Ca, Mg, Fe, Mn) in the tested Silphium species can be an important criterion determining a positive evaluation of these plants as sources of alternative raw materials. The conducted research is meant to draw attention to the possibility of use of the biomass of three Silphium species as a potential source of ecological and renewable raw material for food, pharmaceuticals, feed and possibly also for energy generation purposes.
1. Introduction
At present, one can observe a trend for the search for plants that can provide, e.g., food products with specific health-promoting properties, raw materials for the pharmaceutical industry, and renewable sources of energy. In addition, research on new crop plants is related to the protection of the natural environment, i.e., organic agriculture, biological reclamation of soils, and counteracting the greenhouse effect. These trends have caused an increase in the interest in new plant species both on the part of farmers and of the users of plant raw materials.
Species of Silphium L. genus (Asteraceae) are among the most interesting plants referring to the problems mentioned. So far, only S. perfoliatum L. has been studied as a medical, melliferous, fodder, and recultivation plant. The literature reports that S. perfoliatum is characterised by a high production potential in terms of yields, and contains significant levels of nutrients, i.e., carbohydrates, proteins, L-ascorbic acid, and mineral constituents [1,2,3] and biologically active substances, i.e., terpenoids and essential oil [4,5,6,7,8,9,10,11,12], flavonoids [2,13], phenolic acids [14,15,16], and oleanosides [2,17,18]. In addition, studies have been conducted on the utility features (usefulness for bees, animal feed) and in the range of antimicrobial activity [19,20,21,22,23,24,25,26]. In recent years anatomical-morphological studies were conducted, as well as studies on yield efficiency and on the content of biologically active substances, for three species from the genus Silphium: S. perfoliatum, S. trifoliatum, and S.integrifolium [27,28,29,30,31]. There is an interesting study on the chemical composition of seeds of three Silphium species in the aspect of their use for consumption purposes [32]. However, the literature still does not provide reports on detailed research concerning the characterisation of S. trifoliatum and S. integrifolium in the aspect of the estimation of their content of nutrients and minerals, which was the stimulus for undertaking the research in this area. The results of the study will constitute an important criterion in the estimation of these plant species in the aspect of the possibility of their use for various purposes. Therefore, the objective of the study presented here is the estimation of the content of dry matter (DM), ash, total protein, crude fat, water-soluble sugars, L-ascorbic acid, cellulose, chlorophyll, tannins, minerals, and trace elements, as well as heavy metals in the aboveground and underground organs of S. perfoliatum, S. trifoliatum, and S. integrifolium.
2. Materials and Methods
2.1. Plants Material
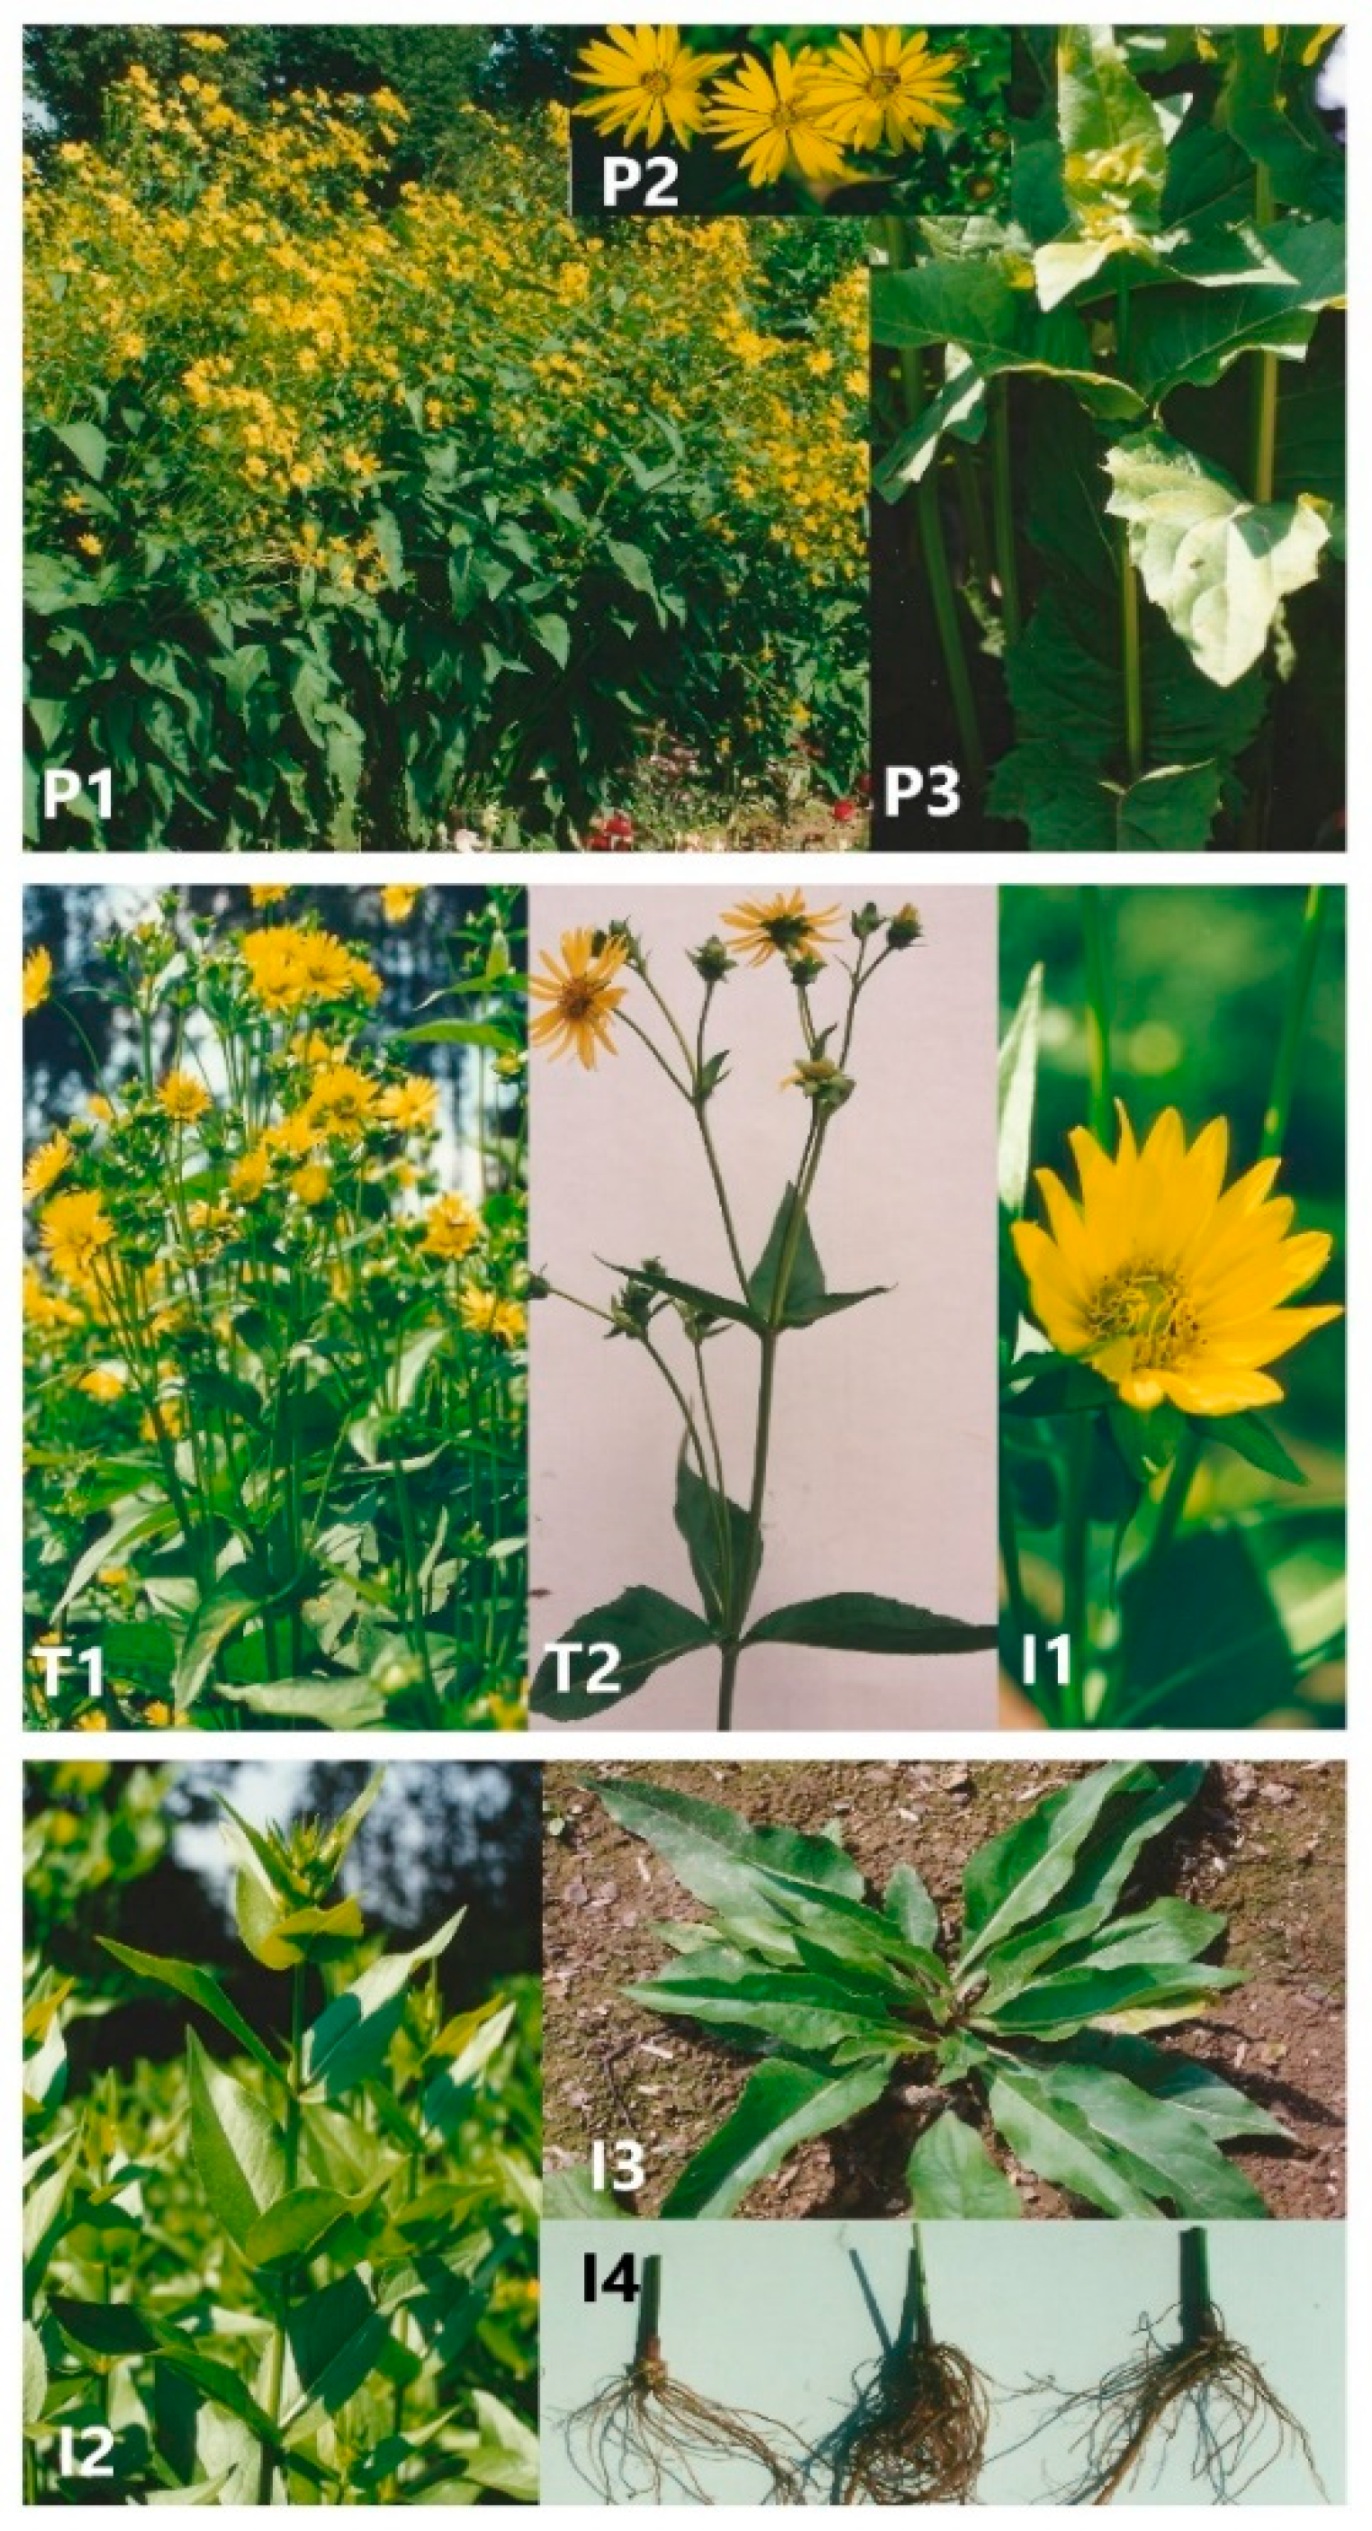
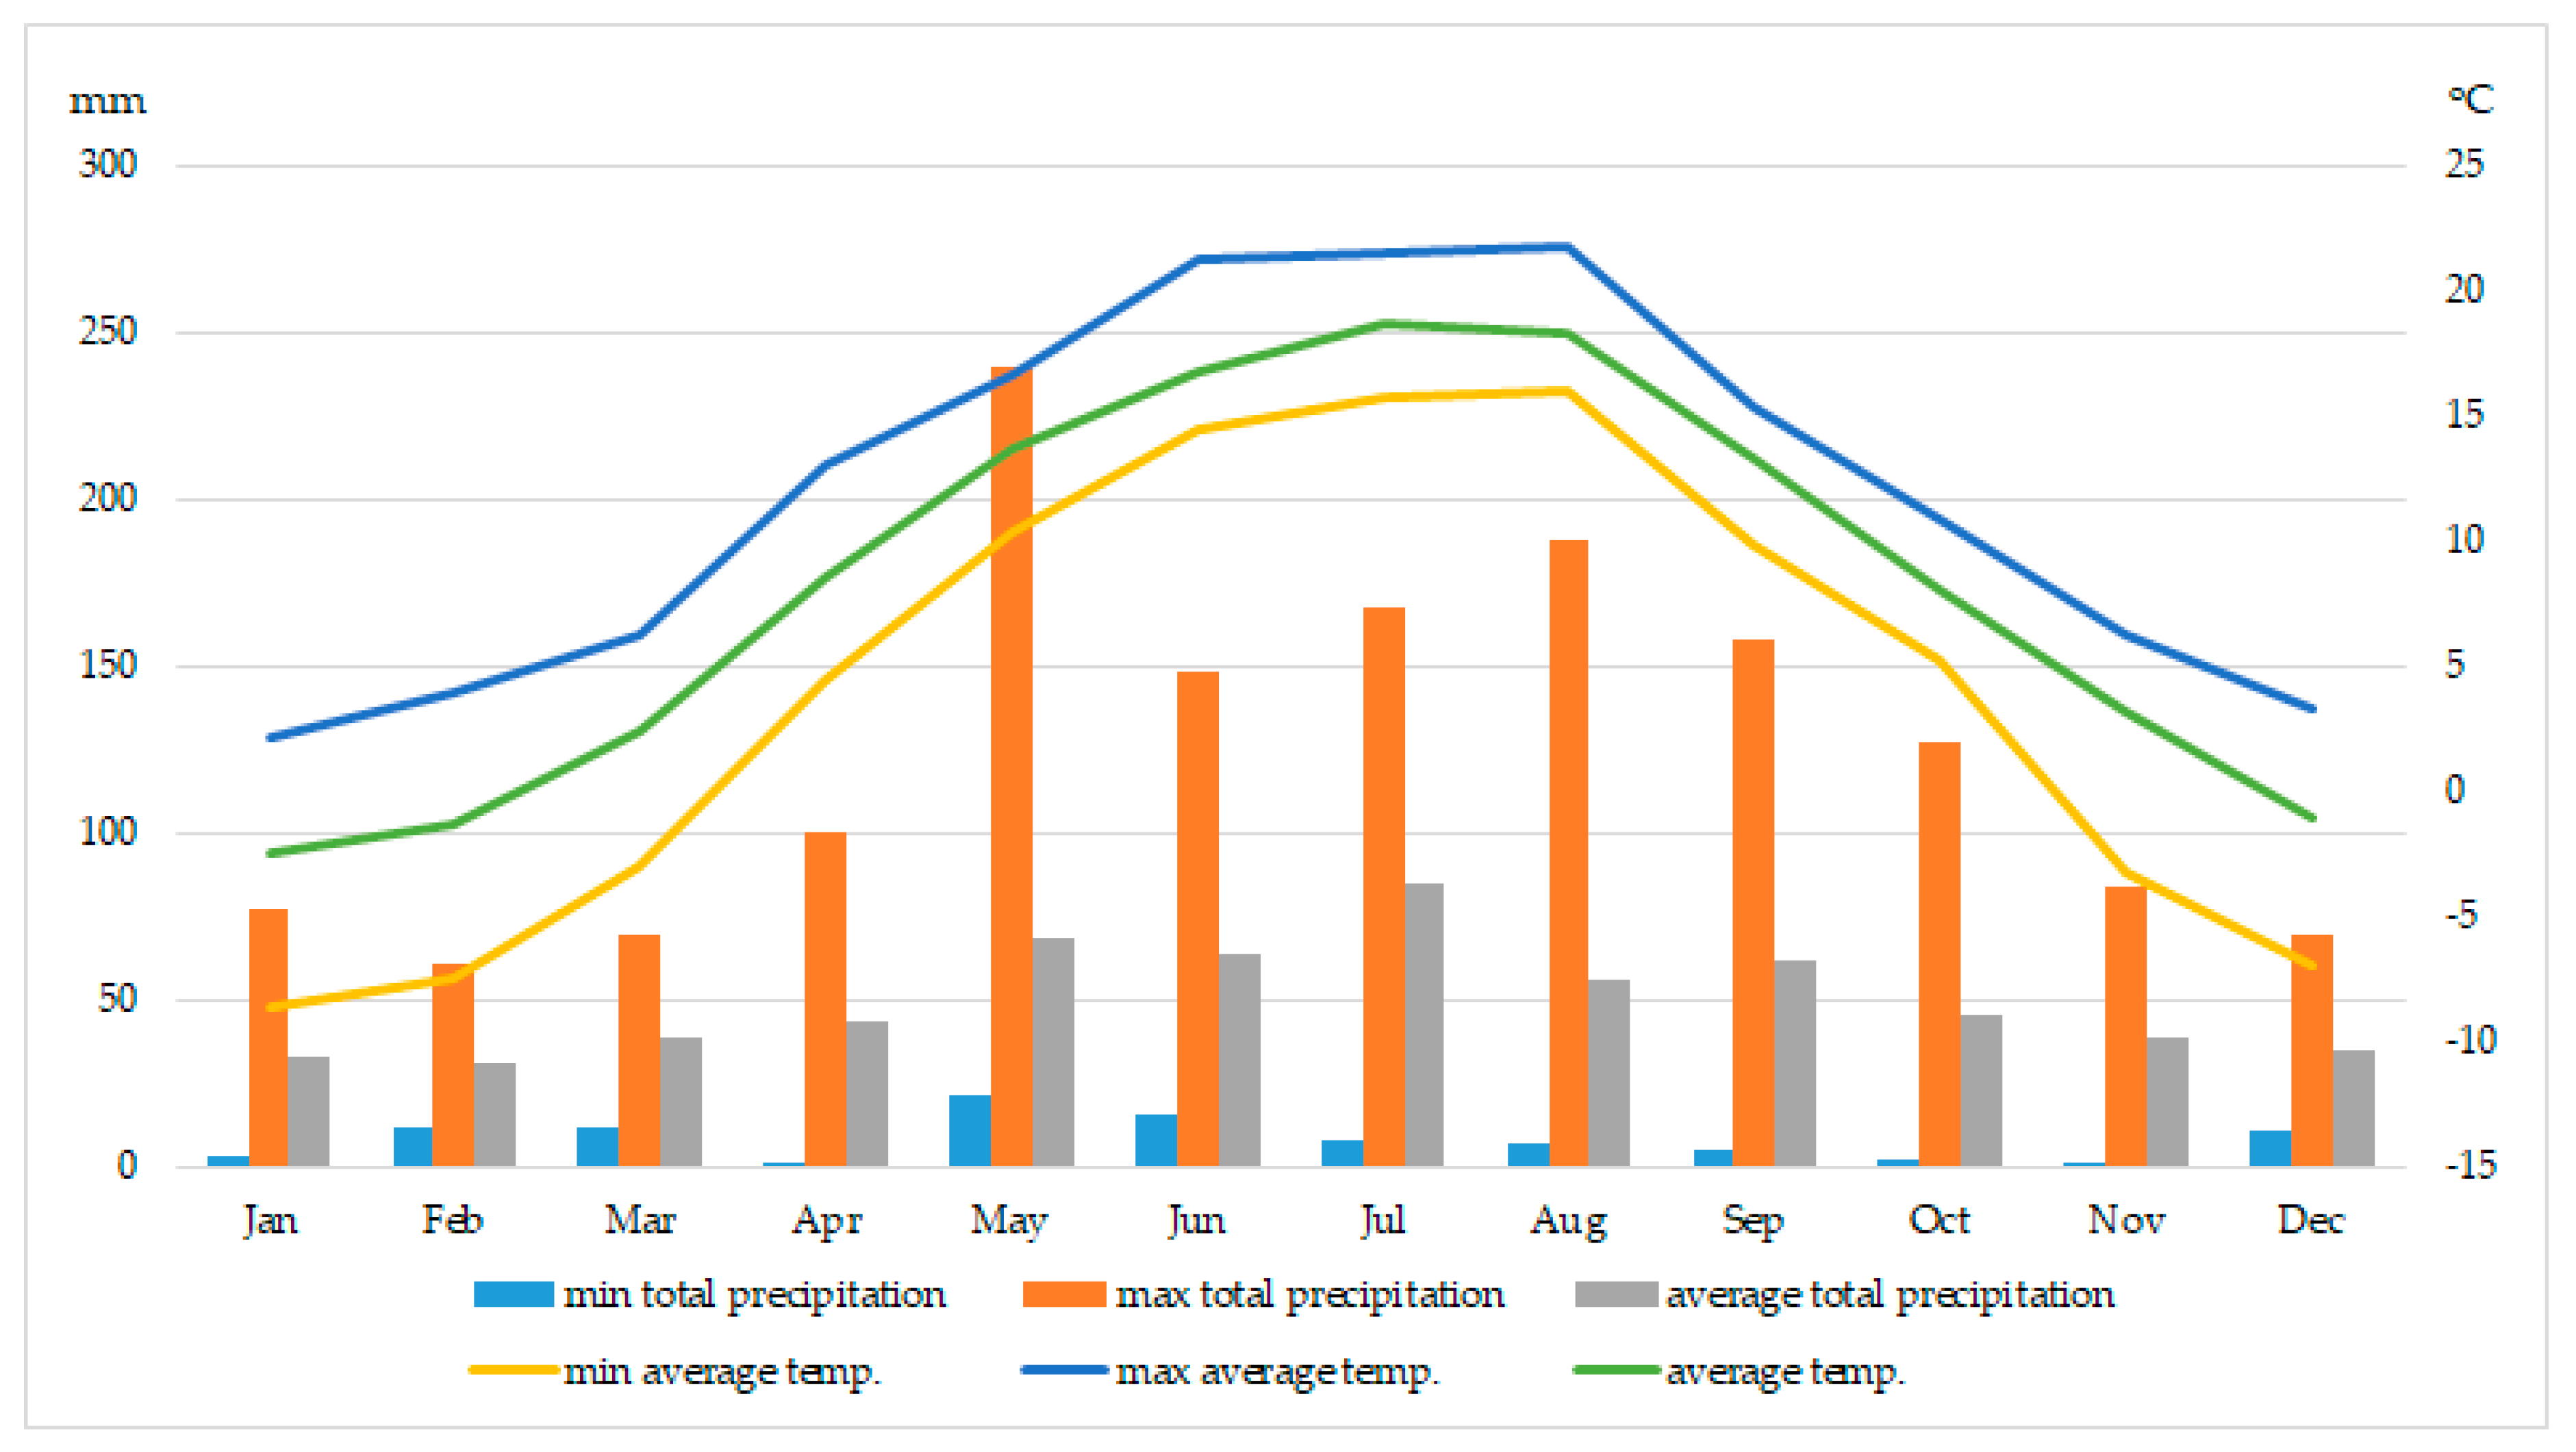
The plants material of three Silphium species (S. perfoliatum, S. trifoliatum, and S. integrifolium–Figure 1, Table 1) was acquired from cultivation (2012–2014) in an allotment garden (Lubartów, N 51°27′41.0394″, E 22°37′5.8152″, located in the eastern part of the Lubartów upland which forms a part of the much larger south Podlasie lowland). The presence of continental influences with great amplitudes of annual temperatures, as well as long summers and long cool winters, is characteristic of this area. The length of the growing season in this region is from 190 to 200 days. This area is not included in the hail strip. The last spring frosts are usually recorded in May, and the first autumn frosts take place in October. Figure 2 shows the thermal conditions and rainfall between 1990 to 2019, characteristic of the growing region. The vegetative propagating material consisted of seeds and rhizomes originating from experiments that have been described earlier together with the morphological and anatomical characterisation of the species under study [27,29,31,32,33].
2.2. Evaluation of Proximate Chemical Composition
The plants collected were determined for DM content by the use of a moisture analyser (Radwag WPS50SW) after drying samples at 100 °C; ash after dry digestion at 550 °C [34]; total and reducing soluble sugars of the Luff–Schoorl (LS) titrimetric method by the AOAC method 942.15 [35]; L-ascorbic acid-vitamin C [36], chlorophyll [37], and total tannin by gravimetrically by copper acetate method [38]; cellulose by Kürchner and Hanak’s method [39]; crude fat by means of extraction-gravimetric Soxhlet’s method [40]; and the content of crude protein was determined as 6.25 times the nitrogen content of the sample; nitrogen was determined by the Kjeldahl-method (PN-EN ISO 5983-1:2006) using Kjeltec 2300 apparatus (FOSS, Hoganas, Sweden) after prior mineralisation with H2SO4 in the Tecator Digestor Auto 20 system (FOSS, Hoganas, Sweden). All analyses were performed in triplicate.
2.3. Evaluation of the Contents of Mineral Components and Trace Elements
The content of minerals in the analysed Silphium species was determined after prior microwave mineralisation [41]. Approximately 0.5 g of plants sample were placed in a Teflon vessel. Then, 10 mL of 65% HNO3 (suprapur grade) supplied by (Merck, Darmstadt, Germany) was added into the vessel and the sealed vessel was put into microwave mineraliser MARS Express (CEM, Matthews, NC, USA). The microwave mineralisation was performed stepwise at 400 W and 363 K, at 800 W and 393 K, at 1600 W and 483 K. The cooled digestion solution was then diluted to 50 mL using high purity deionised water.
2.3.1. AAS
The concentration of minerals, i.e., Na, K, Ca, Mg, Zn, Fe, Mn, Cr, and Cu, was determined by AAS (atomic absorption spectroscopy) method using a spectrometer SpectrAA 280 FS with autosampler SPS 3 (Varian, Melbourne, Australia), which was equipped with a deuterium lamp, hollow cathode lamp for each element and an air-acetylene burner. In order to avoid sample ionisation during potassium analysis, Schinkel buffer solution (mixture contents 10 g·L−1 cesium chloride and 100 g·L−1 lanthanum chloride) was used.
2.3.2. ICP–MS
To determine Se, Pb, Cd, and As of the plant samples, the inductively coupled plasma mass spectrometer ICP-MS 820-MS (Varian, Mulgrave, Australia) with quadrupole mass analyser was used. The instrumental conditions for trace elements determination by ICP–MS were as follows: plasma: argon plasma; plasma flow: 18 L·min−1; auxiliary flow: 1.8 L·min−1; stealth gas flow: 0.12 L·min−1; nebuliser flow: 0.95 L·min−1; sampling depth: 6 mm; RF power: 1,35 kW; pump rate: 0.1 Hz; stabilisation delay: 35 s; first extraction lens: 5 V; second extraction lens: 190 V; third extraction lens: 225 V; corner lens: 200 V; left mirror lens: 39 V; right mirror lens: 34 V; bottom mirror lens: 36 V; entrance lens: 1.00 V; fringe bias: −2.90 V; entrance plate: −39 V.
All certified single-element standard solutions used to prepare the calibration curve (1000 mg·L−1) used were of the highest purity grade (99.999%) and were supplied by Ultra Scientific. The calibration standards for ICP–MS and AAS analysis were prepared by diluting solutions in 1% HNO3 and in high purity deionised water, respectively. The results were expressed in mg·100−1·g−1 of dry matter (DM). During the analysis, the analytical quality was controlled by means of measurement of a blind sample, a double sample, and the certified reference materials: tea leaves (INCT-TL-1) and mixed polish herbs (INCT-MPH-2) (Table 2).
2.4. Isolation and Chromatographic Analysis of Protein Amino Acids
In order to determine the amino acid composition, plant samples were hydrolysed in 6 mol·L−1 HCl [42]. In addition, separate samples were subjected to oxidation hydrolysis to determine the sulfuric amino acids [43]. Amino acid composition in hydrolysates (with ninhydrin post-column derivatisation) was recorded using an automatic amino acid analyser AAA 400 (INGOS Praha) with UV–vis (λ = 570 nm) detector [32].
2.5. Statistical Analysis
Data were analysed using one-way ANOVA followed by Duncan’s test using the SAS statistical system (SAS Version 9.1, SAS Inst., Cary, NC, USA). The significance of all tests was set at p ≤ 0.05.
3. Results and Discussion
3.1. Dry Matter (DM)
In the first year of cultivation (2012–2014, harvest term E), leaves of the analysed species of Silphium had an average DM content in the range from 14.3% (S. perfoliatum) to 15.6% (S. integrifolium) (Table 3, Table 4 and Table 5). The average content of DM in the leaves, stems, flowers, and rhizomes of perennial plants was, respectively, up to 22.6% (S. trifoliatum—leaves—E), up to 29.7% (S. integrifolium—stems—E), up to 20.3% (S. integrifolium—flowers—C), and up to 37.6% (S. trifoliatum—rhizomes—F). With the regrowth of the plants, an increase of DM content was observed in the leaves and stems of the analysed plants. In the initial growth stage (A), the leaves were characterised by the two-fold lower content of DM compared to material from the previous harvest, while stems from the September harvest even had about four-fold more DM compared to material harvested at the start of vegetation in May. Statistically significant differences were demonstrated for mean levels of DM in the analysed organs of the plants.
Glyaubertene and Ivanovskaya [44] obtained the following results of DM content in aboveground organs of S. perfoliatum in the period from the stage of spring regrowth to the stage of full flowering and fructification: in leaves—from 12.8% to 20.1%, and in stems—from 6.7% to 17.8%. In the study conducted in Polish conditions, other authors obtained in the aboveground parts of S. perfoliatum contents of DM from 8.8% (at the start of vegetation) to 25.1% (in the stage of fructification) [45]. The continuation study conducted within that scope of research in Bydgoszcz (Poland) revealed that S. perfoliatum contained DM in amounts from 14.9% to 24.3%, depending on the plant development stage [46].
High yields of green matter also determine the potential use of plants. According to a three-year study by Daniel and Rompf [3], DM yield of S. perfoliatum fell within the range from approximately 19.2 t·ha−1 (for plants harvested in the stage before the formation of flower buds and at plant height of 144 cm) to about 29.3 t·ha−1 (for plants harvested at the flowering stage, at plant height of 248 cm). The average yields of DM for plants of S. perfoliatum, S. trifoliatum, and S. integrifolium were as follows: approx. 2.9, 2.4, and 2.2 t·ha−1 for plants harvested in the stage of spring regrowth, approx. 12.5, 10.7, and 9.9 t·ha−1 for plants in the flower bud stage, and approx. 36.6, 28.8, and 17.8 t·ha−1 for plants harvested at the beginning of the blooming stage, respectively [27,29,31].
3.2. Ash
Among the analysed aboveground and underground organs of plants from the species of Silphium, leaves had the highest ash content in DM (Table 3, Table 4 and Table 5). In leaves of annual plants harvested in September (E), the average ash content was up to approx. 16.8% (S. trifoliatum). For perennial plants, the following ash content levels were determined in the leaves, stems, flowers, and rhizomes, respectively: up to 19.7% (S. perfoliatum—leaves—E), up to 20.9% (S. integrifolium—stems—A), up to 14.0% (S. integrifolium—flowers—C), up to 9.3% (S. perfoliatum—rhizomes—F). In the May harvest (A), the content of ash in stems was comparable to the level of that parameter in leaves harvested at the same time and amounted to, on average, 20.9% (S. integrifolium—stems—A), and then decreased with the growth of the plant. Statistically significant differences were noted for mean ash content levels in the particular organs of the analysed species of Silphium. The literature provides only data on the content of ash in the aboveground organs of S. perfoliatum. In leaves of S. perfoliatum harvested at the start of vegetation, ash content of comparable with that in stems, and with the growth of the plant, those values diverged and amounted to approx. 14% DM for the leaves and approx. 7% for the stems in the case of plants in the blooming stage, while in the stage of fructification ash content in the leaves was determined at 12%, and in the stems—5% [2,44,47]. To compare the content of ash in the aboveground parts of S. perfoliatum to Jerusalem artichoke Helianthus tuberosus, the values obtained were 9.2% and 7.9% DM, respectively [48].
3.3. Water-Soluble Sugars and Cellulose
Leaves of annual plants of the analysed species of Silphium had the following levels of mean total sugars content in DM – up to 13.4% (S. trifoliatum) and up to 8.2% (S. perfoliatum) (Table 3, Table 4 and Table 5). Leaves of perennial plants had the highest content of total sugars in the stage of spring regrowth (A), up to 14.7% DM (S. trifoliatum), in which approx. 37.8% were reducing sugars (5.6% DM). With the growth of the plants, the content of total sugars in leaves decreased. Comparing the content of sugars in the aboveground and underground organs of perennial plants, it was noted that the highest level of total sugars was found in the rhizomes, on average up to 26.7% DM (S. perfoliatum), while the corresponding content of reducing sugars in the rhizomes was from 1.8% to 2.9% DM. The dominant water-soluble sugars in the rhizomes are complex sugars, with levels from 21.7% to 26.7% DM. From the rhizomes and leaves of S. perfoliatum, S. trifoliatum and S. integrifolium inulin was isolated in amounts of up to 38.3% DM—S. trifoliatum, up to 34.0% DM—S. perfoliatum, and up to 33.3% DM—S. integrifolium [30].
Stems of the species of Silphium are also a rich source of water-soluble carbohydrates. The average level of total sugars and reducing sugars in the stems was from 3.1% DM (S. integrifolium) to 19.1% (S. trifoliatum), and from 0.8% DM (S. integrifolium) to 17.7% DM (S. trifoliatum), respectively. Significant differences were noted between the mean levels of water-soluble sugars for the analysed organs of the plants. The literature provides data only on the level of soluble sugars in the aboveground parts of S. perfoliatum. As reported by Bek and Anikeenko [49], Pavlov et al. [50], and by Daniel and Rompf [3], the fraction of soluble carbohydrates in S. perfoliatum constituted a total of from about 12% to approximately 21% DM of the entire aboveground parts, the leaves containing up to 9.9% total sugars while the stems were up to 24.5%. The levels of monosaccharides in S. perfoliatum are more than twice as high as the content of disaccharides.
The study shows that with the growth of the plants, there was an increase in the content of cellulose. In the leaves and stems of the three species of Silphium, the following levels of cellulose were determined: up to 22.5% DM (S. integrifolium leaves harvested in term A from perennial cultivation), up to 33.2% DM (S. perfoliatum leaves harvested in term D from annual cultivation), up to 27.7% DM (S. trifoliatum leaves harvested in term D from perennial cultivation), up to 27.5% DM (S. perfoliatum stems harvested in term A from perennial cultivation), and up to 42.9% DM (S. trifoliatum stems harvested in term D from perennial cultivation). The inflorescences of the studied species contained cellulose in the range of 24% to 28% DM, whereas, in the rhizomes of the Silphium species, about 25% to 26% cellulose was found. In the flowering phase, the stems of the plants become more lignified and harder to break, which is related to an increase in the levels of hard soluble carbohydrates, cellulose and lignin. In relation to this, from the moment of flowering, there takes place a rapid deterioration of digestibility and nutritional value of most nutrients of S. perfoliatum. That is explained by the results of studies on the variation of the content of cellulose in aboveground parts of S. perfoliatum: from approx. 14.3% DM in the stage of spring regrowth to about 39.7% in the stage of fructification [1,44,50,51,52]. Glyaubertene and Ivanovskaya [44] and Pavlov et al. [50] report that stems of S. perfoliatum contain up to three-fold more cellulose compared to its content in the leaves, i.e., approx. 30%–35% and 11%, respectively, converted to DM. A study conducted in the Republic of Moldova demonstrated that green matter of S. perfoliatum contains cellulose in the amount of 24.7% DM [53]. To compare the content of cellulose in S. perfoliatum to that in Jerusalem artichoke Helianthus tuberosus, the values obtained were 30.0% and 21.3%, respectively [48].
3.4. Crude Protein
Leaves collected from annual plants of the species of Silphium contained, on average, up to 18.37% of total protein (S. perfoliatum) (Table 3, Table 4 and Table 5). The lowest content of crude protein was characteristic of leaves of annual S. trifoliatum at the level of 12.7% DM. In the case of perennial plants, the content of protein decreased over the entire period of plant vegetation. Leaves of S. perfoliatum harvested at the beginning of May, when the plants were in the stage of spring regrowth (A), contained, in the years of the study, an average of 22.9% of total protein. The content of total protein in leaves of S. trifoliatum and S. integrifolium decreased in the May (A) to September (E) period as follows: from 19.1% to 13.0% and from 18.4% to 12.0%, respectively. Stems were characterised by statistically significantly lower average levels of total protein relative to the leaves.
As in the case of other analysed components from the group of primary metabolites, the literature provides only data concerning protein content in the species S. perfoliatum. In another study, also conducted in Poland, it was noted that green matter of S. perfoliatum contained total protein at levels from 6.2% (in the stage of fructification) to 17.0% (at the start of vegetation) [45]. In a continued experiment by the cited authors, aboveground organs of S. perfoliatum had an even lower content of protein, i.e., from 4.9% to 8.5% [46]. Green matter acquired from plants of S. perfoliatum cultivated at other geographical latitudes, like in the study presented here, was characterised by a considerable total protein content from 8.6% to 32.1% DM, and of protein proper from 7.3% to 21.9% DM [1,3,49,50,53,54,55,56,57,58,59,60]. There is an interesting comparison of crude protein content in S. perfoliatum and in Jerusalem artichoke Helianthus tuberosus [48], where the values obtained were 15.9% and 9.3%, respectively, in favor of S. perfoliatum. Like in the presented study, the literature reports the highest levels of protein in the stage of spring regrowth, and with the development of plants, the level of that component decreased [44,47,61,62,63].
3.5. Protein Amino Acids
Analysis of the protein fraction of the aboveground organs of species of Silphium revealed the presence of 16 amino acids, i.e., glycine, alanine, valine, leucine, isoleucine, serine, threonine, methionine, aspartic acid, glutamic acid, lysine, arginine, phenylalanine, tyrosine, histidine, proline (Table 6). Exogenic amino acids identified in protein include: leucine (up to 9.4% S. integrifolium), phenylalanine (up to 6.8% S. integrifolium), valine (up to 5.9% S. integrifolium), threonine (up to 6.3% S. trifoliatum), lysine (up to 5.3% S. integrifolium), isoleucine (up to 4.6% S. integrifolium), tyrosine (up to 3.5% S. integrifolium), cysteine (up to 1.0% S. perfoliatum), and methionine (up to 1.2% S. integrifolium. The high content of lysine is noteworthy here, which is a deficit amino acid of vegetable proteins. Among the remaining amino acids, the dominant ones are aspartic acid (up to 12.0% S. trifoliatum), glutamic acid (up to 9.5% S. integrifolium), and glycine (up to 7.7% S. integrifolium). Leaves and herbage of the analysed three species of Silphium are characterised by a similar quantitative composition of the amino acids in specific protein. This experiment confirmed the beneficial participation of exogenic amino acids in protein occurring in the herbage of S. perfoliatum.
Duranti et al. [1] reported that the amino acid composition of protein of the herbage of S. perfoliatum included exogenic amino acids, i.e., leucine—mean of 8.6% of specific protein, valine—mean of 6.2%, isoleucine—mean of 5.1%, lysine—mean of 4.2%, phenylalanine—mean of 5.7%, threonine—mean of 4.8%, tyrosine—mean of 3.8%, and methionine—mean of 1.9%. It is interesting to compare the amino acid profile of protein in S. perfoliatum to that in Jerusalem artichoke Helianthus tuberosus [48], where the cited authors obtained the respective levels: aspartic acid 9.4% and 6.4%, glutamic acid 9.3% and 8.9%, glycine 4.8% and 3.9%, leucine 9.7% and 5.4%, phenylalanine 4.1% and 6.5%, threonine 4.5% and 3.3%, methionine 3.5% and 0.6%, valine 4.4% and 4.0%, isoleucine 4.1% and 3.1%, and tyrosine 6.8% and 4.0%. The cited study indicates that the amino acid profile of the protein of S. perfoliatum contains higher levels of exogenic amino acids compared to Jerusalem artichoke.
3.6. Crude Fat
In the years of the study, leaves of annual plants of the analysed species of Silphium contained, on average, approximately 1.5% of crude fat. In the case of organs of perennial plants, the highest content of crude fat was noted in inflorescences of S. perfoliatum (the average of approx. 4%) compared to inflorescences of the other analysed species (the average of approx. 0.5%; Table 3, Table 4 and Table 5). Leaves of perennial plants of Silphium were characterised by crude fat content above 2% over the entire period of harvest. Crude fat content in the rhizomes of the plants was, on average, approximately 1% in the years of the study. The content of lipids in the stems was in the range of approx. 0.6%–0.9% for all harvests, with a mean of 0.76%, the highest fat content being observed in the stage of flowering and fructification. Statistically significant differences were noted in fat content between the analysed plant organs and times of harvest.
Unfortunately, the literature does not provide any characterisation of the species S. trifoliatum and S. integrifolium in terms of their content of fat. Fat content in the aboveground parts of S. perfoliatum is varied [61,64]. In an experiment conducted in Polish conditions, crude fat content in the aboveground parts of plants varied from 1.9% (at the start of vegetation) to 2.9% (in the stage of fructification) [45]. A study conducted in the Republic of Moldova showed that green matter of S. perfoliatum contains crude fat in the amount of 2.3% DM [53]. Glyaubertene and Ivanovskaya [44] obtained considerably higher values, and so, e.g., leaves and stems of S. perfoliatum in the stage of spring regrowth had fat contents of 3.6%–4.4% and 3.2%–4.2%, respectively, while in the blooming stage the corresponding values were 5.7% and 4.6%, indicating an increase compared to the previous harvest. There is an interesting comparison of the content of crude fat in S. perfoliatum and Jerusalem artichoke Helianthus tuberosus [48], in which the values obtained were 3.25% and 1.93%, respectively, in favor of S. perfoliatum.
3.7. L-Ascorbic Acid
Leaves of the analysed species of Silphium had the highest content of L-ascorbic acid relative to the other analysed organs (Table 3, Table 4 and Table 5). In leaves of annual plants, the average content of vitamin C was approx. 300 mg·100−1·g−1. In leaves acquired from perennial plants, the highest level of vitamin C was noted for S. integrifolium, mean of 779 mg·100−1·g−1, in the May harvest (A) in the stage of fast regrowth. In the stems of the analysed species of Silphium the highest levels of L-ascorbic acid were noted in the harvest in the stage of spring regrowth (A; average of 142–197 mg·100−1·g−1). With the development of the plants, the content of vitamin C in the stems decreased, attaining levels below the threshold of detection in harvests D and E. Inflorescences of the Silphium species had vitamin C levels from 156 mg·100−1·g−1 to 339 mg·100−1·g−1, while in the underground parts of the plants the level of vitamin C was below the threshold of detection.
Taking into account published reports on the content of L-ascorbic acid, one should note that at the beginning of vegetation S. perfoliatum species are characterised by the highest content of that substance, relative to plants harvested at later stages of development, i.e., from 140 to 500 mg·100−1·g−1 DM in leaves and up to 20 mg·100−1·g−1 in stems [47,49,65,66]. In the presented study, considerably higher levels of L-ascorbic acid were noted in stems of plants harvested in the stage of spring regrowth, compared to the literature data. For comparison, the content of L-ascorbic acid in herbage of nettle is from 36 to 269 mg·100−1·g−1, which is a level comparable to that of Silphium species [67].
3.8. Chlorophyll
The study shows that leaves of the three species of Silphium, harvested at the beginning of flowering (C), were characterised by the highest content of chlorophyll, i.e., from 1.5% (S. integrifolium) to 2.3% (S. perfoliatum) (Table 3, Table 4 and Table 5). That content corresponds with the level of magnesium (a component of chlorophyll) in the aboveground parts, where a higher level of that element was observed in leaves, compared to stems, with a similar trend in the case of chlorophyll. Statistical analysis of the mean levels of chlorophyll for the various organs revealed significant differences in its content. In the available literature, there is a lack of information on the content of chlorophyll in species from the genus Silphium. In comparison, the chlorophyll content in nettle herbage varies from 0.3% to 1%, which is a level comparable to that of Silphium species [67]. Silphium species can be a source of that pigment, e.g., for food products.
3.9. Tannins
Leaves of annual plants of Silphium, harvested in September (E), had average tannin levels from 7.3% w S. perfoliatum to 8.9% w S. trifoliatum (Table 3, Table 4 and Table 5). In perennial plants, the highest levels of tannins were noted in leaves collected from plants in the stage of flower buds (B) at the beginning of June: mean levels from 9.6% in S. perfoliatum and S. integrifolium to 11.2% in S. trifoliatum. Inflorescences had tannin content from 8.4% (S. perfoliatum) to 11.4% (S. integrifolium). The material with the lowest levels tanning was the rhizomes, in which the mean tannin content was determined at from 5.7% (S. perfoliatum) to 7.5% (S. trifoliatum). Statistical analysis of mean levels of tannins for the various plant organs revealed significant differences in the content of those components.
3.10. Minerals, Trace Elements and Heavy Metals
Table 3, Table 4 and Table 5 compiles the data of the content of minerals and trace elements and also heavy metal content in the tested plants. These data are quite differentiated, which is probably affected by the species-specific traits. In general, the content of mineral compounds in Silphium plants is one of the important traits influencing their use-value. Leaves and inflorescences of S. perfoliatum, S. trifoliatum and S. integrifolium can be a supplementary source of mineral elements such as K (from about 3.0 g·100−1·g−1 for S. trifoliatum inflorescences to about 3.8 g·100−1·g−1 for S. integrifolium leaves), Ca (from about 1.2 g·100−1·g−1 for S. perfoliatum inflorescences to about 4.5 g·100−1·g−1 for S.integrifolium leaves) or Mg (from about 206 mg for S. trifoliatum inflorescences to about 333 mg·100−1·g−1 for S. integrifolium leaves), as well as trace elements, e.g., Fe (from about 8 mg in the inflorescences of all three species to about 27 mg·100−1·g−1 for S. perfoliatum and S. trifoliatum and leaves) and Mn (from about 3 mg in the inflorescences of all three species to about 6 mg in the leaves). The content of heavy metals was levels lower that the permissible limits for food products [68]. Studies were carried out on the content of metals in S. perfoliatum in the aspect of use of that species as a phytoremediation plant. In an experiment, in the control group of plants, which were not burdened with the application of metal salts to the soil, the authors of that experiment noted the following levels of macroelements and trace metals in DM of aboveground parts of the plants: K 1.2 g·100−1·g−1, Ca 0.8 g·100−1·g−1, Mg 630 mg·100−1·g−1, Mn 24.4 mg·100−1·g−1, Fe 8.5 mg·100−1·g−1, Cr 0.02 mg·100−1·g−1 [69], those levels being lower than the levels observed in the presented study.
There is an interesting comparison of the content of metals in S. perfoliatum to that in Jerusalem artichoke Helianthus tuberosus [48], where the cited authors obtained the following respective levels: Na 5.6 and 19.7 mg·100−1·g−1, Fe 12.8 and 15.6 mg·100−1·g−1, Mn 2.5 and 6.0 mg·100−1·g−1, Zn 2.0 and 2.0 mg·100−1·g−1, Cu 0.4 and 0.3 mg·100−1·g−1, Mg 0.3 and 0.4 mg·100−1·g−1, Ca 1.7 and 1.3 mg·100−1·g−1, K 2.4 and 1.6 mg·100−1·g−1, which is in support of the values obtained in the presented study with regard to S. perfoliatum.
Summarising the data obtained in the study and literature reports on the content of primary metabolites and minerals in aboveground organs of S. perfoliatum, one can conclude that the plant is characterised by potential which can be used for food and feed purposes [1,3,44,50,52,54,55,59,61,62,64,65,70,71]. In addition, research concerning S.trifoliatum and S. integrigfolium, which was conducted in the presented scope for the first time for the analysed species, indicates that those plants are also characterised by a valuable chemical composition which predisposes them as a source of organic raw material for various applications. The analysis of the chemical composition of perennial plants in the course of their ontogenesis revealed that the vegetative organs of the analysed species of Silphium, intensively assimilating CO2 in the stage spring regrowth (A), have the highest content of primary metabolites and minerals in DM. With further growth and development of the analysed plants, a decrease was noted in the content of primary metabolites and minerals. In the blooming stage of the plants, a further decrease in the content of primary metabolites and minerals was observed.
Summarising the results on the variation of the composition of primary metabolites and minerals in the course of ontogenesis of perennial plants of Silphium, one can conclude that biomass with the highest content of protein, water-soluble carbohydrates, fats, and L-ascorbic acid, can be acquired from plants harvested at an early stage of development. However, as yields obtained in that plant development stage are not economically viable, the optimum harvest time can be the period between the appearance of flower buds and the start of the blooming stage. Any later time of green matter harvest involves the risk of a significant reduction of its feed and nutritional values.
4. Conclusions
Content of protein, amino acids, fat, cellulose, water-soluble sugars and mineral substances in the tested Silphium species (S. perfoliatum, S. trifoliatum and S. integrifolium) can be an important criterion determining a positive evaluation of these plants as sources of alternative raw materials. The presented results are meant to draw attention to the possibility of use of the biomass of three Silphium species as a potential source of ecological and renewable raw material for food, pharmaceuticals, feed, and possibly also energy generation purposes.
Author Contributions
G.K. and R.K. conceived the research idea and experimental protocol; G.K. coordinated the research; G.K. and R.K. wrote the manuscript; G.K. and R.K. managed writing-review and editing; G.K., U.P., and R.K. had the supervision task; G.K., U.P., and R.K. were involved in crop management and performed the determinations of biochemical and physiological analyses; G.K. managed the data statistical processing; G.K., U.P., and R.K. were involved in bibliographic search. All authors have read and agreed to the published version of the manuscript.
Funding
This work was financed by a statutory activity subsidy from the Polish Ministry of Science and Higher Education for the Faculty of Food Science and Biotechnology of University of Life Sciences in Lublin and for the Faculty of Agrobioengineering of University of Life Sciences in Lublin.
Conflicts of Interest
The authors declare that they have no conflicts of interest to disclose.
References
- Duranti, E.; Santilocchi, R.; Casoli, C. Composizione chimica e valore nutritivo di Silphium perfoliatum L. conservato mediante insilamento. Zootec. Nutr. Anim. 1988, 14, 349–356. [Google Scholar]
- Davidyants, E.S.; Abubakirov, N.K. Chimičeskij sostav i perspektivy ispol’zowaniya rasteniy r. Silphium L. Rastit. Resur. 1992, 28, 118–128. [Google Scholar]
- Daniel, P.; Rompf, R. Möglichkeiten und Grenzen der Nutzung der Durchwachsenen Silphie (Silphium perfoliatum L.) als Futter-, nachwachsenole Rohstoff- und Landschaftspflegepflanze. Agribiol. Res. 1994, 47, 345–353. [Google Scholar]
- Bohlmann, F.; Jakupovic, J. Neue labdan-derivate und sesquiterpene aus Silphium-arten. Phytochemistry 1979, 18, 1987–1992. [Google Scholar] [CrossRef]
- Bohlmann, F.; Jakupovic, J. Neue Sesquiterpen-Kohlenwasserstoffe mit anomalen Kohlenstoffgerüst aus Silphium-arten. Phytochemistry 1980, 19, 259–265. [Google Scholar] [CrossRef]
- Kowalski, R. The chemical composition of essential oils and lipophilic extracts of Silphium integrifolium Michx. and Silphium trifoliatum L. rhizomes. J. Essent. Oil Res. 2008, 20, 255–259. [Google Scholar] [CrossRef]
- Kowalski, R. Antimicrobial activity of essential oils and extracts of rosinweed (Silphium trifoliatum and Silphium integrifolium) plants used by the American Indians. Flavour Fragr. J. 2008, 23, 426–433. [Google Scholar] [CrossRef]
- Kowalski, R.; Wolski, T. The chemical composition of essential oils of Silphium perfoliatum L. Flavour Fragr. J. 2005, 20, 306–310. [Google Scholar] [CrossRef]
- Kowalski, R. Analysis of lipophilic fraction from leaves, inflorescences and rhizomes of Silphium perfoliatum L. Acta Soc. Bot. Pol. 2005, 74, 5–10. [Google Scholar] [CrossRef] [Green Version]
- Kowalski, R.; Baj, T.; Kowalska, G.; Pankiewicz, U. Estimation of potential availability of essential oil in some brands of herbal teas and herbal dietary supplements. PLoS ONE 2015, 10, e0130714. [Google Scholar] [CrossRef] [Green Version]
- Wolski, T.; Kowalski, R.; Mardarowicz, M. Chromatographic analysis of essential oil occuring in inflorescences, leaves and rhizomes of Silphium perfoliatum L. Herba Pol. 2000, 46, 235–242. [Google Scholar]
- Kowalski, R. Selected secondary metabolites in leaves, inflorescences, and rhizomes of Silphium perfoliatum L.—Alternative herbal plant. Folia Hortic. 2003, 15, 203–209. [Google Scholar]
- El-Sayed, N.H.; Wojcińska, M.; Drost-Karbowska, K.; Matławska, I.; Williams, J.; Mabry, T.J. Kaempferol triosides from Silphium perfoliatum. Phytochemistry 2002, 60, 835–838. [Google Scholar] [CrossRef]
- Kowalski, R.; Wolski, T. TLC and HPLC analysis of the phenolic acids in Silphium perfoliatum L. leaves, inflorescences and rhizomes. J. Planar Chromatogr. Mod. TLC 2003, 16, 230–236. [Google Scholar] [CrossRef]
- Kowalski, R.; Wolski, T. Evaluation of phenolic acid content in Silphium perfoliatum L. leaves, inflorescences and rhizomes. Electron. J. Polish Agric. Univ. 2003, 6, 3. [Google Scholar]
- Kowalski, R.; Wierciński, J. Phenolic acids in leaves of three Silphium L. species. Polish J. Food Nutr. Sci. 2003, 53, 17–20. [Google Scholar]
- Kowalski, R. Studies of selected plant raw materials as alternative sources of triterpenes of oleanolic and ursolic acid types. J. Agric. Food Chem. 2007, 55, 656–662. [Google Scholar] [CrossRef]
- Kowalski, R. Ocena zawartości oleanozydów w organach nadziemnych i podziemnych rożnika przerośniętego Silphium perfoliatum L. Acta Sci. Pol. Hortorum Cultus 2002, 1, 5–15. [Google Scholar]
- Han, K.J.; Albrecht, K.A.; Muck, R.E.; Kim, D.A. Moisture effect on fermentation characteristics of cup-plant silage. Asian Australas. J. Anim. Sci. 2000, 13, 636–640. [Google Scholar] [CrossRef]
- Han, K.J.; Albrecht, K.A.; Mertens, D.R.; Kim, D.A. Comparison of in vitro digestion kinetics of cup-plant and alfalfa. Asian Australas. J. Anim. Sci. 2000, 13, 641–644. [Google Scholar] [CrossRef]
- Wróblewska, A. Badania wartości pszczelarskiej Silphium perfoliatum L. In Proceedings of the Materiały I Ogólnopolskiej Konferencji Naukowej “Biologia kwitnienia, nektarowania i zapylania roślin”, Lublin, Poland, 14 October 1997; pp. 59–65. [Google Scholar]
- Kowalski, R.; Kędzia, B. Antibacterial activity of Silphium perfoliatum extracts. Pharm. Biol. 2007, 45, 494–500. [Google Scholar] [CrossRef]
- Kuyanceva, A.M.; Davidyants, E.S. Regenerirujuščaja aktivnost’ ekstrakta Silphium perfoliatum. Farm. Moskwa 1988, 6, 36–37. [Google Scholar]
- Syrov, W.N.; Khushabaktova, Z.A.; Davidyants, E.S. Triterpenowye glikozidy Silphium perfoliatum L. Gipolipidemičeskaja aktiwnost’ sil’fiozida. Khimiko Farmatsevticheskii Zhurnal 1992, 26, 66–69. [Google Scholar]
- Davidyants, E.S.; Kartaševa, I.A.; Nešin, I.W. Vliyanie triterpenovych glikozidov Silphium perfoliatum L. na fitopatogennye griby. Rastit. Resur. 1997, 4, 93–98. [Google Scholar]
- Jamiołkowska, A.; Kowalski, R. In vitro estimate of influence of Silphium perfoliatum L. leaves extract on some fungi colonizing the pepper plants. Acta Sci. Pol. Hortorum Cultus 2012, 11, 43–55. [Google Scholar]
- Kowalski, R. Silphium trifoliatum L.—A new alternative cultivation herbal plant? Acta Agric. Scand. Sect. B Soil Plant Sci. 2007, 57, 155–166. [Google Scholar]
- Kowalski, R. Secondary metabolites in Silphium integrifolium in the first 2 years of cultivation. New Zeal. J. Crop Hortic. Sci. 2004, 32, 397–406. [Google Scholar] [CrossRef]
- Kowalski, R. Growth and development of Silphium integrifolium in the first 3 years of cultivation. New Zeal. J. Crop Hortic. Sci. 2004, 32, 389–395. [Google Scholar] [CrossRef]
- Kowalski, R.; Wierciński, J. Ocena niektórych gatunków Silphium jako surowców inulinowych. Ann. Univ. Mariae Curie Sklodowska, Sect. E 2004, 59, 189–195. [Google Scholar]
- Kowalski, R.; Wolski, T. Charakterystyka wzrostu i rozwoju rożnika przerośniętego Silphium perfoliatum L. w pierwszych latach uprawy. Ann. Univ. Mariae Curie Sklodowska Sect. E 2001, 9, 311–317. [Google Scholar]
- Kowalski, R.; Wierciński, J. Evaluation of chemical composition of some Silphium L. species seeds as alternative foodstuff raw materials. Polish J. Food Nutr. Sci. 2004, 13, 349–354. [Google Scholar]
- Weryszko-Chmielewska, E.; Kowalski, R.; Wolski, T. Rożnik przerośnięty (Silphium perfoliatum L.) nowa roślina alternatywna. Część I. Badania morfologiczne i anatomiczne. Zesz. Probl. Postępów Nauk Rol. 1999, 468, 497–505. [Google Scholar]
- Polish Committee for Standardization. Spices and Condiments—Determination of Total Ash; PN-ISO 928; Polish Committee for Standardization: Warsaw, Poland, 1997. [Google Scholar]
- AOAC. Official Methods of Analysis, 16th ed.; Association of the Official Analytical Chemists: Arlington, VA, USA, 1995. [Google Scholar]
- Polish Committee for Standardization. Foodstuffs—Determination of Vitamin C by HPLC; PN-EN14130:2004; Polish Committee for Standardization: Warsaw, Poland, 2004. [Google Scholar]
- Lichtenthaler, H.K.; Buschmann, C. Chlorophylls and Carotenoids: Measurement and Characterization by UV–VIS Spectroscopy Current Protocols in Food Analytical Chemistry; John Wiley and Sons: New York, NY, USA, 2001. [Google Scholar]
- Ali, A.A.; Ross, S.A.; Mesbah, M.K.; El Moghazy, S.A. Phytochemical study of Limonium axillare (Forssk). Bull. Fac. Pharmacy Cairo Univ. 1991, 29, 59–62. [Google Scholar]
- Skulmowski, J. Methods for Determination of Fodder Composition of and Its Quality; Państwowe Wydawnictwo Rolnicze i Leśne: Warsaw, Poland, 1974. [Google Scholar]
- Polish Committee for Standardization. Animal Feeding Stuffs—Determination of Fat Content; PN-ISO 6492:2005; Polish Committee for Standardization: Warsaw, Poland, 2005. [Google Scholar]
- Kowalska, G.; Kowalski, R.; Hawlena, J.; Rowiński, R. Seeds of oilseed rape as an alternative source of protein and minerals. J. Elem. 2020, 25, 513–522. [Google Scholar]
- Davies, M.G.; Thomas, A.J. An investigation of hydrolytic techniques for the amino acid analysis of foodstuffs. J. Sci. Food Agric. 1973, 24, 1525–1540. [Google Scholar] [CrossRef]
- Moore, S. On the determination of cystine as cysteic acid. J. Biol. Chem. 1963, 238, 235–237. [Google Scholar]
- Glyaubertene, V.F.; Ivanovskaya, K.M. Biologičeskaja i biochimičeskaja charakteristika perspektivnych silosnych rastenij. (22. Soderžanie pitatel’nych veščestv v nadzemnoj masse sil’fii pronzennolistnoy i maral’ego kornja i ich izmenenie vo vremya vegetacii). Liet. TSR Moksl. Akad. Darbai 1987, 4, 110–118. [Google Scholar]
- Piłat, P.; Majtkowski, W.; Majtkowska, G.; Mikołajczak, J.; Góralska, A. The usefulness for ensiling of chosen plant forms of species of silphium genus. J. Cent. Eur. Agric. 2007, 8, 363–368. [Google Scholar]
- Majtkowski, W.; Pilat, J. Perspektywy uprawy i wykorzystania w Polsce roznika przerosnietego [Silphium perfoliatum L.]. Biul. Inst. Hod. i Aklim. Roślin 2009, 251, 283–291. [Google Scholar]
- Nedvaras, A.P.; Marčyuiyonis, V.I. Biologičeskaja i biochimičeskaja charakteristika perspektivnych silosnych rastenij. (20. Rost i razvitie, urožajnost, chimičeskij sostav nadzemnoj časti sil’fii pronzennolistnoy w usloviyach Litovskoy SSR). Liet. TSR Moksl. Akad. Darbai 1987, 3, 37–45. [Google Scholar]
- Ţîţei, V.; Teleuţă, A.; Muntean, A. The perspective of cultivation and utilization of the species Silphium perfoliatum L. and Helianthus tuberosus L. in Moldova. Bull. Univ. Agric. Sci. Vet. Med. Cluj Napoca Agric. 2013, 70, 160–166. [Google Scholar]
- Bek, T.W.; Anikeenko, A.P. Chimičeskij sostaw zelenoj massy sil’fii pronzennolistnoj i sidy mnogoletnej. Naucz. Tech. Bjulleten Vsesojuznogo Instituta Rastenievod. 1983, 136, 50–52. [Google Scholar]
- Pavlov, V.S.; Pachomov, I.J.; Špakov, A.P.; Yakimčik, T.V. Produktivnost sil’fii pronzennolistnoj w zavisimosti ot azotnogo udobreniya. Chim. w Selskim Chozjajstwie 1984, 21, 24–26. [Google Scholar]
- Niqueux, M. Une nouvelle plante fourragére: Le silfe (Silphium perfoliatum L.). Fourrages 1981, 87, 119–136. [Google Scholar]
- Troxler, J.; Daccord, R. Le silfe (Silphium perfoliatum L.): Un fourrage intéressant? Rev. Suisse d’Agriculture 1982, 14, 279–281. [Google Scholar]
- Ţîţei, V. Biological Peculirities of cup plant (Silphium perfoliatum L.) and utilization possibilities in the republic of Moldova. Lucr. Ştiinţifice Ser. Agron. 2014, 57, 289–293. [Google Scholar]
- Čubarova, G.V. Sil’fia pronzennolistnaja—Odna iz perspektivnych silosnych kultur. Životnovodstvo 1971, 8, 17–18. [Google Scholar]
- Filatov, V.I.; Baklanow, A.M.; Lavrov, B.V.A.; Komjagin, N. Produktivnost’ sil’fii pronzennolistnoy v zavisimosti ot prijemov agrotechniki na mieliorirovannych počvach. Izv. TSCHA 1986, 1, 58–63. [Google Scholar]
- Dimitrova, M.; Stefanov, D.; Sanbev, S.; Lazarov, W.; Christov, P. Technologija za schranenie na zelenata masa ot cherakleum i silfium. Životnov’dni Nauk. 1987, 24, 56–61. [Google Scholar]
- Utejš, J.A. Introdukcija i vprovadžennja v kul’turu sil’fii pronizanolistoy. Vestn. AN USSR 1975, 7, 61–65. [Google Scholar]
- Douglas, J.A.; Follett, J.M.; Halliday, J.R.; Hughes, J.W.; Parr, C.R. Silphium: Preliminary research on a possible new forage crop for New Zealand. Proc. Agron. Soc. New Zeal. 1987, 17, 51–53. [Google Scholar]
- Maslinkov, M.; Donev, N. Sravnitelno izpitvane na novi mnogogodišni furažni kulturi pri uslovijata na plovdiv. Rastenev’dni Nauk. 1987, 24, 53–58. [Google Scholar]
- Stuessy, T.F. Heliantheae—Systematic review. In The Biology and Chemistry of the Compositae. II; Heywood, V.H., Harborne, J.B., Turner, B.L., Eds.; Academic Press: London, UK, 1977; pp. 621–672. [Google Scholar]
- Edelšteyn, M.M.; Soloveva, I.W. Sravnitelnaja ocenka kormovych kačestv novych silosnych kultur v usloviyach moskovskoj oblasti. Dokl. TSCHA 1971, 168, 52–56. [Google Scholar]
- Vavilov, P.P.; Edelšteyn, M.M.; Soloveva, I.V. Frakcjonnyj sostav bełka zelenoj massy novych silosnych kultur. Izv. TSCHA 1973, 5, 84–93. [Google Scholar]
- Glyaubertene, V.F. Biologičeskaja i biochimičeskaja charakteristika perspektivnych silosnych rasteniy. (18. Soderžanie i dinamika nakoplinija azotistych veščestv nadzemnoy časti gorca vejricha, okopnika šeršavogo, sil’fii pronzennolistnoy i maral’ego kornja v pieriod vegeta. Liet. TSR Moksl. Akad. Darbai 1986, 2, 101–108. [Google Scholar]
- Edelšteyn, M.M.; Soloveva, I.W. Soderžanije sacharov v vegetatiwnych organach novych silosnych kultur. Dokl. TSCHA 1975, 209, 51–53. [Google Scholar]
- Edelšteyn, M.M.; Soloveva, I.V. Sodierżanije karotina i askorbinovoj kisloty v silosnych kulturach. Dokl. TSCHA 1974, 204, 51–54. [Google Scholar]
- Glyaubertene, V.F. Biologičeskaja i biochimičeskaja charakteristika perspektivnych silosnych rastenij. (13. Soderžanie karotina i askorbinovoy kisloty w nadzemnoj časti gorca vejricha, okopnika šeršawogo, sil’fii pronzennolistnoy i maral’ego kornja). Liet. TSR Moksl. Akad. Darbai 1982, 1, 81–87. [Google Scholar]
- European Medicines Agency. Assessment Report on Urtica dioica L., and Urtica urens L., Folium; EMA/HMPC/508013/2007; European Medicines Agency: London, UK, 2010; Volume 44. [Google Scholar]
- CE Commission Regulation (EC) No 1881/2006. Off. J. Eur. Union 2006, 49, 5–24.
- Alberti, A.; Machado dos Santos, T.P.; Ferreira Zielinski, A.A.; Eleutério dos Santos, C.M.; Braga, C.M.; Demiate, I.M.; Nogueira, A. Impact on chemical profile in apple juice and cider made from unripe, ripe and senescent dessert varieties. LWT Food Sci. Technol. 2016, 65, 436–443. [Google Scholar] [CrossRef]
- Stefanov, D.; Dimitrova, M.; Sanbev, S. Proučvane na vzmožnostite nyakoi rastenija da bdat otgleždani kato furažni kulturi. Životnov’dni Nauk. 1984, 21, 50–56. [Google Scholar]
- Glyaubertene, V.F.; Ivanovskaya, K.M. Biologičeskaja i biochimičeskaja charakteristika perspektivnych silosnych rasteniy. (21. Soderžanie aminokislot w zelenoj masse gorca vejricha, okopnika šeršawogo, sil’fii pronzennolistnoy i maral’ego kornya w processe ontogeneza). Liet. TSR Moksl. Akad. Darbai 1987, 4, 102–109. [Google Scholar]
Figure 1.
Silphium plants: P-S. perfoliatum (P1—three-year-old plants, P2—inflorescences, P3—shoots) T-S. trifoliatum (T1, T2—shoots), I-S. integrifolim (I1—inflorescences, I2—shoots, I3—one-year-old plants, I4—rhizomes with roots).
Figure 1.
Silphium plants: P-S. perfoliatum (P1—three-year-old plants, P2—inflorescences, P3—shoots) T-S. trifoliatum (T1, T2—shoots), I-S. integrifolim (I1—inflorescences, I2—shoots, I3—one-year-old plants, I4—rhizomes with roots).

Figure 2.
The mean monthly temperature and precipitation sums for the period 1990–2019, and the highest and lowest monthly means measured in Lubartów in the same period.
Figure 2.
The mean monthly temperature and precipitation sums for the period 1990–2019, and the highest and lowest monthly means measured in Lubartów in the same period.


Table 1.
Dates of plant material harvest for chemical studies (the first decade of the month).
| Harvest Date | Plants in the First Year of Vegetation | Perennial Plants | |||||
|---|---|---|---|---|---|---|---|
| Code | 2012 | 2013 | 2014 | Plant Material | Plant Development Stage | Plant Material | Plant Development Stage |
| A | - | May | May | - | - | leaves, stalks | spring regrowth |
| B | - | Jun | Jun | - | - | leaves, stalks | flower buds |
| C | - | Jul | Jul | - | - | leaves, stalks, inflorescences | beginning of flowering |
| D | - | Aug | Aug | - | - | leaves, stalks, inflorescences | full of flowering and fructification |
| E | Sep | Sep | Sep | leaves | leaf rosette | leaves, stalks | end of flowering and full of fructification |
| F | - | Oct | Oct | - | - | rhizomes with roots | fructification |
Table 2.
Validation parameters of the analytical procedure for the determination of minerals.
| Validation Parameters | Minerals | ||||||||||||
|---|---|---|---|---|---|---|---|---|---|---|---|---|---|
| Na | K | Ca | Mg | Zn | Fe | Mn | Se * | Cr * | Cu | Cd * | Pb * | As * | |
| LOD (mg·kg−1), (µg·kg−1) * | 20 | 20 | 28 | 18 | 0.4 | 4.3 | 1.1 | 2.5 | 0.28 | 1.3 | 0.04 | 0.05 | 0.04 |
| LOQ (mg·kg−1), (µg·kg−1) * | 40 | 40 | 56 | 36 | 0.9 | 8.6 | 2.2 | 5.0 | 0.55 | 2.2 | 0.07 | 0.1 | 0.09 |
| Linearity | 1 | 1 | 1 | 1 | 1 | 1 | 1 | 0.9999 | 0.9999 | 1 | 0.9999 | 0.9999 | 0.9999 |
| Reproducibility (%) | 3.4 | 4.9 | 7.0 | 13.9 | 5.1 | 8.6 | 9.2 | 2.55 | 2.40 | 2.3 | 2.42 | 6.07 | 3.18 |
| Recovery (%) | 75 | 90 | 99 | 99 | 117 | 117 | 119 | 97 | 100 | 121 | 99 | 99 | 101 |
| Expanded uncertainty (%) | 50 | 28 | 15 | 28 | 30 | 39 | 43 | 17 | 8 | 41 | 6 | 12 | 7 |
LOD—Limit of Detection; LOQ—Limit of Quantification; * Se, Cr, Cd, Pb, As—LOD (µg·kg−1), LOQ (µg·kg−1); Na, K, Ca, Mg, Zn, Fe, Mn, Cu—LOD (mg·kg−1), LOQ (mg·kg−1).
Table 3.
Chemical composition of Silphium perfoliatum L.
| Parameter | Leaves | Stalks | Inflorescences | Rhizomes | |||||||||||||
|---|---|---|---|---|---|---|---|---|---|---|---|---|---|---|---|---|---|
| First Year | Perennial | ||||||||||||||||
| E * | A | B | C | D | E | Mean | A | B | C | D | E | Mean | C | D | Mean | F | |
| General chemical composition | |||||||||||||||||
| DM (% FM) | 14.3b | 13.5 | 15.0 | 19.1 | 19.8 | 20.8 | 17.6b | 7.5 | 9.7 | 17.8 | 22.0 | 27.1 | 16.8b | 17.9 | 17.4 | 17.6b | 33.5a |
| Ash (% DM) | 13.1b | 19.5 | 18.4 | 18.1 | 17.4 | 19.7 | 18.6a | 19.2 | 14.4 | 12.1 | 8.5 | 6.7 | 12.2ab | 12.1 | 11.3 | 11.7b | 9.3c |
| Total protein (% DM) | 18.4a | 22.9 | 19.2 | 15.8 | 14.9 | 13.1 | 17.2ab | 14.7 | 6.8 | 4.0 | 3.0 | 2.9 | 6.3b | 13.3 | 13.3 | 13.3ab | 10.2b |
| Crude fat (% DM) | 1.5b | 2.1 | 2.2 | 2.1 | 2.3 | 2.3 | 2.2b | 0.7 | 0.7 | 0.7 | 0.9 | 0.8 | 0.8c | 4.1 | 4.2 | 4.2a | 1.0c |
| Total sugars ** (% DM) | 10.6c | 12.9 | 4.0 | 3.1 | 3.7 | 5.3 | 5.8cd | 17.1 | 18.8 | 15.1 | 16.2 | 18.8 | 17.2b | 4.3 | 5.3 | 4.8d | 26.7a |
| Reducing sugars (% DM) | 8.2 | 7.3 | 3.4 | 2.3 | 2.5 | 2.8 | 3.6 | 15.1 | 16.8 | 11.0 | 8.6 | 5.7 | 11.4 | 4.2 | 5.2 | 4.7 | 2.0 |
| L-ascorbic acid (mg·100−1·g−1 DM) | 319b | 452 | 344 | 397 | 419 | 448 | 412a | 142 | 65 | 40 | *** | *** | 49d | 250 | 273 | 262c | *** |
| Cellulose (% DM) | 33.2a | 19.9 | 21.6 | 21.3 | 24.6 | 22.7 | 22.0b | 27.5 | 32.1 | 35.3 | 39.7 | 40.7 | 35.1a | 27.0 | 28.1 | 27.6ab | 25.2b |
| Chlorophyll a (% DM) | 0.6 | 0.7 | 0.8 | 1.2 | 0.9 | 1.0 | 0.9 | 0.1 | 0.1 | 0.1 | 0.3 | 0.2 | 0.2 | 0.3 | 0.5 | 0.4 | *** |
| Chlorophyll b (% DM) | 0.5 | 0.6 | 0.7 | 1.1 | 0.8 | 0.7 | 0.8 | 0.1 | 0.1 | 0.1 | 0.2 | 0.1 | 0.1 | 0.2 | 1.2 | 0.7 | *** |
| Total chlorophyll (% DM) | 1.0ab | 1.3 | 1.5 | 2.3 | 1.7 | 1.7 | 1.7a | 0.2 | 0.1 | 0.2 | 0.5 | 0.2 | 0.3b | 0.5 | 1.7 | 1.1ab | *** |
| Tannins (% DM) | 7.3a | 9.5 | 9.6 | 8.7 | 6.9 | 6.0 | 8.1a | nd | nd | nd | nd | nd | nd | 8.4 | 8.9 | 8.7a | 5.7b |
| The contents of mineral and trace elements | |||||||||||||||||
| Na (mg·100−1·g−1 DM) | 1.4b | 1.4 | 6.4 | 1.1 | 0.7 | 0.9 | 2.1ab | 1.3 | 3.8 | 4.3 | 4.6 | 4.5 | 3.7ab | 1.4 | 1.4 | 1.4b | 3.9a |
| K (g·100−1·g−1 DM) | 4.2a | 4.6 | 4.5 | 4.5 | 2.8 | 2.0 | 3.7a | 4.3 | 3.5 | 2.7 | 1.5 | 1.0 | 2.6a | 3.2 | 3.3 | 3.3a | 2.7a |
| Ca (g·100−1·g−1 DM) | 2.3a | 1.8 | 3.2 | 3.6 | 4.4 | 5.7 | 3.7a | 0.8 | 0.8 | 1.1 | 0.9 | 0.8 | 0.9c | 1.2 | 1.2 | 1.2bc | 0.8c |
| Mg (mg·100−1·g−1 DM) | 269.0a | 221 | 264 | 322 | 320 | 416 | 308a | 151 | 184 | 192 | 207 | 72 | 161.1b | 210 | 225 | 217ab | 334a |
| Zn (mg·100−1·g−1 DM) | 1.9d | 2.7 | 2.4 | 2.7 | 2.4 | 1.9 | 2.4cd | 1.5 | 1.4 | 1.6 | 1.6 | 0.6 | 1.3e | 3.7 | 3.6 | 3.6b | 7.3a |
| Fe (mg·100−1·g−1 DM) | 38.9 | 16.8 | 16.3 | 38.2 | 39.7 | 23.3 | 26.9 | 4.3 | 4.2 | 34.0 | 15.1 | 40.8 | 19.7 | 8.0 | 8.2 | 8.1 | 73.8 |
| Mn (mg·100−1·g−1 DM) | 4.6a | 4.1 | 4.1 | 4.0 | 5.2 | 11.7 | 6.3a | 0.7 | 0.6 | 1.5 | 1.8 | 1.9 | 1.3c | 2.7 | 2.6 | 2.6b | 4.7a |
| Se (μg·100−1·g−1 DM) | 5.7bc | 4.4 | 7.1 | 4.8 | 6.0 | 5.3 | 5.5bc | 2.8 | 3.7 | 4.6 | 5.0 | 15.4 | 6.3b | 4.3 | 4.3 | 4.3c | 9.6ab |
| Cr (mg·100−1·g−1 DM) | 0.1c | 0.2 | 0.2 | 0.4 | 0.2 | 0.2 | 0.2b | 0.2 | 0.3 | 0.5 | 0.2 | 0.1 | 0.2bc | 0.1 | 0.1 | 0.1d | 0.9a |
| Cu (mg·100−1·g−1 DM) | 0.4d | 0.7 | 0.5 | 0.5 | 0.8 | 0.6 | 0.7c | 0.4 | 0.4 | 0.4 | 0.4 | 0.2 | 0.4d | 1.2 | 1.2 | 1.2b | 2.0a |
| Cd (μg·100−1·g−1 DM) | 3.0a | 1.2 | 3.1 | 3.2 | 6.8 | 5.7 | 4.0a | 0.8 | 1.3 | 1.1 | 1.3 | 0.9 | 1.1b | 0.9 | 1.0 | 1.0b | *** |
| Pb (μg·100−1·g−1 DM) | 3.4a | *** | 1.6 | 1.9 | 3.4 | 5.1 | 2.4a | *** | *** | *** | *** | 0.2 | 0.0b | *** | *** | *** | *** |
| As (μg·100−1·g−1 DM) | 8.4a | 0.3 | 3.3 | 2.3 | 19.4 | 16.5 | 8.4a | 5.0 | 5.4 | 7.3 | 2.6 | 5.5 | 5.2b | *** | *** | *** | *** |
* Harvest date (A—May, B—Jun, C—Jul, D—Aug, E—Sep, F—Oct); ** Sum of sugars contents after hydrolysis; *** Below the limit of quantitation; (<LOQ); nd—not determined; DM—dry matter; FM—fresh matter; a, b, c, …—values designated with the same letters within a line do not significantly differ at 5% error.
Table 4.
Chemical composition of Silphium trifoliatum L.
| Parameter | Leaves | Stalks | Inflorescences | Rhizomes | |||||||||||||
|---|---|---|---|---|---|---|---|---|---|---|---|---|---|---|---|---|---|
| First Year | Perennial | ||||||||||||||||
| E * | A | B | C | D | E | Mean | A | B | C | D | E | Mean | C | D | Mean | F | |
| General chemical composition | |||||||||||||||||
| DM (% FM) | 15.9b | 15.3 | 16.5 | 19.9 | 20.0 | 22.6 | 18.9b | 7.3 | 10.4 | 20.2 | 22.2 | 26.7 | 17.4b | 18.7 | 16.5 | 17.6b | 37.6a |
| Ash (% DM) | 16.8a | 19.5 | 16.9 | 17.2 | 17.2 | 18.7 | 17.9a | 20.3 | 13.0 | 8.0 | 6.4 | 6.8 | 10.9ab | 11.4 | 10.0 | 10.7b | 8.0b |
| Total protein (% DM) | 12.7ab | 19.1 | 16.0 | 15.0 | 14.9 | 13.0 | 15.6a | 14.8 | 7.4 | 4.4 | 3.0 | 2.7 | 6.5b | 15.0 | 15.3 | 15.2a | 11.0b |
| Crude fat (% DM) | 1.5ab | 2.1 | 2.2 | 2.2 | 2.3 | 2.3 | 2.2a | 0.7 | 0.7 | 0.8 | 0.9 | 0.9 | 0.8cd | 0.5 | 0.6 | 0.6d | 1.0bc |
| Total sugars ** (% DM) | 13.3b | 14.7 | 3.7 | 4.3 | 4.4 | 4.4 | 6.3bc | 15.2 | 19.1 | 8.3 | 11.4 | 11.9 | 13.2b | 5.1 | 4.3 | 4.7c | 22.3a |
| Reducing sugars (% DM) | 5,0ab | 5.6 | 3.0 | 2.9 | 2.1 | 1.8 | 3.1c | 17.5 | 17.7 | 5.0 | 6.3 | 4.7 | 10.3a | 4.7 | 3.9 | 4.3bc | 2.9d |
| L-ascorbic acid (mg·100−1·g−1 DM) | 331b | 352 | 414 | 357 | 437 | 445 | 401a | 161 | 56 | 41 | *** | *** | 52d | 306.0 | 156.0 | 231c | *** |
| Cellulose (% DM) | 31.3ab | 19.5 | 22.1 | 22.5 | 27.7 | 24.3 | 23.2b | 24.6 | 30.3 | 35.4 | 38.7 | 42.9 | 34.4a | 24.9 | 24.0 | 24.4b | 26.2b |
| Chlorophyll a (% DM) | 0.5 | 0.7 | 0.9 | 1.0 | 0.9 | 1.0 | 0.9 | 0.3 | 0.2 | 0.2 | 0.2 | 0.2 | 0.2 | 0.3 | 0.3 | 0.3 | nd |
| Chlorophyll b (% DM) | 0.4 | 0.5 | 0.8 | 0.9 | 0.7 | 0.7 | 0.7 | 0.1 | 0.1 | 0.1 | 0.1 | 0.1 | 0.1 | 0.2 | 0.2 | 0.2 | nd |
| Total chlorophyll (% DM) | 0.9b | 1.2 | 1.7 | 1.8 | 1.6 | 1.8 | 1.6a | 0.4 | 0.3 | 0.3 | 0.3 | 0.1 | 0.3d | 0.5 | 0.5 | 0.5c | nd |
| Tannins (% DM) | 8.9b | 9.9 | 11.2 | 9.7 | 8.8 | 8.3 | 9.6ab | nd | nd | nd | nd | nd | nd | 9.5 | 11.4 | 10.4a | 7.5c |
| The contents of mineral and trace elements | |||||||||||||||||
| Na (mg·100−1·g−1 DM) | 1.0c | 1.4 | 6.3 | 1.0 | 0.6 | 0.8 | 2.0bc | 1.3 | 3.6 | 4.3 | 4.3 | 4.5 | 3.6ab | 1.3 | 1.1 | 1.2b | 3.7a |
| K (g·100−1·g−1 DM) | 3.3a | 4.5 | 4.5 | 4.4 | 2.9 | 2.1 | 3.7a | 4.3 | 3.5 | 3.0 | 1.8 | 1.2 | 2.7a | 2.9 | 3.2 | 3.0a | 2.5a |
| Ca (g·100−1·g−1 DM) | 2.7a | 1.9 | 3.2 | 3.4 | 4.3 | 5.9 | 3.8a | 0.8 | 0.8 | 1.0 | 1.0 | 0.8 | 0.9c | 1.3 | 1.4 | 1.3b | 0.8c |
| Mg (mg·100−1·g−1 DM) | 325a | 229 | 279 | 335 | 320 | 413 | 315.2a | 151 | 177 | 186 | 213 | 92 | 164b | 213 | 199 | 205b | 329a |
| Zn (mg·100−1·g−1 DM) | 2.3c | 2.8 | 2.4 | 2.7 | 2.4 | 2.0 | 2.4c | 1.6 | 1.5 | 1.6 | 1.6 | 0.6 | 1.4d | 3.8 | 3.4 | 3.6b | 7.5a |
| Fe (mg·100−1·g−1 DM) | 27.6b | 18.0 | 17.8 | 37.2 | 38.4 | 24.9 | 27.3b | 4.4 | 4.5 | 36.3 | 26.7 | 30.6 | 20.5bc | 7.9 | 8.0 | 8.0c | 71.4a |
| Mn (mg·100−1·g−1 DM) | 6.4a | 4.2 | 4.2 | 4.0 | 5.0 | 12.2 | 5.9a | 0.7 | 0.6 | 1.5 | 1.7 | 1.8 | 1.3d | 2.7 | 3.1 | 2.9c | 4.8b |
| Se (μg·100−1·g−1 DM) | 5.9ab | 4.5 | 7.2 | 4.7 | 6.0 | 5.9 | 5.7ab | 2.9 | 3.5 | 4.4 | 4.9 | 12.8 | 5.7ab | 4.4 | 4.4 | 4.4b | 9.7a |
| Cr (mg·100−1·g−1 DM) | 0.2c | 0.2 | 0.2 | 0.4 | 0.3 | 0.2 | 0.3b | 0.2 | 0.3 | 0.5 | 0.2 | 0.2 | 0.3b | 0.1 | 0.1 | 0.1c | 1.0a |
| Cu (mg·100−1·g−1 DM) | 0.5c | 0.7 | 0.4 | 0.5 | 0.7 | 0.6 | 0.6c | 0.3 | 0.4 | 0.4 | 0.4 | 0.2 | 0.3d | 1.2 | 1.3 | 1.2b | 2.0a |
| Cd (μg·100−1·g−1 DM) | 3.0a | 1.3 | 3.2 | 3.2 | 6.7 | 6.8 | 4.2a | 0.8 | 1.4 | 1.4 | 1.5 | 1.2 | 1.3b | 1.0 | 0.9 | 0.9b | 0c |
| Pb (μg·100−1·g−1 DM) | 2.7a | 0.1 | 1.4 | 1.6 | 3.2 | 4.7 | 2.2a | *** | *** | *** | *** | 0.2 | 0.0b | *** | *** | *** | *** |
| As (μg·100−1·g−1 DM) | 8.0a | 1.4 | 6.3 | 1.0 | 0.6 | 0.8 | 4.4a | 4.7 | 5.3 | 7.2 | 2.3 | 4.9 | 4.9a | *** | *** | *** | *** |
* Harvest date (A—May, B—Jun, C—Jul, D—Aug, E—Sep, F—Oct); ** Sum of sugars contents after hydrolysis; *** Below the limit of quantitation; (<LOQ); nd—not determined; DM—dry matter; FM—fresh matter; a, b, c, …—values designated with the same letters within a line do not significantly differ at 5% error.
Table 5.
Chemical composition of Silphium integrifolium Michx.
| Parameter | Leaves | Stalks | Inflorescences | Rhizomes | |||||||||||||
|---|---|---|---|---|---|---|---|---|---|---|---|---|---|---|---|---|---|
| First Year | Perennial | ||||||||||||||||
| E * | A | B | C | D | E | Mean | A | B | C | D | E | Mean | C | D | Mean | F | |
| General chemical composition | |||||||||||||||||
| DM (% FM) | 15.6b | 16.7 | 16.4 | 21.3 | 18.7 | 20.9 | 18.8b | 9.3 | 13.8 | 20.4 | 21.7 | 29.7 | 19.0b | 20.3 | 16.0 | 18.1b | 32.7a |
| Ash (% DM) | 16.3a | 15.8 | 16.4 | 16.3 | 16.2 | 17.3 | 16.4a | 20.9 | 16.0 | 11.8 | 11.2 | 8.3 | 13.6ab | 14.0 | 12.3 | 13.1b | 8.2c |
| Total protein (% DM) | 17.8a | 18.4 | 15.1 | 13.7 | 13.3 | 12.0 | 14.5a | 12.3 | 7.0 | 4.3 | 3.0 | 2.8 | 5.9c | 13.8 | 13.4 | 13.6a | 9.9b |
| Crude fat (% DM) | 1.5a | 2.0 | 2.0 | 2.1 | 2.1 | 2.2 | 2.1a | 0.6 | 0.6 | 0.6 | 0.8 | 0.8 | 0.7b | 0.5 | 0.5 | 0.5b | 0.9b |
| Total sugars ** (% DM) | 8.3b | 6.5 | 3.5 | 2.8 | 1.9 | 2.3 | 3.4c | 6.5 | 5.7 | 4.8 | 3.1 | 5.8 | 5.2c | 1.9 | 2.0 | 2.0 | 21.7a |
| Reducing sugars (% DM) | 2.0a | 2.4 | 1.9 | 1.7 | 1.3 | 1.9 | 1.8a | 4.3 | 4.3 | 2.5 | 0.8 | 0.9 | 2.6a | 1.9 | 1.7 | 1.8a | 1.8a |
| L-ascorbic acid (mg·100−1·g−1 DM) | 328b | 779 | 469 | 390 | 462 | 488 | 517a | 197 | 86 | 54 | *** | *** | 67c | 322 | 339 | 331b | *** |
| Cellulose (% DM) | 31.6a | 22.5 | 23.4 | 23.6 | 26.8 | 23.1 | 23.9b | 27.4 | 32.6 | 36.4 | 40.1 | 41.6 | 35.6a | 25.0 | 25.4 | 25.2b | 25.4b |
| Chlorophyll a (% DM) | 0.5 | 0.8 | 0.7 | 0.8 | 0.6 | 0.8 | 0.7 | 0.2 | 0.1 | 0.2 | 0.2 | 0.1 | 0.2 | 0.4 | 0.4 | 0.4 | *** |
| Chlorophyll b (% DM) | 0.4 | 0.6 | 0.7 | 0.8 | 0.6 | 0.7 | 0.7 | 0.1 | 0.1 | 0.1 | 0.1 | 0.1 | 0.1 | 0.2 | 0.2 | 0.2 | *** |
| Total chlorophyll (% DM) | 0.9b | 1.4 | 1.4 | 1.5 | 1.2 | 1.4 | 1.4a | 0.3 | 0.2 | 0.3 | 0.2 | 0.2 | 0.2d | 0.6 | 0.6 | 0.6c | *** |
| Tannins (% DM) | 8.8b | 8.1 | 9.6 | 8.2 | 7.8 | 7.0 | 8.2b | nd | nd | nd | nd | nd | nd | 11.2 | 10.2 | 10.7a | 6.6c |
| The contents of mineral and trace elements | |||||||||||||||||
| Na (mg·100−1·g−1 DM) | 1.1b | 1.4 | 5.9 | 2.0 | 1.0 | 1.0 | 2.3ab | 1.4 | 4.2 | 4.5 | 4.6 | 4.7 | 3.9ab | 1.5 | 1.6 | 1.5b | 3.9a |
| K (g·100−1·g−1 DM) | 3.3a | 4.5 | 4.6 | 4.8 | 2.8 | 2.2 | 3.8a | 4.3 | 3.5 | 2.8 | 1.5 | 1.2 | 2.7a | 3.3 | 3.2 | 3.3a | 2.2a |
| Ca (g·100−1·g−1 DM) | 2.4a | 2.1 | 4.0 | 4.2 | 5.2 | 6.8 | 4.5a | 1.0 | 1.3 | 1.5 | 1.6 | 1.8 | 1.4b | 1.9 | 1.7 | 1.8b | 1.0c |
| Mg (mg·100−1·g−1 DM) | 295a | 225 | 277 | 333 | 413 | 415 | 333a | 154 | 186 | 194 | 213 | 83 | 166b | 219 | 201 | 210ab | 349a |
| Zn (mg·100−1·g−1 DM) | 2.2c | 3.8 | 4.0 | 4.1 | 3.9 | 3.8 | 3.9b | 2.1 | 2.4 | 2.4 | 2.6 | 1.9 | 2.3c | 5.0 | 4.5 | 4.7b | 9.1a |
| Fe (mg·100−1·g−1 DM) | 34.6b | 14.5 | 14.7 | 30.3 | 30.2 | 19.2 | 21.8c | 3.9 | 3.8 | 30.3 | 27.9 | 25.0 | 18.2cd | 7.3 | 8.3 | 7.8d | 52.6a |
| Mn (mg·100−1·g−1 DM) | 5.6a | 4.2 | 4.2 | 4.0 | 5.2 | 10.9 | 5.7a | 0.7 | 0.6 | 1.4 | 1.9 | 1.9 | 1.3c | 2.8 | 2.6 | 2.8b | 4.7a |
| Se (μg·100−1·g−1 DM) | 6.2b | 7.2 | 12.4 | 7.3 | 7.4 | 7.4 | 8.4ab | 4.2 | 6.9 | 7.2 | 7.3 | 12.9 | 7.7ab | 6.2 | 6.3 | 6.3b | 12.8a |
| Cr (mg·100−1·g−1 DM) | 0.1 | 0.2 | 0.2 | 0.3 | 0.2 | 0.1 | 0.2b | 0.1 | 0.2 | 0.2 | 0.1 | 0.1 | 0.1bc | 0.1 | 0.1 | 0.1c | 0.6a |
| Cu (mg·100−1·g−1 DM) | 0.4d | 0.6 | 0.5 | 0.5 | 0.5 | 0.6 | 0.6c | 0.4 | 0.4 | 0.4 | 0.4 | 0.4 | 0.4cd | 1.1 | 1.1 | 1.1b | 2.0a |
| Cd (μg·100−1·g−1 DM) | 2.8a | 1.0 | 2.8 | 2.9 | 4.3 | 4.9 | 3.2a | 0.6 | 0.9 | 1.0 | 1.1 | 0.8 | 0.9ab | 0.8 | 0.8 | 0.8b | *** |
| Pb (μg·100−1·g−1 DM) | 2.7a | 0.0 | 1.2 | 1.0 | 2.6 | 4.0 | 1.8a | *** | *** | *** | *** | *** | *** | *** | *** | *** | *** |
| As (μg·100−1·g−1 DM) | 7.2a | 0.2 | 2.8 | 2.3 | 12.3 | 9.7 | 5.5ab | 3.8 | 4.3 | 6.5 | 2.2 | 3.0 | 4.0b | *** | *** | *** | *** |
* Harvest date (A—May, B—Jun, C—Jul, D—Aug, E—Sep, F—Oct); ** Sum of sugars contents after hydrolysis; *** Below the limit of quantitation; (<LOQ); nd—not determined; DM—dry matter; FM—fresh matter; a, b, c, …—values designated with the same letters within a line do not significantly differ at 5% error.
Table 6.
Percentage of amino acids in total protein of three Silphium species leaves (L) and herbs (H).
Table 6.
Percentage of amino acids in total protein of three Silphium species leaves (L) and herbs (H).
| Amino Acid * | Species | |||||
|---|---|---|---|---|---|---|
| S. perfoliatum | S. trifoliatum | S. integrifolium | ||||
| L | H | L | H | L | H | |
| Asp | 10.7ab | 9.0c | 9.2bc | 12.0a | 11.8a | 10.1b |
| Thr | 5.8a | 6.0a | 5.4b | 6.3a | 6.0a | 5.3b |
| Ser | 4.6a | 4.6a | 4.7a | 4.4a | 4.9a | 4.9a |
| Glu | 9.1a | 8.1b | 9.3a | 7.9b | 9.5a | 8.7ab |
| Pro | 3.7cd | 4.9b | 3.2d | 5.6a | 4.3bc | 4.3bc |
| Gly | 7.7a | 7.4a | 7.5a | 6.8a | 7.4a | 6.8a |
| Ala | 6.0a | 6.3a | 6.1a | 6.0a | 6.1a | 6.2a |
| Val | 5.8a | 5.0bc | 5.4ab | 4.7c | 5.9a | 4.8bc |
| Ile | 4.2ab | 3.8b | 3.7bc | 3.3c | 4.6a | 3.7bc |
| Leu | 8.9 | 9.1 | 8.7ab | 7.7b | 9.4a | 8.5ab |
| Tyr | 3.3a | 2.8b | 3.2ab | 2.4c | 3.5a | 2.4c |
| Phe | 6.2ab | 6.4ab | 5.3c | 6.4ab | 6.8a | 5.8bc |
| Lys | 4.5b | 4.9ab | 4.5b | 4.3b | 5.3a | 4.4b |
| His | 2.3a | 2.1ab | 2.0b | 2.2a | 2.1ab | 1.9b |
| Arg | 3.7a | 3.4b | 3.7ab | 4.1a | 3.9a | 3.4b |
| Cys | 1.0a | 0.8bc | 0.6d | 0.7cd | 0.9ab | 0.7cd |
| Met | 0.8b | 0.6c | 0.4d | 0.6c | 1.2a | 0.6c |
| Sum | 88.2 | 85.2 | 83.0 | 85.4 | 93.5 | 82.6 |
* Asp—aspartic acid, Thr—threonine, Ser—serine, Glu—glutamic acid, Pro—proline, Gly—glycine, Ala—alanine, Val—valine, Ile—isoleucine, Leu—leucine, Tyr—tyrosine, Phe—phenylalanine, Lys—lysine, His—histidine, Arg—arginine, Cys—cysteine, Met—methionine; a, b, c, …—values designated with the same letters within a line do not significantly differ at 5% error.
© 2020 by the authors. Licensee MDPI, Basel, Switzerland. This article is an open access article distributed under the terms and conditions of the Creative Commons Attribution (CC BY) license (http://creativecommons.org/licenses/by/4.0/).
Share and Cite
MDPI and ACS Style
Kowalska, G.; Pankiewicz, U.; Kowalski, R. Evaluation of Chemical Composition of Some Silphium L. Species as Alternative Raw Materials. Agriculture 2020, 10, 132. https://doi.org/10.3390/agriculture10040132
AMA Style
Kowalska G, Pankiewicz U, Kowalski R. Evaluation of Chemical Composition of Some Silphium L. Species as Alternative Raw Materials. Agriculture. 2020; 10(4):132. https://doi.org/10.3390/agriculture10040132
Chicago/Turabian StyleKowalska, Grażyna, Urszula Pankiewicz, and Radosław Kowalski. 2020. "Evaluation of Chemical Composition of Some Silphium L. Species as Alternative Raw Materials" Agriculture 10, no. 4: 132. https://doi.org/10.3390/agriculture10040132
Note that from the first issue of 2016, this journal uses article numbers instead of page numbers. See further details here.