Article

Carbon Sequestration and Contribution of CO2, CH4 and N2O Fluxes to Global Warming Potential from Paddy-Fallow Fields on Mineral Soil Beneath Peat in Central Hokkaido, Japan

1
Laboratory of Soil Science, Research Faculty of Agriculture, Hokkaido University, Kita-Ku, Kita-9, Nishi-9, Sapporo 060-8589, Japan
2
Agriculture, Forestry and Fisheries Research Council, Ministry of Agriculture, Forestry and Fisheries, 1-2-1, Kasumigaseki, Chiyoda-Ku, Tokyo 100-8950, Japan
*
Author to whom correspondence should be addressed.
Present address: Soil Science Division, Bangladesh Agricultural Research Institute, Joydebpur, Gazipur-1701, Bangladesh.
Agriculture 2020, 10(1), 6; https://doi.org/10.3390/agriculture10010006
Submission received: 18 November 2019 / Accepted: 23 December 2019 / Published: 27 December 2019
(This article belongs to the Special Issue Greenhouse Gas Emissions in Agroecosystems)

Abstract

:
Since each greenhouse gas (GHG) has its own radiative capacity, all three gasses (CO2, CH4 and N2O) must be accounted for by calculating the net global warming potential (GWP) in a crop production system. To compare the impact of GHG fluxes from the rice growing and the fallow season on the annual gas fluxes, and their contribution to the GWP and carbon sequestration (CS) were evaluated. From May to April in Bibai (43°18′ N, 141°44′ E), in central Hokkaido, Japan, three rice paddy fields under actual management conditions were investigated to determine CS and the contribution of carbon dioxide (CO2), methane (CH4) and nitrous oxide (N2O) fluxes to GWP. Methane and N2O fluxes were measured by placing the chamber over the rice plants covering four hills and CO2 fluxes from rice plants root free space in paddy fields were taken as an indicator of soil microbial respiration (Rm) using the closed chamber method. Soil CS was calculated as the difference between net primary production (NPP) and loss of carbon (C) through Rm, emission of CH4 and harvest of crop C. Annual cumulative Rm ranged from 422 to 519 g C m−2 yr−1; which accounted for 54.7 to 55.5% of the rice growing season in particular. Annual cumulative CH4 emissions ranged from 75.5 to 116 g C m−2 yr−1 and this contribution occurred entirely during the rice growing period. Total cumulative N2O emissions ranged from 0.091 to 0.154 g N m−2 yr−1 and from 73.5 to 81.3% of the total N2O emissions recorded during the winter-fallow season. The CS ranged from −305 to −365 g C m−2 yr−1, suggesting that C input by NPP may not be compensate for the loss of soil C. The loss of C in the winter-fallow season was much higher (62 to 66%) than in the growing season. The annual net GWP from the investigated paddy fields ranged from 3823 to 5016 g CO2 equivalent m−2 yr−1. Annual GWPCH4 accounted for 71.9 to 86.1% of the annual net GWP predominantly from the rice growing period. These results indicate that CH4 dominated the net GWP of the rice paddy.

1. Introduction

Since the pre-industrial era (defined as 1750), the concentration of global atmospheric carbon dioxide (CO2) has increased from 278 ppmv to 3905 ppmv in 2011. Methane (CH4) and nitrous oxide (N2O) concentrations have increased during the same period from approximately 0.722 ppmv to 1.803 ppmv and approximately 0.270 ppmv to 0.324 ppmv, respectively [1]. Rice production contains substantial CH4 emissions, contributing about 10% of all anthropogenic CH4 emissions or about 1.5% of total global anthropogenic GHG emissions [2,3]. Nitrous oxide emissions from agricultural fields, comprising approximately 5% of total organic anthropogenic GHG emissions [4], are primarily associated with applications of inorganic and organic nitrogen fertilizer in cultivated arable upland systems [5]. Rice paddies in monsoonal Asia play an important role in the global GHG budget [6], but the extent of net fluxes from these ecosystems is still considerably uncertain.
Gas exchange between paddy fields and the atmosphere is different from that in dryland farming and other ecosystems because paddy fields are flooded during most of the growing period and this exchange is regulated by many factors [6]. Some change in soil or management/climate conditions will alter biochemical or geochemical processes, ultimately leading to changes in gas fluxes [7]. For instance, the incorporation of crop straws into soil may increase carbon sequestration (CS) [8], but at the same time may increase CH4 fluxes [9]. Because of water drainage, lower CH4 fluxes can increase N2O fluxes [10]. Studies have shown that a large amount of GHGs are released from paddy fields; likewise a significant amount of CO2 is stored by plant in paddy fields [11,12,13,14]. This two mechanisms help regulate GHGs for paddy ecosystems [15]. Since each GHG has its own radiative potential [1], the calculation of net global warming potential (GWP) in a crop production system must include all three gases [7]. GWP defined as the cumulative radiative forcing—both direct and indirect effects—integrated over a period of time from the emission of a unit mass of gas relative to some reference gas, CO2 as this reference [16].
Many biological and physical processes regulate the exchange of CO2 and CH4 between paddy fields and the atmosphere. Carbon dioxide exchange in paddy fields is driven by photosynthesis and autotrophic (plant) and heterotrophic (mainly microbial) respiration [17]. Photosynthesis of plants contributes to the removal of CO2 from both the atmosphere and from respired CO2 emitted by the soil and floodwater. Methane is released into the atmosphere by ebullition, diffusion and transport by means of rice plant aerenchyma tissue [18]. In previous studies, GWP was considered using CH4 and N2O but not CO2, because both the respiration and the photosynthesis altered the concentration of CO2 inside the chamber [19]. A lot of information has been given to enhance our understanding of the processes of C cycle and C storage in soils. This was due to the need to sequester C in order to overcome global climate change [20]. Nevertheless, in paddy fields, there were only a few studies on soil CS [21,22]. The likelihood of CS in a paddy field must be measured concurrently with GHG emissions taking into account GWPs. In attempts to quantify the CS in paddy ecosystems that would accompany change in agricultural practices, the change in C emissions associated with management practices has largely been overlooked.
Throughout rice growing season, the impacts of rice paddy soil on GWP are normally studied without considering the fallow season, using only CH4 and N2O fluxes. The GWP of CH4 and N2O emissions from paddy soils had been estimated together or separately by numerous researchers [10,23,24]. Consequently, most of the related research sought to establish soil management strategies to suppress individual GHG emission levels without a holistic assessment of total GWP from the combined contribution of the major GHGs, especially CO2, CH4, and N2O [25]. With regard to the integrated greenhouse effect in CO2-equivalent of three gases (CO2, CH4 and N2O), the available data are rather scarce. Moreover, information regarding annual GHG fluxes and contribution of each GHG to the total GWP from rice growing and fallow periods is insufficient. Therefore, the integrated GHG effect under various management practices and the status of “source” and “sink” of paddy fields are essential. Furthermore, because actual status of GHG emissions in regional agriculture is quite unclear, methodological research for increasing accuracy of estimations is required. In this study, we present the method of measurements of soil microbial respiration (Rm) from paddy fields. Thus, we have carried out field-level investigations in paddy fields to estimate CS using Rm. We hypothesized that different agronomical managements in paddy fields on mineral soil over peat may regulate GHG emissions and CS under rice growing and fallow season in a snowy, temperate region. Therefore, the objectives of the present study are: (i) to compare the effect of GHG emissions from the rice growing and the fallow season on the annual gas fluxes in a single-cropping paddy field; and (ii) to estimate the CS, and evaluate the contribution of CO2, CH4 and N2O fluxes to GWP under different agronomical managements in paddy fields.

2. Materials and Methods

2.1. Site Description and Field Management Schemes

2.1.1. Study Site, Soil Type and Climate

Field investigations were conducted at Kita-mura (43°18′ N, 141°44′ E) near Bibai, in Central Hokkaido, Japan’s largest rice-growing area, from late May to April. We examined three fields of rice paddy, D1-M (drainage-multiple), D2-M (drainage-multiple) and D3-S (drainage-single), which were peatland dressed in mineral soil. The thickness of the D1-M, D2-M and D3-S mineral soil (dressing) was 20 ± 4.2, 29 ± 5.4 and 29 ± 5.4 cm, respectively. In winter, the study area has a cold climate with a long snow cover. The rice straw was left on the unplowed fields during the winter-fallow cycle (October to April) between harvest and the planting of the next year. Crop residues were covered by deep snow with sub-freezing air temperatures from November to April. In autumn (end of September) the time between the rice harvest and the first snowfall was around 45 days. For weed growth, this short duration and gradually declining air temperature is not beneficial.

2.1.2. Management History

Hokkaido is Japan’s newly developed agricultural land. Many of the peatlands in Hokkaido, Japan, have been reclaimed as paddies or dry fields since its establishment in the Meiji Period (1867–1911) [26]. In central Hokkaido, mainly in the lowlands along the main river Ishikari, peatlands are distributed. Most of the Ishikari peatlands were used for paddy cultivation, particularly after 1945, according to the Japanese government’s systematic development plan. The peat soils (studied area) were drained in the 1960s, dressed top with approximately 30 cm of mineral soil and altered into productive crop fields [27].

2.1.3. Current Management and Specificity of the Three Fields

After harvest in autumn, the prevalent local practice for rice straw management is to leave rice straw on paddy fields and plow the straw into the soil in the following spring (early May). We found that a variable amount of rice straw leftover on the fields resulted from different yields from the paddy rice crops of the previous year; farmers only collected grain and combined harvesters left short pieces of rice straw on the soil surface as spreading on fallow fields. As described above, the distribution and abundance of leftover organic materials in central Hokkaido was mainly from rice plants, no weeds were grown and, if any, in size and volume was negligible. All the fields were rotated as a system annually under a single crop and a paddy-fallow-paddy. Paddy rice was grown in all fields for approximately 10 consecutive years before the experiment. Table 1 presents some physical and chemical properties of the soils of the investigated fields.
Under the actual conditions of farmers’ management, three rice-paddy fields were chosen. Different water management practices were included in the selected fields; multiple drainage [drainage frequency, two −29 days after transplantation (DAT) and 63 DAT] was done in D1-M and D2-M, and single drainage (63 DAT) was done in the mid-growing season in D3-S. Each drainage had a length of 10 days. At the end of the growing season, all fields are eventually drained for harvesting. The disparity between the fields in water management practices was driven primarily due to differences in the quantities of leftover rice residues and soil quality. Field D1-M, D2-M and D3-S earned 5.21, 5.58 and 7.51 t ha−1, respectively leftover rice straw from the rice crop of the previous year. Table 2 provides detailed information on the quantity of remaining straw on fields and other management practices. Drainage activities are usually chosen to avoid extreme reduction conditions and to facilitate the decomposition of the remaining rice straw. Single drainage was done by the paddy field D3-S, although this field received the highest amount of previous crop residues. It could possibly be due to the relatively low C content and higher density of sand (50.9%) in the soil resulting in poorer conditions of reduction than the other two felds. Farmers also reduce drainage in order to prevent cracks during the irrigation-dry cycle. The development of cracks and the rise in amplitude result in a significantly higher rate of penetration [28], resulting in depletion of water and nutrients in the shallow roots [29], and increases in percolation rate due to decreases in water productivity [30]. The rate of drainage, however, depends on the conditions of the field and on the judgment of the farmer.

2.2. Experimental Layout and Approach

Three fields were considered as three treatments and in each field we had three measuring places (three chambers per field). The distance was about 500–1000 m between each of the field sites. Immediately after transplantation, an aluminum chamber base of 61 cm × 31 cm × 7 cm (length × width × height) with an internal side water groove of 1 cm × 2.5 cm (width × depth) was placed in the waterlogged soil. Three chamber bases (three replicates) were placed at the same range of 30 m in each field and used for the sampling of CH4 and N2O gases. Carbon dioxide fluxes were taken from rice plants root free space in paddy fields as an indicator of soil microbial respiration (Rm) [31]. Rice root distribution is typically more than 20 cm deep in the subsurface soil and root horizontal distribution is 15 cm wide [32]. Rice seedlings of 1-m2 from three places of each field were picked up immediately after transplantation. The chamber base inside was thus free of rice roots. An aluminum chamber base of 31 cm × 31 cm × 7 cm (length × width × height) with 1 cm × 2.5 cm (width × deep) water groove in the inner side was placed in the middle of the root free space of the rice plants to place the chamber on it. There was about 69 cm of root-free space outside the base of the chamber. When the field-water table fell below groove level, the base groove was filled with water. The chamber was not fixed on the field and was set up on the chamber base in the field during the sampling day. Boardwalks were constructed from boundary dikes across each sampling site to prevent soil disruption during gas collection (Figure 1).

2.3. CH4 and N2O Gas Sample Collection and Analysis

Gas collection from the experimental fields, a closed-chamber (static chamber) system was used [9]. Transparent, rectangular gas-sampling chambers of 60 cm × 30 cm × 100 cm (length × width × height) were built using 5 mm thick acrylic sheets and placed on a base above the four-hill rice plants in the paddy fields. A lightweight plastic bag was added inside to avoid pressure gradients between the inside and outside of the chambers during gas sampling (Figure 1). An electronic thermometer with a silicon cork was attached inside the chamber to determine the inside temperature. For gas sampling, each chamber was attached to a silicon cork and pipe with a three-way stopcock. Each sampling activity was repeated three times on each sampling day from 10:00 a.m. to 3:00 p.m., sampling was conducted three to four times a month. On each sampling date, the same method was applied at each field site. Gas was sampled with a 25-mL polypropylene syringe at 0, 10, and 20 min per sampling time and transferred to a 20-mL vial with a hypodermic needle.
A gas chromatograph equipped with a hydrogen flame-ionized detector (FID, SHIMADZU GC-8A, Shimadzu Corporation, Kyoto, Japan), was used to analyze CH4 concentrations of the collected gas samples in the laboratory. Whereas N2 (flow rate: 100 kPa), H2 (flow rate: 50 kPa) and zero air (flow rate: 50 kPa) were used as carriers, fuel, and supporting gas, respectively. The temperature of the column and injector/detector was set respectively at 70 °C and 130 °C. Methane 2.0 and 10.0 ppmv (Hokkaido Air Water Inc., Sapporo, Japan) was used as the primary standard, with an injection volume of 1 mL. With a gas chromatograph fitted with a 63Ni electron capture detector (ECD, Shimadzu GC-14B), N2O concentrations were determined. N2 gas was used, keeping the flow rate at 400 kPa. The temperatures of the column, injector and detector were set at 60, 250, and 340 °C respectively. Calibration was carried out using standard N2O gas at 0.3 ppmv concentration (Hokkaido Air Water Inc.), with an injection volume of 1 mL.

2.4. Soil Microbial Respiration (Rm) Measurement

For Rm measurement in paddy fields, transparent rectangular chambers of 30 cm × 30 cm × 60 cm (length × width × height) made of 3 mm thick acrylic sheets were used. Three chambers (three replicates) were placed at the same distance in each field during the Rm measurement and each chamber was covered with a dark sheet. The time and procedures for collecting samples are similar to those for CH4 and N2O. But samples of air in the chamber were taken at 0 and 6 min after setting up the chamber with a 50 mL polypropylene syringe, and transferred to a Tedlar ® 400 mL bag via a silicon tube attached to the top of the chamber. Rm was analyzed with an infrared gas analyzer (FUJI ZFP-9, Fuji Electric Co., Ltd., Tokyo, Japan) within 2 h after collection.

2.5. Gas Flux Calculation

Gas fluxes were calculated according to the linear increase or decrease of gas concentration in the chamber over time, use the following formula:
F (mg C m−2 h−1) = ρ × V/A × Δc/Δt × 273/T × α
where, F is the gas flux; ρ is the density of gas at the standard condition (Rm as CO2 = 1.96 × 10⁶ mg m−3, CH4 = 0.716 × 10⁶ mg m−3, and N2O = 1.97 × 10⁶ mg m−3); V (m3) and A (m2) are the volume and bottom area of the chamber, respectively; Δc/Δt (m3 m−3 h−1) is the gas concentration change in the chamber during a given period; T is the absolute temperature (K); and α is the conversion factor for gas (CO2 = 12/44, CH4 = 12/16 and N2O = 28/44). A positive flux indicates soil-to-atmosphere gas emissions, and a negative flux reveals its uptake from the atmosphere. The cumulative fluxes were calculated assuming the existence of linear changes in gas emissions between two successive sampling dates [33]:
Cumulative   gas   emission   = i = 1 n 1 ( R i   ×   D i ) ,
where, Ri is the mean gas flux (mg m−2 d−1) of the two sampling times, Di is the number of days in the sampling interval, and n is the number of sampling times. For the rice growing season, the cumulative gas flux of individual gases was 121 days, and for the winter fallow season it was 211 days. Due to land preparation and transplantation, gas samples collections were not performed during May.

2.6. Net Primary Production (NPP) Estimation

Net primary production of the investigated fields, which includes above and below ground rice plant biomass was estimated. Plant samples of three 1-m2 quadrates were collected by hand from each field just prior to harvest [9]. Samples were taken from the site adjacent to the chamber. Root samples were taken from the top soil depth of 0–20 cm. Samples from the aboveground were separated into grains, straw and stubble. Dried plant samples were manually ground (e.g., to powder) with a mortar and pestle to determine total C concentration using a C–N analyzer (vario MAX CNS, Elementar Analysensysteme GmbH, Langenselbold, Germany).

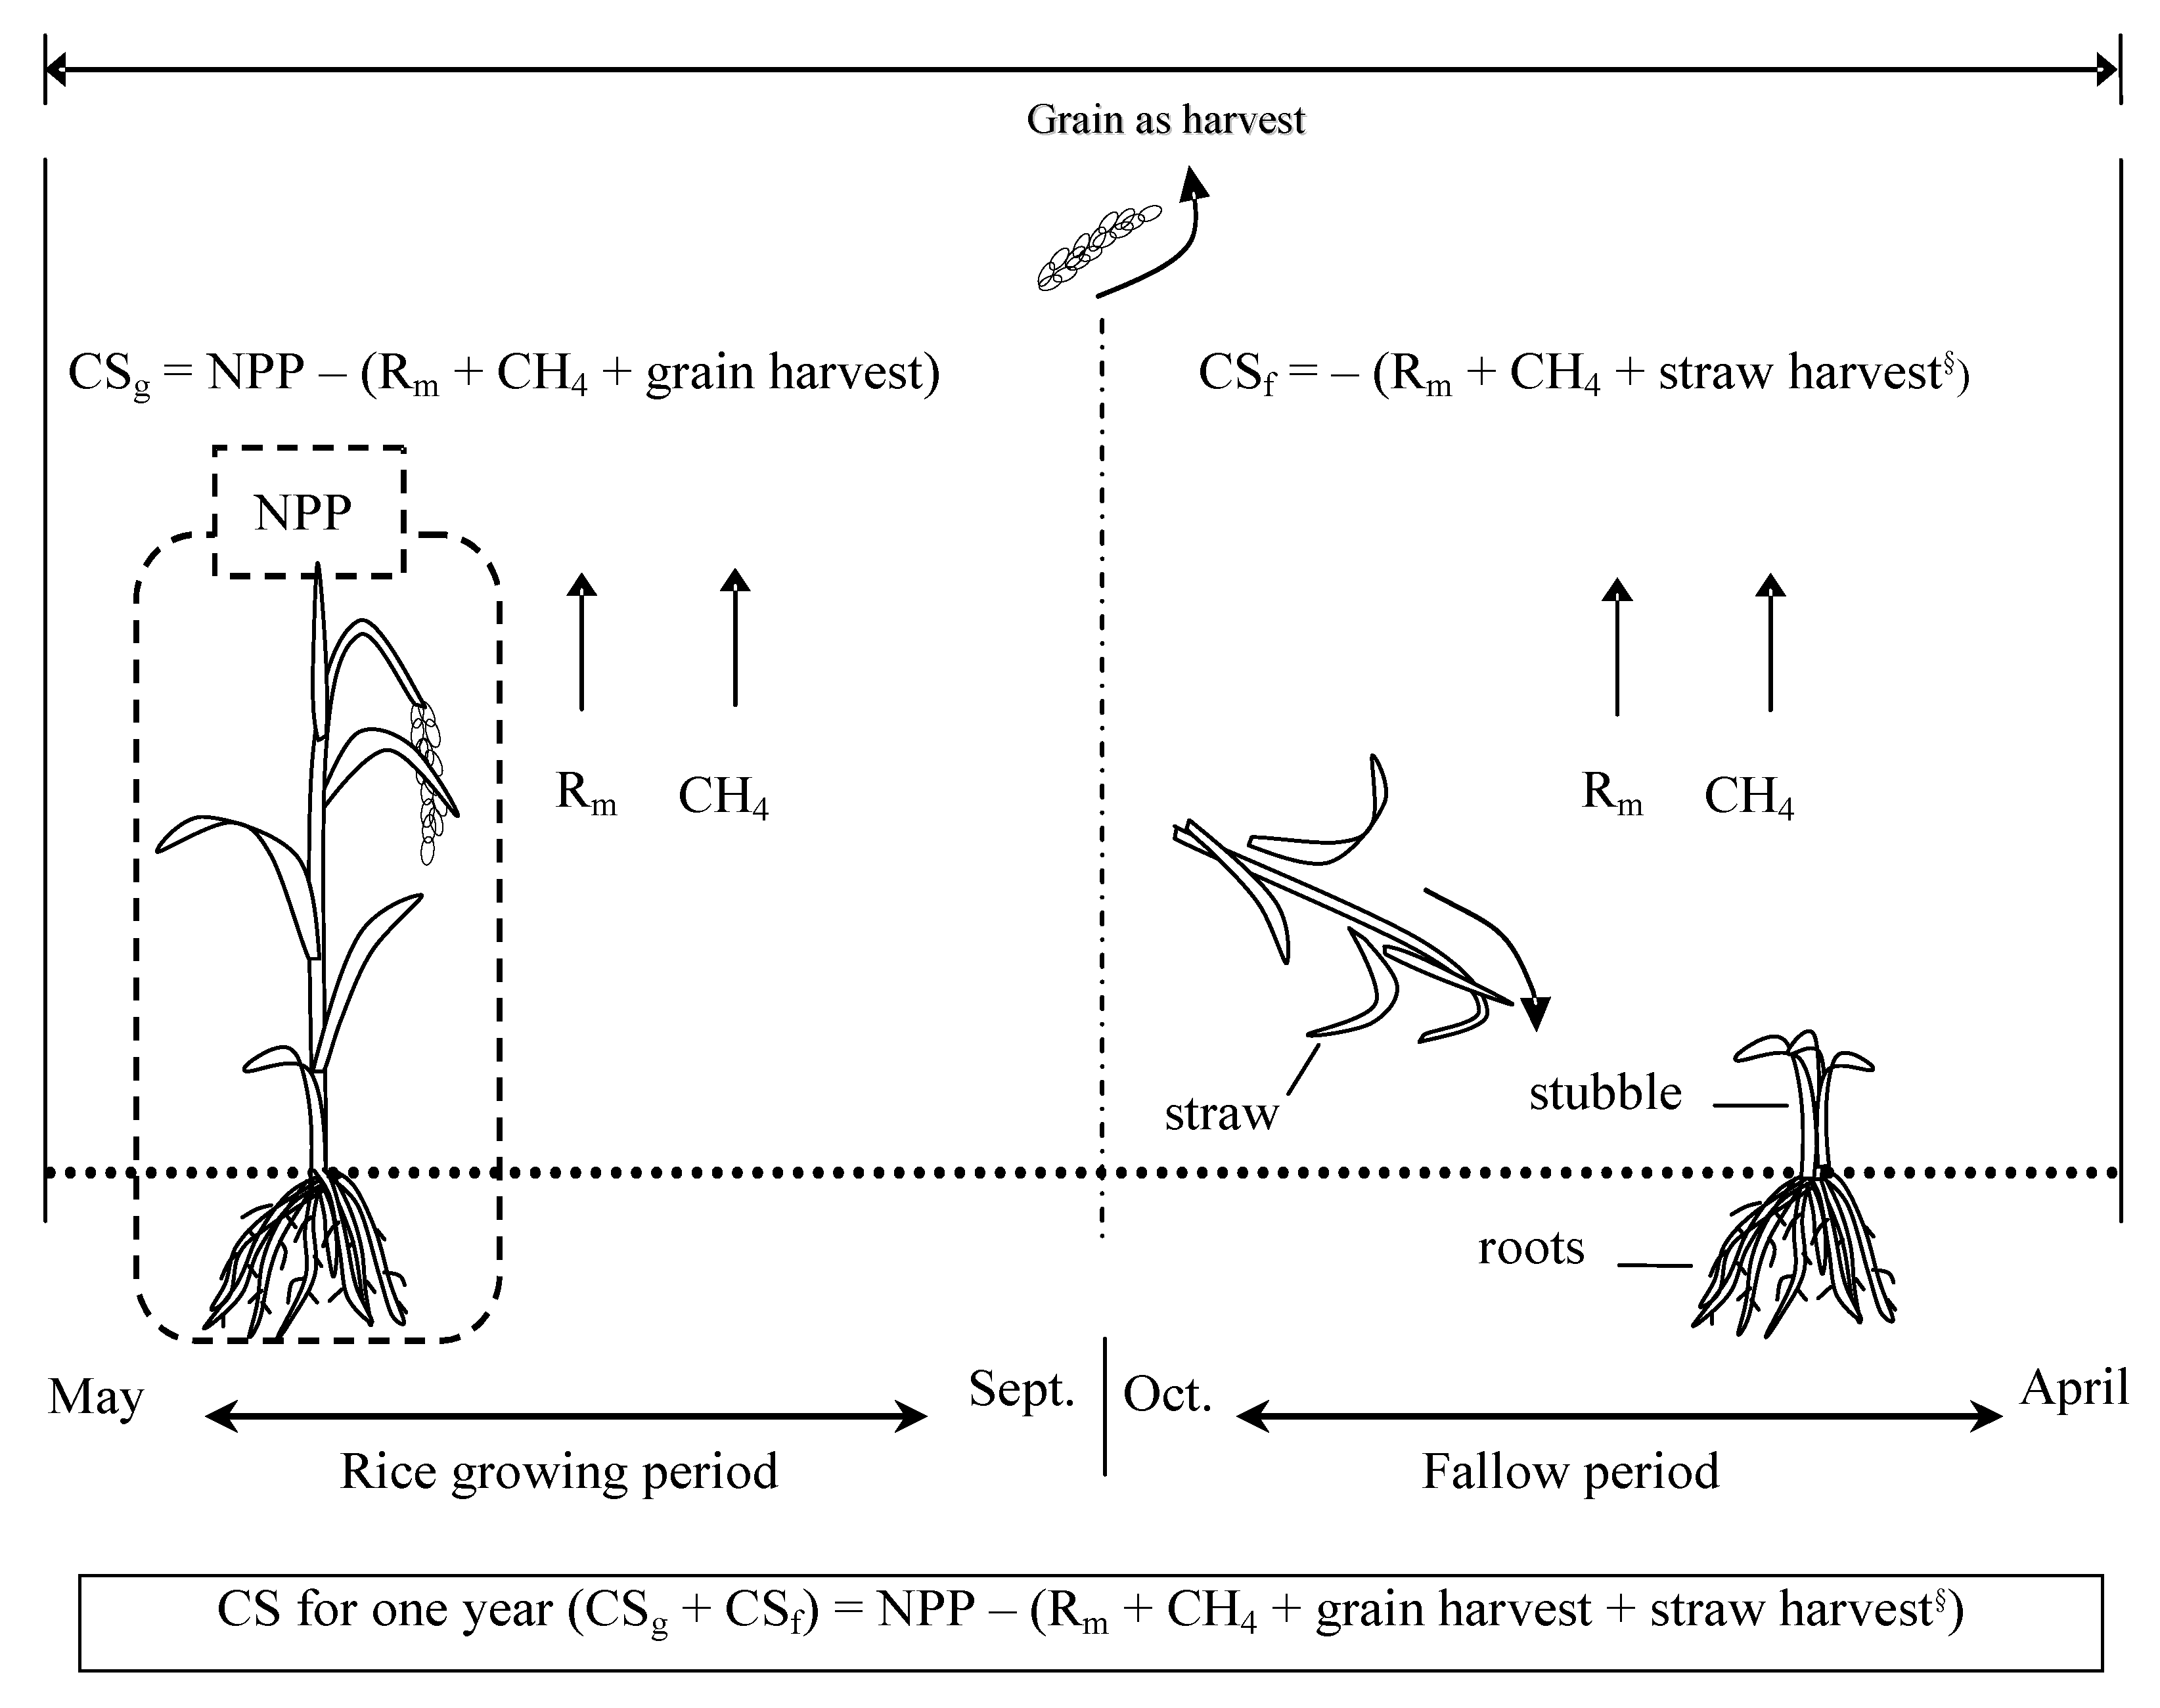
2.7. Soil C Sequestration (CS) Estimation

We used the C budget method to calculate soil CS. Soil CS was estimated to correspond to the difference between NPP and C loss through Rm, CH4 emission and crop C harvest. CS (g C m−2) was calculated as follows for each field (Figure 2).
CSg = NPP − (Rm + CH4 emission + grain harvest) for rice growing period
CSf = − (Rm + CH4 emission + straw harvest) for winter-fallow period
For one year:
CSg + CSf = NPP − (Rm + CH4 emission + grain harvest + straw harvest)
where, CSg and CSf are the CS during rice growing and winter-fallow period, respectively; Rice grain and straw yields of three 1-m2 quadrate were investigated. Grain and straw C was calculated from dry weight and C content was determined by C–N analyzer.

2.8. Global Warming Potentials (GWP) Estimation

The GWP (g CO2 equivalent m−2 season−1) was computed using a 100-year time horizon as suggested by IPCC [1] from the GHG emissions of each field (conversion factors of 1 for CO2, 28 for CH4 and 265 for N2O). The estimation of GWP as follows:
Net GWP = CO2 GWP + CH4 GWP + N2O GWP
where, CO2 GWP = − (CS + CH4) (g CO2-C m−2 season−1) × (44/12); CH4 GWP = CH4 (g CH4-C m−2 season−1) × (16/12) × 28; and N2O GWP = N2O (g N2O-N m−2 season−1) × (44/28) × 265.

2.9. Statistical Analysis

Treatment effects were determined by analysis of variance with the help of statistical package Excel Statistics version 4.0 (Esumi Co. Ltd., Tokyo, Japan) and mean separation was tested by Tukey HSD. To compare the gas fluxes values from the growing season with the fallow period in this study, a t-test for paired comparison was done with the help of statistical package Statistix10 (Analytical Software, Tallahassee, FL, USA).

3. Results

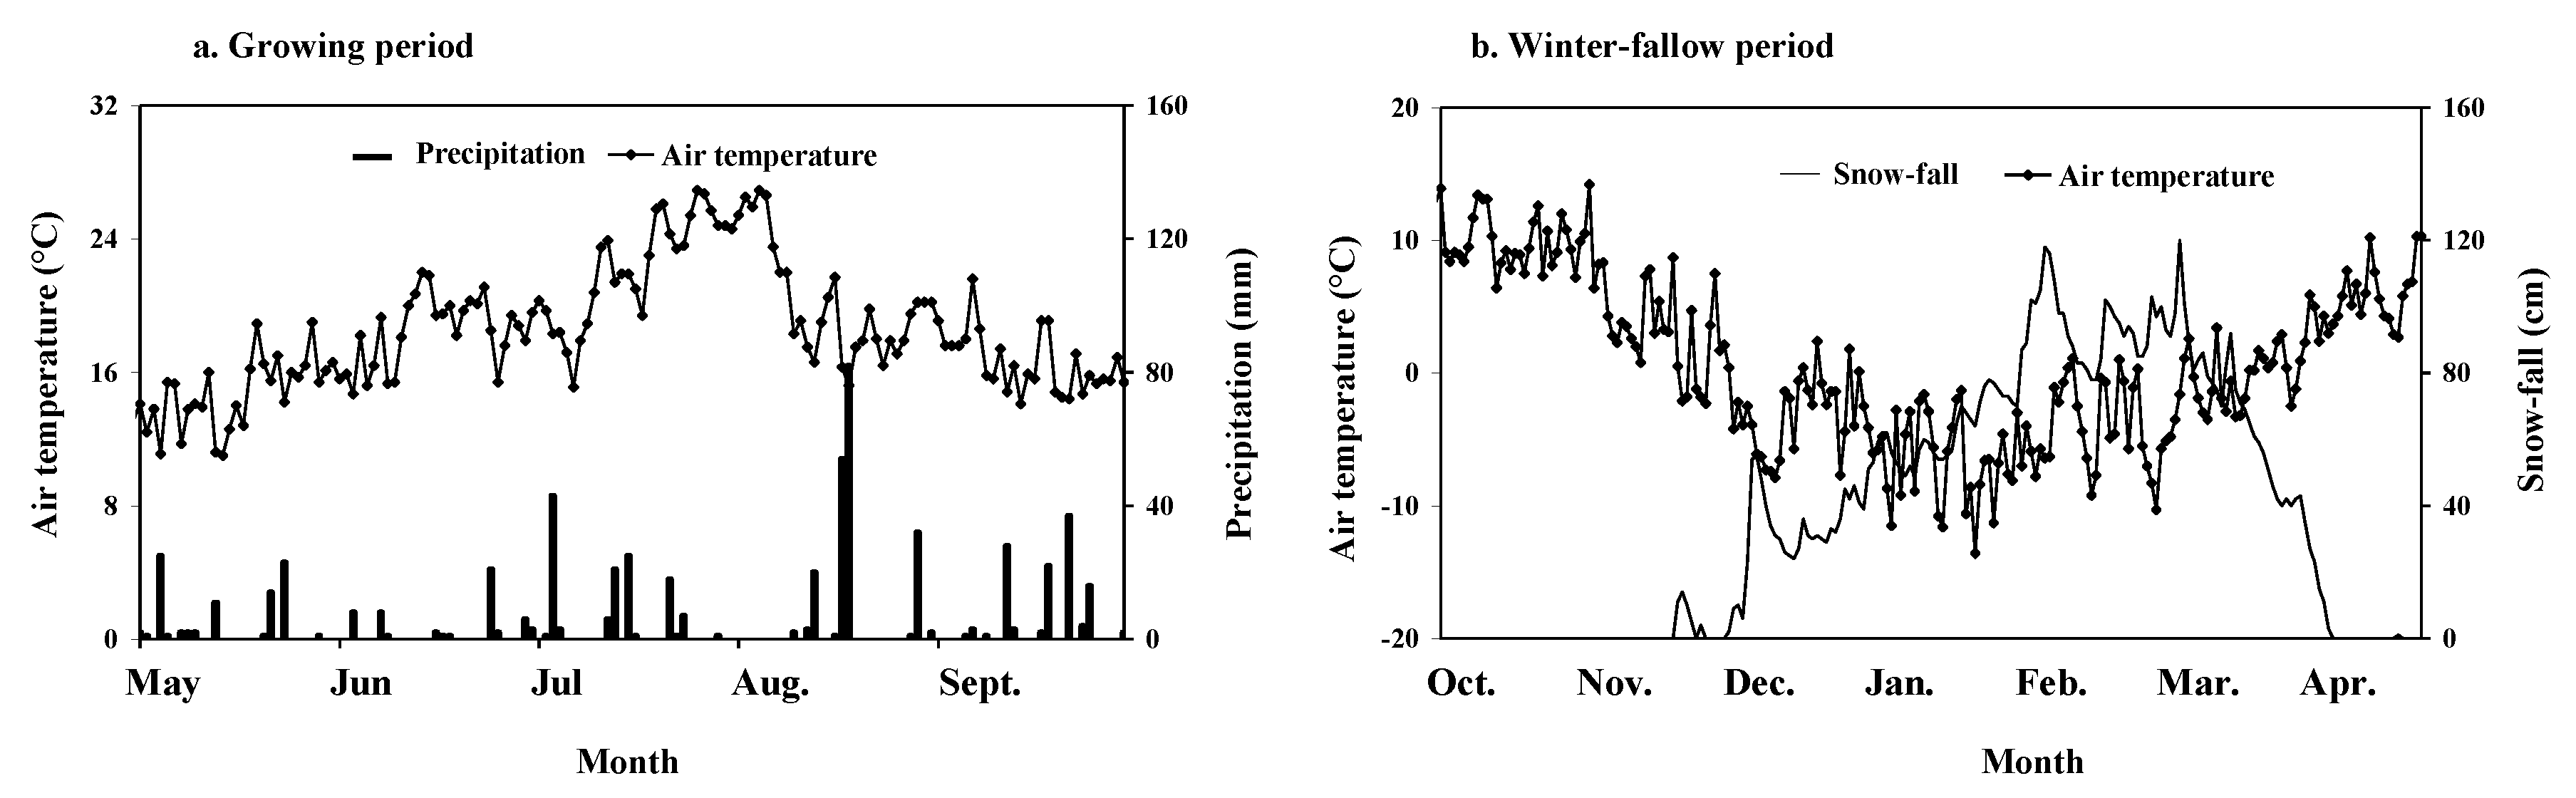
3.1. Climatic Conditions

Meteorological data were recorded during the rice growing and winter-fallow periods and presented in Figure 3a,b. The mean air temperature was 17.9 °C (ranged, 12.9 to 21.1 °C) during the rice-growing period (late May to September), which was 5.1 °C lower than the average soil temperature at a depth of 3 cm. During the rice-growing period, the total precipitation was 611 mm, representing 48% of the total annual precipitation (1265 mm). The average air temperature after harvest to before the first snowfall (October to late November) was 8.2 °C (ranged, 0.80 to 14.2 °C). The average air temperature was −2.2 °C (ranged, −13.6 to 10.2 °C) during the snowy period (late November to late April) and the average snow depth was 58 cm (ranged, 0 to 120 cm). The mean annual temperature was 7.94 °C, 0.80 °C higher than the 10-year average (7.14 °C) and 87.5 mm higher than the 10-year average (1177.5 mm) annual total precipitation.

3.2. Greenhouse Gas Fluxes (Rm, CH4 and N2O)

During the rice growing and the winter-fallow period (Table 3a), the cumulative Rm of the three paddy fields (D1-M, D2-M and D3-S) ranged from 234 to 284 and 188 to 235 g C m2 season1, respectively. The D2-M field annual cumulative Rm showed the highest rate (519) and the lowest rate (422) was D3-S (Table 3b). During the rice growing season, the cumulative Rm was 54.7 to 55.5% of the total annual Rm.
The cumulative CH4 emissions from paddy fields ranged from 75.5 to 116 g C m−2 during the rice growing season (Table 3a) (this cumulative CH4 emission data was published in Naser et al. [34]. During the growing season, there was no significant variation in the CH4 fluxes, whereas in the winter-fallow season it varied significantly (p < 0.01), although the CH4 fluxes were very small during the winter-fallow period or appeared to be uptaken (0.119 to −0.019 g C m−2). In rice growing period, the CH4 emission rate was much higher than in winter, and the contribution to total annual emissions was nearly 100% from the rice growing period (Table 3b).
During the rice growing period, the cumulative N2O fluxes (g N m−2 season−1) of the three paddy fields showed low emissions ranging from 0.003 to 0.036 and low uptake as well as emissions ranging from −0.013 to 0.118 during the winter-fallow period (Table 3a). In the winter-fallow season, the N2O emission rate was much higher than the growing season, and the contribution to the total annual emission from the winter-fallow season was 73.5 to 81.3% (Table 3b). There was a significant difference in seasonal fluxes of Rm and CH4 (p < 0.01, p < 0.05, respectively) between growing season and winter-fallow season, and no significant difference in N2O fluxes was observed.

3.3. Soil C Sequestration (CS)

Net primary production (NPP) of D1-M was lower (499 g C m2) compared to those of the other fields in this study showing approximately identical NPP 529 and 530 g C m2 (Table 4). Carbon harvested as grain ranged from 266 g C m−2 to 298 g C m2, representing 53% to 56% of the respective NPP. Carbon Sequestration from paddy fields, including growing season and winter season, was estimated for a full year (Table 5). The negative CS value implies C loss to the atmosphere from the soil. The paddy fields, resulting in negative soil CS (ranged, −305 to −365 g C m−2 yr−1). For all paddy fields, the losses of organic C by Rm, CH4 emission and C harvested as grain exceeded the corresponding NPP values. All fields showed net sources of C during the rice growing and winter-fallow season (Table 6). In the winter-fallow season, the negative CS or C losses were much higher than the growing season, and the contribution to the annual C losses from the winter-fallow season were 62% to 66%.

3.4. Combined Climatic Impact of CO2, CH4 and N2O

The calculated GWP values for all suites of GHGs are presented in Table 7. Positive GWP value indicated global warming and negative GWP value indicated mitigation. The GWPCO2 showed positive GWP (ranged, 3.52 to 196 g CO2 equivalent m−2 growing season−1) from three drainage practiced fields. All fields served as GWPCO2 sources during the winter-fallow season. As a consequence, the GWPCO2 varied from 689 to 861 g CO2 equivalent m−2 winter-fallow season−1. GWPCO2 emissions from fields D1-M, D2-M and D3-S were equal to 85, 81 and 99% of the annual GWPCO2, respectively, during the winter-fallow season.
The GWPCH4 (g CO2 equivalent m2 growing season1) was higher in field D3-S (4312) as it received the highest amount of rice residue (Table 7). The GWPCH4 emissions of D1-M and D2-M were approximately 34–35% lower than the single drainage field (D3-S). GWPCH4 was very small or appeared to be uptaken during the winter-fallow season. In seasonal terms, rice-growing period GWPCH4 contributed almost 100% to the annual GWPCH4.
During the rice growing period, the GWPN2O values of three fields D1-M, D2-M and D3-S were 10.2, 15.1 and 1.36 g CO2 equivalent m−2, respectively (Table 7). The value of GWPN2O from the fields D1-M and D2-M was 8 and 11-fold, respectively, as high as that of the field D3-S. The winter-fallow season status of GWPN2O compared to the growing season showed an increase in N losses from 171 to 284%. Seasonally, 73–79% of the annual GWPN2O was from the winter-fallow season.
The annual net GWP (g CO2 equivalent m−2 yr−1) in the fields D1-M and D2-M showed a comparable value of 3823 and 3990, respectively, and 5016 in the single drainage field (D3-S) (Table 8). Consequently, the D3-S field net annual GWP was 31.2% and 25.7% higher than the D1-M and D2-M field, respectively. The net GWP values (g CO2 equivalent m−2 season−1) in the growing season ranged from 2978 to 4317 and in the winter-fallow season from 699 to 911. Based on seasonal net GWP, the contribution from the growing season to the annual net GWP was 77 to 86%.

4. Discussion

4.1. Soil C Sequestration

In this study, the CS values ranged from −305 to −365 g C m2 yr1, suggesting that C obtained as a result of NPP was not enough to offset C losses from paddy soils by Rm, CH4 emission and C harvested as grain (Table 6). Thus, these paddy-fallow ecosystems were net sources of atmospheric CO2. Paustian et al. [35] stated that the net difference between the photosynthetically-fixed CO2 that enters the soil as plant residue and the CO2 released from decomposition is much smaller, but higher CO2 emissions was found in our study. This disparity decides the ecosystem’s net C balance, i.e., whether it is a CO2 source or sink.
Our estimated CS values (ranged, −305 to −365 g C m2 yr1) were larger than those recorded by Minamikawa and Sakai [13] from the single-crop paddy field in Tsukuba, Ibaraki, Japan (range −32 to −188 g C m2 yr1). In a single-cropping paddy field in Tsukuba, Japan, Koizumi [36] quantified the soil C budget in which harvested rice straw was not integrated into the soil and the field was continuously flooded, with a loss of 21.0 g C m−2 in the annual C budget. Our results contrast with the findings of Liping and Erda [37], who reported that paddy soils store more C than upland soils, or prevent C emissions, as a result of converting upland soils to paddy soils. Furthermore, Xiao et al. [15] stated that rice paddy ecosystems during the growing season could act as a significant CO2 sink. The explanation why their findings vary from our study might be due to different climatic conditions (subtropical climate with the mean temperature was about 25 °C during growing season in Shanghai, China), soil (organic matter content 18.8 g kg−1 and total N 1.24 g kg−1 with high pH 7.9 to 8.0) and management practices (direct seeding and continued flooding until October 2 with intermittent irrigation from July 15 to August 2).
In this study the variations in CS between the three paddy fields were attributed to the practice of crop residue management and drainage [38]. Adding crop residues affects CS in two ways: C storage is achieved by adding rice straw to the soil, and rice straw residues increase emissions of both Rm and CH4 [9,39]. Drainage and flooding also affect the state of decomposition of organic matter (aerobic or anaerobic), with the effect that responsible microorganisms change [40]. Rees et al. [41] indicated that the management of soil and crops may play an important role on CS, which is consistent with our findings. Paddy fields have traditionally been intensively maintained for better rice yield, and many of the field management in the paddy environment are closely related to C cycling [39]. This study has shown that crop residues and water management can lead to different rates of soil C losses. Sainju et al. [42] stated that management practices can increase soil CO2 emissions by devastating soil aggregates, through aeration, adding residues from plants, and oxidizing soil organic C. They also stated that soil-to-atmospheric CO2 emissions are the first phase of soil C loss and provide an initial indicator of soil CS when management practices alter the soil’s organic C. Over the past decade, a number of CS studies have been published [43,44,45,46,47], all of which were performed over a year or longer, mostly from upland cropping. This study was conducted on mineral soil over peat in a paddy-fallow system for one year. If we could summarize the multi-year results, our analysis might be even richer. But we provide an indication to direct the CS calculation of this particular type of soil in the future by calculating CS with one-year data.
The NPP ranged from 499 to 530 g C m−2 in this analysis, resulting in a non-significant variance. Zhang et al. [48] calculated 1578 g C m−2 NPP from rice paddy fields with an application rate of 300 kg N ha1 in Changshu, Jiangsu, China, which was approximately three times higher than our result, probably due to different estimation methods, management practices, variety and soil types. Zhang et al. [47] calculated NPP by adding grain, straw, root, litter and rhizodeposits. In this study, above ground (grain, straw included litter) and below ground (root) of the rice plant’s biomass was used for calculating NPP. In addition, Omura et al. [49] estimated NPP (ground truth data) from Toyama, Akita, Niigata and Yamagata paddy fields in Japan at 1445, 1563, 1572 and 1738 g m2 (dry matter wt.), respectively. These values were higher than our NPP, which was between 1182 and 1306 g m2 (dry matter wt.). For instance, in Hokkaido University Farm, Shinano et al. [50] reported that the NPP value for 100 kg N ha1 fertilized rice was 632 g C m−2, whereas in the absence of N fertilization it was 170 g C m−2. In addition, Lamptey et al. [51] recorded an NPP value of 859 g C m−2 for 300 kg N ha1 fertilized maize, while it was 455 g C m−2 in the absence of N fertilization. These NPP values of N fertilized rice and maize were higher than those of our investigated fields, possibly due to the application rate of N fertilizer that was four times higher than that of our N applied.

4.2. Greenhouse Gas Fluxes (Rm, CH4 and N2O)

In this study, Rm from paddy soils showed a nearly twofold flux variability, ranging from 422 to 519 g C m2 yr1 (Table 3b), suggesting the levels of Rm altered by agricultural management operations such as water regime [41]. Residues and water management practices play an important role in influencing losses of C by respiration. The soil microbial population movement must have altered considerably in order to take into account the water and residue management observed. Crop residue preservation strengthens the soil structure and maintains the soil water holding capacity. Water availability controls microbiological activity and recognizes microbial species in the soil [52]. There is a relationship between the amount of rice residue and seasonal total Rm which is in agreement with the findings of Li et al. [7]. Soil microflora and fauna respiration also contribute a significant portion of the soil CO2 emissions observed by Sainju et al. [42]. We presume that the changes in soil microbial activity occurred mostly during drainage as a result of changing from anoxic soil under submerged conditions to aerated soil during drainage period [22].
Compared to D3-S with D1-M and D2-M fields, the annual cumulative CH4 emissions in D3-S were about 52% higher due to differences in crop residues and drainage effects. This is consistent with many researchers’ observations [19,53,54] and our previous studies [9]. The D3-S field demonstrated the maximum efficiency of CH4 production [straw’s efficiency on CH4 production = total CH4 emission (g C m−2)/total dry matter of crop residue leftover (g m−2)] during the rice growing season, resulting in high CH4 emissions under the single drainage system as opposed to the double drainage (D1-M and D2-M) fields. D1-M field showed uptake during the winter-fallow season, which could be attributed to relatively lower soil temperature causing lower microbe activity, and CH4 uptake began immediately after harvest, possibly due to deficiency in soil water. Less crop residues and multiple drainage systems minimize CH4 emissions from single drainage by 33 to 34%. Compilation of reported CH4 emission data from major rice growing areas in Asia showed that the average CH4 flux from single and multiple drainages was 60 and 52%, respectively that of continuously flooded rice fields [55]. The two factors regulating the CH4 flux in the rice growing season are organic amendments and the water regime.
During the rice-growing and winter-fallow season, very low levels of N2O flux were observed and significantly differed among the fields (p < 0.05 and p < 0.01, respectively for rice-growing and winter-fallow period). In this study, total N2O emissions were higher in the fallow season than in the rice growing season, possibly due to the comparatively low rate of N fertilization, rice straw, and water management. Nishimura et al. [56] and Toma et al. [57] have reported similar findings. During the rice growing season, we observed very low N2O emissions, although these fields received enormous amounts of rice straw and different water management. Straw incorporation in the rice-growing season tended to decrease N2O emissions [58,59]. The observed declines in N2O in the presence of straw incorporation during the rice-growing season may be explained by the following: decomposition of crop residues with a high C:N ratio may enhance microbial N immobilization, resulting in less N available for nitrification and denitrification, consequently decreased N2O emissions [60,61]. In fact there is some evidence that even high straw amendments may reduce N2O emissions from rice fields [62,63,64]. In contrast, incorporation of plant residues to facilitate N loss has been frequently observed [65,66]. Granli and Bøckman [67] reported that nitrification progresses gradually when the soil is continuously submerged with a water layer, while denitrification progresses rapidly towards N2, and the water layer severely impedes N2O diffusion in the soil. The N2O emission levels from the rice paddy field to the atmosphere were generally considered to be very small. Normally, low N2O fluxes occur during flooding times, while high N2O fluxes occur during temporary drainage periods [60,68,69,70].
Mainly the management practices direct the annual total CO2, CH4 and N2O fluxes. Over the growing period, water management influenced CO2 and CH4 emissions, although this depended on the drainage length [71]. These studies also indicate that the effects of straw addition on CH4 emissions are sturdily dependent on management (water management that promotes aerobic conditions during drainage) and climatic conditions, as reported in our previous study [34]. It can also be attributed, however, to the delay in reducing N2O to N2 by denitrification [57].

4.3. Combined Climatic Impact of CO2, CH4 and N2O

There is very limited research on paddy ecosystem GWP, including rice growing and fallow time. Earlier Zou et al. [60] estimated GWPs using IPCC factors [72] to determine the combined climate impacts in rice paddies only from CH4 and N2O emissions under various farming practices and not CO2 emissions estimates. In addition, Xiao et al. [15] estimated net GWP (g CO2 equivalent m−2 yr−1) in paddy field where the GWP of N2O and CH4 emission estimation procedure was quite close to the reported values in the present study (Table 7). Therefore, the major difference between their analysis and ours in net GWP resulted solely from the difference in GWPCO2 estimation. The estimate of GWPCO2 was based on the C budget approach in our study. Robertson et al. [73] and Six et al. [74] noted that the soil organic C (SOC) transition or soil respiration should be calculated in order to estimate soil GWP. By calculating shifts in SOC storage, Six et al. [75] and Yu & Patrick [76] measured the GWP of different soils. The IPCC [1] also recommends using the same approach to measure GWP.
In this study, the annual net GWP values from three paddy fields were higher than those for paddy and upland crops in other studies might be due to the effects of straw and water management on CO2-equivalent emissions [71]. Hadi at el. [77] reported that 2091 (g CO2 equivalent m−2 growing season−1) was net GWP from intermittently drained paddy fields in South Kalimantan, Indonesia. Moreover, Wu et al. [74] estimated that the net GWP was 890 g CO2 equivalent m−2 yr−1 for the field that flooded during the rice season but was drained during the mid-season and harvest period. Those values are lower than our study’s. The trend of net GWP growth is largely driven by the increase of CH4 emissions from the fields studied. In this study, the fields with positive net GWP showed that annual GWPCH4 representing 71.9 to 86.1% of the annual net GWP. In seasonal aspect, GWPCH4 contributed 100% to the annual net GWP mainly from the rice growing period. On the other hand, from the winter-fallow season, GWPCO2 and GWPN2O contributed 81 to 99% and 73 to 79%, respectively to the annual net GWP. Under similar environmental conditions, a previous paddy field study was conducted in the same area; CH4 was estimated to account for 95% of total CO2-equivalent emissions based on GWP [78]. Xiao et al. [15] recorded an estimated annual net GWP (g CO2 equivalent m2) of 640 to 1124 in the paddy field, and emissions of CH4 contributed 90% to 99% of net GWP. These results showed that CH4 dominated the positive net GWP of the rice paddy, while CO2 dominated the upland crops. The proportion of GWPCO2, GWPCH4 and GWPN2O’s contribution (%) to net GWP was 13.8 to 26.5, 71.9 to 86.1 and 0.13 to 1.61, respectively. This indicates that CH4 was a major contributor to GWP in the paddy field and was governed by management practices especially residue and water regimes. However, In line with the results of previous studies, net GWP was dominated by CH4 emissions [79,80,81].

5. Conclusions

Paddy-fallow cropping systems could be sources of atmospheric CO2, CH4 and N2O. Carbon sequestration in all paddy fields showed negative values i.e., C loss. Due to the impact of residue management followed by water management on C fluxes (CO2-C and CH4-C), the loss of C may not be compensated by NPP. The annual GWPCH4 accounted for 71.9 to 86.1 % of the annual net GWP and that contribution occurred entirely during the rice growing period. This findings show that CH4 dominated the net GWP of the rice paddy. If this study had been carried out for more than a year, it would have been addressed better. Nonetheless, the CS estimation method described in this study will aid progress in calculating C input and loss from paddy soils and will provide us with more precise ways to assess changes in soil C stocks, thereby reducing the uncertainties underlying soil C stock predictions in paddy ecosystems. The present study implied that the paddy field is more potent to loss C than to store C. For paddy-fallow ecosystems, however, management practices such as residue and water regime may be the main options for managing the C budget. Our process drawbacks for calculating CS potential (as compared with other methods) as we measured CS using C base gases, i.e., CO2-C and CH4-C; very few or none have yet estimated. The degree of increased sequestration of soil C and conservation of soil C in paddy field is still not well known. To reduce C-based GHG emissions from paddy fields, more studies with focus on soil C sequestration are required.

Author Contributions

H.M.N., O.N. and R.H. conceived and designed the experiments; H.M.N. and O.N. performed the experiments; H.M.N., O.N. and S.S. analyzed the data; all of the authors contributed reagents/materials/analysis tools and wrote the paper. All authors have read and agreed to the published version of the manuscript.

Funding

This study was partly supported by the Global Environment Research Program of the Ministry of the Environment of Japan (No. S3-3a).

Acknowledgments

We would like to thank Satsuki Tamura for her cooperation during this study and Tahsin Sakif, West Virginia University, USA for his English checking.

Conflicts of Interest

The authors declare no conflict of interest.

References

  1. IPCC—Intergovernmental Panel on Climate Change. Climate Change 2014: Synthesis Report. Contribution of Working Groups I, II and III to the Fifth Assessment Report of the Intergovernmental Panel on Climate Change; Core Writing Team, Pachauri, R.K., Meyer, L.A., Eds.; IPCC: Geneva, Switzerland, 2014; p. 87. [Google Scholar]
  2. Nazaries, L.; Murrell, J.C.; Millard, P.; Baggs, L. Singh BK Methane, microbes and models: Fundamental understanding of the soil methane cycle for future predictions. Environ. Microbiol. 2013, 15, 2395–2417. [Google Scholar] [CrossRef]
  3. FAOSTAT. Emissions—Agriculture. Emissions of Methane and Nitrous Oxide Produced from Agricultural Activities; Average: Rome, Italy, 2014; pp. 1990–2013. [Google Scholar]
  4. WRI. World Resources Institute World Greenhouse Gas Emissions in 2005. Available online: http://www.wri.org/publication/world-greenhouse-gas-emissions-2005 (accessed on 24 December 2014).
  5. Davidson, E.A. The contribution of manure and fertilizer nitrogen to atmospheric nitrous oxide since 1860. Nat. Geosci. 2009, 2, 659–662. [Google Scholar] [CrossRef]
  6. Miyata, A.; Leuning, R.; Denmead, O.T.; Kim, J.; Harazono, Y. Carbon dioxide and methane fluxes from an intermittently flooded paddy field. Agric. For. Meteorol. 2000, 102, 287–303. [Google Scholar] [CrossRef]
  7. Li, C.; Mosier, A.; Wassmann, R.; Cai, Z.; Zheng, X.; Huang, Y.; Tsuruta, H.; Boonjawat, J.; Lantin, R. Modeling greenhouse gas emissions from rice-based production systems: Sensitivity and upscaling. Glob. Biogeochem. Cycles 2004, 18. [Google Scholar] [CrossRef]
  8. Sass, R. Spatial and temporal variability in methane emissions from rice paddies: Implications for assessing regional methane budgets. Nutr. Cycle Agroecosyst. 2002, 64, 3–7. [Google Scholar] [CrossRef]
  9. Naser, H.M.; Nagata, O.; Tamura, S.; Hatano, R. Methane emissions from five paddy fields with different amounts of rice straw application in central Hokkaido, Japan. Soil Sci. Plant Nutr. 2007, 53, 95–101. [Google Scholar] [CrossRef] [Green Version]
  10. Towprayoon, S.; Smakgahn, K.; Poonkaew, S. Mitigation of methane and nitrous oxide emissions from drained irrigated rice fields. Chemosphere 2005, 59, 1547–1556. [Google Scholar] [CrossRef]
  11. Bruce, C.B.; Scott, A.; Parker, J.P. Field N2O, CO2 and CH4 fluxes in relation to tillage, compaction and soil quality in Scotland. Soil Till. Res. 1999, 53, 29–39. [Google Scholar]
  12. Liou, R.M.; Huang, S.N.; Lin, C.W. Methane emission from fields with differences in nitrogen fertilizers and rice varieties in Taiwan paddy soils. Chemosphere 2003, 50, 237–246. [Google Scholar] [CrossRef]
  13. Zou, J.W.; Huang, Y.; Zong, L.G.; Zheng, X.H.; Wang, Y.S. A field study on CO2 CH4 and N2O emissions from rice paddy and impact factors. Acta Sci. Circumstantiae 2003, 23, 758–764. [Google Scholar]
  14. Tang, J.; Liang, S.; Li, Z.; Zhang, H.; Wang, S.; Zhang, N. Emission Laws and Influence Factors of Greenhouse Gases in Saline-Alkali Paddy Fields. Sustainability 2016, 8, 163. [Google Scholar] [CrossRef] [Green Version]
  15. Xiao, Y.; Xie, G.; Lu, C.; Ding, X.; Lu, Y. The value of gas exchange as a service by rice paddies in suburban Shanghai, PR China Agriculture. Ecosyst. Environ. 2005, 109, 273–283. [Google Scholar] [CrossRef]
  16. Miller, B.G. Coal Energy Systems; Elsevier Academic Press: Burlmgton, MA, USA, 2005; p. 116. [Google Scholar]
  17. Minamikawa, K.; Sakai, N.; Hayashi, H. The effects of ammonium sulfate application on methane emission and soil carbon content of a paddy field in Japan. Agric. Ecosyst. Environ. 2005, 107, 371–379. [Google Scholar] [CrossRef]
  18. Wang, C.; Lai, D.Y.F.; Sardans, J.; Wang, W.; Zeng, C.; Peñuelas, J. Factors related with CH4 and N2O Emissions from a paddy field: Clues for Management implications. PLoS ONE 2017, 12, e0169254. [Google Scholar] [CrossRef] [Green Version]
  19. Yu, K.; Chen, G. Reduction of global warming potential contribution from a rice field by irrigation, organic matter, and fertilizer management. Glob. Biogeochem. Cycles 2004, 18. [Google Scholar] [CrossRef] [Green Version]
  20. Fang, J.; Yu, G.; Liu, L.; Hu, S.; Chapin, F.S., III. Climate change, human impacts, and carbon sequestration in China. Proc. Natl. Acad. Sci. USA 2018, 115, 4015–4020. [Google Scholar] [CrossRef] [Green Version]
  21. Ramesh, K.; Chandrasekaran, B. Soil organic carbon build-up and dynamics in rice-rice cropping systems. J. Agron. Crop Sci. 2004, 190, 21–27. [Google Scholar] [CrossRef]
  22. Witt, C.; Cassman, K.G.; Olk, D.C.; Biker, U.; Liboon, S.P.; Samson, M.I.; Ottow, J.C.G. Crop rotation and residue management effects on carbon sequestration, nitrogen cycling and productivity of irrigated rice systems. Plant Soil 2000, 225, 263–278. [Google Scholar] [CrossRef]
  23. Wang, W.; Lai, D.Y.F.; Sardans, J.; Wang, C.; Datta, A.; Pan, T.; Zeng, C.; Bartrons, M.; Peñuelas, P. Rice straw incorporation affects global warming potential differently in early vs. late cropping seasons in Southeastern China. Field Crop. Res. 2015, 18, 42–51. [Google Scholar] [CrossRef] [Green Version]
  24. Ali, M.A.; Hoque, M.A.; Kim, P.J. Mitigating Global Warming Potentials of Methane and Nitrous Oxide Gases from Rice Paddies under different irrigation regimes. AMBIO 2013, 42, 357–368. [Google Scholar] [CrossRef] [Green Version]
  25. Rath, A.K.; Swain, B.; Ramakrishnan, B.; Panda, D.; Adhya, T.K.; Rao, V.R.; Sethunathan, N. Influence of fertilizer management and water regime on methane emission from rice fields. Agric. Ecosyst. Environ. 1999, 76, 99–107. [Google Scholar] [CrossRef]
  26. Zhou, J.; Tachibana, H. Land Use/Cover Changes in Sarobetsu Mire, Hokkaido, since circa 1900. Rep. Taisetsuzan Inst. Sci. 2002, 36, 1–12. [Google Scholar]
  27. Itoh, S.; Komada, M.; Kimiwada, K.; Awasaki, H. Experiment of Restoring High-Moor Plant Community Based on Ground Water Environment of Peatland; Research bulletin no. 173 of the Hokkaido National Agricultural Experiment Station; Hokkaido National Agricultural Experiment Station: Sapporo, Japan, 2001.
  28. Battany, M.; Grismer, M. Rainfall runoff and erosion in Napa Valley vineyards: Effects of slope, cover and surface roughness. Hydrol. Process. 2000, 14, 1289–1304. [Google Scholar] [CrossRef]
  29. Arnold, J.; Potter, K.; King, K.; Allen, P. Estimation of soil cracking and the effect on surface runoff in a Texas Blackland Prairie watershed. Hydrol. Process. 2005, 19, 589–603. [Google Scholar] [CrossRef]
  30. Bouman, B.; Tuong, T.P. Field water management to save water and increase its productivity in irrigated lowland rice. Agric. Water Manag. 2001, 49, 11–30. [Google Scholar] [CrossRef]
  31. Hanson, P.J.; Edwards, N.T.; Garten, C.T.; Andrews, J.A. Separating root and soil microbial contributions to soil respiration. A review of methods and observations. Biogeochemistry 2000, 48, 115–146. [Google Scholar] [CrossRef]
  32. Jeon, W.T. Rice root distribution and rice-based cropping systems for sustainable soil-rhizosphere management. In International Workshop on Sustained Management of the Soil-Rhizosphere System for Efficient Crop Production and Fertilizer Use; Land Development Department: Bangkok, Thailand, 2006; pp. 16–20. [Google Scholar]
  33. Zhang, H.L.; Bai, X.L.; Xue, J.F.; Chen, Z.D.; Tang, H.M.; Chen, F. Emissions of CH4 and N2O under Different Tillage Systems from Double-Cropped Paddy Fields in Southern China. PLoS ONE 2013, 8, e65277. [Google Scholar] [CrossRef] [Green Version]
  34. Naser, H.M.; Nagata, O.; Sultana, S.; Hatano, R. Impact of management practices on methane emissions from paddy grown on mineral soil over peat in Central Hokkaido, Japan. Atmosphere 2018, 9, 212. [Google Scholar] [CrossRef]
  35. Paustian, K.; Six, J.; Elliot, E.T.; Hunt, H.W. Management options for reducing CO2 emission from agricultural soils. Biogeochemistry 2000, 48, 147–163. [Google Scholar] [CrossRef]
  36. Koizumi, H. Carbon cycling in croplands. In Structure and Function in Agroecosystem Design and Management; Shiyomi, M., Koizumi, K., Eds.; CRC Press: Boca Raton, FL, USA, 2001; pp. 207–226. [Google Scholar]
  37. Liping, G.; Erda, L. Carbon sink in cropland soils and the emission of greenhouse gases from paddy soils: A review of work in China. Chemosphere 2001, 3, 413–418. [Google Scholar] [CrossRef]
  38. Islam, S.F.; Groenigen, J.W.; Jensen, L.S.; Sander, B.O.; de Neergaard, A. The effective mitigation of greenhouse gas emissions from rice paddies without compromising yield by early-season drainage. Sci. Total Environ. 2018, 612, 1329–1339. [Google Scholar] [CrossRef] [PubMed]
  39. Ibrahim, M.; Cao, C.G.; Zhan, M.; Li, C.F.; Iqbal, J. Changes of CO2 emission and labile organic carbon as influenced by rice straw and different water regimes. Int. J. Environ. Sci. Technol. 2015, 12, 263–274. [Google Scholar] [CrossRef]
  40. Kimura, M. Source and fate of organic-c in paddy field ecosystem. In Proceedings of the 9th U.S.–Japan Workshop on Global Change. Carbon Cycle Management in Terrestrial Ecosystems, Mita Conference Hall, Tokyo, Japan, 9–11 October 2001; p. 42. [Google Scholar]
  41. Rees, R.M.; Bingham, I.J.; Baddeley, J.A.; Watson, C.A. The role of plants and land management in sequestering soil carbon in temperate arable and grassland ecosystems. Geoderma 2005, 128, 130–154. [Google Scholar] [CrossRef]
  42. Sainju, U.M.; Jabro, J.D.; Stevens, W.B. Soil Carbon Dioxide Emission as Influenced by Irrigation, Tillage, Cropping System, and Nitrogen Fertilization. J. Environ. Qual. 2008, 37, 98–106. [Google Scholar] [CrossRef] [PubMed] [Green Version]
  43. Plaza-Bonilla, D.; Arrúe, J.L.; Cantero-Martínez, C.; Fanlo, R.; Ana Iglesias, A.; Álvaro-Fuentes, J. Carbon management in dryland agricultural systems. A review. Agron. Sustain. Dev. 2015, 35, 1319–1334. [Google Scholar] [CrossRef] [Green Version]
  44. Follett, R.F.; Schuman, G.E. Grazing land contributions to carbon sequestration. In Grassland: A Global Resource. Plenary and Invited Papers from the XX International Grassland Congress, Dublin, Ireland; McGilloway, D.A., Ed.; Wageningen Academic Publishers: Wageningen, The Netherlands, 2005; pp. 265–277. [Google Scholar]
  45. Lal, R. Carbon sequestration in dryland ecosystems. Environ. Manag. 2004, 33, 528–544. [Google Scholar] [CrossRef] [PubMed]
  46. Jacinthe, P.A.; Lal, R.; Kimble, J.M. Carbon budget and seasonal carbon dioxide emission from a central Ohio Luvisol as influenced by wheat residue amendment. Soil Tillage Res. 2002, 67, 147–157. [Google Scholar] [CrossRef]
  47. Smith, P. Carbon sequestration in croplands: The potential in Europe and the global context. Eur. J. Agron. 2004, 20, 229–236. [Google Scholar] [CrossRef]
  48. Zhang, X.; Fan, C.; Ma, Y.; Liu, Y.; Li, L.; Zhou, Q.; Xiong, Z. Two approaches for net ecosystem carbon budgets and soil carbon sequestration in a rice–wheat rotation system in China. Nutr. Cycl. Agroecosyst 2014, 100, 301–313. [Google Scholar] [CrossRef]
  49. Omura, Y.; Furumi, S.; Daigo, M.; Muramatsu, K. Estimation of Net Primary Production in Paddy Fields of Japan using Satellite Data. ResearchGate 2005, 1–9. [Google Scholar]
  50. Shinano, T.; Osaki, M.; Tadano, T. Effect of nitrogen application on reconstruction of nitrogen compounds during the maturation stage in several field crops. Soil Sci. Plant Nutr. 1991, 37, 259–270. [Google Scholar] [CrossRef] [Green Version]
  51. Lamptey, S.; Li, L.L.; Xie, J.H. Impact of nitrogen fertilization on soil respiration and net ecosystem production in maize. Plant Soil Environ. 2018, 64, 353–360. [Google Scholar]
  52. Falkowski, P.G.; Fenchel, T.; Delong, E.F. The microbial engines that drive Earth’s biogeochemical cycles. Science 2008, 320, 1034–1039. [Google Scholar] [CrossRef] [Green Version]
  53. Sanchis, E.; Ferrer, M.; Torres, A.G.; Maria, C.L.; Calvet, S. Effect of Water and Straw Management Practices on Methane Emissions from Rice Fields: A Review through a Meta-Analysis. Environ. Eng. Sci. 2012, 29, 1053–1062. [Google Scholar] [CrossRef]
  54. Eusuf, M.K.; Tokida, T.; Sugiyama, S.; Nakajima, M.; Sameshima, R. Effect of rice straw on CH4 emission in continuous and recent converted paddy field. J. Agric. Meteorol. 2011, 67, 185–192. [Google Scholar]
  55. Yan, X.; Yagi, K.; Akiyama, H.; Akimoto, H. Statistical analysis of major variables controlling methane emission from rice fields. Glob. Chang. Biol. 2005, 11, 1131–1141. [Google Scholar] [CrossRef]
  56. Nishimura, S.; Akiyama, H.; Sudo, S.; Fumoto, T.; Cheng, W.; Yagi, K. Combined emission of CH4 and N2O from a paddy field was reduced by preceding upland crop cultivation. Soil Sci. Plant Nutr. 2011, 57, 167–178. [Google Scholar] [CrossRef] [Green Version]
  57. Toma, Y.; Sari, N.N.; Akamatsu, K.; Oomori, S.; Nagata, O.; Nishimura, S.; Purwanto, B.H.; Ueno, H. Effects of green manure application and prolonging mid-season drainage on greenhouse gas emission from paddy fields in Ehime, Southwestern Japan. Agriculture 2019, 9, 29. [Google Scholar] [CrossRef] [Green Version]
  58. Wang, J.Y.; Jia, J.X.; Xiong, Z.Q.; Khalil, M.A.K.; Xing, G.X. Water regime-nitrogen fertilizer-straw incorporation interaction: Field study on nitrous oxide emissions from a rice agroecosystem in Nanjing, China. Agric. Ecosyst. Environ. 2011, 141, 437–446. [Google Scholar] [CrossRef]
  59. Yao, Z.; Zhou, Z.; Zheng, X.; Xie, B.; Mei, B.; Wang, R.; Butterbach-Bahl, K.; Zhu, J. Effects of organic matter incorporation on nitrous oxide emissions from rice-wheat rotation ecosystems in China. Plant Soil 2010, 327, 315–330. [Google Scholar] [CrossRef]
  60. Zou, J.W.; Huang, Y.; Jiang, J.; Zheng, X.; Sass, R. A 3-year field measurement of methane and nitrous oxide emissions from rice paddies in China: Effects of water regime, crop residue, and fertilizer application. Glob. Biogeochem. Cycles 2005, 19. [Google Scholar] [CrossRef]
  61. Ma, J.; Ma, E.D.; Xu, H.; Yagi KCai, Z.C. Wheat straw management affects CH4 and N2O emissions from rice fields. Soil Biol. Biochem. 2009, 41, 1022–1028. [Google Scholar] [CrossRef]
  62. Abao, E.B.; Bronson, K.F.; Wassmann, R.; Singh, U. Simultaneous records of methane and nitrous oxide emissions in rice-based cropping systems under rainfed conditions. Nutr. Cycle Agroecosyst. 2000, 58, 131–140. [Google Scholar] [CrossRef]
  63. Zheng, X.; Wang, M.; Wang, Y.; Shen, L.; Li, L.; Heyer, J.; Koegge, M.; Papen, H.; Jisheng, J.; Laotu, L. Mitigation options for methane, nitrous oxide and nitric oxide emissions from agricultural ecosystems. Adv. Atmos. Sci. 2000, 17, 83–92. [Google Scholar]
  64. Aulakh, M.S.; Khera, T.S.; Doran, J.W.; Bronson, K.F. Denitrification, N2O and CO2 fluxes in rice-wheat cropping system as affected by crop residues, fertilizer N and legume green manure. Biol. Fertil. Soils 2001, 34, 375–389. [Google Scholar] [CrossRef]
  65. Chen, B.; Liu, E.; Tian, Q.; Yan, C.; Zhang, Y. Soil nitrogen dynamics and crop residues. Rev. Agron. Sustain. Dev. 2014, 34, 429–442. [Google Scholar] [CrossRef] [Green Version]
  66. Chèneby, D.; Bru, D.; Pascault, N.; Maron, P.A.; Ranjard, L.; Philippot, L. Role of Plant Residues in Determining Temporal Patterns of the Activity, Size, and Structure of Nitrate Reducer Communities in Soil. Appl. Environ. Microbiol. 2010, 76, 7136–7143. [Google Scholar] [CrossRef] [Green Version]
  67. Granli, T.; Bøckman, O.C. Nitrous oxide from agriculture. Norw. J. Agric. Sci. Suppl. 1994, 12, 34–40. [Google Scholar]
  68. Zheng, X.H.; Wang, M.X.; Wang, Y.S.; Shen, R.X.; Gou, J.; Li, J.; Jin, J.S.; Li, L.T. Impact of soil moisture on nitrous oxide emission from croplands: A case study on the rice-based agro-ecosystem in Southeast China. Chemosphere—Glob. Chang. Sci. 2000, 2, 207–224. [Google Scholar] [CrossRef]
  69. Cai, Z.C.; Laughlin, J.R.; Stevens, R.J. Nitrous oxide and dinitrogen emissions from soil under different water regimes and straw amendment. Chemosphere 2001, 42, 113–121. [Google Scholar] [CrossRef]
  70. Xu, Y.C.; Shen, Q.R.; Li, M.L.; Dittert, K.; Sattelmacher, B. Effect of soil water status and mulching on N2O and CH4 emission from lowland rice field in China. Biol. Fertil. Soils 2004, 39, 215–217. [Google Scholar] [CrossRef]
  71. Minamikawa, K.; Sakai, N. Soil carbon budget in a single-cropping paddy field with rice straw application and water management based on soil redox potential. Soil Sci. Plant Nutr. 2007, 53, 657–667. [Google Scholar] [CrossRef] [Green Version]
  72. IPCC—Intergovernmental Panel on Climate Change. Climate Change 2001. The Scientific Basis. Contribution of Working Group I to the Third Assessment Report of the IPCC; Houghton, J.T., Ding, Y., Griggs, D.J., Noguer, M., van der Linden, P.J., Xiaosa, D., Eds.; Cambridge Univ. Press: Cambridge, UK, 2001. [Google Scholar]
  73. Robertson, G.P.; Paul, E.A.; Harwood, R.R. Greenhouse gases in intensive agriculture: Contributions of individual gases to the radiative forcing of the atmosphere. Science 2000, 289, 1922–1925. [Google Scholar] [CrossRef] [PubMed] [Green Version]
  74. Wu, X.; Wang, W.; Xie, X.; Yin, C.; Hou, H.; Ya, W.; Wang, G. Net global warming potential and greenhouse gas intensity as affected by different water management strategies in Chinese double rice-cropping systems. Sci. Rep. 2018, 8, 779. [Google Scholar] [CrossRef] [Green Version]
  75. Six, J.; Ogle, S.M.; Breidt, F.J.; Conant, R.T.; Mosier, A.R.; Paustian, K. The potential to mitigate global warming with no-tillage management is only realized when practised in the long term. Glob. Chang. Biol. 2004, 10, 155–160. [Google Scholar] [CrossRef] [Green Version]
  76. Yu, K.; Patrick, W.H., Jr. Redox window with minimum global warming potential contribution from rice soils. Soil Sci. Soc. Am. J. 2004, 68, 2086–2091. [Google Scholar] [CrossRef] [Green Version]
  77. Hadi, A.; Inubushi, K.; Yagi, K. Effect of water management on greenhouse gas emissions and microbial properties of paddy soils in Japan and Indonesia. Paddy Water Environ. 2010, 8, 319–324. [Google Scholar] [CrossRef]
  78. Naser, H.M.; Nagata, O.; Hatano, R. Greenhouse gas fluxes and global warming potentials in crop fields on soil-dressed peatland in Hokkaido, Japan. Phyton 2005, 45, 285–293. [Google Scholar]
  79. Shang, Q.Y.; Yang, X.; Gao, C.; Wu, P.; Liu, J.; Xu, Y.; Shen, Q.; Zou, J.; Gao, S. Net annual global warming potential and greenhouse gas intensity in Chinese double rice-cropping systems: A 3-year field measurement in long-term fertilizer experiments. Glob. Chang. Biol. 2011, 17, 2196–2210. [Google Scholar] [CrossRef]
  80. Li, C.; Salas, W.; DeAngelo, B.; Rose, S. Assessing alternatives for mitigating net greenhouse gas emissions and increasing yields from rice production in china over the next twenty years. J. Environ. Qual. 2006, 35, 1554–1565. [Google Scholar] [CrossRef] [Green Version]
  81. Xiong, Z.; Liu, Y.; Wu, Z.; Zhang, X.; Liu, P.; Huang, T. Differences in net global warming potential and greenhouse gas intensity between major rice-based cropping systems in China. Sci. Rep. 2015, 2, 17774. [Google Scholar] [CrossRef] [PubMed] [Green Version]
Figure 1. Placement of chambers and building of boardwalks at each sampling site.
Agriculture 10 00006 g001
Figure 2. Schematic diagram of carbon sequestration (CS) estimation procedure. §Straw harvest depends on management. For example, if farmer leftover all harvested straw on field that time “straw harvest = 0”.
Agriculture 10 00006 g002
Figure 3. (a,b). Climatic conditions of investigated area during rice growing and winter-fallow period.
Agriculture 10 00006 g003
Table 1. Some physical and chemical characteristics of the investigated paddy field soils (initial soil at 0–10 cm depth).
Site §Soil Type Soil PHParticle Size Distribution (%)Soil TextureBulk DensityTotal-NTotal-C
(H2O)SandSiltClay (g cm−3)(g kg−1)(g kg−1)
D1-MSDP5.3828.847.124.2SICL0.963.8657.8
D2-MSDP5.3229.946.923.1SICL0.873.0343.5
D3-SSDP5.4550.933.515.6CL1.151.6524.7
§ D1-M (drainage-multiple); D2-M (drainage-multiple); D3-S (drainage-single). SDP, soil-dressed peat.
Table 2. Summary of management practices of the investigated paddy fields.
Site §Field AreaDates ofNitrogen Fertilizer ApplicationStraw Leftover on Field
Trans-PlantingMultiple/Single DrainageFinal Drainage for HarvestHarvestDry MatterC ConcC Amount
(104 m2)1st Drainage2nd Drainage(kg N ha−1)(g m−2)(%)(g C m−2)
D1-M0.5424-May22-June25-July15-August15-September7652141.7217
D2-M0.4824-May22-June25-July15-August15-September7655840.4225
D3-S0.3525-May-26-July15-August25-September3675139.2295
§ D1-M (drainage-multiple); D2-M (drainage-multiple); D3-S (drainage-single).
Table 3. Seasonal greenhouse gas fluxes and their contribution to total annual gas fluxes from paddy-fallow cropping systems. (a) Seasonal greenhouse gas fluxes from paddy-fallow cropping systems. (b) Total annual gas fluxes from paddy-fallow cropping systems and proportion of contribution from rice growing or winter-fallow season to annual total emission.
(a)
Site §Gas Fluxes
Rice Growing Season (G )
(June to September)
Winter-Fallow Season (F )
(October to April)
Rm NSCH4 NSN2O *Rm NSCH4 **N2O **
(g C m−2)(g C m−2)(g N m−2)(g C m−2)(g C m−2)(g N m−2)
D1-M274 ± 71.475.5 ± 24.60.024 ± 0.018 b223 ± 53.8−0.019 ± 0.008 c0.067 ± 0.016 b
D2-M284 ± 88.276.8 ± 30.00.036 ± 0.016 a235 ± 55.60.039 ± 0.015 b0.118 ± 0.027 a
D3-S234 ± 72.2116 ± 23.50.003 ± 0.004 c188 ± 44.90.119 ± 0.029 a0.013 ± 0.004 c
(b)
Site §Annual Total Gas Fluxes
(m−2 yr−1)
Proportion of Contribution from G or F to Annual Total Emission
CO2CH4N2OCO2CH4N2O
(g C)(g C)(g N)(%)
D1-M49775.50.09155.1 G100 G73.5 F
D2-M51976.80.15454.7 G100 G76.6F
D3-S4221160.01655.5G100 G81.3 F
§ D1-M (drainage-multiple); D2-M (drainage-multiple); D3-S (drainage-single). G, rice growing season. F, winter-fallow season. Values in a column followed by a common letter are not significantly different at * p < 0.05 and ** p < 0.01. NS, non significant.
Table 4. Rice variety, net primary production (NPP) and grain yield of rice with their C content.
Site §Rice VarietyGrain YieldNet Primary Production (Whole Plant )
Dry MatterC ContentC Amount Dry MatterC ContentC Amount
(g m−2)(%)(g C m−2)(g m−2)(%)(g C m−2)
D1-MKirara 397627 ± 75.742.4 ± 0.25266 ± 32.31182 ± 13842.3 ± 0.33499 ± 57.7
D2-MNanatsuboshi710 ± 42.742.0 ± 0.22298 ± 17.41278 ± 66.841.3 ± 0.08529 ± 27.6
D3-SKirara 397713 ± 10.341.6 ± 0.22297 ± 5.151306 ± 4.9240.6 ± 0.36530 ± 2.18
§ D1-M (drainage-multiple); D2-M (drainage-multiple); D3-S (drainage-single). Whole rice plant (total biomass) includes grain, straw with litter and roots.
Table 5. Annual C sequestration from paddy-fallow cropping systems.
Site §NPP
(Whole Plant)
Grain YieldAnnual Emission C Sequestration
RmCH4
(g C m−2)(g C m−2)(g C m−2 yr−1)(g C m−2 yr−1)(g C m−2 yr−1)
D1-M49926649775.5−339
D2-M52929851976.8−365
D3-S530297422116−305
§ D1-M (drainage-multiple); D2-M (drainage-multiple); D3-S (drainage-single). C sequestration = NPP– (Rm + CH4 + grain harvest + straw harvest); Note: all harvested straw leftover on fields, i.e., straw harvest = 0.
Table 6. Seasonal CS or C loss and their contribution to annual CS or C loss.
Site §CS in Growing Season CS in Winter-Fallow SeasonCS yr−1Proportion of Contribution
to Annual C Loss from G or F
(g C m−2 season−1)(g C m−2 season−1)(g C m−2 yr−1)(%)
D1-M−116−223−33966 from F
D2-M−130−235−36564 from F
D3-S−116−188−30562 from F
§ D1-M (drainage-multiple); D2-M (drainage-multiple); D3-S (drainage-single). G, rice growing season. F, winter-fallow season. C sequestration (CS growing season−1) = NPP − (Rm + CH4 + grain harvest). C sequestration (CS winter-fallow−1) = − (Rm + CH4 + straw harvest). Note: All harvested straw leftover on three fields, i.e., straw harvest = 0. Negative values of C sequestration indicate net CO2 emission from soils.
Table 7. Seasonal GWP (g CO2 equivalent m−2) of CO2, CH4 and N2O and their contribution to annual GWP.
Site §GWP during Rice Growing SeasonGWP during Winter-Fallow SeasonAnnual GWP of Individual GHG Gas BasisProportion of Contribution from G or F to Annual GWP of Respective Gas (%)
CO2 CH4N2OCO2 CH4N2OCO2 CH4N2OCO2CH4N2O
D1-M149281910.2817−0.7027.7967281838.085 F100 G73 F
D2-M196286715.18611.4649.21057286864.381F100 G77 F
D3-S3.5243121.366894.455.2369343176.5999 F100 G79 F
§ D1-M (drainage-multiple); D2-M (drainage-multiple); D3-S (drainage-single). GWP of CO2 = − (CS + CH4 flux) × (44/12). G, rice growing season. F, winter-fallow season.
Table 8. Proportion of contribution from seasonal net GWP and annual GWP of individual GHG to annual net GWP.
Site §Net GWP
(g CO2 Eq. m−2 Season−1)
Proportion of Contribution from G or F to Annual Net GWP(g CO2 Eq. m−2 yr−1)Proportion of Contribution from Individual GHG Basis GWP to Net GWP (%)
Annual GWP of Individual GHG BasisAnnual
Net GWP
Growing SeasonWinter-Fallow Season(%)CO2 CH4N2O CO2 CH4N2O
D1-M297884478 from G967281838.0382325.373.70.99
D2-M307891177 from G1057286864.3399026.571.91.61
D3-S431769986 from G69343176.59501613.886.10.13
§ D1-M (drainage-multiple); D2-M (drainage-multiple); D3-S (drainage-single). GWP of CO2 = − (CS + CH4 flux) × (44/12). G, rice rice growing season; F, winter-fallow season.

