
Travel Bubbles in Air Transportation: Myth or Reality?


1
National Key Laboratory of CNS/ATM, School of Electronic and Information Engineering, Beihang University, Beijing 100191, China
2
Sauder School of Business, University of British Columbia, Vancouver, BC V6T 1Z2, Canada
*
Author to whom correspondence should be addressed.
Aerospace 2022, 9(1), 38; https://doi.org/10.3390/aerospace9010038
Submission received: 12 November 2021
/
Revised: 10 January 2022
/
Accepted: 10 January 2022
/
Published: 13 January 2022
(This article belongs to the Collection Air Transportation—Operations and Management)
Abstract
:Aviation has been hit hard by COVID-19, with passengers stranded in remote destinations, airlines filing for bankruptcy, and uncertain demand scenarios for the future. Travel bubbles are discussed as one possible solution, meaning countries which have successfully constrained the spread of COVID-19 gradually increase their mutual international flights, returning to a degree of normality. This study aims to answer the question of whether travel bubbles are indeed observable in flight data for the year 2020. We take the year 2019 as reference and then search for anomalies in countries’ flight bans and recoveries, which could possibly be explained by having successfully implemented a travel bubble. To the best of our knowledge, this study is the first to try to address the identification of COVID-19 travel bubbles in real data. Our methodology and findings lead to several important insights regarding policy making, problems associated with the concept of travel bubbles, and raise interesting avenues for future research.
1. Introduction
COVID-19 was officially declared a pandemic by the World Health Organization on 11 March 2020, affecting all areas of our lives. As of 21 March 2021, there are 122.9 million confirmed cases and more than 2.7 million fatalities related to COVID-19. Given that air transportation can bridge long distances in a short amount of time, international flights are one major driver for the initial turn from an epidemic outbreak into a full pandemic [1]; recent examples of outbreaks, which were on the edge to turn into pandemics include MERS 2012 [2] and Ebola 2014 [3]. In these latter cases, an early, well-orchestrated international response was able to contain the disease. For COVID-19, on the other hand, the cut of international flights came rather too late—or at least postponed the disease spreading by a short period of time only [4]. Only between March 2020 and May 2020 did airlines begin to implement a wide range of flight suspensions. Later suspensions were mostly induced by a combination of already significantly reduced passenger demand, active flight bans between countries, and relaxed slot-keeping rules by IATA [5,6]. These suspensions have led to a significant decrease in global air connectivity until late 2021, with an increasing trend of recovery. It is estimated by IATA that a full recovery will take several years, with a high degree of uncertainty in predictions and technological challenges [7].
It is clear that current international travel restrictions cannot be considered a permanent solution in our highly-connected world. There exists an extraordinary pressure on health officials and political decision makers to reopen travel routes, particularly once the situation inside a region is perceived as under control [8]. In the long run, immunity passports or similar methods could help to mitigate problems induced by COVID-19; the use of such passports, however, requires a better understanding of the dynamics of waning immunity and test sensitivity over time [9,10]. Therefore, near-future scenarios include the concept that air travel between low-incidence regions returns to normal, and subsequent outbreaks will be linked to imported cases due to international air travel [11]. It is known that travel bans can be effective only when they are implemented in a timely manner and informed way [12,13]; the same holds for the lifting of travel bans. Releasing such a ban is a decision associated with high risk; especially if it concerns regions with a non-zero case prevalence, as it has been shown that voluntary quarantine even at an overall rate of 95% would not be effective in preventing subsequent infection waves of COVID-19 [8]. Releasing travel bans should be based on estimating the number of potentially imported cases, quarantining days averted, and potential secondary cases [14].
Throughout the year 2020, several regions started to establish temporary travel arrangements, which are coined as ‘travel bubbles’, ‘travel bridges’, ‘travel corridors’, or ‘corona corridors’ in the literature, in an effort to stimulate mobility, trade and economic recovery [15,16]. Opening a travel bubble requires an extensive accounting of its cross-border measures, how these measures impact public health and wider society, and what factors influence decision making, leading to evidence-based, real-time decisions regarding cross-border measures for mitigation of COVID-19 [17]. All members of a travel bubble should strive for unification and avoidance of confusion among travelers based on agreed standards and rules for health declaration/checking and tracking [18]. Piloting a carefully managed bubble, which allows the integral tourism, migration, and remittances running again is one such opportunity to show the world how to safely emerge from the current crisis [19]. The motivations, drivers, and temporal patterns, for how governments decide to lift cross-border restrictions through travel bubbles is largely unexplored [17,20]. One of the earliest travel bubbles mentioned in the public is the Oceania travel bubble (or Trans-Tasman bubble), consisting of Australia and New Zealand, as proposed by the Australian Government in May 2020 [21,22].
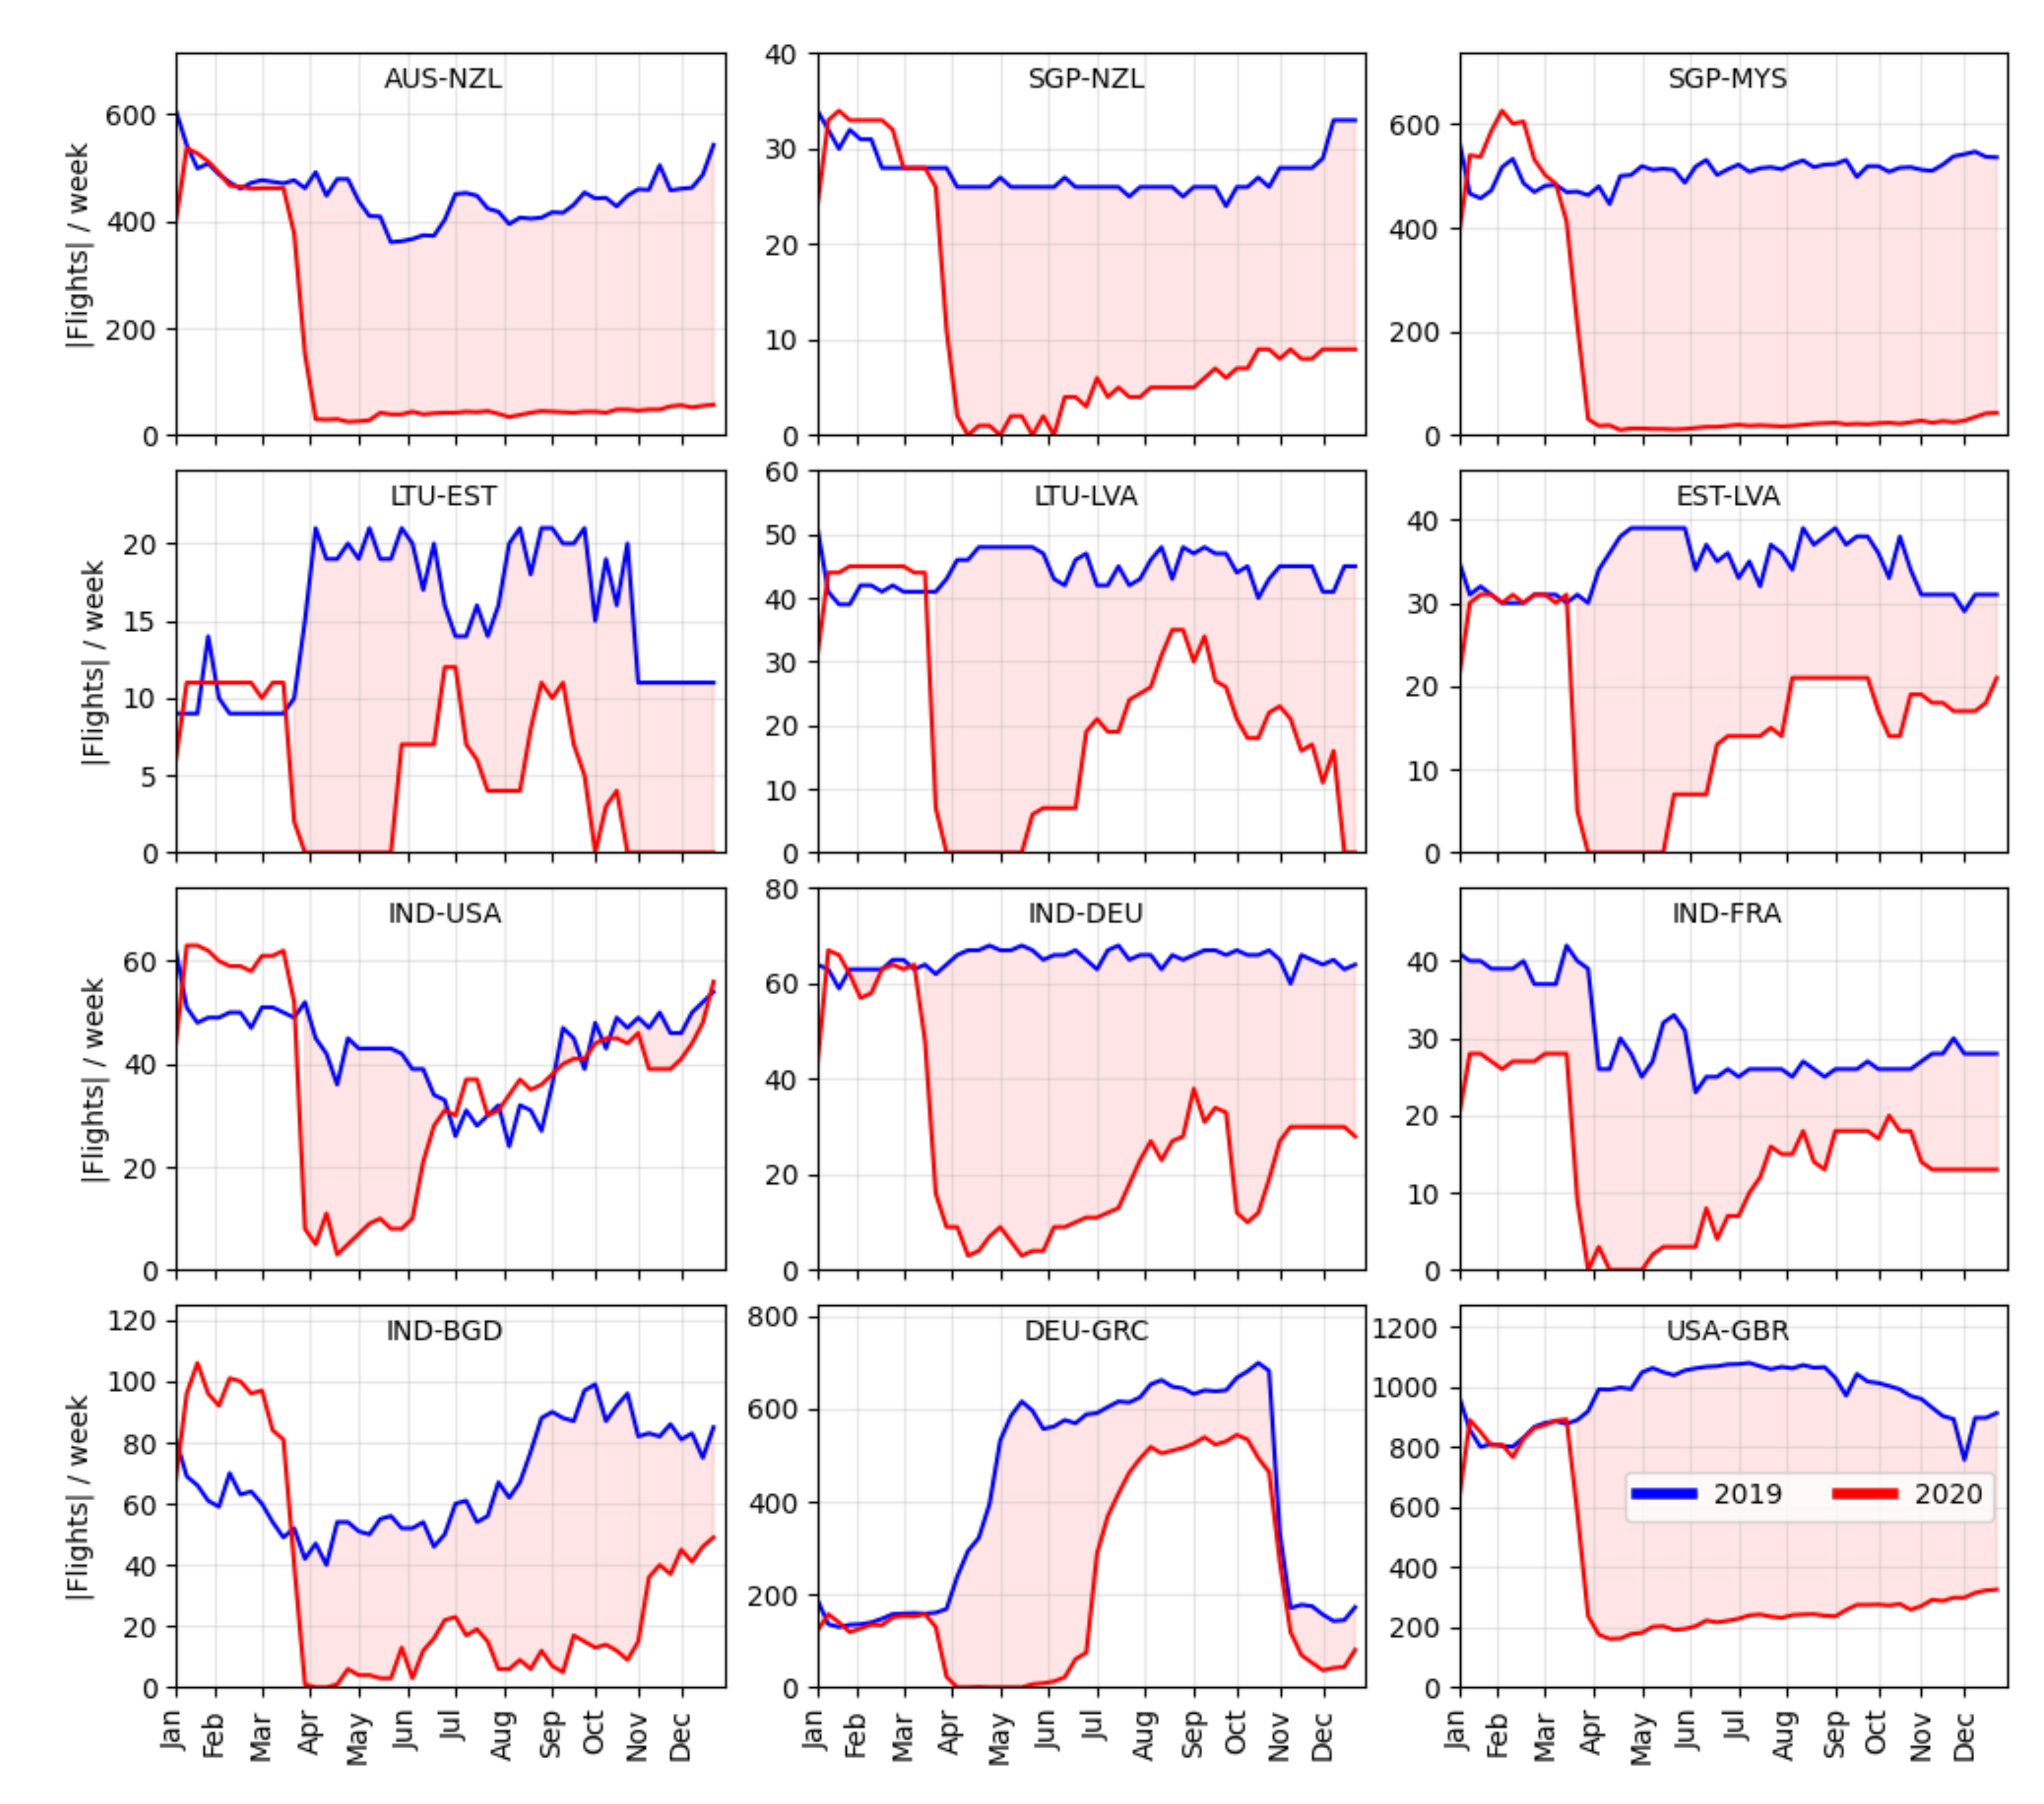
In this study, we aim to investigate the question of up to which degree the concept of travel bubbles really exists in the operational data for air transportation. As a motivational example, Figure 1 reviews the evolution of the number of flights in a set of markets for the period of 2020, with the year 2019 as baseline. The data for 2019 is shown in blue and data for 2020 in red. The figure shows the weekly number of flights in both periods for these selected country pairs. The shaded area highlights the area between the two curves, i.e., where the number of flights in 2019 is larger than the number of flights in 2020, which means that in the periods of shaded areas, travel bans and flight restrictions can be confirmed in the data. It can be observed from the flight data in this study that the actual number of flights suggests that some of the travel bubbles from the literature and news press are in fact not existent. In fact, the eponymous travel bubble between Australia (AUS) and New Zealand (NZL) cannot be measured as an increase in the number of flights after all. The reason is that COVID-19 outbreaks in Australia’s Victoria state forestalled these travel bubble plans before they were implemented. Similarly, the connection between Singapore (SGP) and Malaysia (MYS) is undergoing a long period of an almost-complete flight ban, with a very slow recovery over the year 2020. Other country pairs reveal stronger indications for travel bubbles. For instance, the connections between India (IND) and the United States (USA) as well as between Estonia (EST) and Latvia (LVA) show a rather strong, monotonic recovery starting from June 2020. A few country pairs exhibit short-term recoveries only, where travel bubbles might have been established but reversed after a few months; examples for this case include the connections between Lithuania (LTU) and Latvia (LVA) as well as between Lithuania (LTU) and Estonia (EST). Finally, the connection between Germany (DEU) and Greece (GRC) was almost fully recovered starting from July 2020; and then remained normal, including the off-season reduction in flights as observed for the year 2020. The latter case exemplifies how important it is to compare the flight data during COVID-19 to historical data; otherwise, one might mistake the flight reduction between Germany (DEU) and Greece (GRC) in November 2020 as heavy flight ban; which it is clearly not. Despite some existing studies on the concept of travel bubbles in the literature (see Section 2), we are not aware of a formal definition of travel bubbles. In this study, we argue that the existence of a travel bubble between two countries is expected to result in significantly fewer flights bans between each other, compared to countries outside the bubble; otherwise the notion of a travel bubble would be misleading.
In summary, these examples show that not all discussed travel bubbles are visible in the data. Similarly, not all travel bubbles implemented were declared as those prominently in the public. Therefore, the goal of this study is to use data science techniques to uncover the existence of travel bubbles between the top 100 largest countries (selected according to the total number of flights in 2019). In addition to performing an in-depth and descriptive analysis of the patterns of travel bans and releases between country pairs, we further discuss what could have driven the creation of these bubbles. Particularly, whether the bubbles seem to be reasonable from a purely epidemiological point of view, taking into account the number of confirmed COVID-19 cases over time. Finally, we provide relevant discussion of the future of air transportation, the degree to which more travel bubbles might emerge, and what challenges need to be overcome before returning to a safer and sustainable implementation of air transportation. We would like to emphasize that this study understands travel bubbles as a way to recover a large fraction of flights. Some news sources coin travel bubbles as a situation in which passengers will not be obligated to comply with a quarantine period or other health-related checks upon arrival; this is not considered as part of our study and cannot be derived from the data in this study. Accordingly, such interesting questions could be addressed as future work. Similarly, given the recent progress in vaccination in some parts of the world, another type of bubble might emerge soon: ‘vaccination bubbles’, in which countries permit ‘normal’ cross-border air travel for people who have had sufficient shots of mutually-recognized vaccines. The prediction and analysis of such bubbles is beyond the scope of this study, and could be performed as future work.
The remainder of this paper is outlined as follows. Section 2 provides a literature review on the impact of COVID-19 on air transportation and on how flight bans were used with the ultimate goal to constrain the virus spread. Section 3 introduces the methodology and the actual air transportation data used in this study. Section 4 reports on a set of experiments for the top 100 countries in the world and reports on the existence of travel bubbles. Section 5 discusses the observed findings together with policy implications. Section 6 concludes this study and provides a future outlook into safe, post-COVID-19 aviation.
2. Literature Review
A wide range of studies has been published concerning the impact of COVID-19 on air transportation, covering various topics, including network changes, epidemiological analysis, operational/financial challenges, and predictions into the uncertain future post-COVID-19; see [23] for a recent survey. Given that the total number of studies on COVID-19 is too large to completely review here, we focus on the most related ones, covering three related categories: (a) establishment of travel bubbles, (b) epidemic spreading through air transportation, and (c) impact of COVID-19 on airport networks.
(a) Establishment of travel bubbles: Ref. [16] discusses the implications and risks of using travel bubbles. An overview of discussed rules (as of September 2020) is provided, and the importance of travel bubbles related to the overall number of infections is stressed. Travel bubbles are assumed to be mainly useful at early stages and late stages of a pandemic, when widely spread, low incidence values allow for safer travels between selected countries. Moreover, it is emphasized that travel bubble decisions should be based on evidence and real-time epidemiological data. Ref. [16] did not provide a technical definition of travel bubbles, but rather identified them as temporarily keeping international travel afloat during the pandemic. Ref. [19] discusses the epidemiological status across 22 developing countries in the Pacific area. Based on data from the initial phase of COVID-19, it is observed that extensive border restrictions helped to keep the virus outside their bubble almost completely. Finally, the importance of role models, such as countries in the Pacific region, is emphasized for leading other countries into better handling COVID-19. Ref. [17] notes that a global coordination of travel and trade measures is crucial in order to build a successful response to COVID-19. The Australia–New Zealand travel bubble is used as an example to show the extreme challenges in coordination of a mid-sized travel bubble. Ref. [15] discusses the impact of COVID-19 on global tourism, emphasizing that COVID-19 comes with the opportunity to rethink mobility. Particularly, travel bubbles can be seen as a step from climate-negative, long-distance travel towards more locally-based tourist flows, which will impact businesses, lifestyles, and emissions. Refs. [18,24,25] reports on the prospects and possible rules of the Asian travel bubble and regional New Zealand travel bubble, respectively. The role of travel bubbles towards the revival of international travel between participating destinations is investigated by [26].
(b) Epidemic spreading: The contribution of air transportation towards long-distance epidemic spreading has been reported for the diffusion of seasonal influenza [27], SARS/MERS [28,29], Ebola virus [30], and Malaria [31,32]. Similar relationships have been observed for COVID-19, discussed as follows. Ref. [33] used data on international passenger volume and routes which were compared to the distribution of confirmed COVID-19 cases. It was found that there exists a strong linear correlation between the domestic cases in China and the passenger volumes within China, and a very strong correlation between international cases and passenger volume, for data until March 2020. Similar findings were reported by [34]. Ref. [35] studied the risk importation between airports and municipalities; emphasizing the role of reducing exportation risk. Experiments on the global airport networks showed that flight bans leading to a reduction larger than 90% are required for areas with high incidence values. Ref. [36] showed that, using a simplified meta-population model on selected Chinese airports, the arrival time of the virus and number of cases can be predicted rather well. Several studies performed similar experiments on other countries and regions, usually identifying the prominent role of air transportation [37,38,39]. On the other hand, [39] assessed the role of air travel in the spread of COVID-19 in China compared to those of high-speed train and coach services, finding that the spread is indeed controlled by a rather complex interaction, which requires the consideration of all modes; particularly in China with its well-established high-speed rail system. Ref. [40] analyzed the ramifications around the spread of COVID-19 variants of concern.
(c) Impact on airport networks: Ref. [5] performed a preliminary analysis of the impact that COVID-19 has on airport networks during the first five months of 2020. It is reported that air transportation is probably among the hardest-hit sectors during the pandemic, with flight reductions of up to 90%. Furthermore, it is found that flight reductions were preferably executed on long-distance links and the topological role of airports changed significantly until May 2020. Ref. [4] investigated countries’ reactions in terms of flight reductions compared to the number of COVID-19 cases, finding that largely heterogeneous responses led to a possibly too-late response. Ref. [6] analyzed the number of flights during COVID-19 as a time series; in addition, the number of workers in the tourism and airlines business are analyzed. Ref. [41] provides a classification of airline reactions over time for the first five months of 2020. Four categories are identified: substantial cost reductions (retrenchment), preserving the status quo (persevering), strategic renewal (innovating), and discontinuation of activities (exit), based on aviation industry newsletter Aviation Week Network. Ref. [42] analyzed the reactions of airlines during the first five months of the year 2020. It is shown that operational changes to flights, fleet rationalization, staff reduction, staff numbers, and network reconfiguration were the most common responses. Furthermore, the need for better international coordination was highlighted. Ref. [43] analyzed the impact of COVID-19 on air transportation inside the European Union for the first four months of 2020. Ref. [44] discusses the impact of the COVID-19 pandemic and potential recovery strategies. The authors present aggregated results for the year 2020, for airports, continents, and a few countries, and put them into context with discussion on revenues and profits of airlines. Finally, a set of challenges and future directions are discussed, including the adoption of global safety protocols and resilient airline business models. Ref. [45] assessed the operation of Brazilian airlines under COVID-19. It is found that airlines with a better aircraft mix are more likely to survive many flight cancellations and all the challenges coming with COVID-19. Ref. [46] investigated the role of integrators and cargo airlines during the first six months of the year 2020. The data were samples regarding airport pairs and also regarding temporal resolution, in order to ease data acquisition and processing. In addition, an analysis on the robustness of the network was reported; following different node attacking strategies, it was found that the DHL network is more robust than the networks of FedEx and UPS. Ref. [47] investigated the air cargo sector in China. It found that the sector has suffered a less severe depression compared to air passenger traffic. Furthermore, the possible strengths and weaknesses of the Chinese airlines are discussed in light of the upcoming challenges with COVID-19. Ref. [48] analyzed the impact of COVID-19 on the transportation sector and confirmed via mobility indexes that the impacts are unprecedented in light of earlier disease outbreaks. There are various other studies describing and analyzing the impact on aviation in general, e.g., on passenger boarding [49], passenger disembarking [50], and aircraft turn-around management [51]. Except for the above-listed negative impacts on aviation as a system, there is a set of positive impacts; for instance, in terms of reduced aviation-induced greenhouse gas emission during COVID-19 [52,53,54]. How long these effects persist is hard to predict [55,56].
In summary, these related studies mostly discuss the evolution of the number of flights in the airport network, usually with the focus on early stages of the pandemic, when the flight bans became active. To the best of our knowledge, there exists no study in the literature which performs an analysis of the degree to which travel bubbles between countries can be observed in flight data. Our work aims to fill this gap in the literature. Moreover, the unique data for two complete years (2019 and 2020) allows us to perform an analysis with respect to expected reference baselines.
3. Methodology
We discuss the question of how to identify travel bubbles in flight data for the years 2019 and 2020 and report the results on the top 100 countries according to the number of flights in the year 2019. For data preparation, given the number of weekly flights between each airport pair, we construct the country network following the extraction method proposed by [57], where nodes are countries and a link represents the existence of an international flight between any airport pair for these two countries. The number of flights between country pairs is computed as an aggregation over all airport pairs.
The existence of a travel bubble between two countries is expected to result in significantly fewer flight between the two, compared to countries outside the bubble; otherwise, the notion of bubble would be misleading. Therefore, this section takes the aggregated flight ratio as a baseline for computing the degree of a flight ban between two countries. The flight ratio discrepancy for an interval i is computed as
and the area under the FRD as , where I is the set of all intervals. In this study, the intervals are Week 1 to Week 52 in the years 2019 and 2020. The intuition of Equation (1) is as follows: A high value of suggests a strong reduction in the number of flights. The value is cut off at 1.0, in order to avoid introducing compensation effects, where the number of flights in 2020 is (temporarily) larger than in 2019. Finally, the area under the FRD over all I is a representation of how intense the travel bans between two countries were; with larger values indicating stronger travel bans.
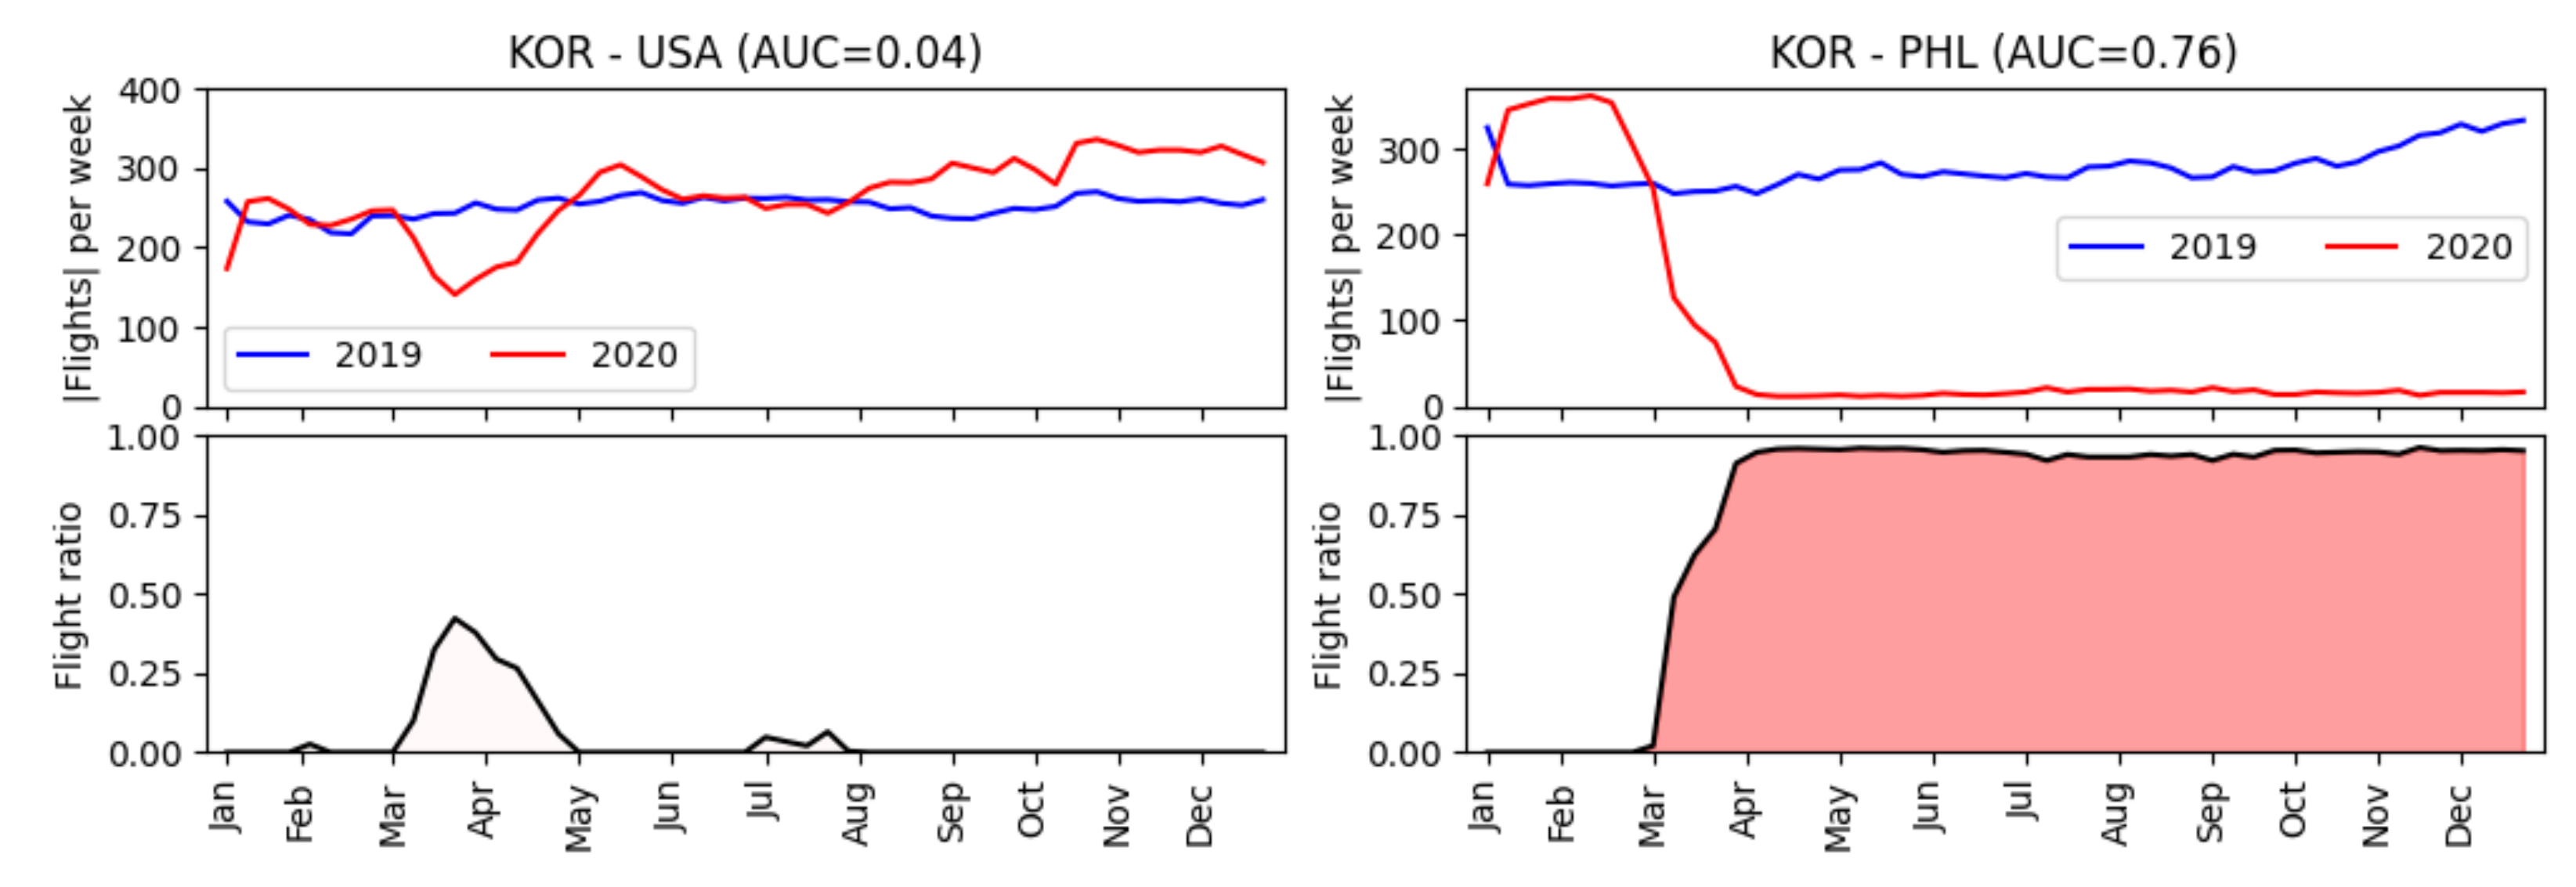
Figure 2 further visualizes the intuition behind the chosen measure based on the country South Korea. The temporal evolution of the FRD is shown for two selected connections: towards United States (USA) and Philippines (PHL), respectively. It can be seen that both time series are quite different regarding the relative number of flights in 2020. While the connection between KOR and USA was affected for rather short periods of time (between March and May and between June and August 2020), the connection between KOR and PHL had not recovered by the end of 202 after a strong flight ban in March 2020. Accordingly, the area under the FRD is significantly lower for KOR–USA (at 0.04), compared to KOR–PHL (at 0.76). This example suggests the inequalities in flight bans across country pairs, are measurable by the area under the FRD, and it is the major motivation for our study to investigate travel bans based on such observed deviations.
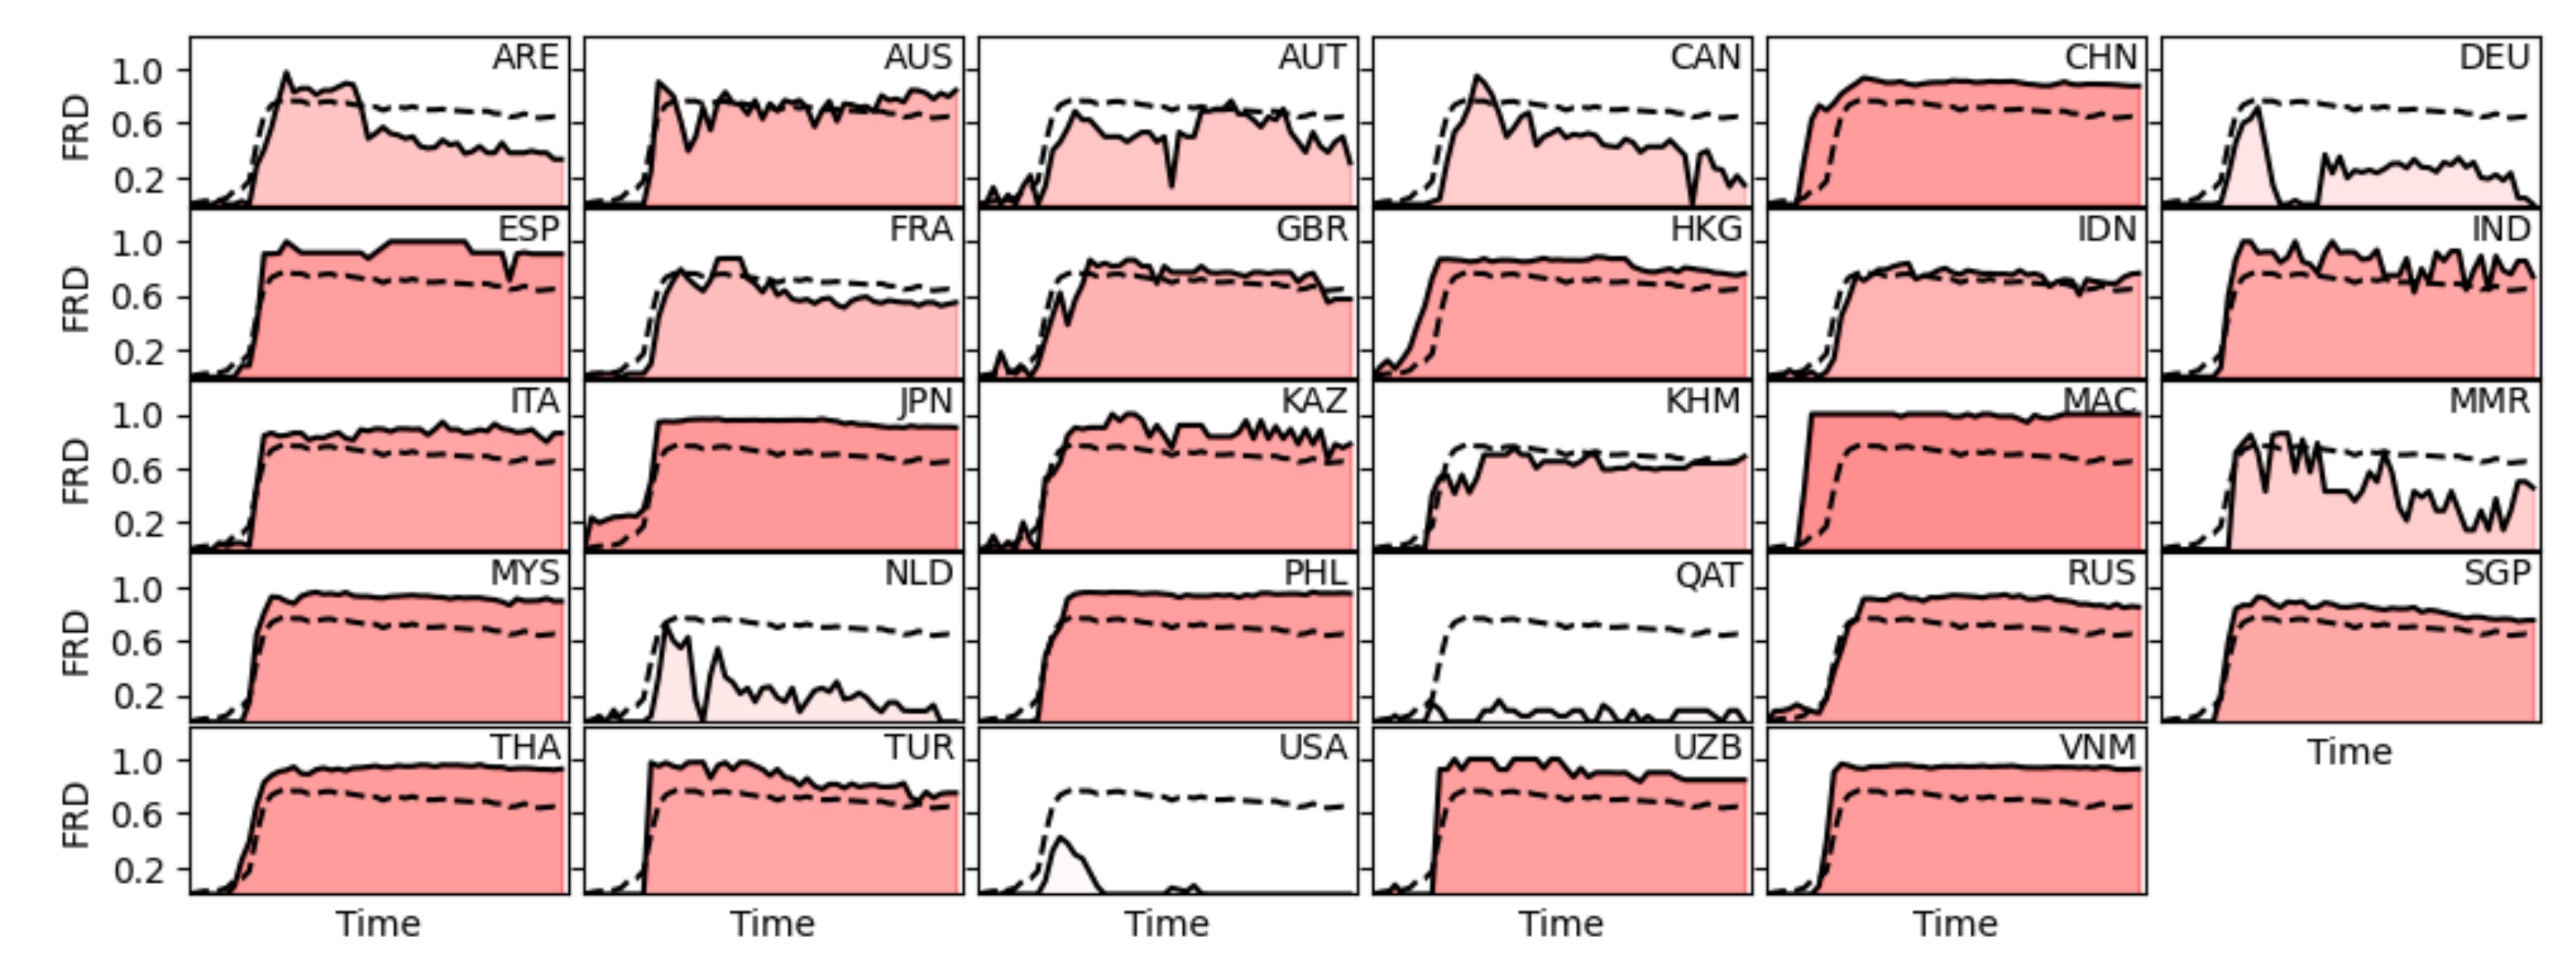
In order to provide a better understanding of the degree to which FRDs deviate for a specific country, we show all international country destinations for KOR in Figure 3, without reporting the actual number of weekly flights. The average FRD evolution, as obtained by aggregating over all country destinations, is visualized as a dashed line for the sake of comparison. The dashed line can be used as reference to see whether the flights towards specific destinations are more affected then others (as represented by the average over all destinations). It can be observed that there is a wide range of reactions from KOR towards other countries. Qatar (QAT), the United States (USA), and Germany (DEU) are among the least affected countries in terms of flight bans. Interestingly, some of the countries closest to KOR in terms of geographical distance are most affected by travel bans, including Vietnam (VNM), Thailand (THA), China (CHN), and the Philippines (PHL). This effect can possibly be explained with the total number of infections in these countries. While the United States (USA) and Germany (DEU) had a large number of infections as well, it seems as though South Korea (KOR) was more willing to cut ties with its direct neighbors, possibly for economic considerations. Similarly, the number of infections is not the only driver, given that China has the pandemic largely under control. Decision on the creation of travel bubbles require mutual agreement, and China has strictly reduced and controlled its international air passenger traffic throughout the year 2020, in order to control the spread of the virus.
For the remainder of this study, we define a formal notion for the establishment of a travel bubble between a pair of countries and . The decision algorithm for deciding the travel bubble property is described in Algorithm 1. We compute the median AUC (area under the curve) for all other countries, stored in and , respectively. If the AUC of a specific country pair is smaller than the median minus standard deviation of the two participating countries’ overall AUC values, then the pair is considered as having established a travel bubble. Intuitively, this measure means that both countries have a much more relaxed connection with each other compared to their other flight neighbors. We would like to emphasize that our study is largely data-driven and the first of its kind in the literature. Most existing studies discussion travel bubbles consider a policy perspective and elaborate on possible benefits or challenges. Therefore, the choice of this methodology had to be made without a proper reference value established in the literature. Future studies could explore other definitions for data-driven travel bubbles.
| Algorithm 1: Travel bubble identification. |
 |
4. Results
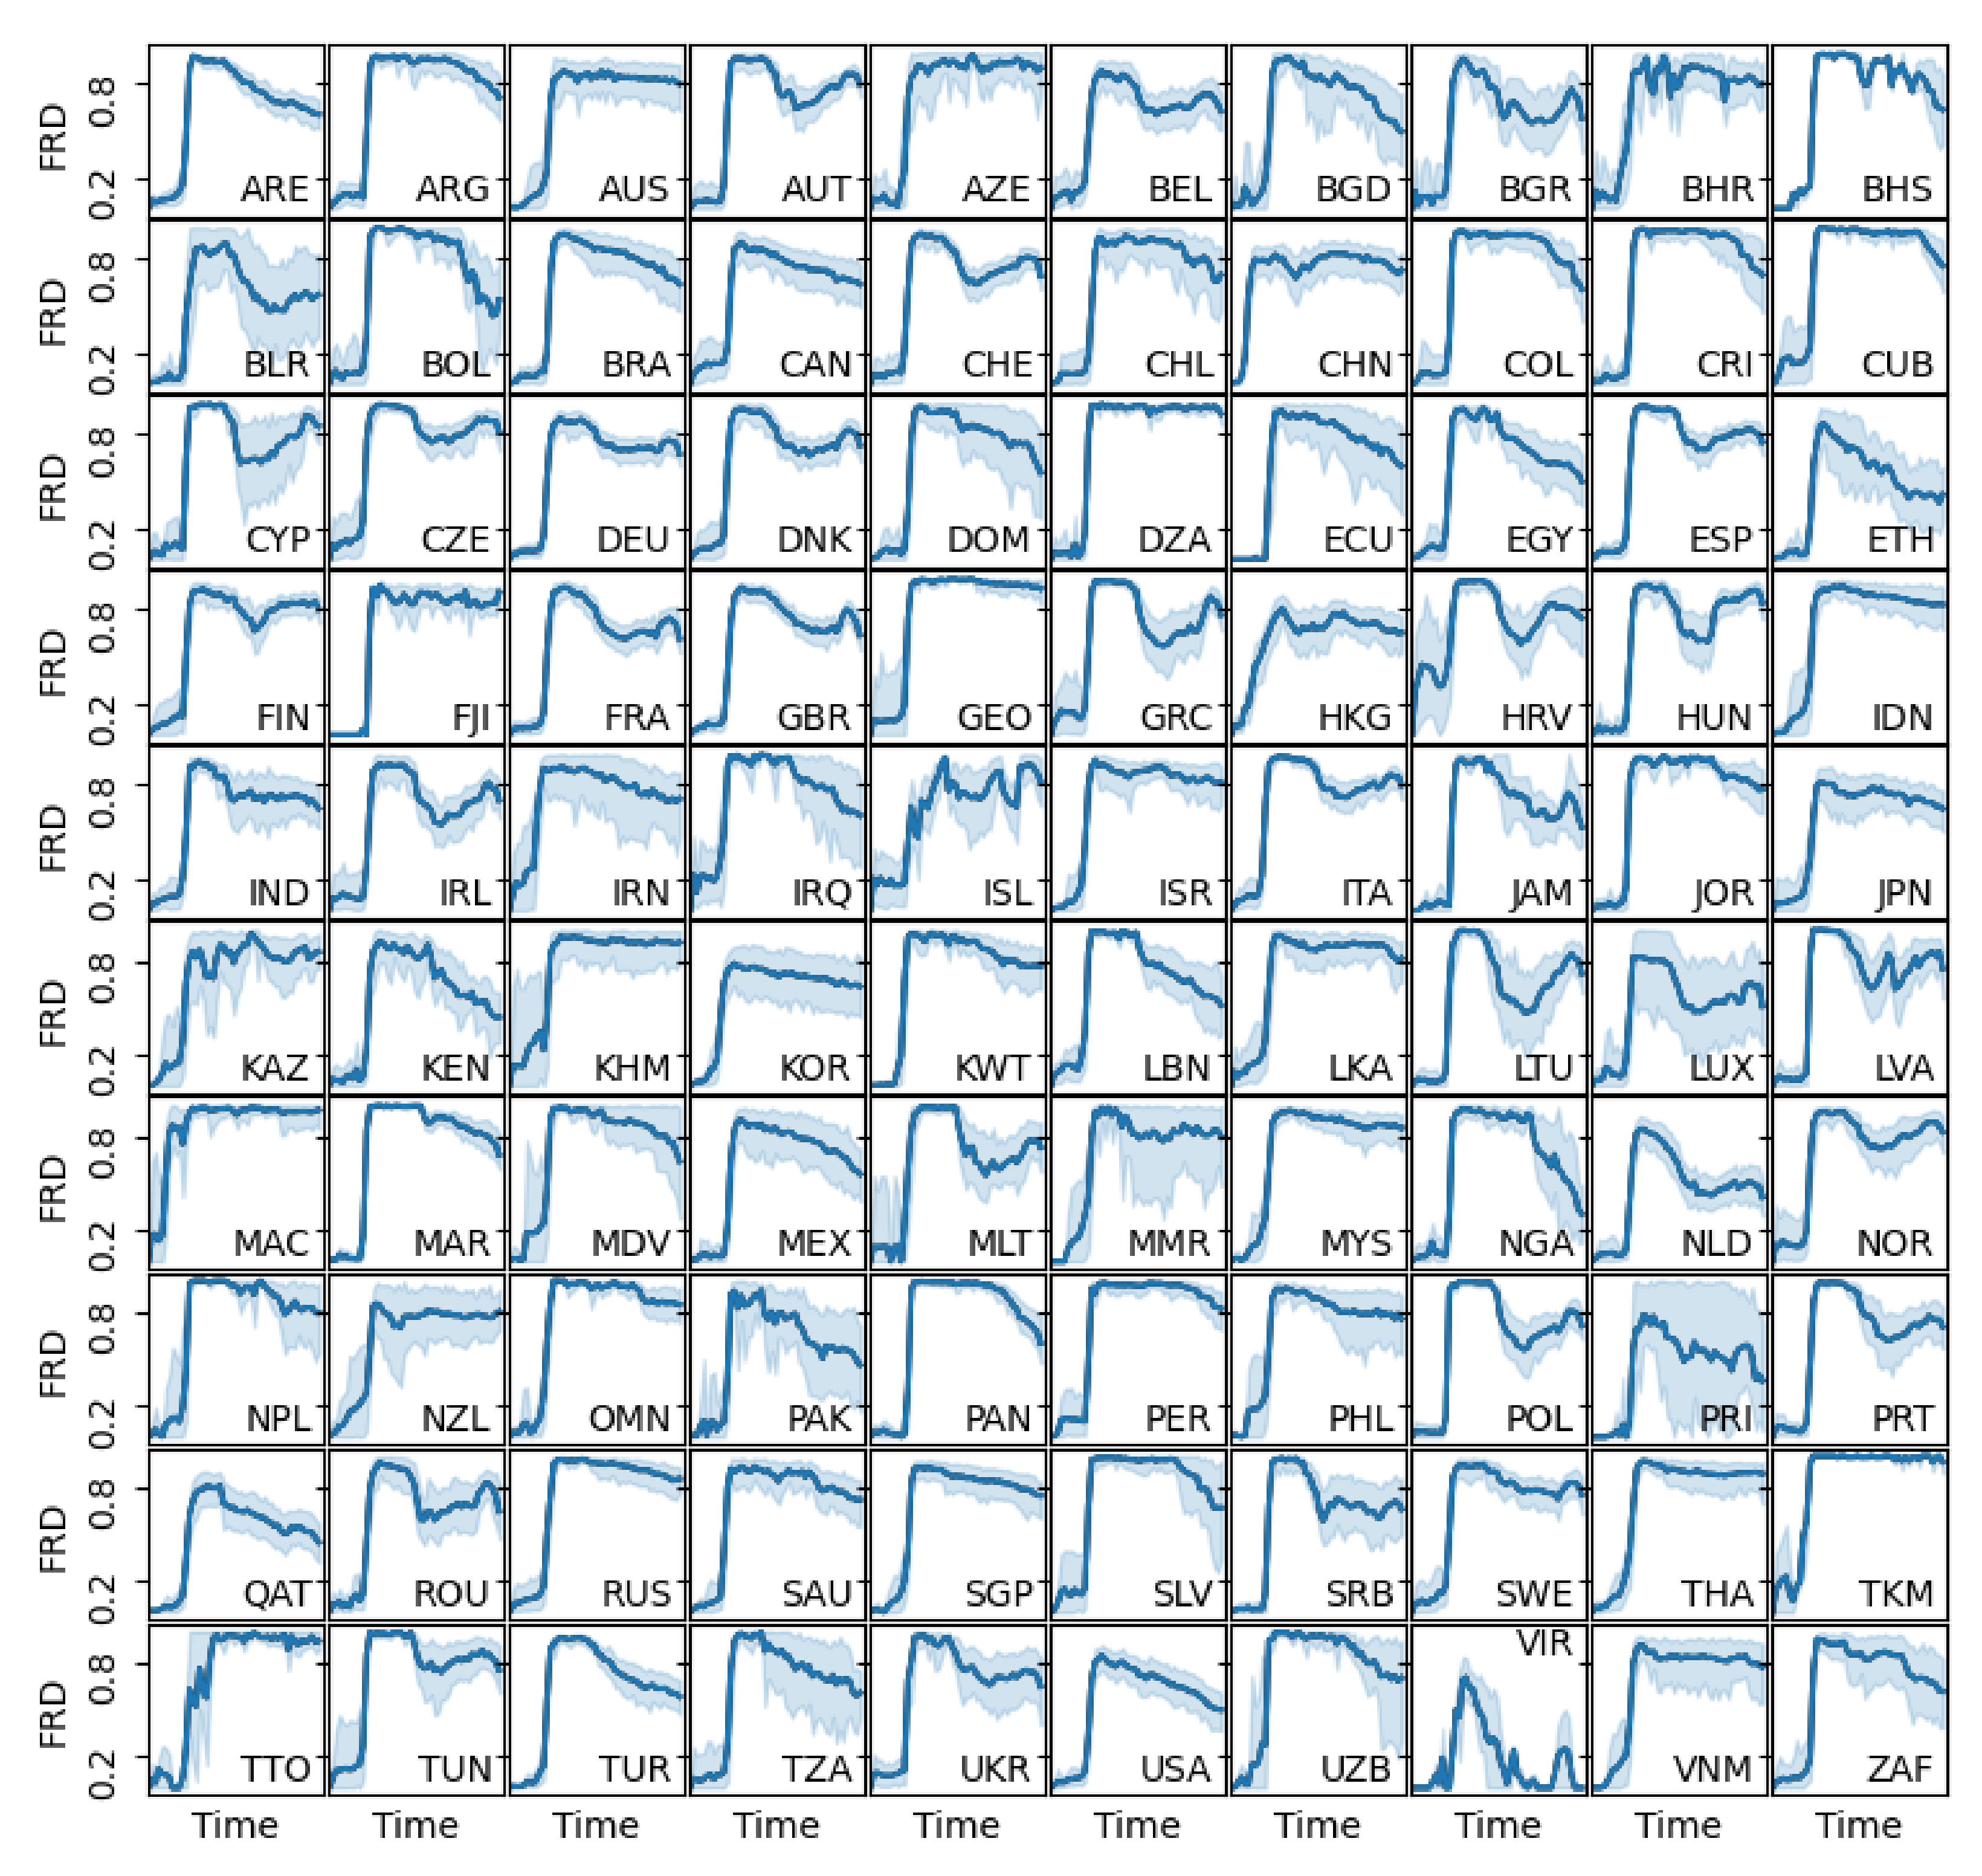
This section reports the results of experiments performed on worldwide flight data for the year 2020. In Figure 4, we report the FRD for all 100 countries in this study. The solid line represents the evolution of the average FRD value over all destination countries for the specific origin country in a subplot. The blue area is the 95% confidence interval for the data in that subplot. It can be seen that many countries exhibit FRD curves with significant variance; including, for instance, New Zealand (NZL), Ethiopia (ETH), Iran (IRN), and Puerto Rico (PRI). A few countries have a rather small variance, especially in the middle of 2020, for instance, Australia (AUS), the Philippines (PHL), Panama (PAN), and Turkey (TUR). Panama, in particular, executed a very restrictive flight ban across all destinations for almost half the year, only gradually releasing the restriction towards the fourth quarter of 2020. Accordingly, we can see that flight bans and releases during COVID-19 are complex decisions, involving mutual agreement between partners, which often appears more at the country-pair level, than on the country level, indicating the possibility for our study to identify travel bubbles in the data.
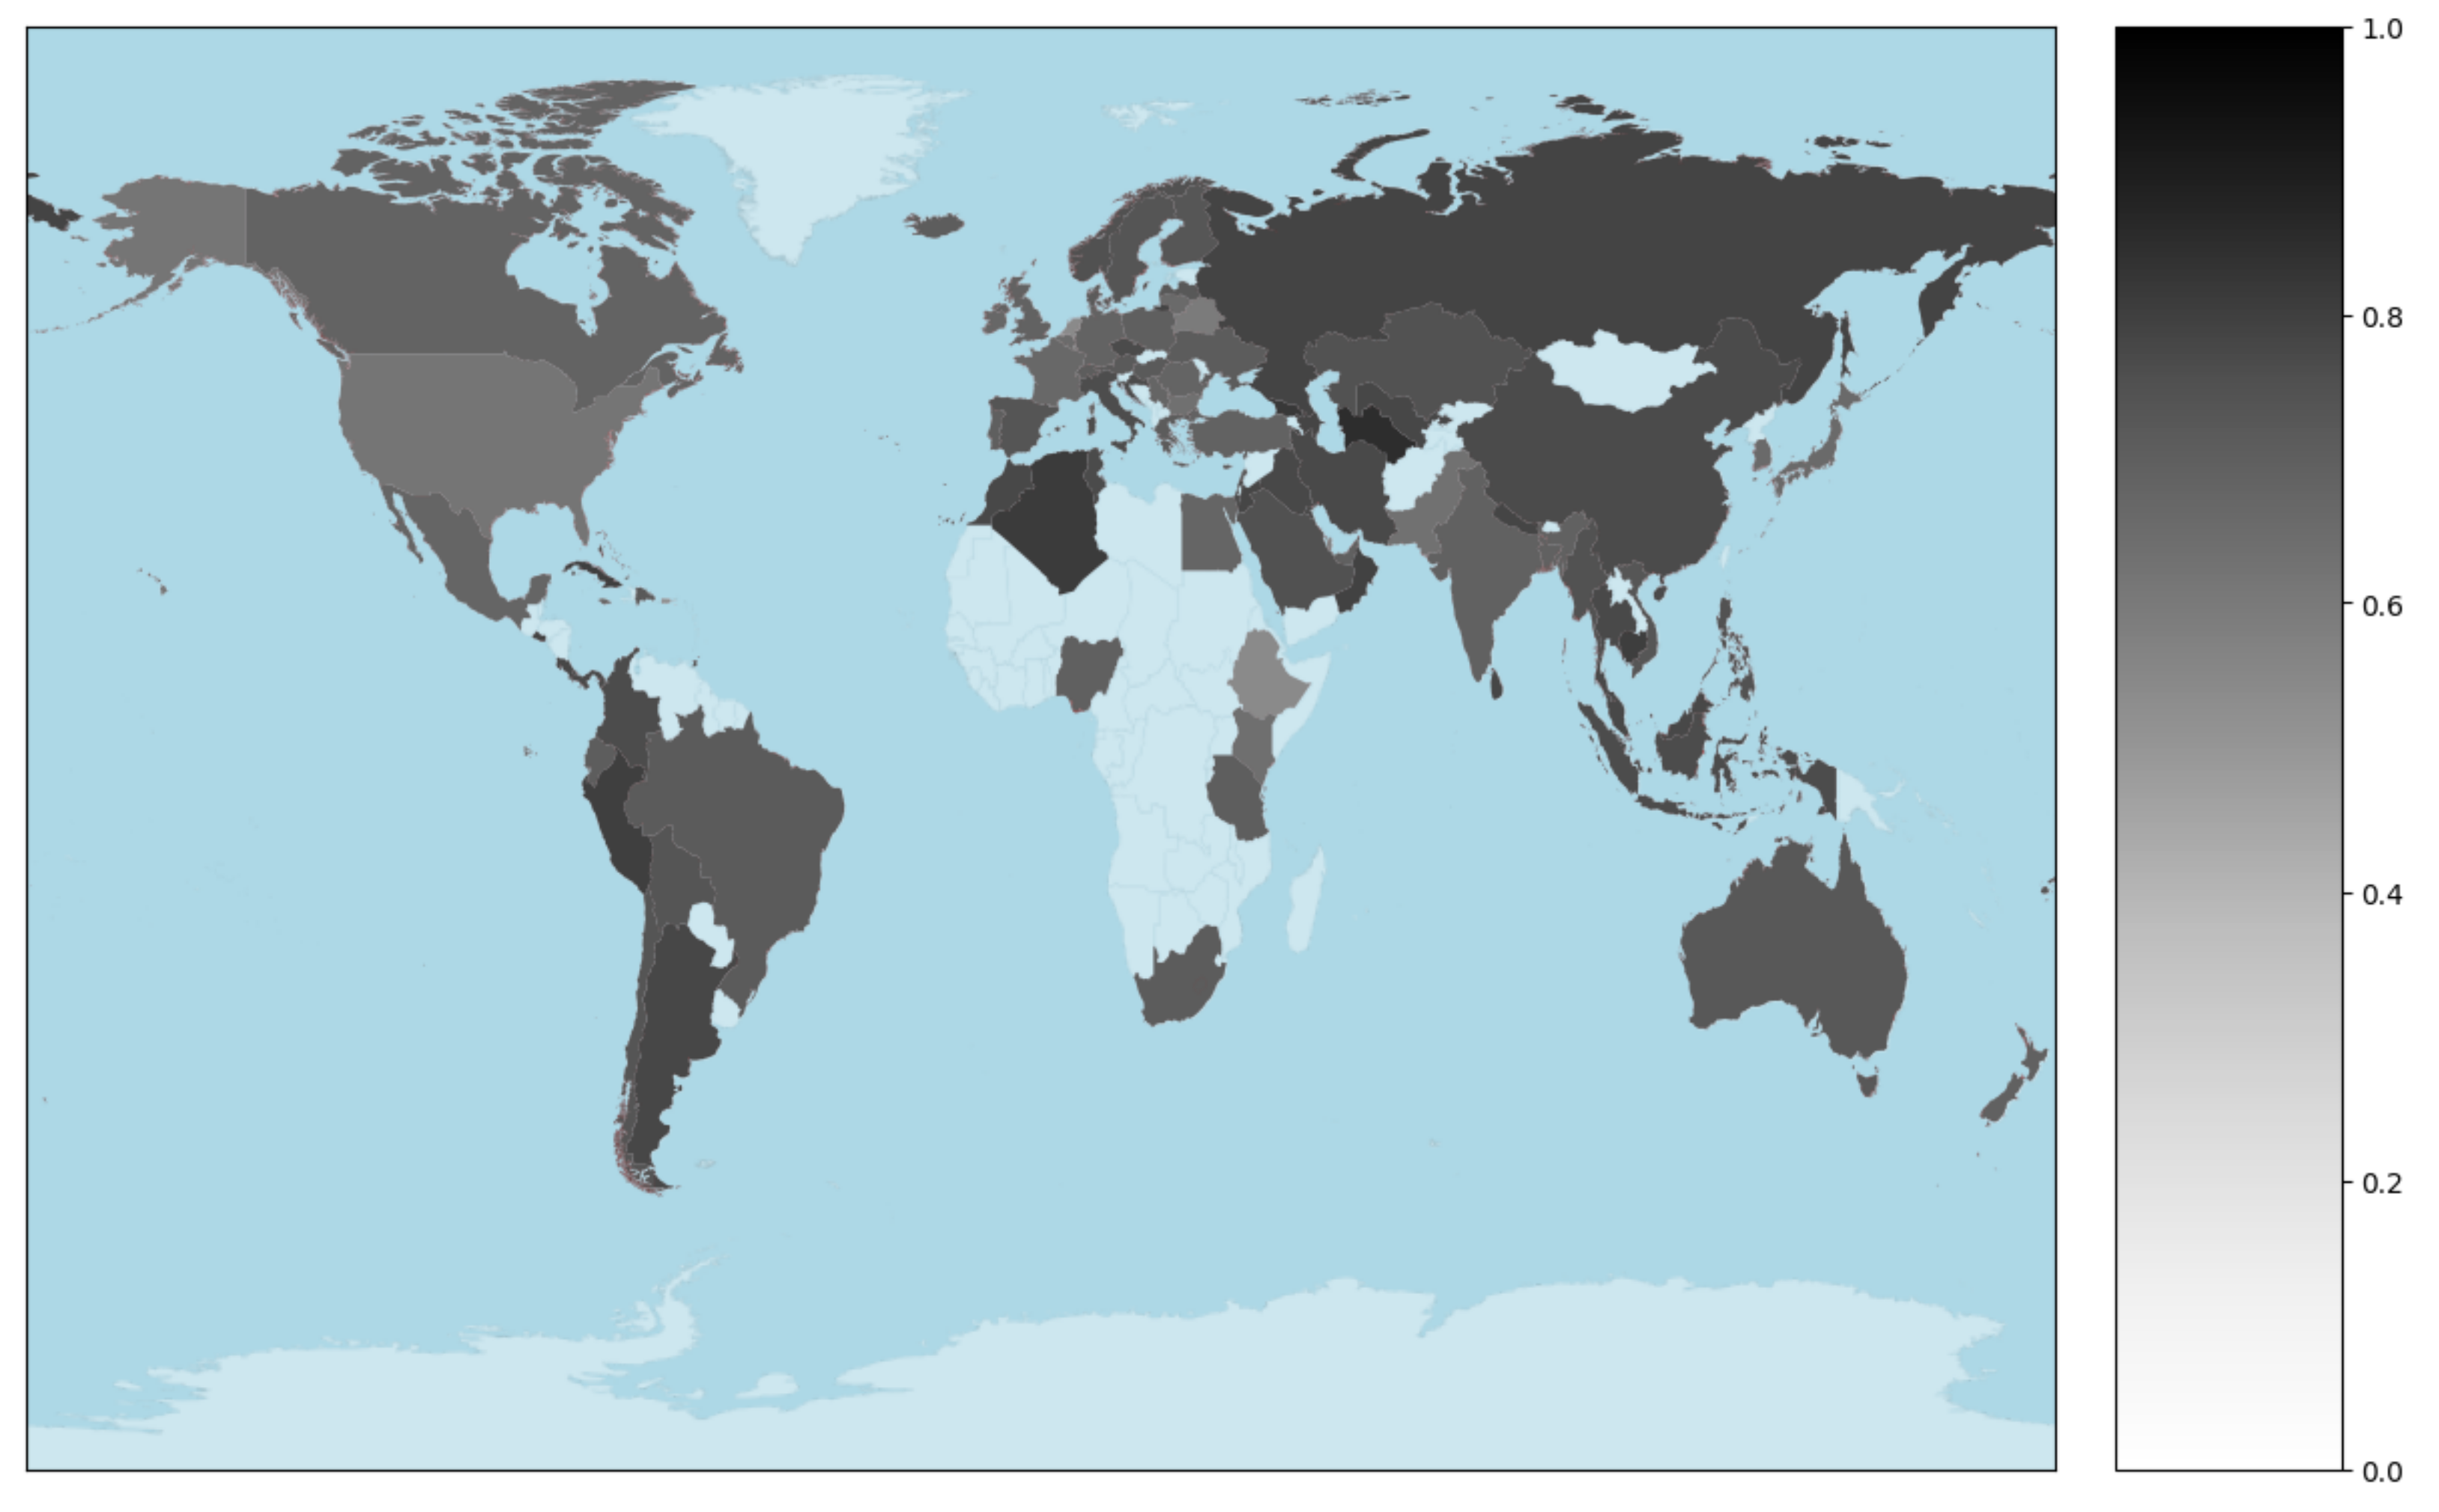
We continue exploring the temporal evolution of area under the curve of FRD values for the top 100 countries in this study, as presented in Figure 5. There are only few countries with average area under the FRD smaller than 0.5, namely: Ethiopia (ETH), the Netherlands (NLD), Puerto Rico (PRI), Qatar (QAT), and the Virgin Islands (VIR). It seems as though countries in Asia have preferably executed stronger flight bans.
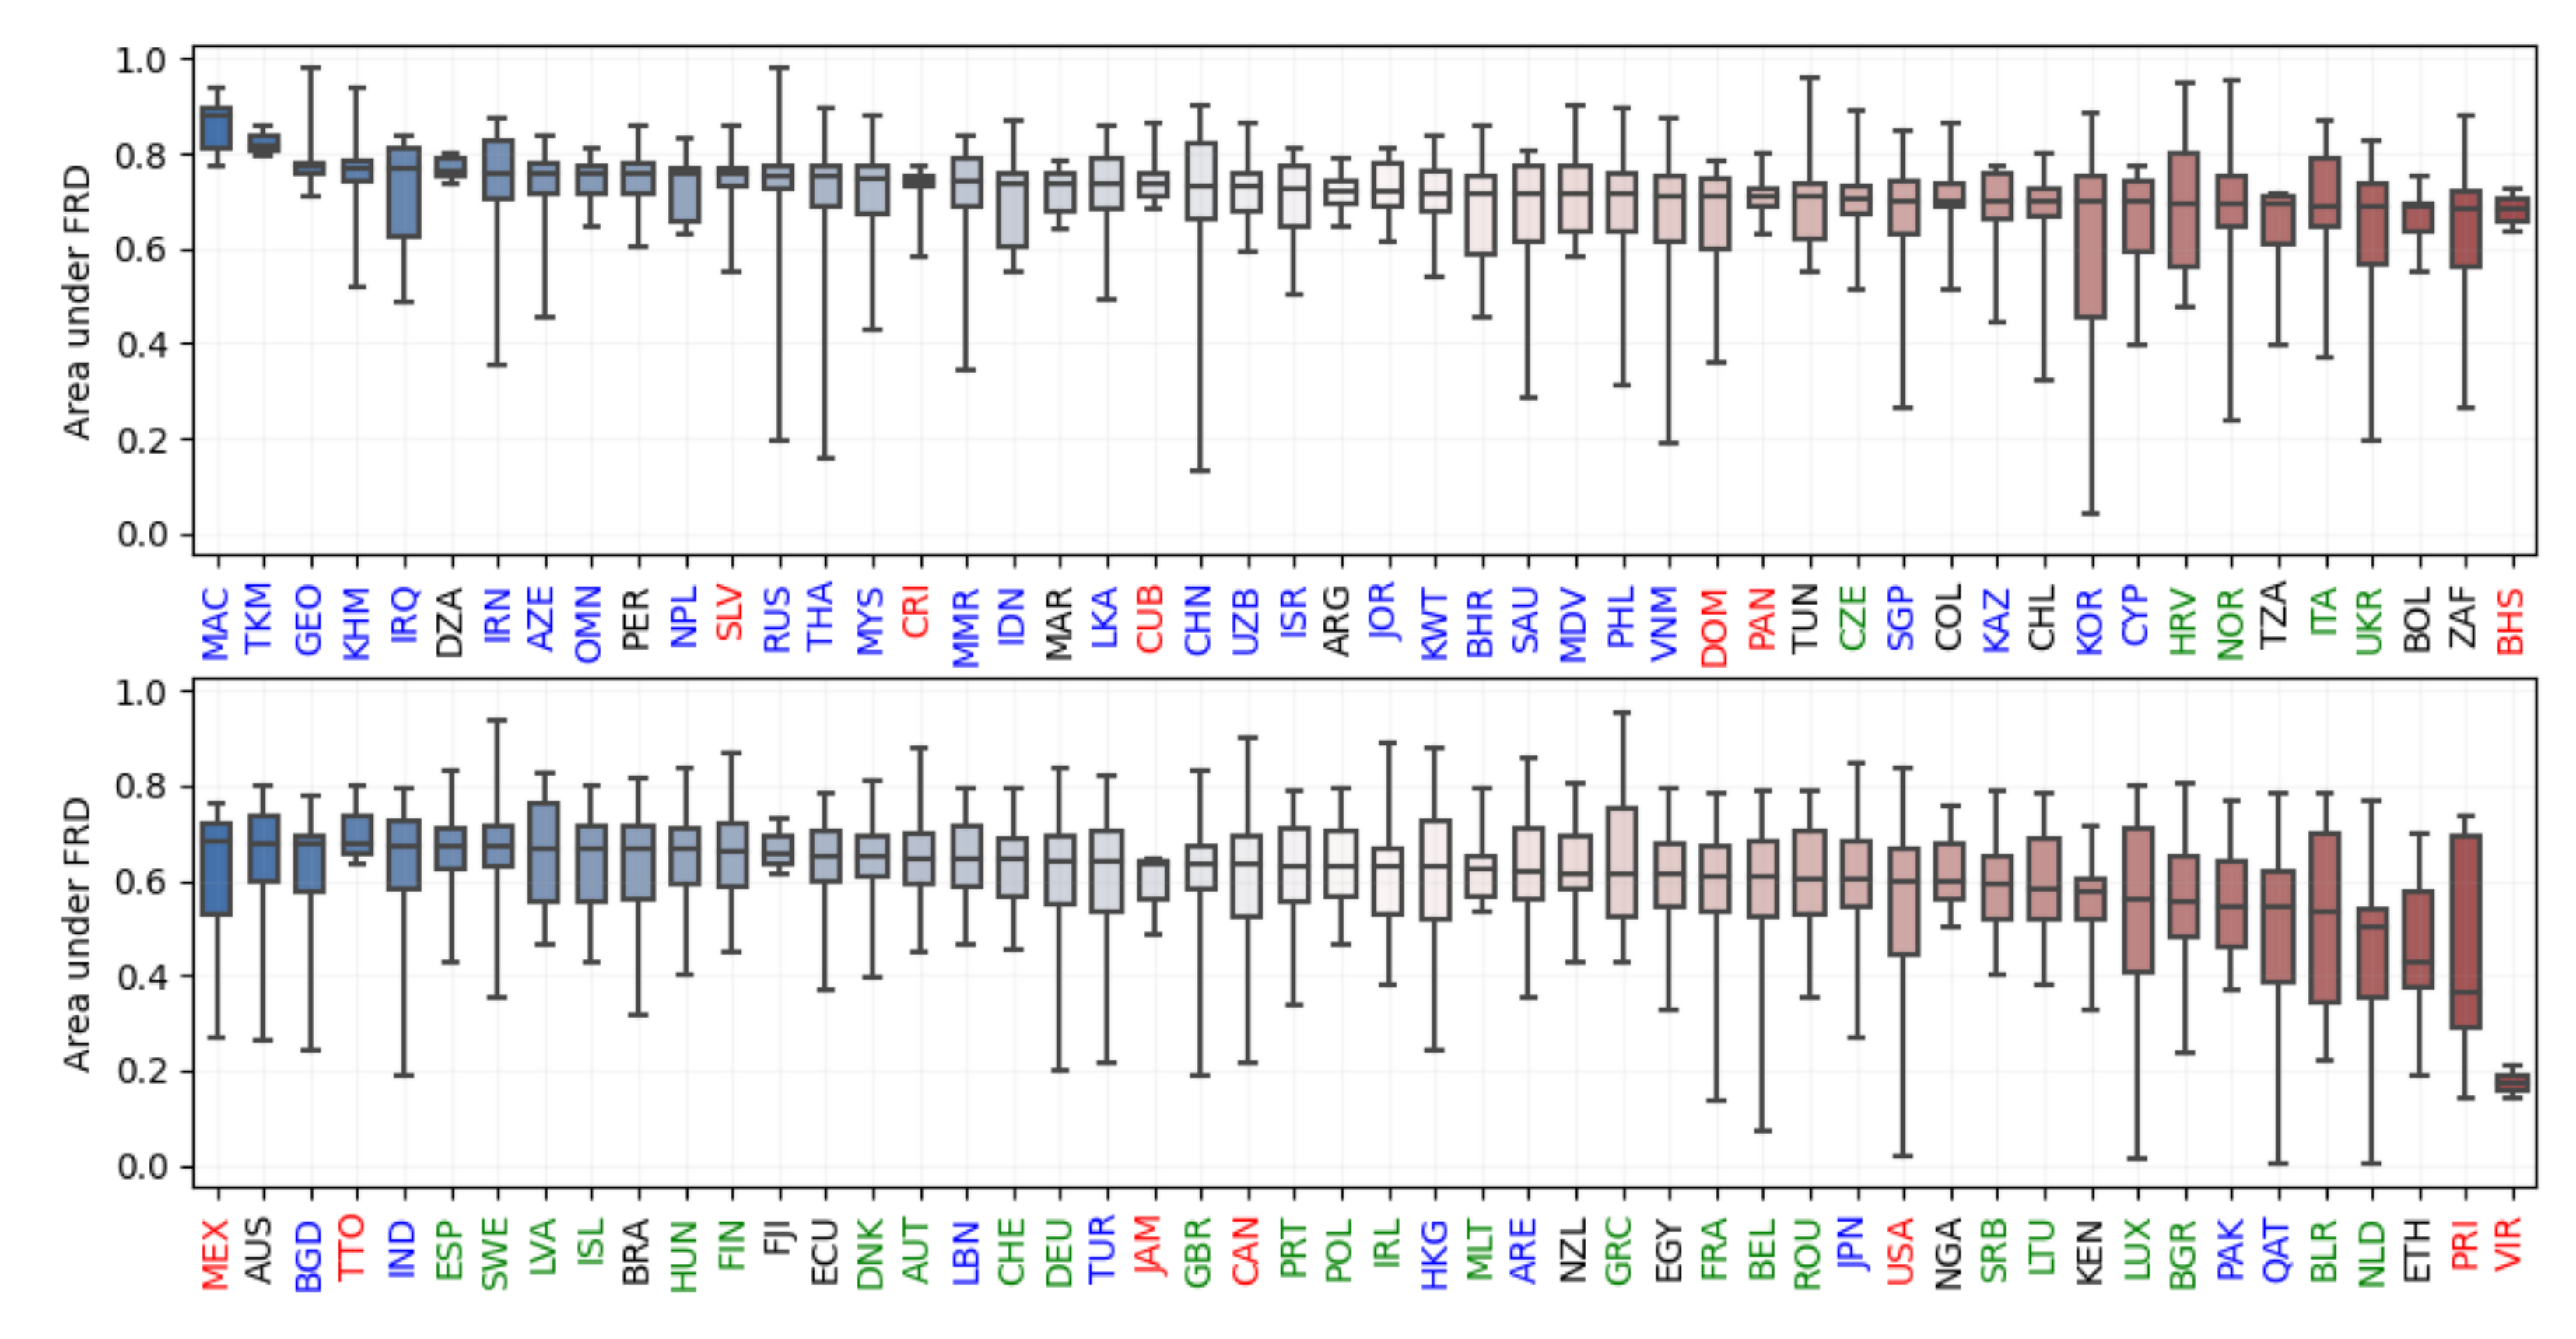
In order to further explore this effect, Figure 6 shows the distribution of the area under the FRD for each country in this study. The countries are sorted by their median area under the FRD. Countries from selected continents are highlighted: Asia (blue), Europe (green), and North America (red). It can be seen that Asian countries are preferably located on the left-hand side of the chart, indicating a more proficient flight ban. European countries are more relaxed regarding flight bans, being found towards the center of the x-axis. Towards the right-hand side, a few countries can be found that kept their flights significantly more open, e.g., the Netherlands (NLD), Qatar (QAT) and Ethiopia (ETH). Nevertheless, the wide range of values for individual countries suggests destination-specific choices when making flight bans.
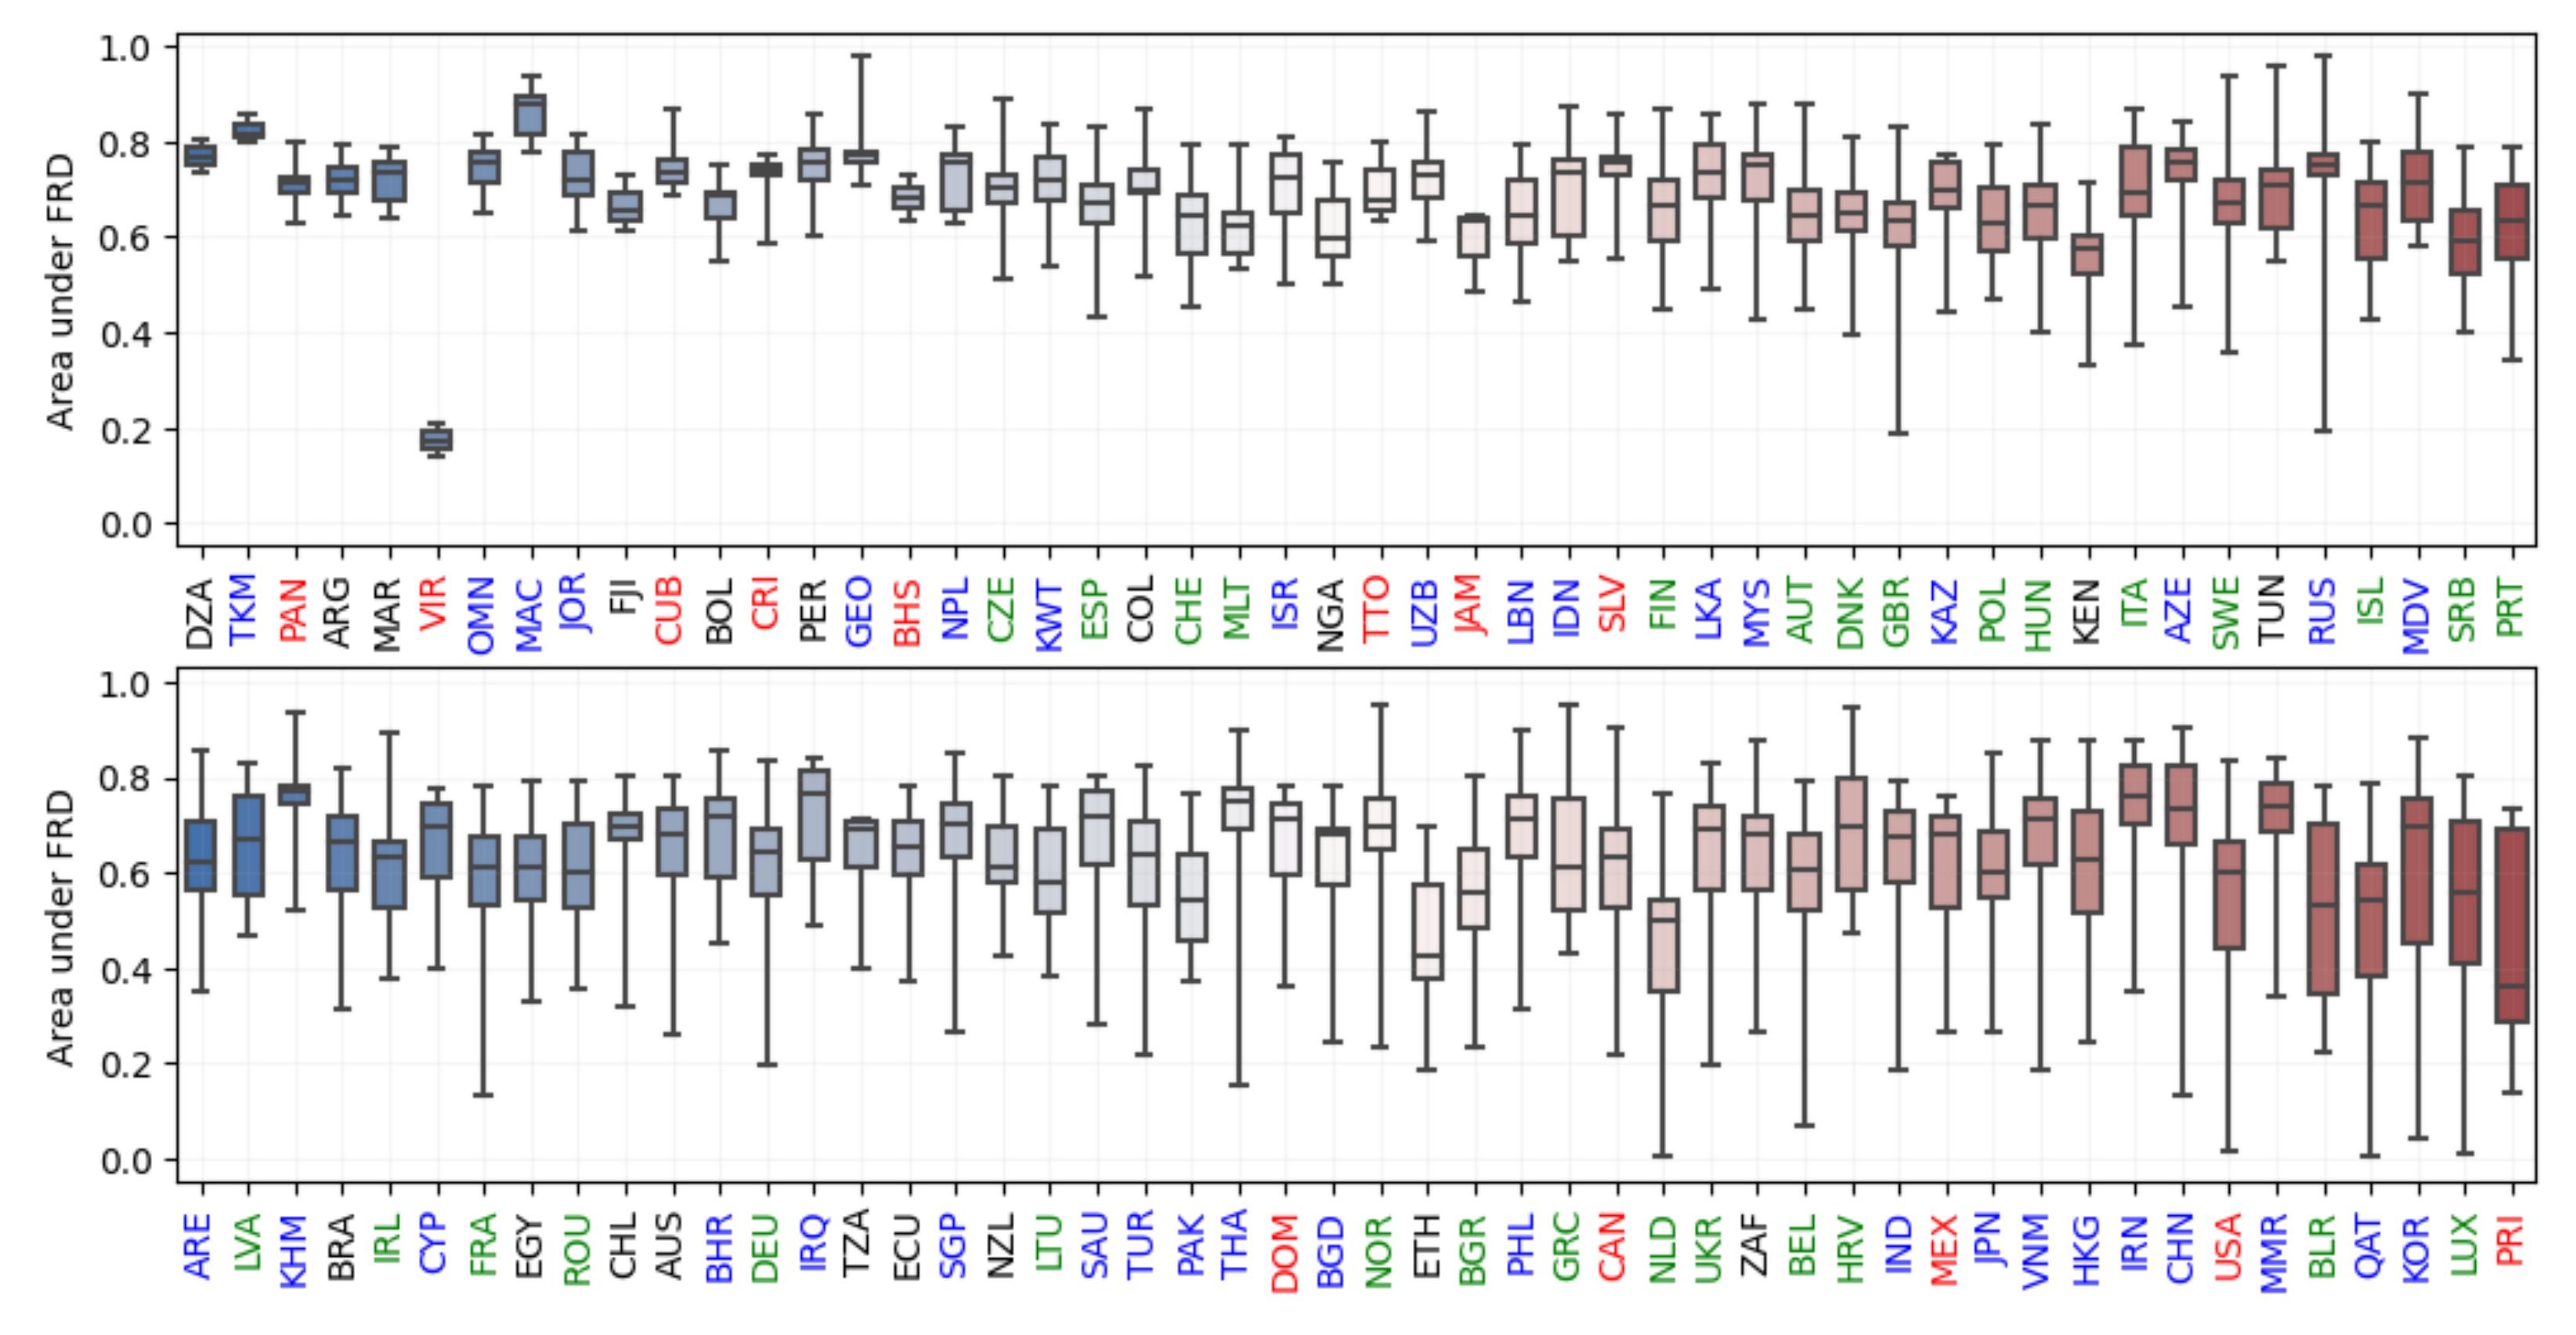
Figure 7 presents a different view on the previous experiment, ranking all countries according to the standard deviation of area under the FRD, with increasing values. It can be observed that those countries with a smaller standard deviation are often those countries which performed a stricter flight ban (as indicated by the larger median values), with the exception of the Virgin Islands (VIR). Moreover, it is notable that, contrary to Figure 6, there is no obvious pattern regarding the continents.
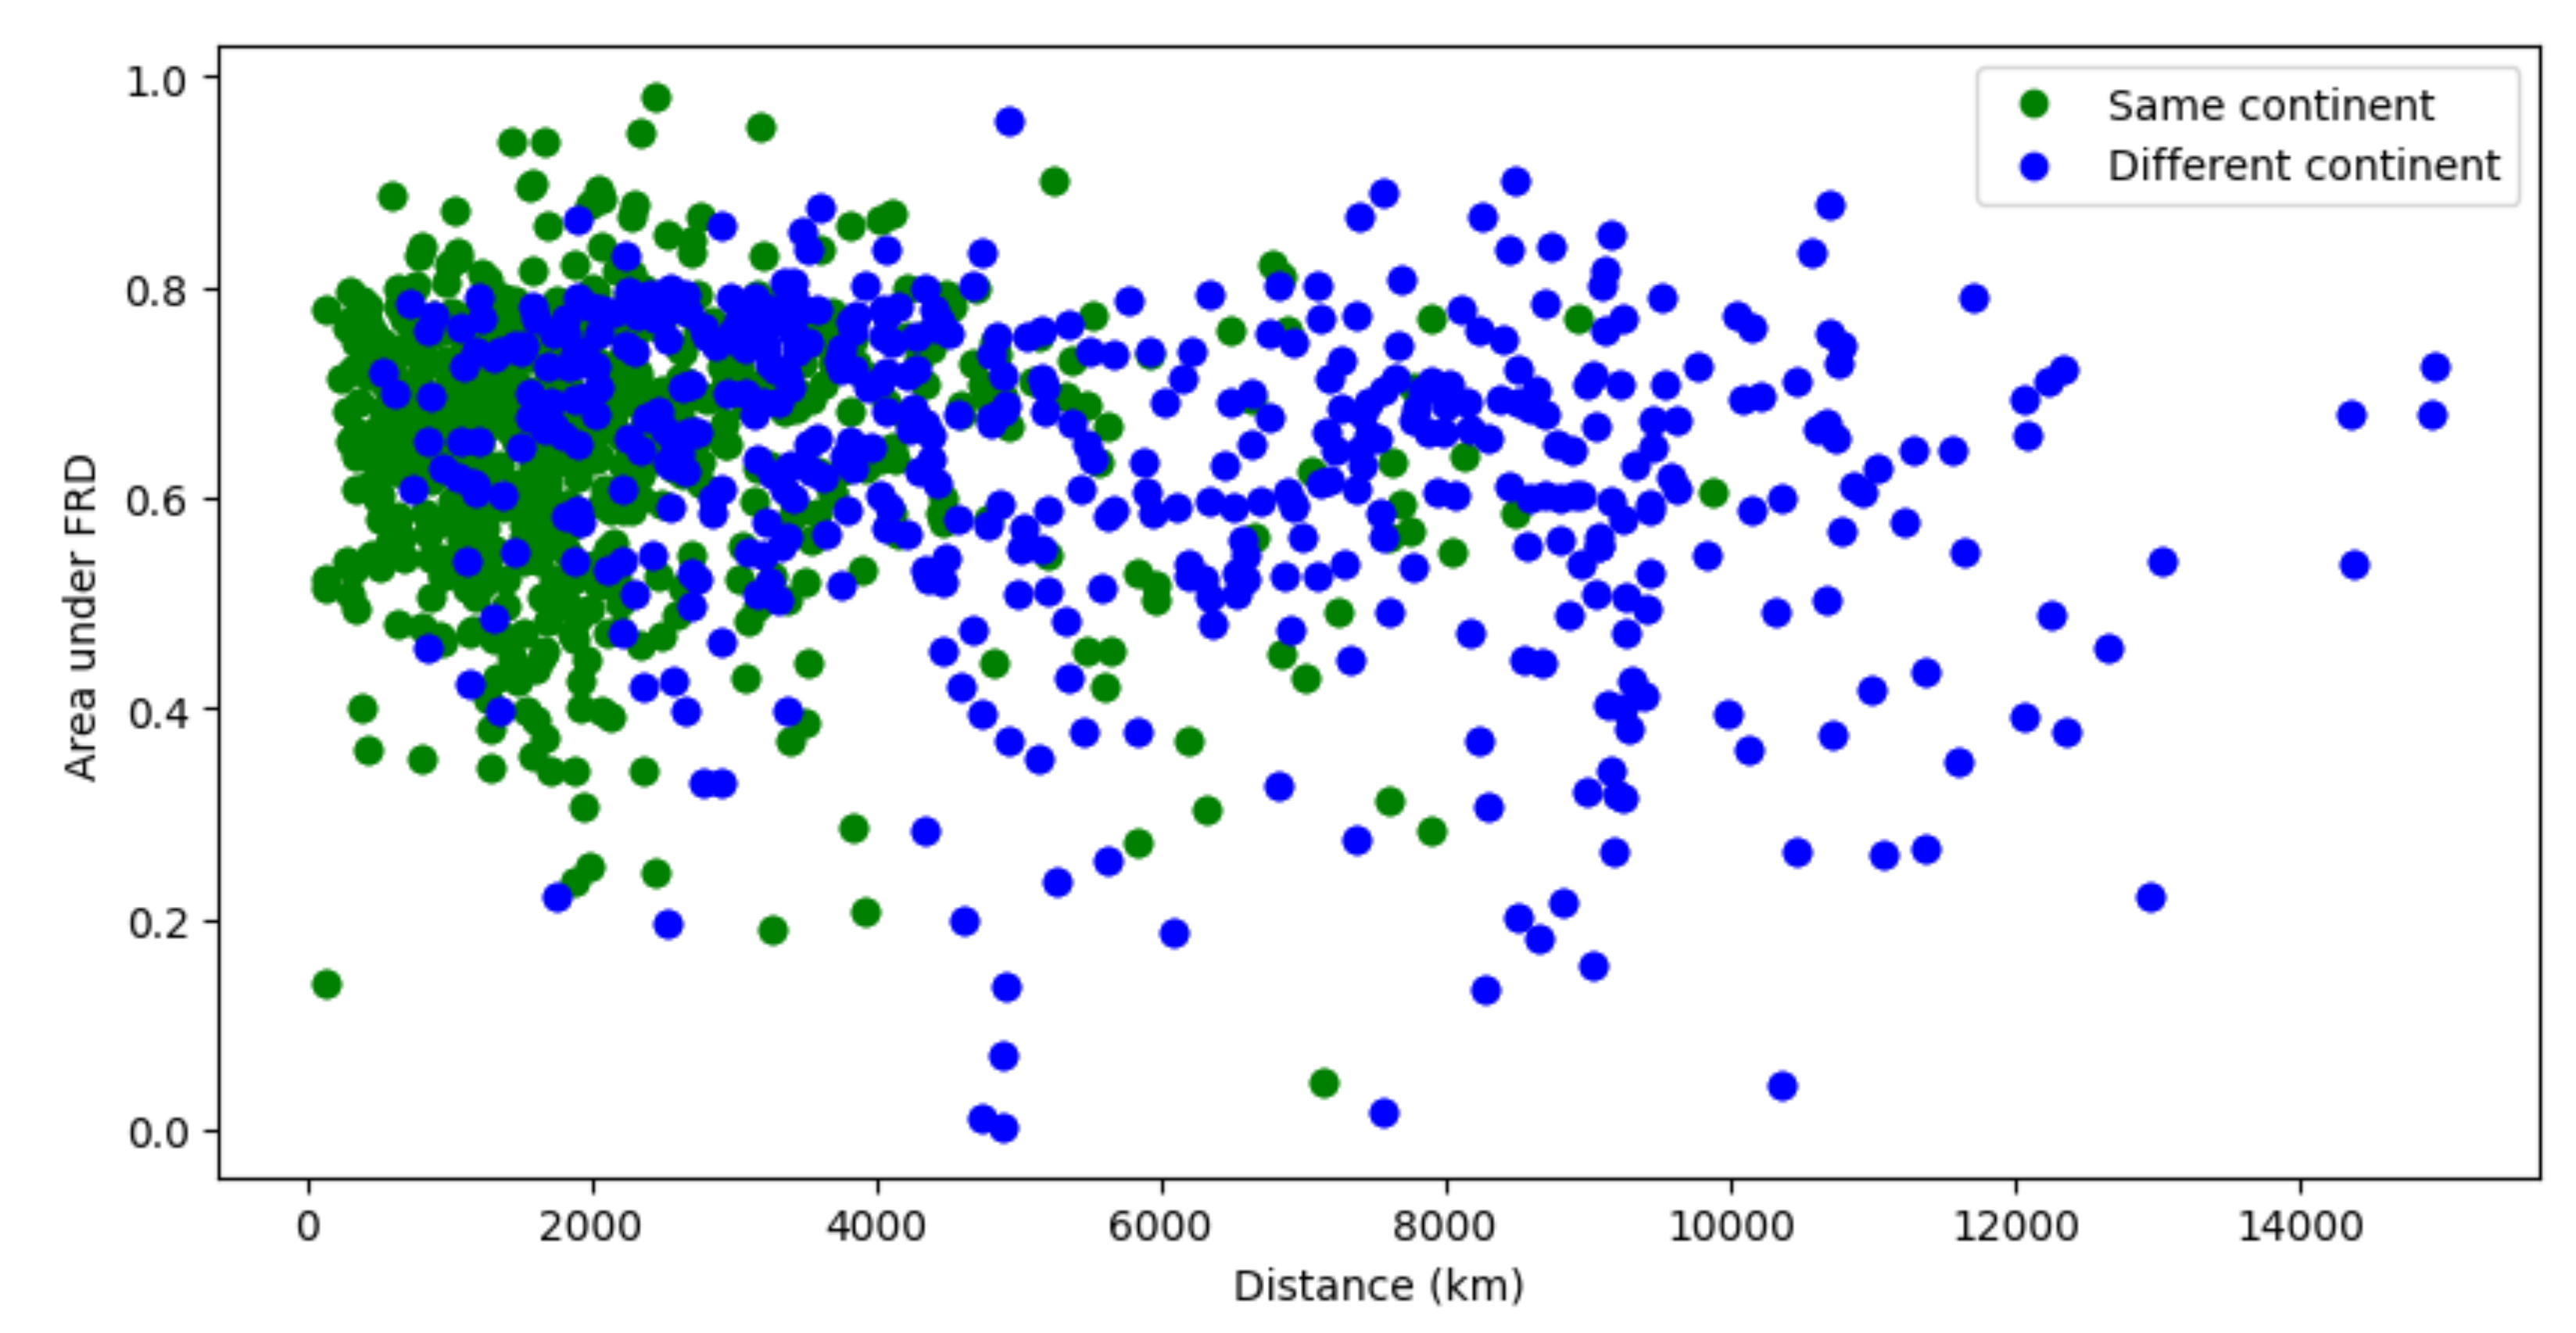
In Figure 8, we address the question of whether the flight bans were preferably executed on long-distance connections by plotting the distance between airport pairs (x-axis) against the area under the FRD (y-axis). Surprisingly, there is no obvious correlation between these two variables, suggesting that the distance alone is not a good explanatory variable for the execution of long-term flight bans. By highlighting continental information using colors, we can see that the fact that whether two countries belong to the same continent has negligible contribution to the area under the FRD either. Accordingly, these decisions are more likely to be explained by individual measures and connections concerning economics and other alliances.
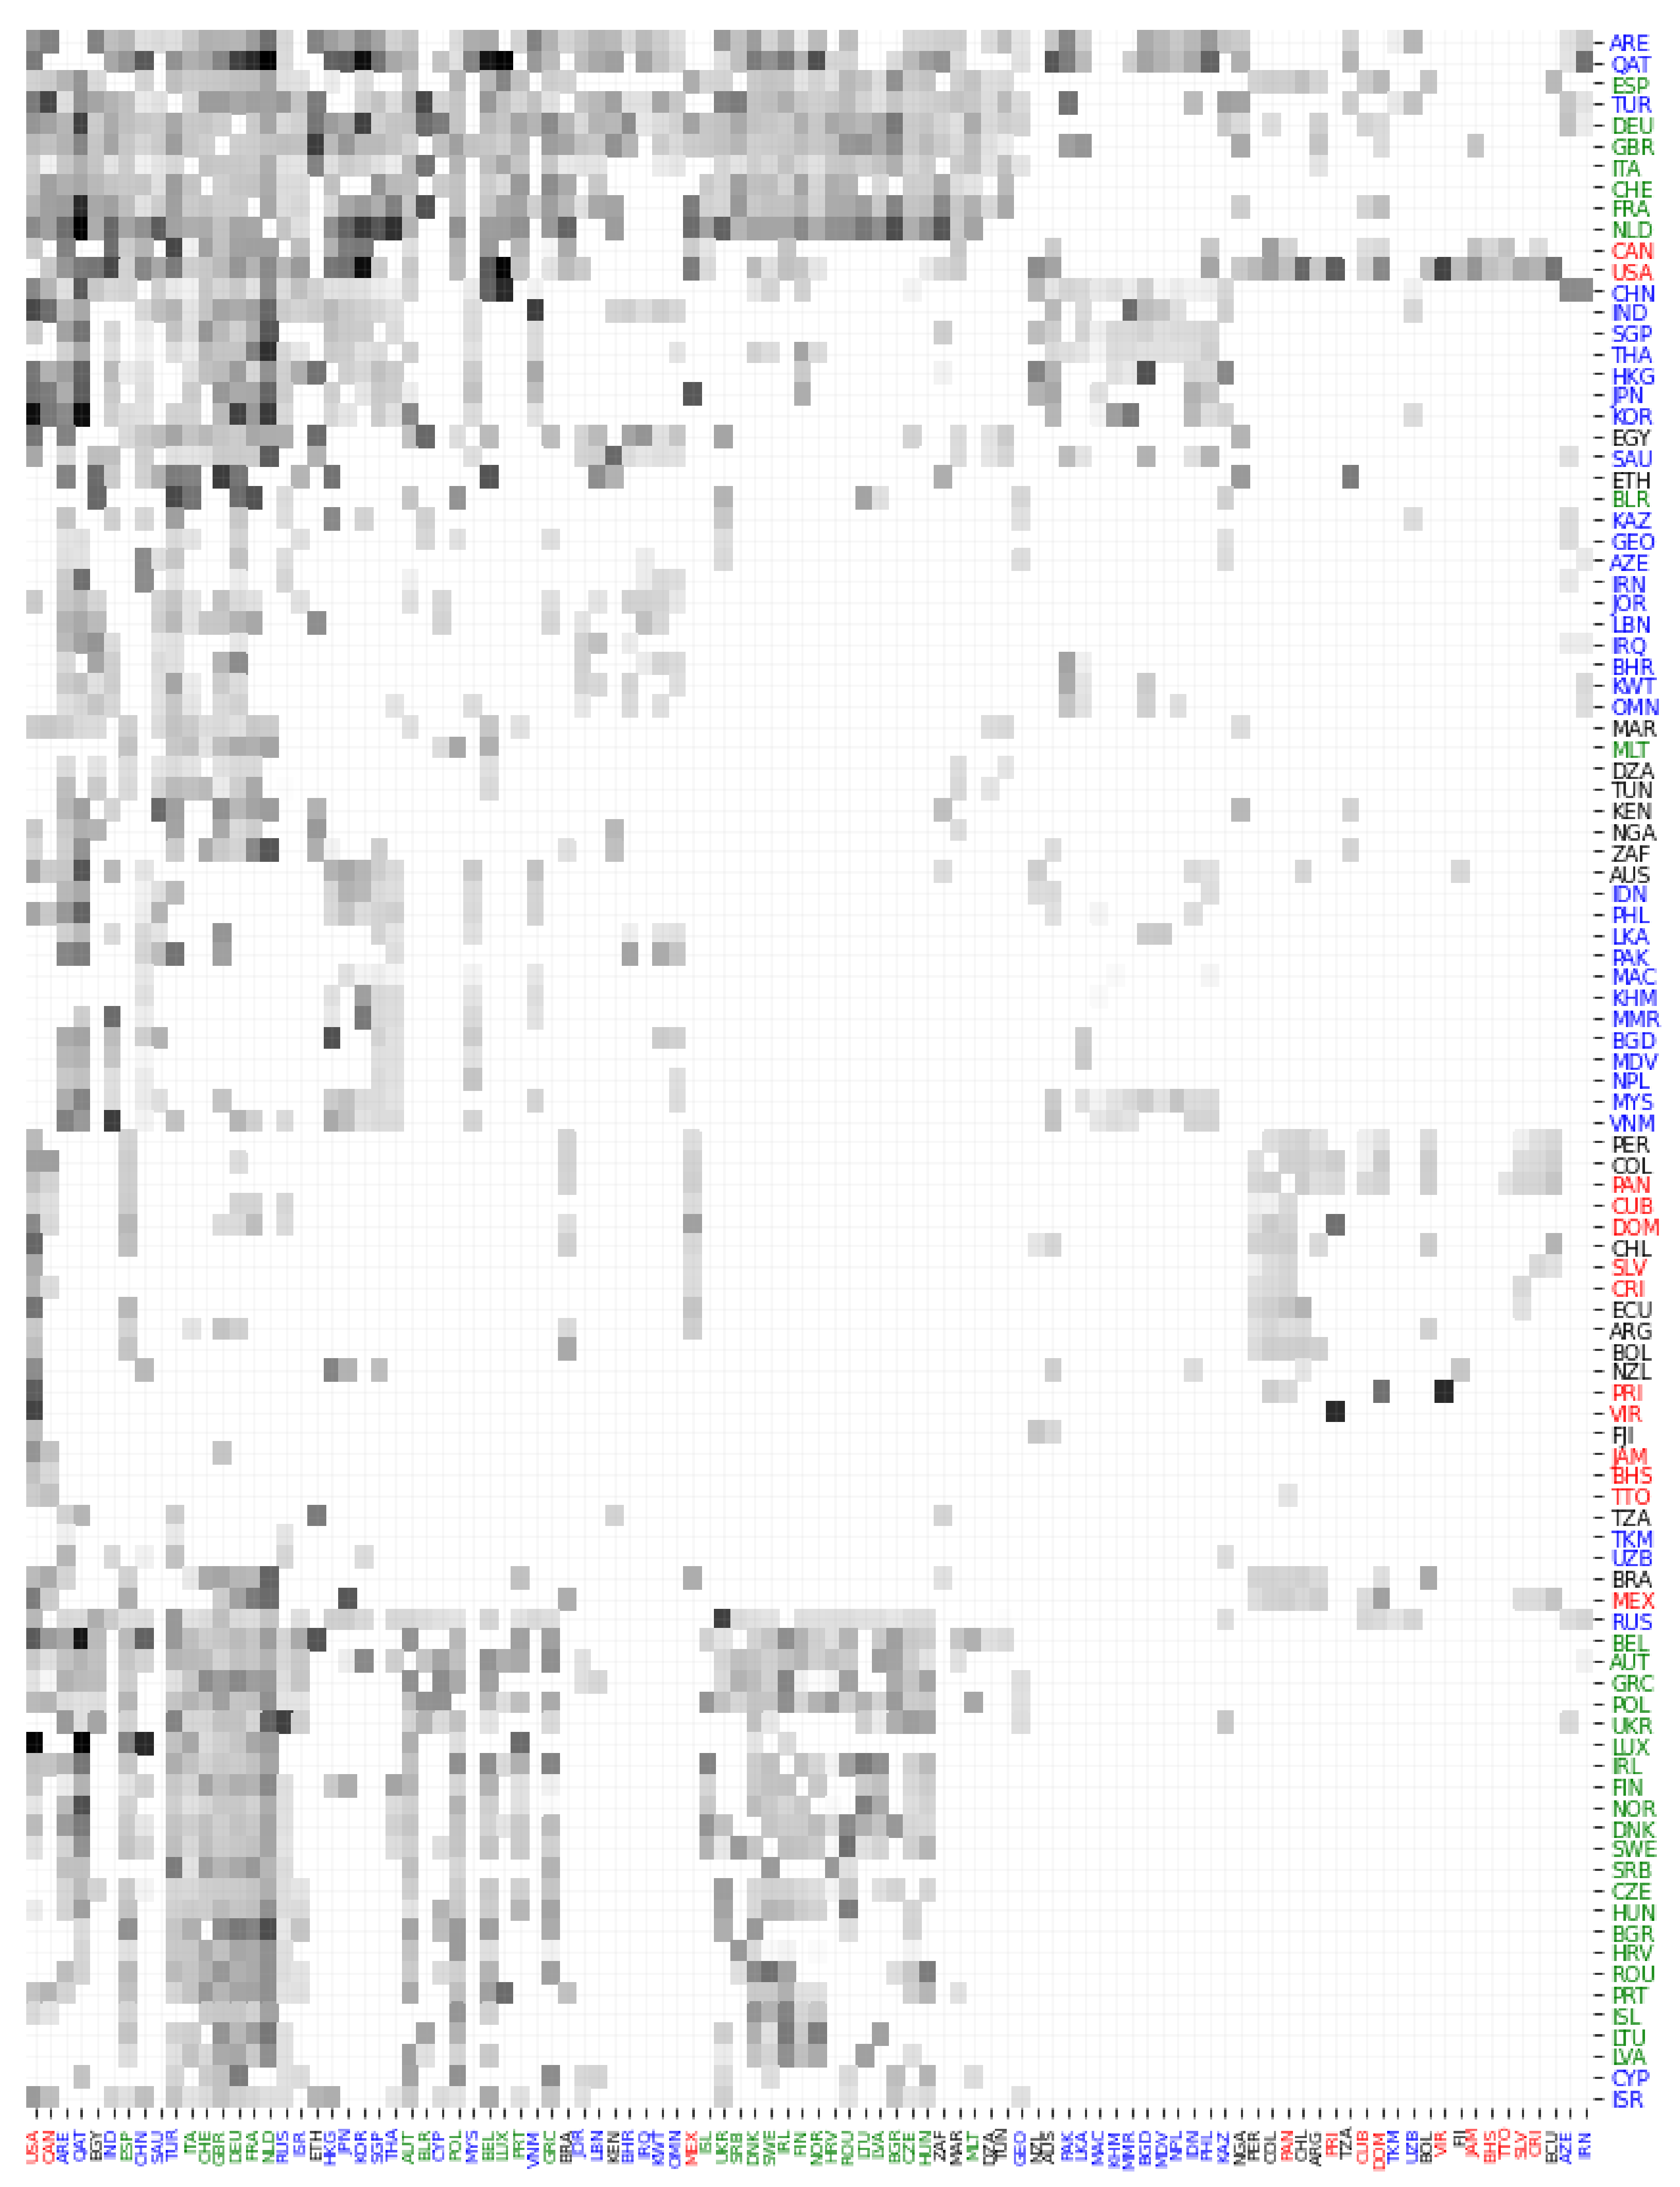
Figure 9 reports the area under the FRD curve for each country pair in this study. A darker cell indicates a smaller AUC, which in turn indicates a smaller reduction in the number of flights in 2020 with the year 2019 as a baseline. The countries are clustered hierarchically based on their aggregated similarity; as indicated by the tree structures along the left and top axis. Countries from selected continents are highlighted: Asia (blue), Europe (green), and North America (red). It can be observed that there are four large clusters, listed from the bottom-right to the top-left. The first cluster consists mainly of countries in Asia and Oceania. Half of these countries are well-connected to Europe/North America, e.g., including Japan (JPN), South Korea (KOR), and Singapore (SGP). Notably, China (CHN), Thailand (THA), and India (IND) are not part of this cluster. In addition, all countries are well-connected to the critical hub countries Qatar (QAT) and the United Arab Emirates (ARE).
The second cluster largely consists of countries located in South America and Central America. These countries have kept up flight activity among each other and a few other critical hub countries, e.g., the United States (USA) and Spain (ESP). The third and fourth cluster include countries from the Middle East and South-East Asia, respectively. The largest cluster consists mainly of European countries, together with Turkey (TUR), Qatar (QAT), the United Arab Emirates (ARE), Saudi Arabia (SAU), and Ethiopia (ETH). Finally, the United States (USA) and Canada (CAN) are not clustered with the remaining countries, indicating a rather distinct decision making during the pandemic. Overall, it can be concluded that few of the larger countries completely shut down their flights; and most countries kept up flight connectivity with selected close neighbors and critical hub countries.
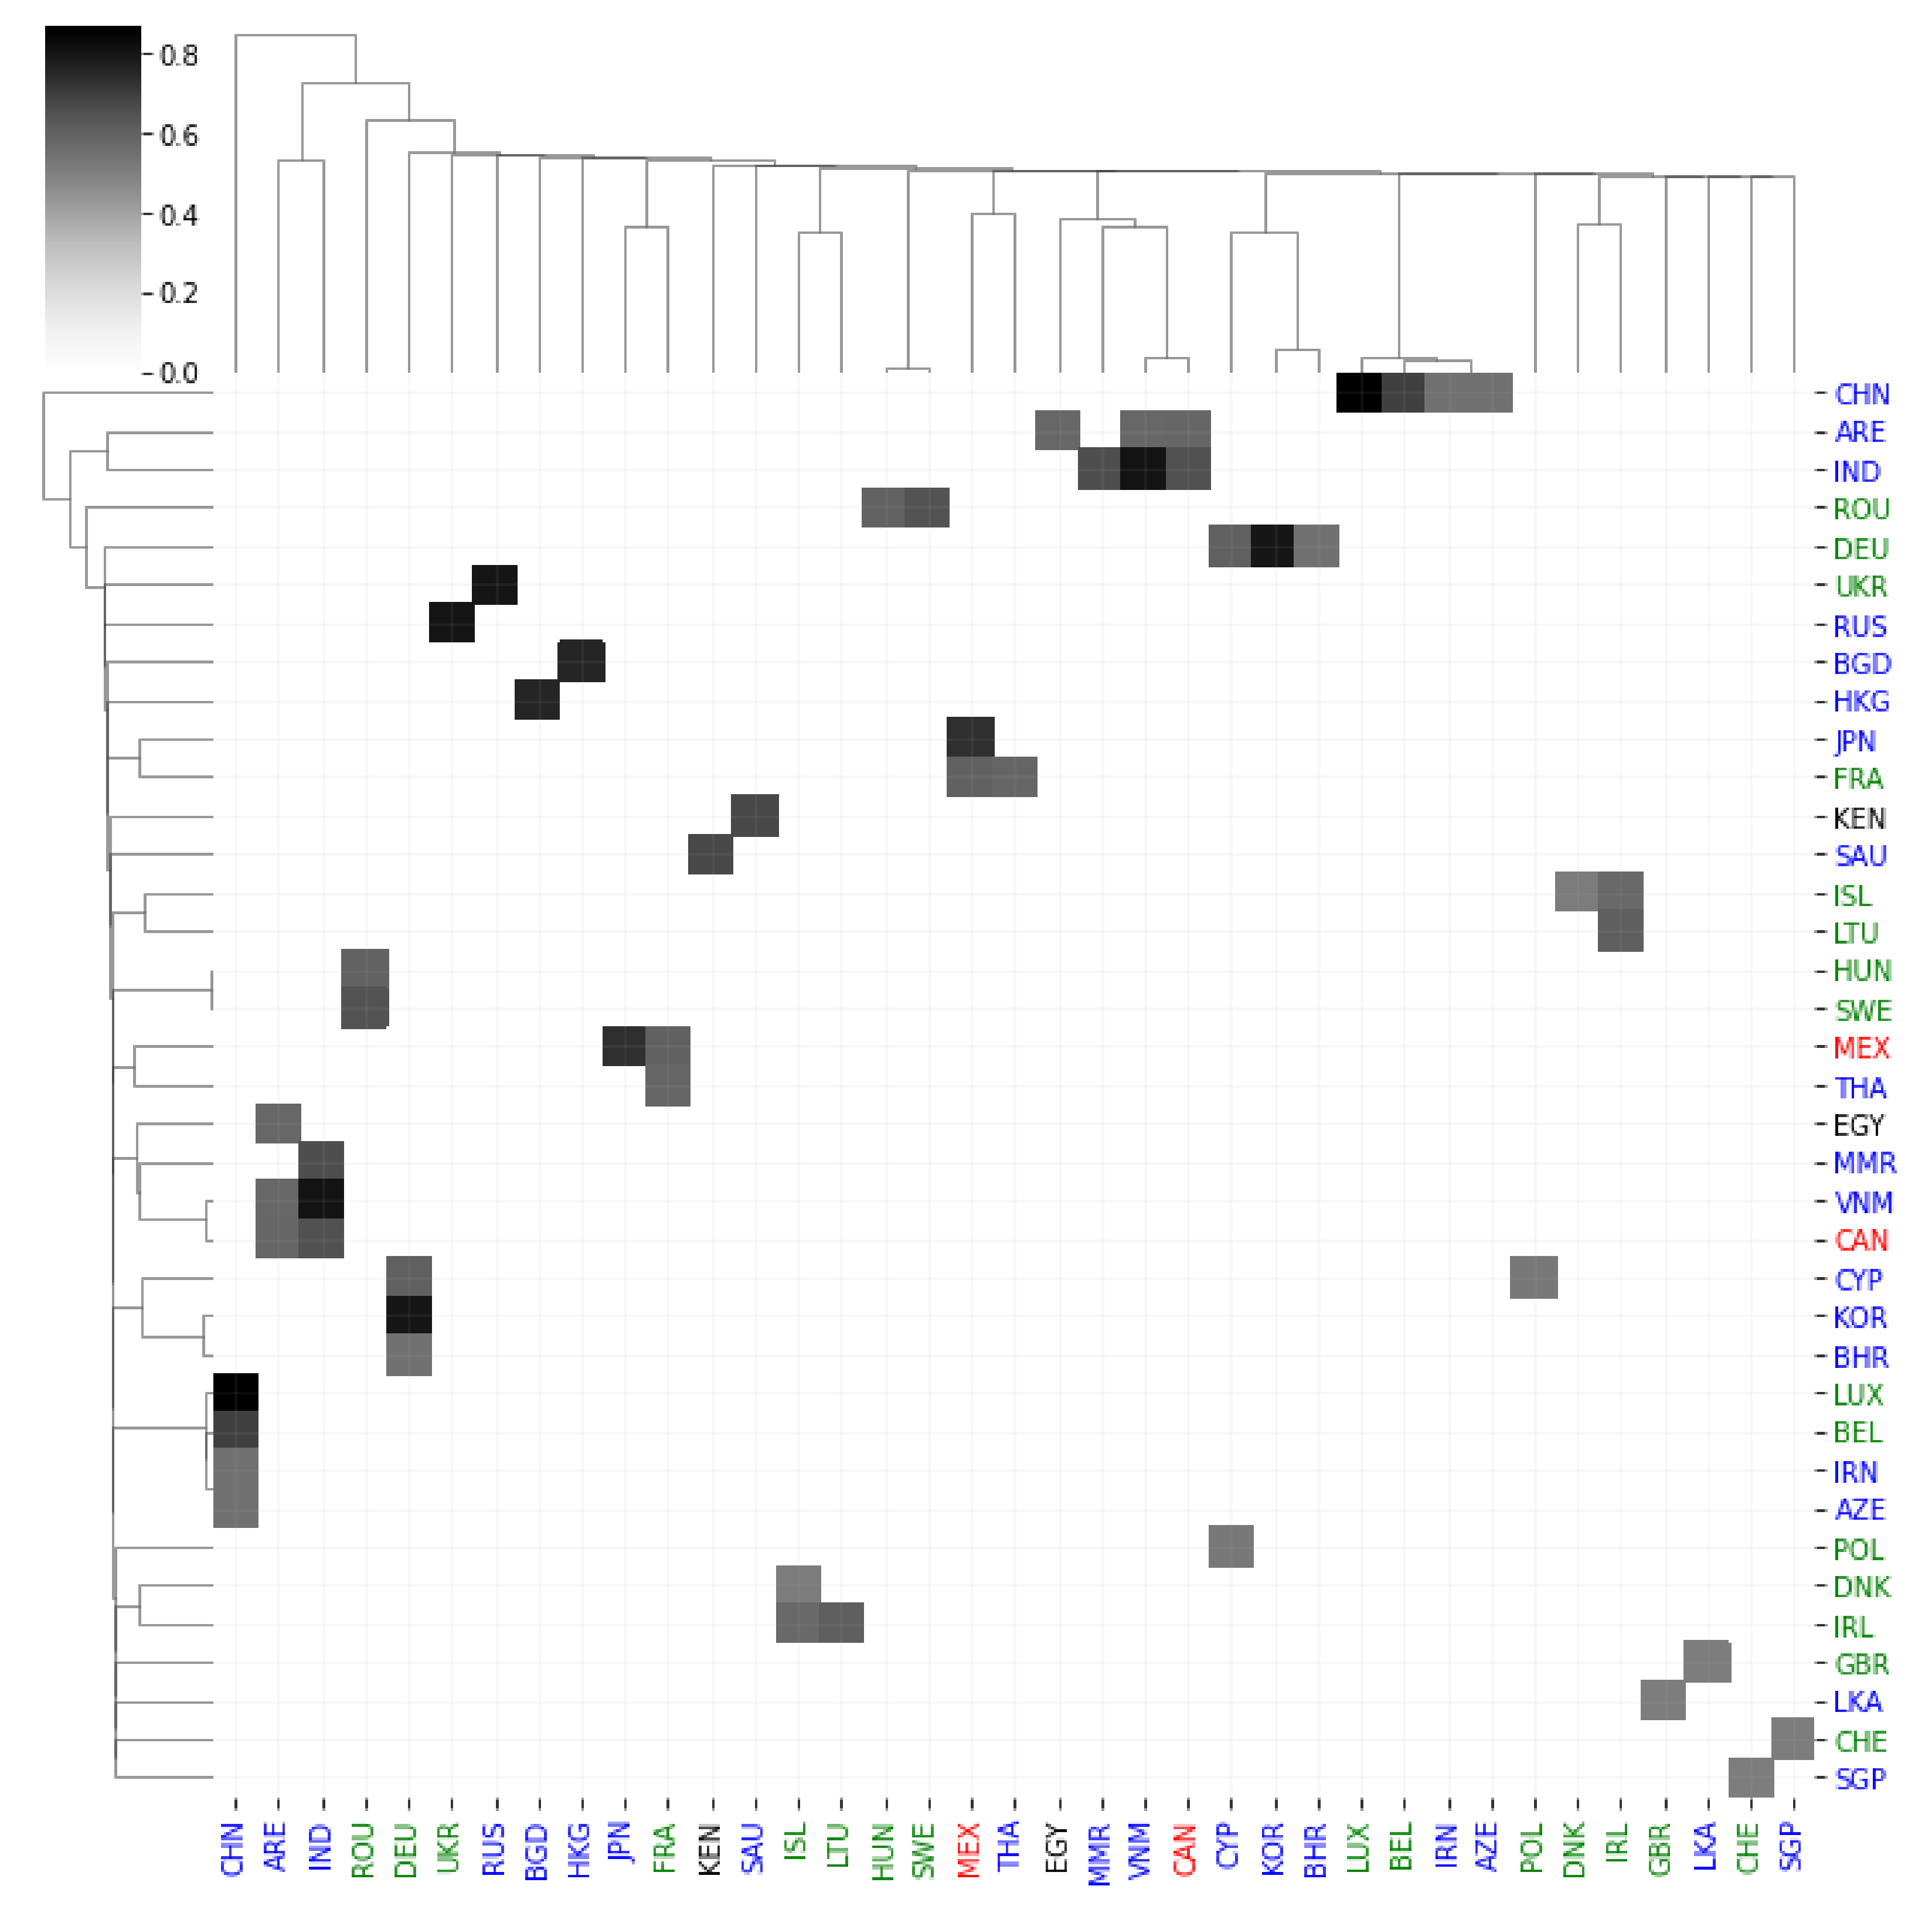
It should be noted that the results in Figure 9 are possibly biased by the existence of community structure in the worldwide country network. In general, the unweighted network has a strong community structure, where countries inside a continent are better connected than countries located on different continents. Only a few intermediate countries cannot be assigned to static communities, mainly those which have a high bridge-like function between the communities, e.g., the United States (USA) or the United Kingdom (UK). Therefore, we propose to perform some post-processing on these results. For this step, we make the following assumption: A travel bubble is special relationship between a country pair which is significantly different from the FRD of the (major) other destinations of a country. For instance, given that the Netherlands and the United States have kept open connections to many other countries, these should not all be considered as travel bubbles. Therefore, for each country, we compute a cutoff value which corresponds to the median minus standard deviation over all neighbors’ area under the FRD of a given country c. Figure 10 reports these results. The intuition is that we want to identify destinations which are outstandingly connected; therefore, we add the one-time standard deviation to the median. Only destinations which have an area under the FRD which is smaller than the median minus the standard deviation are considered to be significant travel bubbles.
We discuss selected travel bubbles observable in the data below. First of all, there are a few obvious travel bubble pairs: Ukraine (UKR) with Russia (RUS), France (FRA) with Kenya (KEN), Great Britain (GBR) with Sri Lanka (LKA), and Singapore (SGP) with Switzerland (CHE). These pairs of countries have kept mutual connections during the year 2020 much more active than their other destinations. China (CHN), despite heavy bans on most countries, has kept flight connections to a few selected countries: Luxembourg (LUX), Belgium (BEL), Azerbaijan (AZE), and Iran (Iran); notably the connections towards Luxemburg (LUX) are due to air cargo traffic via Cargolux. The United Arab Emirates (ARE) and India (IND) have kept air traffic with Canada (CAN) and Vietnam (VNM) open, together with Egypt (AGY) and Myanmar (MMR), respectively. Sweden (SWE) and Hungary (HUN) have built a travel bubble via Romania (ROM). Germany (DEU) has kept high air traffic with Cyprus (CYP), South Korea (KOR), and Bahrain (BAR).
5. Discussion
This study investigated the existence of travel bubbles in air transportation data during the COVID-19 pandemic in the year 2020. While several academic studies and public outlets have discussed the concept of travel bubbles, to the best of our knowledge, this study is the first one to provide empirical evidence on the existence of such travel bubbles using real-world global air traffic data. Methodologically, we have constructed weekly worldwide country networks for the years 2019 and 2020, and proposed a new index, the flight reduction discrepancy (FRD), which may prove useful in future studies.
5.1. Major Findings
Our study leads to a few key insights, which are listed below. First, we find that the air transportation system was severely affected by COVID-19 throughout the whole year of 2020, with the peak probably being reached between March and May. Between June and August, several countries released flight restrictions; possibly explainable by the holiday season in the northern hemisphere. Towards the end of 2020, a sideward trend is observed in the flight data. Second, the reaction of countries towards COVID-19 varies and, in a number of cases, is rather distinct. Those individual countries clearly exhibit different pandemic handling strategies in terms of flight bans and releases. While some decided to keep a large number of flights active (e.g., the Netherlands and the United States), other countries have mostly shut down their international flight connectivity (e.g., China and Russia) in face of the pandemic. Third, the interesting cases between these extremes—and these are the ones that should be considered as travel bubbles intuitively—are those countries that keep their connectivity to certain selected destinations higher than those to other countries. We identified and reported several of these travel bubbles in our data, including explainable cases such as the bubble formed by Russia and Ukraine. Finally, travel bubbles, as announced in the literature, have not always led to measurable recovery in flight connectivity. For instance, the eponymous travel bubble plans between Australia and New Zealand were forestalled by a local COVID-19 outbreak. In other cases, concerns regarding the actual implementations of a bubble led negotiations to stall.
5.2. Policy Implications
The methodology and findings of our study have important policy implications. First of all, our research shows that there is a need for a formal definition of a travel bubble, not only for the sake of analysis, but also for making informed decisions on whether to open (or close) a travel bubble between countries; this is consistent with related research on other bubbles during COVID-19 [58]. With a fuzzy concept of bubbles in mind, it is not feasible to derive long-term strategies for the return of air transportation to normalcy. In this study, we have chosen to define a travel bubble as deviation from average country behaviour, following the rationale that a bubble is something specifically defined between pairs of (or more than two) countries. The chosen definition will affect not only the findings, but also the derived policies. Here, our study makes the first contributions towards formally understanding the notion of travel bubbles, setting the baseline for future research and decision making.
Second, it is somewhat striking that—despite the prominent coverage in news outlets—the actual data provide rather minor support for the prevalence of travel bubbles in air transportation throughout 2020. Possible explanations for this observation include the forestalling of newly-discovered infection sites, as was the case between Australia and New Zealand [21]. Additional explanations can be found in the lack of actual implementation guidelines. Given the inexperience with epidemically-induced travel bubbles, it is difficult for stakeholders to set up actual policies for opening up. In particular, politicians have tremendous pressure; on one hand, they need to stimulate the international economic ties with other countries [16]; on the other, they are highly afraid of the consequences of a burst bubble [59]. This deadlock possibly induces a preference for not acting after the publicity-producing announcement of travel bubbles between (friendly) countries. Two other factors should not be neglected when introducing travel bubbles. First, one needs to carefully consider the fear of people and whether the sole re-installation of traffic will possibility lead to actually increased mobility [60]. Second, flawed or inconsistent travel policies can have deteriorating impact on peoples’ willingness to travel [61].
Third, it seems as though the major driver for bubble announcements is not necessarily the epidemiological situation, but rather political ambitions. The approach does not work, as the virus does not care about political borders or friendships among countries. Instead, it is driven by a simple media: passenger movements. As long as two countries exchange passengers, there is a high risk for disease spreading. The extent of this risk depends on the epidemiological situation in both countries. Therefore, our findings can provide stimulus for building better travel bubble models, which rely on the actual epidemic incidence in countries, quantifying the risk of infections, and then making informed decisions. The common understanding of bubbles in the news and literature seems to be that once the virus has disappeared, one can return to pre-COVID-19 situations and processes. This is far from the truth, even if the participating countries had zero active infections (CovidZero)—which is already tough to achieve; a single moment of inattention can make the bubble burst. The case of China provides a reminiscent example here. China instigated an extremely strict lock-down, quarantine for incoming travelers, digital contact-tracing, and omnipresent temperature checks which led to the elimination of the virus from the domestic population. Nevertheless, in the end of 2020, several smaller hotspots emerged; the reasons are not fully understood, but possibly related to the cold food chain and undue waste management. Furthermore, troubles are a matter of trust. While being agreed upon mutually, there is the issue of transitivity; if one country opens a travel bubble with two neighbors individually, these two neighbors—in essence—are connected via the bubble as well. Accordingly, there is a need for a better understanding and anticipation of the down-stream effects related to travel bubbles.
Whether or not we will see a future aviation system with regular travel bubbles is an interesting question; its answer depends on a few concerns and problems, which should be carefully elaborated by all involved stakeholders as discussed in the paper. Overall, decision making behind the unprecedented cross-border measures adopted during the pandemic needs further justification. There is a need for global travel bubble coordination based on evidence and near-real-time COVID-19 epidemiological data; not based on political or economic reasons alone. Finally, the ongoing efforts in vaccination will likely spur interest and research on vaccination bubbles, which could be created between countries with sufficiently high vaccination rates. Nevertheless, these potential vaccination bubbles can also carry over many of the problems discussed above.
6. Conclusions
Our study performed a data-driven analysis that sought travel bubbles in flight data for the year 2020. There are several alternatives for investigating travel bubbles in air transportation, some of which complement the analysis presented here. For instance, an interesting question is the existence of legal travel bubbles, as actively announced by governments. Future research could analyze the properties of these legal bubbles and compare them to our findings of data-measurable travel bubbles. Another direction for future work concerns the actual data. Here, we have used the number of flights as an indicator for the connectivity between countries. With more data available, for instance, including the actual number of passengers, one could perform more fine-grained analysis of bubbles and possibly detect more evolutionary changes. Similarly, it would be interesting to distinguish cargo-converted or -used passengers aircraft in future studies, once data are available, given that some airlines used cargo transportation as an alternative to passenger transportation throughout parts of the COVID-19 pandemic. Finally, it would be interesting to perform further analysis for the drivers of bubbles, including the possibility to perform econometric analyses, such as regressions against a set of country-specific explanatory variables. Similarly, given the recent progress in vaccination in some parts of the world, another type of bubble will presumably become of interest: so-called vaccination bubbles, induced by vaccination passports [62]. Instead of being based on the number of reported cases, these bubbles could be built on the fraction of vaccinated populations in the countries which aim to form a bubble. The analysis of such vaccination bubbles is a very interesting and timely direction for future work.
Author Contributions
Conceptualization, X.S., S.W., and A.Z.; methodology, S.W.; software, S.W.; validation, X.S., S.W., and A.Z.; formal analysis, S.W. and A.Z.; investigation, X.S.; resources, X.S.; data curation, S.W.; writing—original draft preparation, all authors; and writing—review and editing, all authors. All authors have read and agreed to the published version of the manuscript.
Funding
This work was supported by the National Key Research and Development Program of China (Project No. 2018YFB0505100) and by the National Natural Science Foundation of China (Grant No. 71731001).
Institutional Review Board Statement
Not applicable.
Informed Consent Statement
Not applicable.
Data Availability Statement
Not applicable.
Acknowledgments
Not applicable.
Conflicts of Interest
The authors declare no conflict of interest.
References
- Brockmann, D.; Helbing, D. The Hidden Geometry of Complex, Network-Driven Contagion Phenomena. Science 2013, 342, 1337–1342. [Google Scholar] [CrossRef] [Green Version]
- Zaki, A.M.; van Boheemen, S.; Bestebroer, T.M.; Osterhaus, A.D.; Fouchier, R.A. Isolation of a Novel Coronavirus from a Man with Pneumonia in Saudi Arabia. N. Engl. J. Med. 2012, 367, 1814–1820. [Google Scholar] [CrossRef] [PubMed]
- Bogoch, I.; Creatore, M.I.; Cetron, M.S.; Brownstein, J.S.; Pesik, N.; Miniota, J.; Tam, T.; Hu, W.; Nicolucci, A.; Ahmed, S.; et al. Assessment of the potential for international dissemination of Ebola virus via commercial air travel during the 2014 west African outbreak. Lancet 2015, 385, 29–35. [Google Scholar] [CrossRef] [Green Version]
- Sun, X.; Wandelt, S.; Zhang, A. On the degree of synchronization between air transport connectivity and COVID-19 cases at worldwide level. Transp. Policy 2021, 105, 115–123. [Google Scholar] [CrossRef]
- Sun, X.; Wandelt, S.; Zhang, A. How did COVID-19 impact air transportation? A first peek through the lens of complex networks. J. Air Transp. Manag. 2020, 89, 101928. [Google Scholar] [CrossRef]
- Suzumura, T.; Kanezashi, H.; Dholakia, M.; Ishii, E.; Napagao, S.A.; Pérez-Arnal, R.; Garcia-Gasulla, D. The Impact of COVID-19 on Flight Networks. arXiv 2020, arXiv:2006.02950. [Google Scholar]
- Sun, X.; Wandelt, S.; Zhang, A. Technological and educational challenges towards pandemic-resilient aviation. Transp. Policy 2021, 114, 104–115. [Google Scholar] [CrossRef]
- Linka, K.; Rahman, P.; Goriely, A.; Kuhl, E. Is it safe to lift COVID-19 travel bans? The Newfoundland story. Comput. Mech. 2020, 66, 1081–1092. [Google Scholar] [CrossRef]
- Persad, G.; Emanuel, E. The Ethics of COVID-19 Immunity-Based Licenses (“Immunity Passports”). JAMA 2020, 323, 2241–2242. [Google Scholar] [CrossRef]
- Chen, L.H.; Freedman, D.O.; Visser, L.G. COVID-19 Immunity Passport to Ease Travel Restrictions? J. Travel Med. 2020, 27, taaa085. [Google Scholar] [CrossRef]
- Daon, Y.; Thompson, R.N.; Obolski, U. Estimating COVID-19 outbreak risk through air travel. J. Travel Med. 2020, 27, taaa093. [Google Scholar] [CrossRef]
- Wells, C.R.; Sah, P.; Moghadas, S.M.; Pandey, A.; Shoukat, A.; Wang, Y.; Wang, Z.; Meyers, L.A.; Singer, B.H.; Galvani, A.P. Impact of international travel and border control measures on the global spread of the novel 2019 coronavirus outbreak. Proc. Natl. Acad. Sci. USA 2020, 117, 7504–7509. [Google Scholar] [CrossRef] [Green Version]
- Costantino, V.; Heslop, D.J.; MacIntyre, C.R. The effectiveness of full and partial travel bans against COVID-19 spread in Australia for travellers from China during and after the epidemic peak in China. J. Travel Med. 2020, 27, taaa081. [Google Scholar] [CrossRef] [PubMed]
- Dickens, B.L.; Koo, J.R.; Lim, J.T.; Sun, H.; Clapham, H.E.; Wilder-Smith, A.; Cook, A.R. Strategies at points of entry to reduce importation risk of COVID-19 cases and reopen travel. J. Travel Med. 2020, 27, taaa141. [Google Scholar] [CrossRef]
- Iaquinto, B. Tourist as vector: Viral mobilities of COVID-19. Dialogues Hum. Geogr. 2020, 10, 174–177. [Google Scholar] [CrossRef]
- Sharun, K.; Tiwari, R.; Natesan, S.; Yatoo, M.I.; Malik, Y.S.; Dhama, K. International travel during the COVID-19 pandemic: Implications and risks associated with ‘travel bubbles’. J. Travel Med. 2020, 27, taaa184. [Google Scholar] [CrossRef]
- Lee, K.; Worsnop, C.; Grépin, K.; Kamradt-Scott, A. Global coordination on cross-border travel and trade measures crucial to COVID-19 response. Lancet 2020, 395, 1593–1595. [Google Scholar] [CrossRef]
- Lim, J.; Kheng, K.S. There’s a Pilot for the Asian Travel Bubble. Here Is How to Make It Work. 2020. Available online: https://www.straitstimes.com/opinion/theres-a-pilot-for-the-asean-travel-bubble-here-is-how-to-make-it-work (accessed on 30 December 2020).
- Edwards, R.B. Bubble in, bubble out: Lessons for the COVID-19 recovery and future crises from the Pacific. World Dev. 2020, 135, 105072. [Google Scholar] [CrossRef] [PubMed]
- Iacus, S.; Natale, F.; Santamaria, C.; Spyratos, S.; Vespe, M. Estimating and Projecting Air Passenger Traffic during the COVID-19 Coronavirus Outbreak and its Socio-Economic Impact. Saf. Sci. 2020, 129, 104791. [Google Scholar] [CrossRef] [PubMed]
- Australian Government. Joint Statement Prime Ministers Jacinda Ardern and Scott Morrison Announce Plans for Trans-Tasman COVID-Safe Travel Zone. 2020. Available online: https://www.pm.gov.au/media/joint-statementprime-ministers-jacinda-ardern-and-scott-morrison-announce-planstrans-tasman (accessed on 30 December 2020).
- Krakat, M.B. Travel Bubbles: Are We Rebuilding International Travel From the Ground Up? Investig. Migr. Insid. 2020. [Google Scholar]
- Sun, X.; Wandelt, S.; Zheng, C.; Zhang, A. COVID-19 pandemic and air transportation: Successfully navigating the paper hurricane. J. Air Transp. Manag. 2021, 94, 102062. [Google Scholar] [CrossRef]
- Furutani, K. Japan Has Confirmed Its Travel Bubble with Five Asian Regions—Here Are the Entry Rules. 2020. Available online: https://www.timeout.com/tokyo/news/japan-has-confirmed-its-travel-bubble-with-five-asian-regions-here-are-the-entry-rules-091420 (accessed on 9 December 2020).
- Beddoe, L. Tough times in our bubble of 5 million. Aotearoa N. Z. Soc. Work 2020, 32, 1–4. [Google Scholar] [CrossRef]
- Beirman, D. Challenges Associated with International Travel Bubbles/Corridors during the COVID-19 Pandemic Crisis of 2020. 2021. Available online: https://opus.lib.uts.edu.au/bitstream/10453/148274/3/Challenges%20Associated%20with%20International%20Travel%20Bubbles%20Corridors%20during%20the%20COVID-19%20Pandemic%20Crisis%20of%202020.pdf (accessed on 30 December 2020).
- Khan, K.; Arino, J.; Hu, W.; Raposo, P.; Sears, J.; Calderon, F.; Heidebrecht, C.; Macdonald, M.; Liauw, J.; Chan, A.; et al. Spread of a Novel Influenza A (H1N1) Virus via Global Airline Transportation. N. Engl. J. Med. 2009, 361, 212–214. [Google Scholar] [CrossRef]
- Poletto, C.; Boelle, P.Y.; Colizza, V. Risk of MERS importation and onward transmission: A systematic review and analysis of cases reported to WHO. BMC Infect. Dis. 2016, 16, 731–753. [Google Scholar] [CrossRef] [PubMed]
- Wong, G.; Liu, W.; Liu, Y.; Zhou, B.; Bi, Y.; Gao, G. MERS, SARS, and Ebola: The Role of Super-Spreaders in Infectious Disease. Cell Host Microbe 2015, 18, 398–401. [Google Scholar] [CrossRef] [PubMed] [Green Version]
- Pigott, D.; Golding, N.; Mylne, A.; Huang, Z.; Henry, A.J.; Weiss, D.J.; Brady, O.J.; Kraemer, M.U.G.; Smith, D.L.; Moyes, C.L.; et al. Mapping the zoonotic niche of Ebola virus disease in Africa. Elife 2014, 3, e04395. [Google Scholar] [CrossRef] [PubMed] [Green Version]
- Semenza, J.C.; Sudre, B.; Miniota, J.; Rossi, M.; Hu, W.; Kossowsky, D.; Suk, J.E.; Van Bortel, W.; Khan, K. International Dispersal of Dengue through Air Travel: Importation Risk for Europe. PLoS Neglected Trop. Dis. 2014, 8, 1–12. [Google Scholar] [CrossRef] [Green Version]
- Tatem, A.J.; Hay, S.I.; Rogers, D.J. Global traffic and disease vector dispersal. Proc. Natl. Acad. Sci. USA 2006, 103, 6242–6247. [Google Scholar] [CrossRef] [Green Version]
- Lau, H.; Khosrawipour, V.; Kocbach, P.; Mikolajczyk, A.; Ichii, H.; Zacharski, M.; Bania, J.; Khosrawipour, T. The association between international and domestic air traffic and the coronavirus (COVID-19) outbreak. J. Microbiol. Immunol. Infect. 2020, 53, 467–472. [Google Scholar] [CrossRef] [PubMed]
- Christidis, P.; Christodoulou, A. The Predictive Capacity of Air Travel Patterns during the Global Spread of the COVID-19 Pandemic: Risk, Uncertainty and Randomness. Int. J. Environ. Res. Public Health 2020, 17, 3356. [Google Scholar] [CrossRef]
- Nakamura, H.; Managi, S. Airport risk of importation and exportation of the COVID-19 pandemic. Transp. Policy 2020, 96, 40–47. [Google Scholar] [CrossRef]
- Hossain, M.P.; Junus, A.; Zhu, X.; Jia, P.; Wen, T.H.; Pfeiffer, D.; Yuan, H.Y. The effects of border control and quarantine measures on the spread of COVID-19. Epidemics 2020, 32, 100397. [Google Scholar] [CrossRef]
- Li, J.; Huang, C.; Wang, Z.; Yuan, B.; Peng, F. The airline transport regulation and development of public health crisis in megacities of China. J. Transp. Health 2020, 19, 100959. [Google Scholar] [CrossRef] [PubMed]
- Nikolaou, P.; Dimitriou, L. Identification of critical airports for controlling global infectious disease outbreaks: Stress-tests focusing in Europe. J. Air Transp. Manag. 2020, 85, 101819. [Google Scholar] [CrossRef]
- Zhang, Y.; Zhang, A.; Wang, J. Exploring the roles of high-speed train, air and coach services in the spread of COVID-19 in China. Transp. Policy 2020, 94, 34–42. [Google Scholar] [CrossRef]
- Sun, X.; Wandelt, S.; Zhang, A. Delayed reaction towards emerging COVID-19 variants of concern: Does history repeat itself? Transp. Res. Part A Policy Pract. 2021, 152, 203–215. [Google Scholar] [CrossRef]
- Albers, S.; Rundshagen, V. European airlines’ strategic responses to the COVID-19 pandemic (January-May, 2020). J. Air Transp. Manag. 2020, 87, 101863. [Google Scholar] [CrossRef] [PubMed]
- Budd, L.; Ison, S.; Adrienne, N. European airline response to the COVID-19 pandemic—Contraction, consolidation and future considerations for airline business and management. Res. Transp. Bus. Manag. 2020, 37, 100578. [Google Scholar] [CrossRef]
- Nižetić, S. Impact of coronavirus (COVID-19) pandemic on air transport mobility, energy, and environment: A case study. Int. J. Energy Res. 2020, 44, 10953–10961. [Google Scholar] [CrossRef]
- Dube, K.; Nhamo, G.; Chikodzi, D. COVID-19 pandemic and prospects for recovery of the global aviation industry. J. Air Transp. Manag. 2021, 92, 102022. [Google Scholar] [CrossRef]
- Da Silveira Pereira, D.; Soares de Mello, J.C.C. Efficiency evaluation of Brazilian airlines operations considering the COVID-19 outbreak. J. Air Transp. Manag. 2021, 91, 101976. [Google Scholar] [CrossRef] [PubMed]
- Bombelli, A. Intrators’ global networks: A topology analysis with insights into the effect of the COVID-19 pandemic. J. Transp. Geogr. 2020, 87, 102815. [Google Scholar] [CrossRef] [PubMed]
- Li, T. A SWOT analysis of China’s air cargo sector in the context of COVID-19 pandemic. J. Air Transp. Manag. 2020, 88, 101875. [Google Scholar] [CrossRef]
- Abu-Rayash, A.; Dincer, I. Analysis of mobility trends during the COVID-19 Coronavirus Pandemic: Exploring the impacts on global aviation and travel in selected cities. Energy Res. Soc. Sci. 2020, 68, 101693. [Google Scholar] [CrossRef] [PubMed]
- Schultz, M.; Soolaki, M. Analytical approach to solve the problem of aircraft passenger boarding during the coronavirus pandemic. Transp. Res. Part C Emerg. Technol. 2021, 124, 102931. [Google Scholar] [CrossRef]
- Schultz, M.; Soolaki, M. Optimized aircraft disembarkation considering COVID-19 regulations. Transp. B Transp. Dyn. 2021, 1–21. [Google Scholar] [CrossRef]
- Schultz, M.; Evler, J.; Asadi, E.; Preis, H.; Fricke, H.; Wu, C.L. Future aircraft turnaround operations considering post-pandemic requirements. J. Air Transp. Manag. 2020, 89, 101886. [Google Scholar] [CrossRef]
- Henry, M.; Bazilian, M.; Markuson, C. Just transitions: Histories and futures in a post-COVID world. Energy Res. Soc. Sci. 2020, 68, 101668. [Google Scholar] [CrossRef]
- Pianta, S.; Brutschin, E.; Ruijven, B.; Bosetti, V. Faster or slower decarbonization? Policymaker and stakeholder expectations on the effect of the COVID-19 pandemic on the global energy transition. Energy Res. Soc. Sci. 2021, 76, 102025. [Google Scholar] [CrossRef]
- Santos, K.; Delina, L. Soaring sustainably: Promoting the uptake of sustainable aviation fuels during and post-pandemic. Energy Res. Soc. Sci. 2021, 77, 102074. [Google Scholar] [CrossRef]
- Sovacool, B.; Furszyfer Del Rio, D.; Griffiths, S. Contextualizing the Covid-19 pandemic for a carbon-constrained world: Insights for sustainability transitions, energy justice, and research methodology. Energy Res. Soc. Sci. 2020, 68, 101701. [Google Scholar] [CrossRef]
- Kanda, W.; Kivimaa, P. What opportunities could the COVID-19 outbreak offer for sustainability transitions research on electricity and mobility? Energy Res. Soc. Sci. 2020, 68. [Google Scholar] [CrossRef] [PubMed]
- Wandelt, S.; Sun, X. Evolution of the international air transportation country network from 2002 to 2013. Transp. Res. Part E Logist. Transp. Rev. 2015, 82, 55–78. [Google Scholar] [CrossRef]
- Trnka, S.; Davies, S. Blowing Bubbles: COVID-19, New Zealand’s bubble metaphor, and the limits of households as sites of responsibility and care. In COVID-19: Global Pandemic, Societal Responses, Ideological Solutions; Ryan, J., Ed.; Routledge: London, UK, 2020; pp. 167–183. [Google Scholar] [CrossRef]
- Beirman, D. The Trouble with Travel Bubbles. New Europe 2020. Available online: https://www.neweurope.eu/article/the-trouble-with-travel-bubbles/ (accessed on 30 December 2020).
- Luo, J.M.; Lam, C.F. Travel Anxiety, Risk Attitude and Travel Intentions towards “Travel Bubble” Destinations in Hong Kong: Effect of the Fear of COVID-19. Int. J. Environ. Res. Public Health 2020, 17, 7859. [Google Scholar] [CrossRef] [PubMed]
- Yu, J.H.; Lin, H.H.; Lo, Y.C.; Tseng, K.C.; Hsu, C.H. Is the Travel Bubble under COVID-19 a Feasible Idea or Not? Int. J. Environ. Res. Public Health 2021, 18, 5717. [Google Scholar] [CrossRef]
- Sun, X.; Wandelt, S.; Zhang, A. Vaccination passports: Challenges for a future of air transportation. Transp. Policy 2021, 110, 394–401. [Google Scholar] [CrossRef]
Figure 1.
The number of flights per week between selected countries pairs, comparing data for 2019 (blue) and 2020 (red).
Figure 1.
The number of flights per week between selected countries pairs, comparing data for 2019 (blue) and 2020 (red).

Figure 2.
Comparison of flight ratio discrepancy for two selected countries pairs: Korea–United States (left) and Korea–Philippines (right).
Figure 2.
Comparison of flight ratio discrepancy for two selected countries pairs: Korea–United States (left) and Korea–Philippines (right).

Figure 3.
Comparison of flight ratio discrepancy for all countries pairs involving South Korea; each subplot corresponds to one destination country. The dashed line represents the average flight ratio discrepancy for South Korea.
Figure 3.
Comparison of flight ratio discrepancy for all countries pairs involving South Korea; each subplot corresponds to one destination country. The dashed line represents the average flight ratio discrepancy for South Korea.

Figure 4.
Temporal evolution of flight ratio discrepancy for the top 100 countries in this study. Solid blue lines represent the average FRD; shaded areas represent the 95% confidence interval over all destinations of a country.
Figure 4.
Temporal evolution of flight ratio discrepancy for the top 100 countries in this study. Solid blue lines represent the average FRD; shaded areas represent the 95% confidence interval over all destinations of a country.

Figure 5.
Average area under FRD for all countries in this study.

Figure 6.
Deviation of the area under FRD for all countries in this study.

Figure 7.
Range of area under FRD for all countries in this study.

Figure 8.
Distance comparison against area under FRD for all country pairs.

Figure 9.
Heatmap and clustering for all country pairs.

Figure 10.
Heatmap of the final travel bubbles obtained in this study.

Publisher’s Note: MDPI stays neutral with regard to jurisdictional claims in published maps and institutional affiliations. |
© 2022 by the authors. Licensee MDPI, Basel, Switzerland. This article is an open access article distributed under the terms and conditions of the Creative Commons Attribution (CC BY) license (https://creativecommons.org/licenses/by/4.0/).
Share and Cite
MDPI and ACS Style
Sun, X.; Wandelt, S.; Zhang, A. Travel Bubbles in Air Transportation: Myth or Reality? Aerospace 2022, 9, 38. https://doi.org/10.3390/aerospace9010038
AMA Style
Sun X, Wandelt S, Zhang A. Travel Bubbles in Air Transportation: Myth or Reality? Aerospace. 2022; 9(1):38. https://doi.org/10.3390/aerospace9010038
Chicago/Turabian StyleSun, Xiaoqian, Sebastian Wandelt, and Anming Zhang. 2022. "Travel Bubbles in Air Transportation: Myth or Reality?" Aerospace 9, no. 1: 38. https://doi.org/10.3390/aerospace9010038
Note that from the first issue of 2016, this journal uses article numbers instead of page numbers. See further details here.