Assessing the Italian Innovative Start-Ups Performance with a Composite Index


1
Department of Neuroscience, Imaging and Clinical Sciences, University G. d’Annunzio of Chieti-Pescara, Via Luigi Polacchi 11, 66100 Chieti, Italy
2
Department of Management, University of Bologna, Via Capo di Lucca, 34, 40126 Bologna, Italy
3
Research Centre in Management and Economics (CEGE), Católica Porto Business School, Universidade Católica Portuguesa, Rua de Diogo Botelho, 1327, 4169-005 Porto, Portugal
4
Center for Advanced Studies and Technologies “CAST”, University G. d’Annunzio of Chieti-Pescara, Via Luigi Polacchi 11, 66100 Chieti, Italy
*
Author to whom correspondence should be addressed.
Adm. Sci. 2022, 12(4), 189; https://doi.org/10.3390/admsci12040189
Submission received: 8 November 2022
/
Revised: 4 December 2022
/
Accepted: 8 December 2022
/
Published: 12 December 2022
Abstract
:This paper aims to assess the profitability and employees’ productivity of Italian innovative start-ups with a new composite index: the Start-ups Performance score (SP-score). In recent years, the Italian government has made several efforts to foster the economy, establishment, and growth of start-ups. Specifically, the issuing of the Italian Start-up Act in 2012 offers a unique opportunity to examine the Italian setting, given the special conditions that the government granted to the start-ups. The latter obtain generic benefits, tax reductions and hiring facilitations if they meet specific criteria granting the status (label) of “innovative” by law. Based on a sample of Italian start-ups firms (ISPs) and financial statement data for the period 2016–2020, we test whether the performance of the Italian start-ups which are granted the status of “innovative” is higher compared to start-ups without the mentioned status (NISPs). We measure the firm’s performance by building a composite index which synthesizes both profitability and employees’ productivity (controlling for the firms’ size), and find that the ISPs report higher SP-score compared to the NISPs. In addition, we examine whether the SP-score is higher (or lower) among Innovative start-ups located in different regional areas. The derivation of the composite indicator (SP-score) allows a clear and effective evaluation of several characteristics, permitting a more comprehensive understanding of the data that support the strategic choices of management and localization entrepreneurship policies. In addition, our study highlights a certain homogeneity of innovative start-ups’ performance among the Italian territories, which overcomes the classic dualistic division between Northern and Southern regions.
1. Introduction
In recent decades, several policy initiatives have been released to encourage the establishment and growth of innovative start-ups. The design of these policies is not an easy task, especially as the risk of failure is very likely for most start-ups and only a small portion of them are innovative and become high impact firms (Audretsch et al. 2020). However, the existence of innovative start-ups is fundamental as they foster economic development, employment, technological advancement, and impact in society (Autio et al. 2014; Audretsch et al. 2006; Baumol and Strom 2007; Norrman and Klofsten 2009).
All start-up firms typically report large liabilities and failure rate, but the empirical literature demonstrates that innovative start-ups are more likely to be successful and have higher survival rates (Hyytinen et al. 2015). Several studies in the literature suggest to use both the accounting information from financial statements and the financial ratios to measure firm performance. These financial tools are undoubtedly useful, especially for assessing firm performance under the profitability and financial health lens. In addition, some models have been developed to aggregate some financial ratios to predict potential firm bankruptcy (Beaver 1966; Altman 1968).
Some recent studies highlight the need to look deeper into the performance of innovative start-ups, considering special financial statement ratios (Menon et al. 2018; Guerzoni et al. 2021). Indeed, the analysis of individual financial statement ratios allows for only a partial assessment of firm performance, and it is not always possible to draw synthetic conclusions. In fact, most start-ups might report financial issues at the beginning of their life, when is more difficult to realize large sales and profitability. Separate financial ratios might not be easy to interpret, especially given the complex nature of start-ups, and therefore many dimensions should be taken into consideration while defining their performance. This paper proposes a new composite index specifically tailored to innovative start-ups to assess two main dimensions; profitability and employee productivity, where the latter is expected to foster the first one.
In recent years, the Italian government has issued a series of policies to support the internal economy; the Decree 179/2012 (also called the “Italian Start-up Act”) was issued to provide generic benefits, tax reductions and hiring facilitations to firms which are recognized as “innovative start-ups”. To be classified as “innovative”, the Italian start-ups need to prove a certain level of R&D expenses, or employ highly qualified employees, or be the owner (licensee) of at least one patent or a registered software. This active public policy offers an exceptional package of benefits which can develop a dynamic and competitive innovation ecosystem, create new job opportunities, and promote sustainable growth (Calcagnini et al. 2016; Biancalani et al. 2022).
It is not easy to assess the start-ups’ performance for all the reasons mentioned above; thus, what is naturally expected is that innovation is a key factor which leads to the achievement of better performance. However, the high risk that the Italian Innovative Start-ups (ISPs) stakeholders might face is evaluating firm success by attributing a greater relevance to the “innovative status” (gained by meeting the law requirements) rather than by considering the real contribution of the employees’ productivity to profitability, and the overall outcomes realized by the firms.
Thus, we propose a new composite index (SP-score) to assess the performance of the Italian innovative start-ups (ISPs), and to examine whether their performance (in terms of profitability and employees’ productivity) is greater compared to the Italian start-up firms which apparently do not meet the Italian Start-up Act criteria (NISPs).
To the best of our knowledge, no previous studies have investigated whether or not the fulfilment of particular criteria, which allow firms to be certified as “innovative”, corresponds to the real existence of such strategic factors able to realize higher performance compared to firms without those features. In addition, some recent literature examines whether local contexts could play a role in facilitating (or constraining) entrepreneurship and firm performance (Audretsch 2003; Nicotra et al. 2018). Thus, we extend our main analysis by investigating the influence of regional and local factors on start-up performance. Specifically, we investigate whether Italian innovative start-ups (ISPs) are favored when they are located in a specific geographical area, given the different economic and social evolution of the Italian territory.
This paper contributes to the following three main streams of literature: the assessment of innovative start-ups performance; financial accounting analysis by suggesting a composite performance index tailored on start-ups; and the efficacy of policy initiatives which are addressed to foster entrepreneurship. We contribute to the innovative start-ups field from both theoretical and practical perspectives by offering a new performance index (SP-score) which allows us the simultaneous assessment of both employees’ productivity and firm profitability in the first stage of life cycle. Our study also considers the relevance of local and regional factors in influencing the innovative start-ups’ performance. To test our hypotheses, we build a composite index, the “SP-score”, which allow us to compare the performance of the innovative Italian start-ups to non-innovative Italian start-ups. Hence, in line with OECD (2008), our SP-score permits a clear and effective assessment of start-ups’ performance.
We apply an index for derivation methodology (Mazziotta and Pareto 2013) to aggregate multiple variables associated with the same phenomenon to be considered simultaneously, enabling the understanding of start-up performance through a single indicator rather than through a range of variables (Brand et al. 2007). In this regard, when it is not possible to define a multidimensional phenomenon through a synthesis perspective, composite indexes are particularly useful tools. This is the case for financial analysis, which is conditioned by a number of variables and cannot be grasped by looking at a single item from the financial statements. A composite index is, therefore, particularly useful when understanding whether innovative start-ups perform better than others, considering their characteristics and the benefits they have been granted.
To proceed with the construction of the SP-score for innovative start-ups, a quantitative analysis is applied in the paper. Three main financial performance dimensions are considered for the start-ups’ valuation. The first dimension captures the “profitability”, the second measures the “productivity” (Piotroski 2000), while other variables are included to assess the “size” of the firms (Kuncová et al. 2016; Olawale et al. 2017). Our composite index, which synthesizes the mentioned dimensions, permits the assessment of the performance of innovative start-ups located in different Italian regions, providing an easy tool understand a multidimensional phenomenon using a single indicator. To test our hypotheses, we collect the financial data of a young start-ups sample for the period 2016–2020. Indeed, even though the law on innovative start-ups was issued in the year 2012, most start-ups were established from 2016. Thus, our sample selection accounts for this criteria to build a robust and reliable quantitative analysis.
The paper is organized as follows: Section 2 specifically presents the theoretical approach and hypothesis; Section 3 describes the research design and the methodology; Section 4 discusses the results. Section 5 includes our discussion. Section 6 offers our conclusions, limitations and future research directions.
2. Theoretical Framework and Institutional Setting
2.1. The Usefulness of Composite Indexes in the Valuation of Start-Ups’ Performance
Innovative start-ups (ISPs) play a strategic role in improving the level of innovation and competitiveness of economies (Skawińska and Zalewski 2020). ISPs, which are young high-tech enterprises, have as their main characteristics the ability to create disruptive innovation with a high growth potential and a scalable business model (Christiensen 2003; Damodaran 2009). Moreover, the innovative start-ups promote innovative solutions, often undertaking the most complex challenges such as energy sources, social exclusion, and sustainable development with, at least initially, a tiny staff (Thiel and Masters 2014; Fairlie et al. 2015; Ghio et al. 2016; Breschi et al. 2018). Thus, many elements are crucial while defining start-ups’ performance. A large body of literature investigates the usefulness of the financial statement analysis to predict future changes in earnings (Ou and Penman 1989) and market returns (Lev and Thiagarajan 1993). Thus, financial signals are used by financial analysts to build profitable investment strategies (Abarbanell and Bushee 1997; Mohanram 2005; Piotroski 2000) and interpret investors’ reactions when earnings announcements are released (Bernard and Thomas 1989; Sloan 1996).
The financial statement analysis is undoubtedly useful, and represents a tool that, generally, all stakeholders use to summarize and interpret the performance realized and forecast the future performance for both listed and unlisted firms (Palumbo and Rosati 2022). To distinguish between winner and loser firms, Piotroski (2000) identifies nine simple accounting fundamental signals to measure both the profitability, financial leverage/liquidity and operating efficiency of firms. The selected indicators are easy to implement and have a “broad appeal as summary performance statistics”. However, the analysis of individual financial statement ratios allows only a partial assessment of firm performance, and it is not always possible to draw summary conclusions.
Piotroski (2000) builds an aggregate score (F_SCORE) as a summary of different financial indicators to measure the overall strength of firm’s performance under the profitability, liquidity and operating efficiency lenses. In particular, firm profitability is captured by adopting synthetic indicators, such as ROA, its variation, and operating cash flow, together with pure accounting items such as the amount of accruals reported. Similarly, Mohanram (2005) identifies eight accounting fundamentals (such as earnings, cash flows, earnings stability, growth stability, intensity of R&D and capital expenditures) and aggregates them, creating the so-called GSCORE to explain the outcomes of firms’ investment strategy.
Moreover, both the Altman Z-Score (Altman 1968) and the M-Score (Beneish 1997) are other well-known composite indexes based on financial ratios which are calculated from financial statements data. Specifically, while the Z-Score uses the profitability, liquidity, solvency, and activity to predict the potential firms’ bankruptcy, the M-Score aggregates eight financial ratios to check if firms are likely to report manipulated earnings. Soliman (2004) demonstrates that the Dupont analysis can be improved by industry-adjusting for profit margin and asset turnover. Thus, even if the relevance of the fundamental analysis remains unquestionable, the composite index usefulness is identifiable in providing a clear, synthetic, and effective assessment of multiple dimensions of firm performance, which should be identified according to the specific assessment goals.
The creation of a composite performance index tailored to start-up firms might provide the advantage of taking into consideration multiple aspects specific to young firms, such as the strategic contribution of intangibles investments and human resources knowledge and experience.
2.2. The Italian Innovative Start-Ups Setting and Research Hypotheses
The aims of industrial policy in Italy over the past few decades have increasingly concerned support for innovative entrepreneurship. These policies allow the development of an innovation system that can function as a bridge between the world of academia and research and the vibrancy of an entrepreneurial culture (Calcagnini et al. 2016; Ghio et al. 2016). At the end of 2012, a new regulation, the Decree Law 179/2012, also known as “The Italian Start-up Act”, (transformed into Law 221/2012), was approved in Italy to foster the creation of innovative start-ups. The policy is aimed at supporting the development and innovation of the Italian entrepreneurial ecosystem, creating new job opportunities, and promoting sustainable growth (Calcagnini et al. 2016; Biancalani et al. 2022). Consequently, the number of Italian innovative start-ups in recent years has been growing and reached about 12,000 at the end of 2020.
The evolution of innovative start-ups is not only related to the facilities and tax credits that encourage their establishment, but also to the need for Italian counties to develop their entrepreneurial vocations and employ highly qualified human capital. To be classified as “innovative”, the Italian start-ups should meet a series of requirements, and, specifically, should: (i) be a young firm, a new one or established for no more than 5 years); (ii) be resident in Italy, or in another country of the European Economic Area, but has its production site or branch in Italy; (iii) report an annual turnover of less than 5 million euros; (iv) not be listed on a regulated market or a multilateral trading platform; (v) should have not distributed earnings; (vi) have as its exclusive or prevailing corporate purpose the development, production, and marketing of a product or service with high technological value; (vii) not be the result of a merger, demerger or sale of a business branch, (viii) demonstrate the implementation of at least one “innovative investment strategy” (out of three). In addition, the Italian start-up can be considered as “innovative’” (ISPs) if it meets at least one of the following three subjective requirements: it expends at least 15% of the greater of turnover or cost of production on R&D and innovation; it employs highly qualified workers (at least 1/3 PhDs, PhD students or researchers; alternatively at least 2/3 of the total workforce must hold a Master’s degree); and it is the owner, depositary or licensee of at least one registered patent or the owner of registered software.
Thus, the Italian policy allows young start-up firms the opportunity to be acknowledged as “innovative start-ups” if they satisfy certain criteria. The latter mechanism provides a series of advantages and benefits for firms: e.g., a greater flexibility in labor contracts and related worker compensation, several tax incentives (such as the recognition of specific tax credits for 5 years), and exemption from certain forms of taxation. Moreover, investors in innovative start-ups can receive a tax credit as individuals and fiscal deduction as legal entities, thus favoring the capitalization of these innovative companies. These supportive elements might positively affect the performance of these innovative firms.
Prior studies investigated the consequences of the policy’s release in terms of access to government loans and fiscal incentives for venture capital equity investments (Giraudo et al. 2019), and other researchers examined whether or not the Italian innovative start-ups are more successful in attracting equity and debt capital (Biancalani et al. 2022). Finaldi et al. (2016) compared the Innovative Italian start-ups to similar firms that did not enroll in the law, and found that the innovative start-up group reports on average a higher change in their bank loan, while the control group accounts for a higher level of investment rate. Menon et al. (2018) suggested that the Italian policy has some positive effects on the firms’ financial performance, and the main items of the balance sheet (assets, book value of capital, investments, ratio of intangible investments over tangible investments and value added).
However, to the best of our knowledge, no prior studies examine whether or not the fulfilment of the mentioned requirements (which permit a firm to be recognized as “innovative” by law) corresponds to the existence of real strategic factors able to foster higher performance compared to firms which do not meet these criteria.
One of the major risks that stakeholders might face is to naturally expect a higher performance from the Italian innovative start-ups (ISPs), given the “innovative status” acknowledged by law, compared to the rest of the Italian start-ups (NISPs), without assessing the real performance realized by those firms. Thus, in line with prior studies, which suggest that innovative ventures rely on R&D investment, marketing expenses and own qualified personnel (Beck and Demirguc-Kunt 2006), we investigate whether:
H1.
Italian start-ups, defined by law as “innovative” (ISPs), achieve higher profitability and employee productivity (higher SP-score) compared to firms which do not satisfy the law requirements (NISPs).
Moreover, an assessment at the national level does not consider the specificities that have always marked the economic and social evolution of the Italian territory. Indeed, the question of whether or not the heterogeneity among Italian regions might affect firm performance has been much debated, and numerous historical and cultural causes have influenced this phenomenon. Despite being elements of considerable interest for the assessment of the innovative start-ups, which face a high risk of failure, these aspects received limited attention from prior studies. Indeed, the local context could play an important role in facilitating (or constraining) both entrepreneurship and new business creation (Reynolds et al. 1995; Audretsch 1998, 2003; Piva et al. 2011; Giudici et al. 2017; Nicotra et al. 2018). In addition, several studies suggest that innovation is essential in encouraging the economic development of a region (Audretsch and Lehmann 2005; van Praag and Versloot 2007; Acs et al. 2017). The literature has specifically identified the factors favoring the creation of innovative start-ups and highlighted the impact that the heterogeneity of local conditions can exert on their localization (Colombelli 2016; Capozza et al. 2018; Cavallo et al. 2020; Del Bosco et al. 2021; Del Sarto et al. 2022). However, there are no prior studies which examine whether the regional and local factors foster (or not) the performance of the innovative Italian start-ups. Thus, we hypothesize that:
H2.
Italian start-ups, defined by law as “innovative” (ISPs), achieve higher (or lower) profitability and employee productivity (higher SP-score) when they are in a specific geographical area.
3. Research Design
3.1. Data and Sample
The data are downloaded from the Aida Bureau Van Dijk database, which allows us to search and process economic and financial information on all the firms operating in Italy. The sample of innovative start-ups was identified after considering the entire population of active innovative start-ups with available financial statements. A total sample of 9624 limited liabilities firms is obtained, distinguished on a regional basis according to the standard of registered office (operational headquarters is not available for many companies). Even though the Italian Start-up Act was issued in 2012, the number of start-ups grew significantly from 2016; therefore, we restricted the sample period to the period 2016–2020 given the availability of financial data. The number of innovative start-ups in our final sample represents around 80% of the total population of innovative Italian start-ups set up in the 2016–2020 period. We defined as “non-innovative start-ups” (NISPs), those firms which do not meet the Italian Start-ups Act criteria, thus were not granted the “innovative flag” in AIDA during the period considered for the analysis.
The comparison between innovative start-ups and other non-innovative start-ups reflects the top one hundred company innovative start-ups, and the top one hundred non-innovative start-ups, respectively, by size of production value (at 2020). Considering that the number of NISPs is higher than ISPs, we select the same number of firms for both groups to be able to build the SP-score. We deleted from our sample all firms which reported missing the data needed for our analysis.
There is a certain polarization of innovative start-ups in the services sector. In fact, 78.5% of innovative start-ups conduct their activities in the services sector, while 74.4% operate in the business services sector (specifically, in software production, IT consulting and scientific R&D). Only 17% of innovative start-ups are engaged in manufacturing, and less than 1% in agriculture and construction. The distribution between manufacturing and services is similar for the non-innovative start-ups.
In line with the typical heterogeneity of the Italian productive system, Table 1 highlights marked differences in the location of innovative start-ups among Italian regions. The region where most Italian innovative start-ups are located is Lombardy, with more than a quarter of the total (27%). This is very representative, as Lombardy is the most populous region in Italy (about 16.5% of the Italian population), but the weight of innovative start-ups is more than proportional to the weight of the resident population. Lazio, which ranks second for the number of innovative start-ups and represents an attractive hub due to the presence of the capital, Rome, accounts for only 11.6% of Italian innovative start-ups (less than half that of Lombardy). Some regions, especially in the Center-North, show a high incidence (on average 4–5%) of innovative start-ups in the total number of new limited companies in the region.
3.2. Methods
To construct a composite index, it is necessary to move through a well-structured process. The reliability of a composite index depends significantly on the operations performed to combine and transform the variables according to specific rules, as well as on the individual elementary variables that make up the indicator itself. There are numerous methods for constructing a composite indicator, and each of them follows a well-defined path.
The first step in proceeding to the construction of a composite indicator is to define an appropriate theoretical framework connecting combined subgroups and highlighting the related indicators. There is a need to select and combine the most appropriate and relevant variables for the phenomenon under study, choosing a group of individual indicators (Table 2). To do this, it is necessary to proceed to so-called “normalization” (or “standardization”) to make comparable variables that could be expressed (as is the case in most instances) according to different units of measurement. Therefore, it is necessary to obtain the indicators with the same standards, turning them into pure and dimensionless numbers. The present analysis follows a flow chart statistical approach to choose the best methodology for index derivation (Mazziotta and Pareto 2013). The analysis follows a compensatory method, considering substitutable kinds of indicators. The type of variables aggregation used is the so-called simple and easily understandable mathematical function. The standardization applied allows only ‘relative’ comparisons to be carried out over time, since it is based on the mean and the variance of the indicators at the time of reference. Finally, we assign the same weight to all the variables (OECD 2008; Mazziotta and Pareto 2012, 2013).
The synthetic method applied in this paper involves the use of a Y-data matrix consisting of n rows and m columns, where n represents the kind of companies considered and m identifies the number of variables used at the spatial level. As a result, the dataset can be represented in matrix form. The method follows two main steps: in the first step, the standardized data matrix Z, of equal size to the starting one (size n by m), is constructed; in the second step, after the construction of the standardized data matrix Z, a new matrix, A, is defined, having a size equal to n by 1, in which the vector expresses the summary value for each unit. This step then makes it possible to arrive at the ranking of units according to a rank order of the distribution through the derivation of the matrix Q of equal size.
The composite indicator is obtained following the Mazziotta–Pareto Index (MPI+) (Mazziotta and Pareto 2016). This indicator is constructed on a non-linear function, which is based on the arithmetic mean of the standardized indicators. The elementary variables are transformed into standardized deviations, then into distances from the mean related to the mean square deviation. For the application of this method, we start with the assumption ∀Yij ∈ ℜ, where i represents the distribution of each company along n row and j represents the distribution of each variables along m columns. To proceed with normalization, we go from the matrix of variables Y to the matrix of standardized data Z. The standardized matrix is derived in the following way:
The variables and are derived as follows:
From the matrix Zij, the vector cv is calculated as below:
where the cv is the coefficient of variation. The variables and σ are calculated as follows:
From here, the transformation into standardized deviations allows us to obtain indicators per unit with mean equal to zero and mean square deviation equal to 1. Aggregating the normalized indicators is the last step to obtaining one or more composite indices. At this point, the composite indicator with increasing values can be derived as follows (Mazziotta and Pareto 2016):
It should be considered that the construction of a composite indicator is not exclusively related to rigorous scientific rules, but also to the attitude that the indicator may have in estimating a particular phenomenon (Rosen 1991). In fact, a strand of the literature highlights a role of significant importance for composite indices considered crucial to the comprehension of the trends and specific characteristics of several dynamics; conversely, another strand of the literature is reluctant to use this methodology, recognizing an arbitrariness in the aggregation of variables (Sharpe 2004). However, regardless of legitimate subjective considerations, it is necessary to consider the advantages and disadvantages of composite index construction. For example, the literature has shown that some disadvantages may arise from the possibility of arriving at approximate conclusions if such indicators are constructed in an unclear manner or based on poor conceptual and statistical principles. However, there are many advantages if the index construction is derived in a transparent and robust method. Composite indicators can schematize articulated phenomena and realities, thus helping decisionmakers in a specific field of research or business. This is due to the greater simplicity of comprehending a single indicator compared with the interpretation of a series of indicators, without losing basic information (Saisana and Tarantola 2002; Saisana et al. 2005; OECD 2008).
Table 2 shows the description of the eleven variables used in this paper, considering three reference domains: profitability, productivity, and size (Piotroski 2000; Kuncová et al. 2016; Olawale et al. 2017). For each variable, a series of information is provided: the direction of the indicator indicates the existence of a direct relationship (indicated with a “+” sign) or an inverse relationship with the composite index of performance (Pekuri et al. 2012; Delen et al. 2013; Krekel et al. 2019; Nikhat et al. 2014; Yousaf and Dey 2022). The years available, 2016, 2017, 2018, 2019, 2020, identify the period covered by the analysis. All the variables are derived from the Aida Bureau Van Dijk database.
The individual variables shown in Table 2 were considered for the construction of the composite performance index SP-score. The variable EBITDA, or earnings before interest, taxes, depreciation, and amortization, is a measure of profitability to net income. By removing the non-cash depreciation and amortization expense as well as taxes and debt costs dependent on the capital structure, EBITDA represents cash profit generated by the company’s operations. The EBITDA-to-sales ratio, also known as the EBITDA margin, is a financial metric used to assess a company’s profitability by comparing its gross revenue with its earnings; a higher value of this ratio indicates that the company can produce earnings more efficiently by keeping costs low. The variable ROA refers to a financial ratio that indicates how profitable a company is in relation to its total assets. Return on investment (ROI) is the essential measure of the profit derived from any investment. It is a ratio that compares the gain or loss from an investment relative to its cost. Return on sales (ROS) is a measure of how well a company turns sales into profits. ROE is a measure of a company’s profitability and how efficiently it generates those profits. The higher the ROE, the better a company is at transforming its equity financing into profits. To minimize misspecification problems related to the potential redundancy between the correlated profitability indicators, these indicators are also considered individually. The results are robust. Turnover per employee is an important productivity ratio that measures how much income each employee generates for the company. Value added per employee is a measure of labor productivity. Value added denotes the net output of a sector after adding up all outputs and subtracting intermediate inputs. The staff costs are a way of presenting the cost of labor in a business as a percentage of turnover. The production value measures the amount produced by the unit, based on sales, including changes in stocks. Finally, the revenue from sales considers only the goods and services that companies have sold.
The method of construction of the individual variables is clearly described in the methodological note of the Aida database, to which reference is made for further analysis. The results of the SP-score shown in the next section, calculated by the MPI+ method (Equation (5)), are confirmed to be robust, as the main trends are confirmed in principle even with the implementation of other statistical methods to calculate composition indices.
4. Results
Once the methodological aspect has been defined, it is possible to proceed with the derivation of SP-score both by comparing innovative start-ups with respect to other non-innovative companies and by distinguishing different trends among Italian regions. Table 3 compares the performance of the main financial statement ratios for companies established in the last 5 years, distinguishing between innovative start-ups and other non-innovative start-ups. This comparison considers the top one hundred company innovative start-ups, and the top one hundred non-innovative start-ups, respectively, by size of production value (at 2020).
The data show that the innovative start-ups (ISPs) have performed better over the period compared to the non-innovative start-ups (NISPs), especially in productivity and size growth. However, with a few exceptions (ROA, ROS), profitability also performs better in innovative start-ups than in other companies. This can be inferred from the trend of EBITDA, which shows the profitability of the company focusing on core operations. EBITDA/sales, which can measure how much operating income the company is able to generate per unit of sales, is also significantly higher in innovative start-ups than in other companies. The ROI and ROE profitability indicators are significantly higher than those of other firms, and the absolute change over the period considered is positive. The growth in productivity indicators shows that the business model, flexibility and positioning in innovative and technologically advanced markets typical of innovative start-ups, turns into higher levels of productivity (Pianta and Vaona 2007; Arvanitis 2008; Masso and Vahter 2012; Preenen et al. 2015) with higher growth averages than the non-innovative companies. The SP-score, evaluating in total the 11 variables considered in the paper, demonstrates a significantly higher score of innovative start-ups (105.8) than the non-innovative start-ups (92.7).
A composite index is a statistical instrument that brings together many different elements or indexes to create a picture of overall trend performance. Therefore, the kind of aggregation method chosen could affect the results. However, the result of this study is robust, as it is confirmed by the implementation of other comparison methods. Indeed, in addition to the method adopted by this study MPI+, Table 4 reports the results with the application of four other comparison methods to calculate SP-score as follows: MPI- (Mazziotta–Pareto Index negative), M1VZ (the method of the average of standardized values), INRE (the relative index method), GRAD (the ranking method) (OECD 2008). In all the methods used, the performance of ISPs is greater than NISPs. In the ranking method GRAD, the results must be analyzed in reverse, because of the specific characteristics of the method. Therefore, even in this case, innovative start-ups perform better than other firms.
A synthetic comparison tool is given by the cograduation matrix of the rankings obtained with the different methods (Table 5). The cograduation matrix confirms that the performance of innovative start-ups remains higher using all the aggregation methods of the composition indices. Hence, the cograduation matrix shows that the statistical units under analysis have the same order in the rankings obtained with the different comparison methods.
The specific characteristics and several advantages addressed in innovative start-ups lead to greater performance than the non-innovative start-ups. This confirms the efficacy of the government policy in supporting these firms and fostering entrepreneurship.
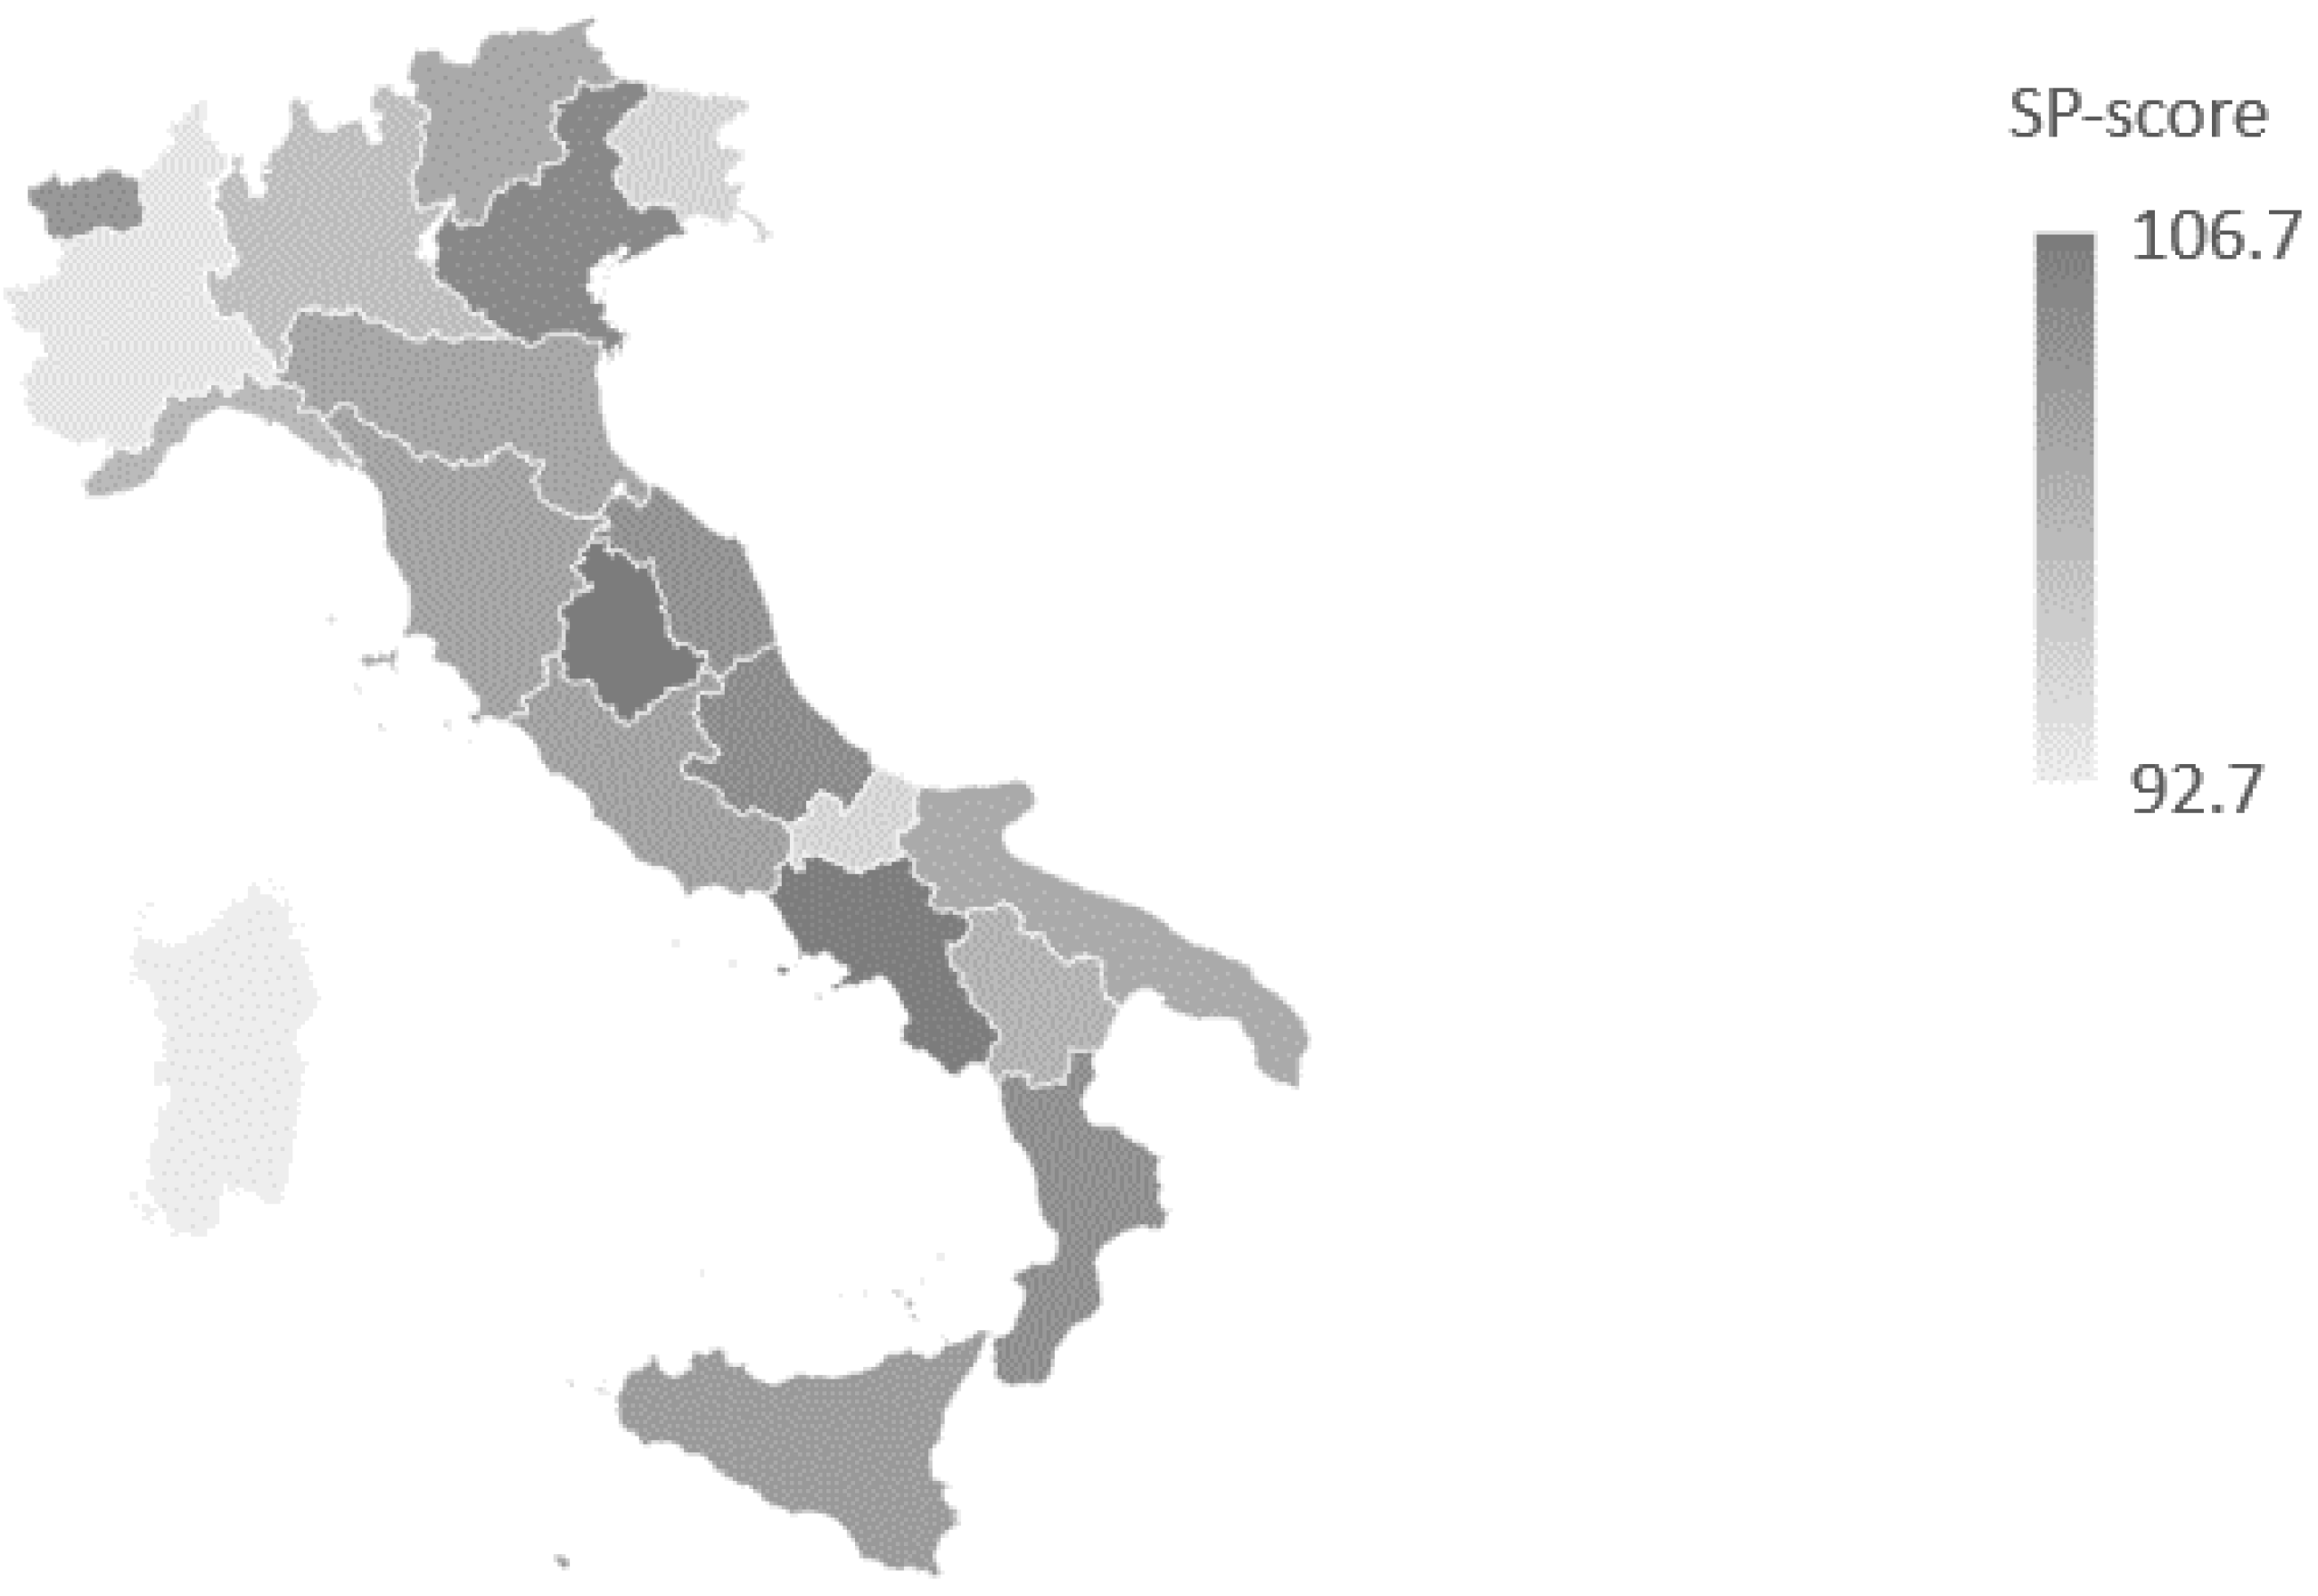
To assess whether the start-ups’ performance is related to the different geographical areas where the firms are located, we perform a second level of analysis considering the sample of 9624 innovative start-ups. The derived SP-score, although with some differences, shows some homogeneity among Italian regions. This finding is particularly relevant because the Italian regions have always been characterized by specificities that have historically marked their economic and social evolution. Traditionally, the issue of Italian territorial heterogeneity has been addressed by emphasizing the differences between North and South, considering different territorial identity and unbalanced industrial strength. For example, relevant differences can be found in the trend of Gross Domestic Product, the level of household wealth, the labor market, and the different productive and entrepreneurial structure (Deleidi et al. 2021).
Along these lines, Table 6 shows that the top three regions with a higher SP-score are the three main areas of Italy. Specifically, Umbria for Central Italy, Campania for Southern Italy, and Veneto for Northern Italy. Similarly, some examples of the main areas (Molise, Piedmont, Sardinia) are ranked in the last places. The gap between the most performing and the least performing regions stands at about fourteen points.
Following the ISTAT classification (Italian National Institute of Statistics), the Italian regions can be distinguished into Center-North (12 regions) and South regions (8 regions). The Center-North regions are Emilia-Romagna, Friuli-Venezia Giulia, Lazio, Liguria, Lombardy, Marche, Piedmont, Tuscany, Trentino, Umbria, Valle d’Aosta and Veneto. The others represent the South regions. There are not clear differences between the Center-North and South regions when the performance of innovative start-ups is assessed. The SP-score does not differ among the main areas, giving 100.5 for the Center-North and 100.7 for the South regions.
Figure 1 shows graphically the homogeneity described above among Italian regions. The regions indicated with a darker color are those with a higher SP-score of innovative start-ups. No obvious spatial concentrations of high performance can be found. Innovative start-ups have a higher or lower index regardless of their location.
5. Discussion
The main results show that Italian start-ups, defined by law as “innovative” (ISPs), achieve higher profitability and employee productivity (higher SP-score) compared to firms which do not satisfy the law requirements (NISPs) (Hypothesis 1). This confirms a positive assessment of the Italian industrial policy which favored their creation, reinforcing earlier findings by Finaldi et al. (2016), Menon et al. (2018) and Biancalani et al. (2022). These authors found that innovative Italian start-ups are more successful in several fields. The opportunity for obtaining better performance can operate as a driving force for the development of an entrepreneurial culture, identifying the bridges between human capital and the local production system (Calcagnini et al. 2016; Cavallo et al. 2020; Del Bosco et al. 2021; Onesti 2021). University spin-offs in the form of innovative start-ups are a good example of this process (Jain et al. 2009; Sciarelli et al. 2021).
A greater innovative start-up performance is associated with strong employee productivity, whereas the latter could be related to a high degree of education of the human resources employed in those firms. Employees’ knowledge, skills and education are crucial resources and fundamental drivers in increasing firm productivity. The relationship between human capital and firm productivity is well recognized in the literature (Ballot et al. 2001; Almeida and Carneiro 2009; Backman 2013). Other strategic factors that leverage firm performance are the tax reductions, general benefits (Wu et al. 2012) and the promotion of the higher level of innovation (Arvanitis 2008; Preenen et al. 2015; Woltjer et al. 2021), which are also included in the Italian Start-up Act. The latter aspects are strongly connected to a greater profitability and firm growth (Bottazzi et al. 2008; Hahn et al. 2018). We propose a composite index, the SP-score, which offers a synthetic measure able to capture all these dimensions using a single indicator.
A large amount of literature investigates the utility of financial statement analysis in creating composite indicators (Altman 1968; Piotroski 2000; Mohanram 2005), calling for additional methods to measure new phenomena. The creation of the composite performance index SP-score tailored for innovative start-ups follows this approach, identifying a clear assessment of multiple elements of firm performance. The analysis does not directly consider the possible effects of COVID-19, given the lack of the availability of the data for most of the firms included in our sample. Indeed, the analysis takes into consideration the period from 2016 to 2020. The year 2020 was certainly an extraordinary year due to the COVID-19 outbreak. However, the results of the analysis do not appear to be influenced by the COVID-19 period. Hence, removing the year 2020 from the analysis, the trends appear very similar and robust. From this, we can conclude that COVID-19 has not influenced the innovation patterns of start-ups for the considered period in our paper.
In addition, a certain homogeneity of performance among Italian regions is reported, which undermines the typical dualistic view between Northern and Southern regions (Hypothesis 2). The Italian regions are characterized by undoubted specificities that have always characterized their economic and social evolution. In fact, the theme of heterogeneity among the Italian regions has remote origins, and numerous historical and cultural causes have influenced this phenomenon. There have been many studies that, even recently, have it analyzed the various aspects (Filippetti et al. 2019; Asso 2021; Deleidi et al. 2021). Traditionally, the question has been addressed by emphasizing above all the differences between North and South, with the identification of a peculiar dualistic development path which has aroused cross-cutting interest. In this regard, evident specificities inherent in the Italian modernization process have emerged which have suggested the birth of different interpretative models about the different territorial identities, the differences in social well-being, and the unbalanced industrial strength. Despite the effect of local factors seeming to be crucial in the creation of innovative start-ups (Audretsch and Lehmann 2005; van Praag and Versloot 2007; Colombelli 2016; Acs et al. 2017; Cavallo et al. 2020; Del Bosco et al. 2021), we can conclude that the specific regional context does not seem to influence the performance of innovative start-ups. Innovation is strongly interconnected with economic growth and firm competitiveness (Awang et al. 2019; Kraus et al. 2021).
The evidence obtained, therefore, affects the traditional regional economic–social context founded on persistent disparities between regions by outlining similar performance among them. From this, useful insights can emerge to implement management strategies, having the objective of supporting choice in business location, an element that significantly affects the economic success of start-up companies. Indeed, the concerns and risks of unfavorable locations are often extremely high. Location is often not a flexible and easily altered choice. However, an unsuitable location could lead to negative consequences, with the costs of any relocation having a non-marginal impact on the firm’s income statements.
In this context of deep heterogeneity, the performance of innovative start-ups is an exception. The push on innovation, on processes to boost highly skilled youth entrepreneurship, and on new growth drivers, seems to be less affected by specific strengths and weaknesses related to regional peculiarities. In fact, although most innovative start-ups are in Northern Italy, the multitude of enabling factors for innovation and new entrepreneurship, so-called ‘Industry 4.0’, play a positive and increasing role, even in those contexts where there is a smaller number of innovative start-ups and, at the same time, the social–entrepreneurial structure is historically less dynamic. This framework provides useful insights into the trends among innovative start-ups concerning fixing suitable management strategies to choose the optimal location, which is one of the organizational elements that can significantly affect the economic convenience of establishing a company. In fact, location can be considered a crucial factor in firms’ successes, and is one of the most important decisions that the economic entity must make at the establishment process. The results of the present study suggest that the specific factors of innovative start-ups mentioned above are not linked to the localization aspects when analyzing the performance index SP-score, helping to overcome the typical territorial inequalities in Italy.
6. Conclusions
In this paper, a quantitative analysis was conducted to derive a composite index SP-score by comparing the performance of innovative start-ups with the performance of non-innovative start-ups in Italy. Hence, an analysis of the innovative start-ups’ performance in the different Italian regions was performed. Three main domains capable of influencing companies’ performance were considered: profitability, productivity, and size for eleven financial statement indicators. After a description of the current situation of innovative start-ups in Italy and a description of the sample considered in this paper, the analysis focused on the construction of a composite performance indicator SP-score. This made it possible to aggregate a multitude of variables to explain a typically multidimensional phenomenon under a single indicator.
The derivation of the SP-score composite indicator suggests two main considerations. First, the Italian start-ups defined by law as “innovative” achieve higher profitability and employee productivity compared to firms which do not satisfy the legal requirements. Second, the lack of heterogeneity in innovative start-ups’ performance among Italian regions outlined by the results of this paper, while it can be traced back to the particular characteristics of the new business set-ups and entrepreneurship choices, could also be explained by the predominantly tertiary sectors in which these companies are engaged. Indeed, the process of digitalization of production and tertiary activities appears to be one of the main ongoing transformations in the technological paradigms of economic and social life. The growth of digital tools, the power of communication networks, and the Internet of Things are increasingly pushing towards the dissolution of traditional economic and territorial paradigms by changing the productive organization and providing an opportunity to redistribute benefits among individuals, enterprises, and territorial divisions.
The development of start-ups is a driving force in the local and regional economy. Innovation start-ups’ capability to perform is a crucial factor for growing the less developed regions and improving financial performance. Therefore, it should be in the interests of regional policymakers to take action for their creation and financial support. Innovative start-ups are crucial sources of innovation and local development. Their creation and development contribute to increasing income levels and quality of life, and strengthening entrepreneurship in the region. They can also become the starting point for more vigorous local growth by attracting new investors and generating new jobs and skills. The better performance of innovative start-ups compared to other companies allows for a positive evaluation of the active policy of promoting entrepreneurship and innovation by policymakers. Moreover, this could also have implications for the granting of bank loans and the attraction of venture capital investors.
This study has several limitations. First, the construction of a synthetic index generally contains a minimum of arbitrary components. The analysis of the present contribution is derived according to a detailed methodology, but we cannot exclude the possibility that different methodological and aggregation choices may lead to different results. Another limitation is that we analyzed a sample of companies for the comparison, which could limit the generalizability of the results. Further research could include a larger sample considering the specific regional comparisons and distribution according to the industry classification. Moreover, we cannot exclude the effect of organizational changes due to COVID-19 in the 2020 and 2021 periods, which could generate changes for the following years and produce results still applicable for future patterns. Future research could analyze the persistence of these effects in the years following COVID-19 (for example, in the period 2021–2025). Despite these limitations, the results of this study have shown that innovative start-ups and their performances are worth investigating. These appear to be a good vehicle for innovative entrepreneurship and development. Therefore, research on these companies should continue. Furthermore, future research could conduct an extension of the present study, considering the availability of more up-to-date or more detailed data, including proposing the construction of a composite performance indicator SP-score for start-ups in other nations as well (e.g., at the European Union level) to facilitate useful comparisons. Indeed, it would be interesting to evaluate the policy design of Italian innovative start-ups against other international similar programs aimed at innovative start-up companies, and to compare the impacts of different policy strategies.
Author Contributions
Conceptualization, G.O., E.M. and R.P.; methodology, G.O. and E.M.; formal analysis, G.O. and E.M.; investigation, G.O., E.M.; resources, G.O., E.M. and R.P.; data curation, G.O.; writing—original draft preparation, G.O., E.M. and R.P.; writing—review and editing, G.O., E.M. and R.P.; visualization, G.O., E.M. and R.P.; supervision, G.O. and R.P.; project administration, G.O.; funding acquisition, G.O. and R.P. All authors have read and agreed to the published version of the manuscript.
Funding
This research was funded by European Social Fund, grant number 53-I-14750-1 (Gianni Onesti). Financial support from the Fundação para a Ciência e Tecnologia (through project UIDB/00731/2020) is gratefully acknowledged (Eleonora Monaco).
Institutional Review Board Statement
Not applicable.
Informed Consent Statement
Not applicable.
Data Availability Statement
Not applicable.
Conflicts of Interest
The authors declare no conflict of interest.
References
- Abarbanell, Jeffrey S., and Brian J. Bushee. 1997. Fundamental Analysis, Future Earnings, and Stock Prices. Journal of Accounting Research 35: 1–24. [Google Scholar] [CrossRef]
- Acs, Zoltan J., Erik Stam, David B. Audretsch, and Allan O’Connor. 2017. The lineages of the entrepreneurial ecosystem approach. Small Business Economics 49: 1–10. [Google Scholar] [CrossRef]
- Almeida, Rita, and Pedro Carneiro. 2009. The return to firm investments in human capital. Labour Economics 16: 97–106. [Google Scholar] [CrossRef] [Green Version]
- Altman, Edward I. 1968. Financial Ratios, Discriminant Analysis and the Prediction of Corporate Bankruptcy. The Journal of Finance 23: 589–609. [Google Scholar] [CrossRef]
- Arvanitis, Spyros. 2008. Innovation and Labour Productivity in the Swiss Manufacturing Sector: An Analysis Based on Firm Panel Data. In Determinants of Innovative Behaviour. Edited by Cees Van Beers, Alfred Kleinknecht, Roland Ortt and Robert Verburg. London: Palgrave Macmillan. [Google Scholar] [CrossRef] [Green Version]
- Asso, Pier Francesco. 2021. New perspectives on old inequalities: Italy’s north–south divide. Territory, Politics, Governance 9: 346–64. [Google Scholar] [CrossRef]
- Audretsch, David B. 1998. Agglomeration and the location of innovative activity. Oxford Review of Economic Policy 14: 18–29. [Google Scholar] [CrossRef]
- Audretsch, David B. 2003. Entrepreneurship: A Survey of the Literature. Enterprise Papers, 14. Luxembourg: Enterprise Directorate-general European Commission. [Google Scholar]
- Audretsch, David B., and Erik Lehmann. 2005. Does the knowledge spillover theory of entrepreneurship hold for regions? Research Policy 34: 1191–202. [Google Scholar] [CrossRef] [Green Version]
- Audretsch, David B., Max C. Keilbach, and Erik Lehmann. 2006. Entrepreneurship and Economic Growth. Oxford: Oxford University Press. [Google Scholar]
- Audretsch, David B., Alessandra Colombelli, Luca Grilli, Tommaso Minola, and Einar Rasmussen. 2020. Innovative start-ups and policy initiatives. Research Policy 49: 104027. [Google Scholar] [CrossRef]
- Autio, Erkko, Martin Kenney, Philippe Mustar, Donald Siegel, and Mike Wright. 2014. Entrepreneurial innovation: The importance of context. Research Policy 43: 1097–108. [Google Scholar] [CrossRef]
- Awang, Abd H., Noorsafiza Mohd Sapie, Mohd Y. Hussain, Suraiya Ishak, and Rozman M. Yusof. 2019. Nurturing innovative employees: Effects of organisational learning and work environment. Economic Research-Ekonomska Istraživanja 32: 1152–68. [Google Scholar] [CrossRef]
- Backman, Mikaela. 2013. Human capital in firms and regions: Impact on firm productivity. Papers in Regional Science 93: 557–75. [Google Scholar] [CrossRef]
- Ballot, Gérard, Fathi Fakhfakh, and Erol Taymaz. 2001. Firms’ human capital, R&D and performance: A study on French and Swedish firms. Labour Economics 8: 443–62. [Google Scholar]
- Baumol, William J., and Robert J. Strom. 2007. Entrepreneurship and economic growth. Strategic Entrepreneurship Journal 1: 233–37. [Google Scholar] [CrossRef] [Green Version]
- Beaver, William H. 1966. Financial Ratios as Predictors of Failure. Journal of Accounting Research 4: 71–111. [Google Scholar] [CrossRef]
- Beck, Thorsten, and Asli Demirguc-Kunt. 2006. Small and medium-size enterprises: Access to finance as a growth constraint. Journal of Banking & Finance 30: 2931–43. [Google Scholar]
- Beneish, Messod D. 1997. Detecting GAAP violation: Implications for assessing earnings management among firms with extreme financial performance. Journal of Accounting and Public Policy 16: 271–309. [Google Scholar] [CrossRef]
- Bernard, Victor L., and Jacob K. Thomas. 1989. Post Earnings Announcement Drift: Delayed Price Response or Risk Premium? Journal of Accounting Research 27: 1–36. [Google Scholar] [CrossRef]
- Biancalani, Francesco, Dirk Czarnitzki, and Massimo Riccaboni. 2022. The Italian Start Up Act: A microeconometric program evaluation. Small Business Economics 58: 1699–720. [Google Scholar] [CrossRef]
- Bottazzi, Giulio, Anglo Secchi, and Federico Tamagni. 2008. Productivity, profitability and financial performance. Industrial and Corporate Change 17: 711–51. [Google Scholar] [CrossRef]
- Brand, Donald A., Michaela Saisana, Losa A. Rynn, Fulvia Pennoni, and Albert B. Lowenfels. 2007. Comparative analysis of alcohol control policies in 30 countries. PLoS Medicine 151: 752–59. [Google Scholar] [CrossRef] [Green Version]
- Breschi, Stefano, Julie C. Lassebie, and Carlo A. Menon. 2018. Portrait of Innovative Start-Ups across Countries. OECD Science, Technology and Industry Working Papers, No. 2018/02. Paris: OECD Publishing. [Google Scholar]
- Calcagnini, Giorgio, Ilario Favaretto, Germana Giombini, Francesco Perugini, and Rosalba Rombaldoni. 2016. The role of universities in the location of innovative start-ups. The Journal of Technology Transfer 41: 670–93. [Google Scholar] [CrossRef]
- Capozza, Claudia, Sergio Salomone, and Ernesto Somma. 2018. Local industrial structure, agglomeration economies and the creation of innovative start-ups: Evidence from the Italian case. Entrepreneurship and Regional Development 30: 749–75. [Google Scholar] [CrossRef]
- Cavallo, Angelo, Antonio Ghezzi, Alessandra Colombelli, and Gian Luca Casali. 2020. Agglomeration dynamics of innovative start-ups in Italy beyond the industrial district era. International Entrepreneurship and Management Journal 16: 1–24. [Google Scholar] [CrossRef]
- Christiensen, Clayton M. 2003. The Innovator’s Dilemma; When New Technologies Cause Great Firms to Fail. Boston: Harvard Business School Press. [Google Scholar]
- Colombelli, Alessandra. 2016. The impact of local knowledge bases on the creation of innovative start-ups in Italy. Small Business Economics 47: 383–96. [Google Scholar] [CrossRef]
- Damodaran, Aswath. 2009. Valuing Young Start-Up and Growth Companies: Estimation Issues and Valuation Challenges. New York: Stern School of Business New York University. [Google Scholar]
- Del Bosco, Barbara, Alice Mazzucchelli, Roberto Chierici, and Angelo Di Gregorio. 2021. Innovative start-up creation: The effect of local factors and demographic characteristics of entrepreneurs. International Entrepreneurship and Management Journal 17: 145–64. [Google Scholar] [CrossRef]
- Del Sarto, Nicola, Claudio Cruz Cazares, and Alberto Di Minin. 2022. Start-up accelerators as an open environment: The impact on start-ups’ innovative performance. Technovation 113: 102425. [Google Scholar] [CrossRef]
- Deleidi, Matteo, Walter Paternesi Meloni, Luigi Salvati, and Francesca Tosi. 2021. Output, investment and productivity: The Italian North–South regional divide from a Kaldor–Verdoorn approach. Regional Studies 55: 1376–87. [Google Scholar] [CrossRef]
- Delen, Dursun, Cemil Kuzey, and Ali Uyar. 2013. Measuring firm performance using financial ratios: A decision tree approach. Expert Systems with Applications 40: 3970–83. [Google Scholar] [CrossRef]
- Fairlie, Robert W., Arnobio Morelix, E. J. Reedy, and Joshua Russel-Fritch. 2015. The Kauffman Index 2015: Start-up Activity, National Trends. Available online: https://ssrn.com/abstract=2613479 (accessed on 3 November 2022).
- Filippetti, Andrea, Frederick Guy, and Simona Iammarino. 2019. Regional disparities in the effect of training on employment. Regional Studies 53: 217–30. [Google Scholar] [CrossRef]
- Finaldi, R. Paolo, Silvia Magri, and Cristiana Rampazzi. 2016. Innovative start-ups in Italy: Their special features and the effect of the 2012 law. Politica Economica 32: 297–330. [Google Scholar] [CrossRef] [Green Version]
- Ghio, Niccolò, Massimiliano Guerini, and Cristina Rossi-Lamastra. 2016. University knowledge and the creation of innovative start-ups: An analysis of the Italian case. Small Business Economics 47: 293–311. [Google Scholar] [CrossRef]
- Giraudo, Emanuele, Giancarlo Giudici, and Luca Grilli. 2019. Entrepreneurship policy and the financing of young innovative companies: Evidence from the Italian Start-up Act. Research Policy 48: 103801. [Google Scholar] [CrossRef]
- Giudici, Giancarlo, Massimiliano Guerini, and Cristina Rossi-Lamastra. 2017. The creation of cleantech start-ups at the local level: The role of knowledge availability and environmental awareness. Small Business Economics 52: 815–30. [Google Scholar] [CrossRef] [Green Version]
- Guerzoni, Marco, Consuelo R. Nava, and Massimiliano Nuccio. 2021. Start-ups survival through a crisis: Combining machine learning with econometrics to measure innovation. Economics of Innovation and New Technology 30: 468–93. [Google Scholar] [CrossRef]
- Hahn, Davide, Tommaso Minola, and Kimberly A. Eddleston. 2018. How do Scientists Contribute to the Performance of Innovative Start-ups? An Imprinting Perspective on Open Innovation. Journal of management Studies 56: 895–928. [Google Scholar] [CrossRef]
- Hyytinen, Ari, Mika Pajarinen, and Petri Rouvinen. 2015. Does innovativeness reduce startup survival rates? Journal of Business Venturing 30: 564–81. [Google Scholar] [CrossRef] [Green Version]
- Jain, Sanjay, Gerard George, and Mark Maltarich. 2009. Academics or entrepreneurs? Investigating role identity modification of university scientists involved in commercialization activity. Research Policy 38: 922–35. [Google Scholar] [CrossRef]
- Kraus, Sascha, William McDowell, Domingo E. Ribeiro-Soriano, and Maria Rodríguez-García. 2021. The role of innovation and knowledge for entrepreneurship and regional development. Entrepreneurship and Regional Development 33: 175–84. [Google Scholar] [CrossRef]
- Krekel, Christian, George Ward, and Jan-Emmanuel De Neve. 2019. Employee Wellbeing, Productivity, and Firm Performance. Saïd Business School WP 2019-04. Available online: https://ssrn.com/abstract=3356581 (accessed on 3 November 2022).
- Kuncová, Martina, Veronika Hedija, and Roman Fiala. 2016. Firm Size as a Determinant of Firm Performance: The Case of Swine Raising. AGRIS On-Line Papers in Economics and Informatics 8: 77–89. [Google Scholar] [CrossRef] [Green Version]
- Lev, Baruch, and Ramu S. Thiagarajan. 1993. Fundamental Information Analysis. Journal of Accounting Research 31: 190–214. [Google Scholar] [CrossRef]
- Masso, Jaan, and Priit Vahter. 2012. The link between innovation and productivity in Estonia’s services sector. The Service Industries Journal 32: 2527–41. [Google Scholar] [CrossRef]
- Mazziotta, Matteo, and Adriano Pareto. 2012. A Non-compensatory Approach for the Measurement of the Quality of Life. In Quality of Life in Italy: Research and Reflections. Edited by Filomena Maggino and Giampaolo Nuvolati. New York: Springer. [Google Scholar]
- Mazziotta, Matteo, and Adriano Pareto. 2013. Methods for constructing composite indices: One for all or all for one? Rivista Italiana di Economia Demografia e Statistica LXVII: 67–80. [Google Scholar]
- Mazziotta, Matteo, and Adriano Pareto. 2016. On a generalized non-compensatory composite index for measuring socio-economic phenomena. Social Indicators Research 127: 983–1003. [Google Scholar] [CrossRef]
- Menon, Carlo, Timothy DeStefano, Francesco Manaresi, Giovanni Soggia, and Pietro Santoleri. 2018. The Evaluation of the Italian “Start-Up Act”. OECD Science, Technology and Industry Policy Papers, 54. Paris: OECD Publishing. [Google Scholar] [CrossRef]
- Mohanram, Partha S. 2005. Separating Winners from Losers among Low Book-to-Market Stocks using Financial Statement Analysis. Review of Accounting Studies 10: 133–70. [Google Scholar] [CrossRef]
- Nicotra, Melita, Marco Romano, Manilo Del Giudice, and Carmela E. Schillaci. 2018. The causal relation between entrepreneurial ecosystem and productive entrepreneurship: A measurement framework. The Journal of Technology Transfer 43: 640–73. [Google Scholar] [CrossRef]
- Nikhat, Afshan, Chakrabarti Diganta, and M. S. Balaji. 2014. Exploring the Relevance of Employee Productivity-Linked Firm Performance Measures: An Empirical Study in India. Journal of Transnational Management 19: 24–37. [Google Scholar] [CrossRef]
- Norrman, Charlotte, and Magnus Klofsten. 2009. An entrepreneurship policy programme: Implications and expectations. The International Journal of Entrepreneurship and Innovation 10: 33–42. [Google Scholar] [CrossRef]
- OECD, Joint Research Centre. 2008. Handbook on Constructing Composite Indicators: Methodology and User Guide. Ispra: OECD Publishing. [Google Scholar]
- Olawale, Luqman S., Bamidele M. Ilo, and Fatai K. Lawal. 2017. The effect of firm size on performance of firms in Nigeria. AESTIMATIO, The IEB International Journal of Finance 15: 68–87. [Google Scholar] [CrossRef]
- Onesti, Gianni. 2021. Il ruolo degli aspetti comportamentali e culturali del controllo di gestione: Un’analisi comparativa a livello internazionale. Management Control 1: 33–56. [Google Scholar] [CrossRef]
- Ou, Ja, and Sh Penman. 1989. Accounting Measures, Price-Earning Ratio, and the Information Content of Security Prices. Journal of Accounting Research 27: 111–43. [Google Scholar] [CrossRef]
- Palumbo, Riccardo, and Pierangelo Rosati. 2022. Exploring the Relationship between New Bank Debt and Earnings Management: Evidence from Italian SMEs. Economies 10: 124. [Google Scholar] [CrossRef]
- Pekuri, Aki, Harri Haapasalo, and Maila Herrala. 2012. Productivity and Performance Management—Managerial Practices in the Construction Industry. International Journal of Performance Measurement 1: 39–58. [Google Scholar]
- Pianta, Mario, and Andrea Vaona. 2007. Innovation and Productivity in European Industries. Economics of Innovation and New Technology 16: 485–99. [Google Scholar] [CrossRef] [Green Version]
- Piotroski, Joseph D. 2000. Value Investing: The Use of Historical Financial Statement Information to Separate Winners from Losers. Journal of Accounting Research 38: 1–41. [Google Scholar] [CrossRef] [Green Version]
- Piva, Evila, Luca Grilli, and Cristina Rossi-Lamastra. 2011. The creation of high-tech entrepreneurial ventures at the local level: The role of local competences and communication infrastructures. Industry and Innovation 18: 563–80. [Google Scholar] [CrossRef]
- Preenen, Paul T. Y., Robert Vergeer, Karolus Kraan, and Steven Dhondt. 2015. Labour productivity and innovation performance: The importance of internal labour flexibility practices. Economic and Industrial Democracy 38: 271–93. [Google Scholar] [CrossRef]
- Reynolds, Paul D., Brenda Miller, and Wilbur R. Maki. 1995. Explaining regional variation in business births and deaths: U.S. 1976–88. Small Business Economics 7: 389–407. [Google Scholar] [CrossRef]
- Rosen, Robert. 1991. Life Itself: A Comprehensive Inquiry into Nature, Origin, and Fabrication of Life. New York: Columbia University Press. [Google Scholar]
- Saisana, Michaela, and Stefano Tarantola. 2002. State-of-the-Art Report on Current Methodologies and Practices for Composite Indicator Development. Ispra: European Commission-JRC. [Google Scholar]
- Saisana, Michaela, Stefano Tarantola, and Andrea Saltelli. 2005. Uncertainty and sensitivity techniques as tools for the analysis and validation of composite indicators. Journal of the Royal Statistical Society 168: 307–23. [Google Scholar] [CrossRef]
- Sciarelli, Mauro, Giovanni Catello Landi, Lorenzo Turriziani, and Mario Tani. 2021. Academic entrepreneurship: Founding and governance determinants in university spin off ventures. The Journal of Technology Transfer 46: 1083–107. [Google Scholar] [CrossRef]
- Sharpe, Andrew. 2004. Literature Review of Frameworks for Macro-indicators. CSLS Research Report 2004-03. Ottowa: Centre for the Study of Living Standards. [Google Scholar]
- Skawińska, Eulalia, and Romuald I. Zalewski. 2020. Success Factors of Start-ups in the EU—A Comparative Study. Sustainability 12: 8200. [Google Scholar] [CrossRef]
- Sloan, Richard G. 1996. Do Stock Prices Fully Reflect Information in Accruals and Cash Flows About Future Earnings? The Accounting Review 71: 289–316. [Google Scholar]
- Soliman, Mark T. 2004. Using Industry-Adjusted Dupont Analysis to Predict Future Profitability. Available online: https://ssrn.com/abstract=456700 (accessed on 5 November 2022).
- Thiel, Peter, and Blake Masters. 2014. Zero to One: Notes on Start-Up or How to Build the Future. New York: Crown Publishing Group. [Google Scholar]
- van Praag, Mirjam C., and Peter H. Versloot. 2007. What is the value of entrepreneurship? A review of recent research. Small Business Economics 29: 351–82. [Google Scholar] [CrossRef] [Green Version]
- Woltjer, Geert, Michiel van Galen, and Katja Logatcheva. 2021. Industrial Innovation, Labour Productivity, Sales and Employment. International Journal of the Economics of Business 28: 89–113. [Google Scholar] [CrossRef]
- Wu, Wenfeng, Chongfeng Wu, Chunyang Zhou, and Jun Wu. 2012. Political connections, tax benefits and firm performance: Evidence from China. Journal of Accounting and Public Policy 31: 277–300. [Google Scholar] [CrossRef]
- Yousaf, Muhammad, and Sandeep K. Dey. 2022. Best proxy to determine firm performance using financial ratios: A CHAID approach. Review of Economic Perspectives 22: 219–39. [Google Scholar] [CrossRef]
Figure 1.
SP-score—Innovative start-ups. Map of Italian regions.


Table 1.
Descriptive analysis of Italian Innovative Start-ups: regional distribution and density, 2020.
Table 1.
Descriptive analysis of Italian Innovative Start-ups: regional distribution and density, 2020.
| Regions | Population of Region/ Total Italian Population (%) | Regional Innovative Start-Ups/ Total Italian Innovative Start-Ups (%) | Innovative Start-Ups/ Total New Limited Firms (%) |
|---|---|---|---|
| Abruzzo | 2.2 | 1.8 | 2.4 |
| Apulia | 6.7 | 4.2 | 2.1 |
| Basilicata | 0.9 | 0.9 | 3.4 |
| Calabria | 3.2 | 2.1 | 2.7 |
| Campania | 9.6 | 8.8 | 2.4 |
| Emilia-Romagna | 7.3 | 7.8 | 3.6 |
| Friuli–Venezia Giulia | 2.0 | 2.1 | 5.3 |
| Lazio | 9.7 | 11.6 | 2.6 |
| Liguria | 2.6 | 1.6 | 2.7 |
| Lombardy | 16.5 | 27.0 | 4.6 |
| Marche | 2.5 | 2.9 | 3.8 |
| Molise | 0.5 | 0.6 | 3.7 |
| Piedmont | 7.3 | 5.5 | 3.6 |
| Sardinia | 2.7 | 1.3 | 1.9 |
| Sicily | 8.4 | 4.6 | 2.3 |
| Tuscany | 6.2 | 4.5 | 2.4 |
| Trentino | 1.7 | 2.4 | 5.4 |
| Umbria | 1.5 | 1.6 | 3.9 |
| Valle d’Aosta | 0.2 | 0.2 | 4.9 |
| Veneto | 8.1 | 8.2 | 3.5 |
Source: Elaborations on ISTAT and InfoCamere data.
Table 2.
List of variables used to derive the composite performance index (SP-score) for the period 2016–2020.
Table 2.
List of variables used to derive the composite performance index (SP-score) for the period 2016–2020.
| Domain | Variable | Direction | Variable Construction |
|---|---|---|---|
| Profitability | EBITDA | + | Operation margin and depreciation, amortization and writedowns |
| EBITDA/Sales | + | EBITDA/Revenues from sales and services and other revenues (%) | |
| Return on asset (ROA) | + | Operating margin/total assets (%) | |
| Return on investment (ROI) | + | Operating margin/Shareholder’s funds and Bonds, Due to banks, Due to other lenders, Due to shareholders for loans (%) | |
| Return on sales (ROS) | + | Operating margin/Revenues | |
| Return on equity (ROE) | + | Profit (loss)/Shareholder’s funds (%) | |
| Productivity | Turnover per employee | + | Revenues/number of employees (%) |
| Value added per employee | + | Value Added/number of employees (%) | |
| Turnover/Staff costs | + | Revenues/Compensation of employees (%) | |
| Size | Production value | + | The amount actually produced by the unit, based on sales, including changes in stocks and the resale of goods and services. |
| Revenues from sales of goods and services | + | Sales revenue is accrued income received by a company from its sales of goods or provision of services |
Source: author’s elaboration on Aida Bureau Van Dijk data.
Table 3.
Analysis of performance realized by the Innovative Italian start-ups (ISPs) and the Non-Innovative Start-ups (NISPs). 2016–2020.
Table 3.
Analysis of performance realized by the Innovative Italian start-ups (ISPs) and the Non-Innovative Start-ups (NISPs). 2016–2020.
| Variables | Description | Innovative Start-Ups | Non-Innovative Start-Ups |
|---|---|---|---|
| EBITDA | Var % | 2366.3 | 352.8 |
| EBITDA/Sales | Absolute variation | 83.8 | 6.3 |
| Return on asset (ROA) | Absolute variation | 1.4 | 17.7 |
| Return on investment (ROI) | Absolute variation | 7.4 | 4.2 |
| Return on sales (ROS) | Absolute variation | −6.0 | −3.0 |
| Return on equity (ROE) | Absolute variation | 4.7 | 5.1 |
| Turnover per employee | Var % | 1143.9 | 177.6 |
| Value added per employee | Var % | 352.8 | 185.1 |
| Turnover/Staff costs | Var % | 2437.0 | 127.7 |
| Production value | Var % | 3092.3 | 261.3 |
| Revenues from sales of good and services | Var % | 3444.6 | 253.3 |
| SP-Score | Composite index | 105.8 | 92.7 |
Source: Author’s elaboration on Aida Bureau Van Dijk data.
Table 4.
SP-score. Comparison of five aggregation methods.
| MPI+ | MPI- | M1VZ | INRE | GRAD | Ranking | |
|---|---|---|---|---|---|---|
| Innovative start-ups | 105.8 | 103.9 | 0.49 | 0.68 | 0.15 | 1° |
| Non-innovative start-ups | 92.7 | 91.5 | −0.78 | 0.13 | 0.36 | 2° |
Source: author’s elaboration.
Table 5.
SP-score. Cograduation matrix of five aggregation methods.
| GRAD | INRE | M1VZ | MPI- | MPI+ | |
|---|---|---|---|---|---|
| GRAD | 1.0000 | ||||
| INRE | 1.0000 | 1.0000 | |||
| M1VZ | 1.0000 | 1.0000 | 1.0000 | ||
| MPI- | 1.0000 | 1.0000 | 1.0000 | 1.0000 | |
| MPI+ | 1.0000 | 1.0000 | 1.0000 | 1.0000 | 1.0000 |
Source: Author’s elaboration.
Table 6.
SP-score for Italian NUTS2 regions—Innovative start-ups. MPI+ method.
| Regions | SP-Score |
|---|---|
| Abruzzo | 104.4 |
| Apulia | 100.7 |
| Basilicata | 99.6 |
| Calabria | 104.0 |
| Campania | 106.3 |
| Emilia-Romagna | 101.4 |
| Friuli-Venezia Giulia | 95.5 |
| Lazio | 101.8 |
| Liguria | 99.3 |
| Lombardy | 98.1 |
| Marche | 103.7 |
| Molise | 95.4 |
| Piedmont | 93.6 |
| Sardinia | 92.7 |
| Sicily | 102.5 |
| Tuscany | 101.6 |
| Trentino | 101.1 |
| Umbria | 106.7 |
| Valle d’Aosta | 103.3 |
| Veneto | 105.0 |
| Center-North (mean of 12 regions) | 100.5 |
| South (mean of 8 regions) | 100.7 |
Source: Author’s elaboration on financial statement data (database: Aida Bureau Van Dijk).
Publisher’s Note: MDPI stays neutral with regard to jurisdictional claims in published maps and institutional affiliations. |
© 2022 by the authors. Licensee MDPI, Basel, Switzerland. This article is an open access article distributed under the terms and conditions of the Creative Commons Attribution (CC BY) license (https://creativecommons.org/licenses/by/4.0/).
Share and Cite
MDPI and ACS Style
Onesti, G.; Monaco, E.; Palumbo, R. Assessing the Italian Innovative Start-Ups Performance with a Composite Index. Adm. Sci. 2022, 12, 189. https://doi.org/10.3390/admsci12040189
AMA Style
Onesti G, Monaco E, Palumbo R. Assessing the Italian Innovative Start-Ups Performance with a Composite Index. Administrative Sciences. 2022; 12(4):189. https://doi.org/10.3390/admsci12040189
Chicago/Turabian StyleOnesti, Gianni, Eleonora Monaco, and Riccardo Palumbo. 2022. "Assessing the Italian Innovative Start-Ups Performance with a Composite Index" Administrative Sciences 12, no. 4: 189. https://doi.org/10.3390/admsci12040189
Note that from the first issue of 2016, this journal uses article numbers instead of page numbers. See further details here.