Productivity in an Organizational Setting: A Systematic View of the Causalities at Work


Department of Industrial Engineering, University of Iceland, 101 Reykjavík, Iceland
*
Author to whom correspondence should be addressed.
Adm. Sci. 2022, 12(3), 90; https://doi.org/10.3390/admsci12030090
Submission received: 16 June 2022
/
Revised: 15 July 2022
/
Accepted: 18 July 2022
/
Published: 25 July 2022
Abstract
:The purpose of this research was to portray productivity in a larger context than has previously been presented, using system analysis. The result was a single causal loop diagram describing productivity in a work setting. Information on the components affecting productivity and how they interact was gathered from the industrial and organizational psychology (I-O psychology) literature as researchers in that field have spent a great deal of effort on shedding light on the subject. Articles from well-known I-O psychology journals were selected for further analysis through a systematic literature search. From these articles, 45 causal loop diagrams (CLDs) were constructed based on the causalities described in their theoretical background sections and results. These CLDs were subsequently synthesized in two steps to create a single CLD describing productivity. The resulting CLD provides an opportunity to view productivity in the workplace in a wider context.
1. Introduction
Managers of organizations today face a constant demand for performance in the form of bottom-line growth. In essence, the operation of any firm can be described as a value adding transformation process. Continually striving to improve this process is vital but it is achieved as a strategic decision. The first half of the twentieth century saw extreme improvements in the productivity of the manual worker and automation further added to these gains (Hopp et al. 2009). Today, however, the majority of the workforce is increasingly made up of knowledge workers. Identifying ways of improving their productivity is therefore extremely valuable for organizations looking to grow in a demanding, competitive environment (Drucker 1999).
Researchers in the field of industrial and organizational psychology (I-O psychology) have devoted a substantial amount of time and effort to increasing our understanding of and improving workers’ performance. While the subject of employee productivity is of interest to other fields of research, such as industrial engineering (Hopp et al. 2009), it is wise, when venturing into the study of such multi-disciplinary topics, to get familiarized with findings from other disciplines that have accumulated knowledge on the subject. In that way, one can avoid the pitfall of reinventing the wheel, and it also increases one’s ability to view the topic from a different angle and in a larger context. It seems obvious that anyone exploring the topic of employee productivity, no matter the academic field, would gain from getting acquainted with what I-O psychologists have to say about the subject.
Findings in I-O psychology have identified different ways of improving employee productivity. These include, but are not limited to, methods such as staffing and training to develop competent employees and identifying different ways of motivating and affecting the wellbeing of these employees to turn them into effective workers. These applications are, however, usually explored separately, thus forfeiting the opportunity to study how they impact each other. Different methods can balance or reinforce each other’s effect, possibly affecting the desired outcome. In order to understand the dynamics of the factors affecting productivity, they need to be considered in context. A system approach, therefore, seems desirable. One such methodology, system thinking, the framework used in this research, involves identifying the causal relationships and feedbacks of systems, thus highlighting their dynamics.
The objective of this research is to identify the causal relationships affecting employee productivity in an organizational setting with reference to findings from industrial and organizational psychology. Instead of focusing on how one or several factors affect productivity, the idea is to take a step back and look at the phenomena in a larger context. By widening the focus, the aim of this study is to achieve a better understanding of the dynamics between the different components affecting productivity, that is, how they interact by reinforcing and balancing their respective impacts. It is only when we thoroughly understand the dynamics of a system that we can properly control it to produce the desired result (Arnold and Wade 2015).
2. Method
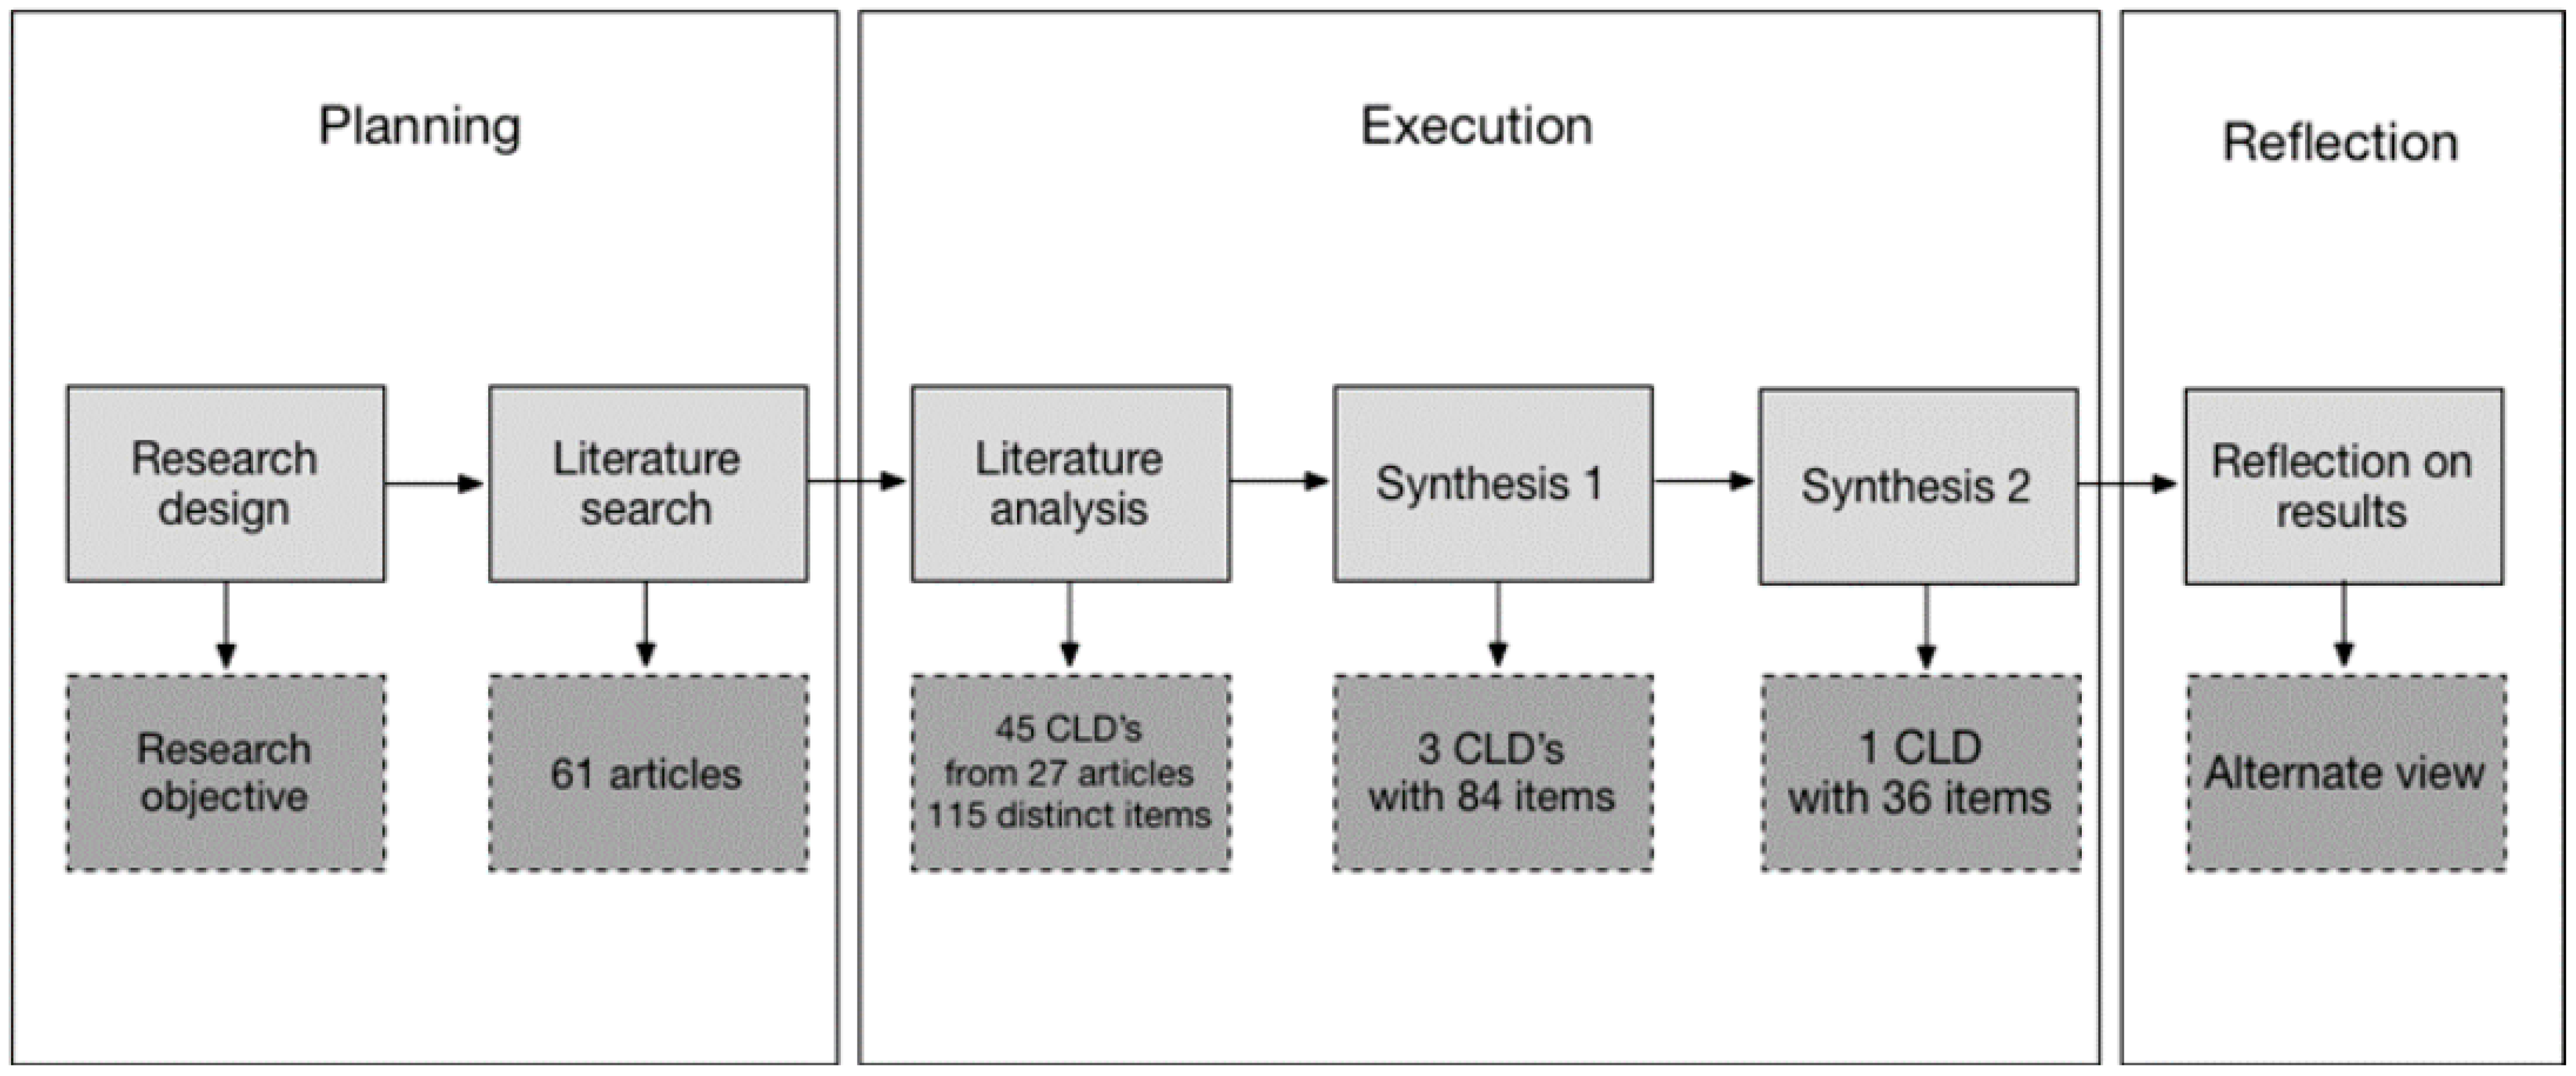
The work for this paper was performed in three stages. Figure 1 is a visual representation of the process, from the initial design of the research to the reflections on the results. Each step in the process produces an outcome that is used in the steps that follow. These stages are constructed by merging a literature review method (Kitchenham 2004) and system analysis (Arnold and Wade 2015; Haraldsson 2000; Sterman 2000). During the planning stage, the outline and scope of the research were defined and put forth in the form of a research objective. The planning phase also entailed the gathering of source material through a systematic literature search. The execution stage involved reviewing the literature, extracting relevant information, and organizing it in a systematic way. The review of the literature entails analysis and is thereby a part of the actual research conducted and results yielded. In the second part of the execution stage, the information gathered during the first stage was synthesized in two steps to form a single diagram describing the causal relationships affecting employee productivity. The third and final stage, described in the discussion chapter, involved reflecting on the research results produced during stage two and speculating on opportunities for future research. The three research stages are briefly described in Figure 1.
2.1. Planning
The actual research work of the execution stage was preceded by a planning phase. During this stage, the scope of work was defined, and the research material assembled.
2.1.1. Scope
The purpose of this study is to identify the causal relationships of productivity in an organizational setting as presented in findings from I-O psychology. It is not the purpose of this research to evaluate relationship characteristics, (i.e., intensity, importance) nor to group the relationships. A certain grouping is performed along the analysis, but that is only to facilitate working through all the relationships.
Limiting the research material to this particular field is based on the assumption that it contains an abundance of knowledge on the subject that is of value when mapping up causal relationships using methods from industrial engineering.
2.1.2. Assumptions
The performance of an organization can be measured in different ways. Frequently used to describe performance in the organizational setting are different measures of efficiency, (e.g., Wright et al. 1993; Umstot et al. 1976; Kim and Ployhart 2014), effectiveness, (e.g., Probst et al. 2007; Podsakoff et al. 1997), and productivity, (e.g., Chadwick et al. 2013; Grant 2008; Patterson et al. 2004). Despite their widespread use, a lack of consensus on the definition of these terms, or rather, how to distinguish between them, is apparent in the literature. In this research, distinctions between definitions of productivity in the different articles are disregarded and it is presumed that all phenomena termed productivity is the same. On the other hand, a distinction is made between the different levels of productivity, that is employee, group, and company level productivity.
2.1.3. Literature Search
A systematic literature search was conducted in accordance with the scope and research objective. The ISI Web of Science database was used to search for articles. The field of I-O psychology has contributed immensely to research on employee productivity so relatively strict search criteria were used. The literature search follows the methodology of Kitchenham (2004). The search field was narrowed only to include articles with the word productivity in the title from five well-known journals publishing research in the field of I-O psychology: Personnel Psychology, Journal of Applied Psychology, Journal of Occupational and Organizational Psychology, Journal of Organizational Behavior, and Journal of Vocational Behavior. The search was not time-dependent so it includes papers from the inception of the journal to 2021. The search returned 61 articles, of which 27, were, after an abstract review, deemed relevant for the research. A list of the 27 articles can be found in Appendix A, Table A1. The criteria for relevance were:
- The article should describe causal relationships leading to productivity either in its theoretical background chapter or results;
- The article should focus on general organizational settings and employees as opposed to specific groups such as parents or shift workers;
The 27 relevant articles were further examined in the execution stage through a literature analysis producing information that was then synthesized in two steps.
2.2. Execution
The execution consists of a thorough literature analysis using the method of system analysis, followed by a two-step synthesis of the analysis results. The selected literature was reviewed using a systems approach, with the specific aim of identifying descriptions of causal relationships affecting productivity. These causalities were found in the theoretical background sections of the articles, in their results, or both.
2.2.1. System Analysis
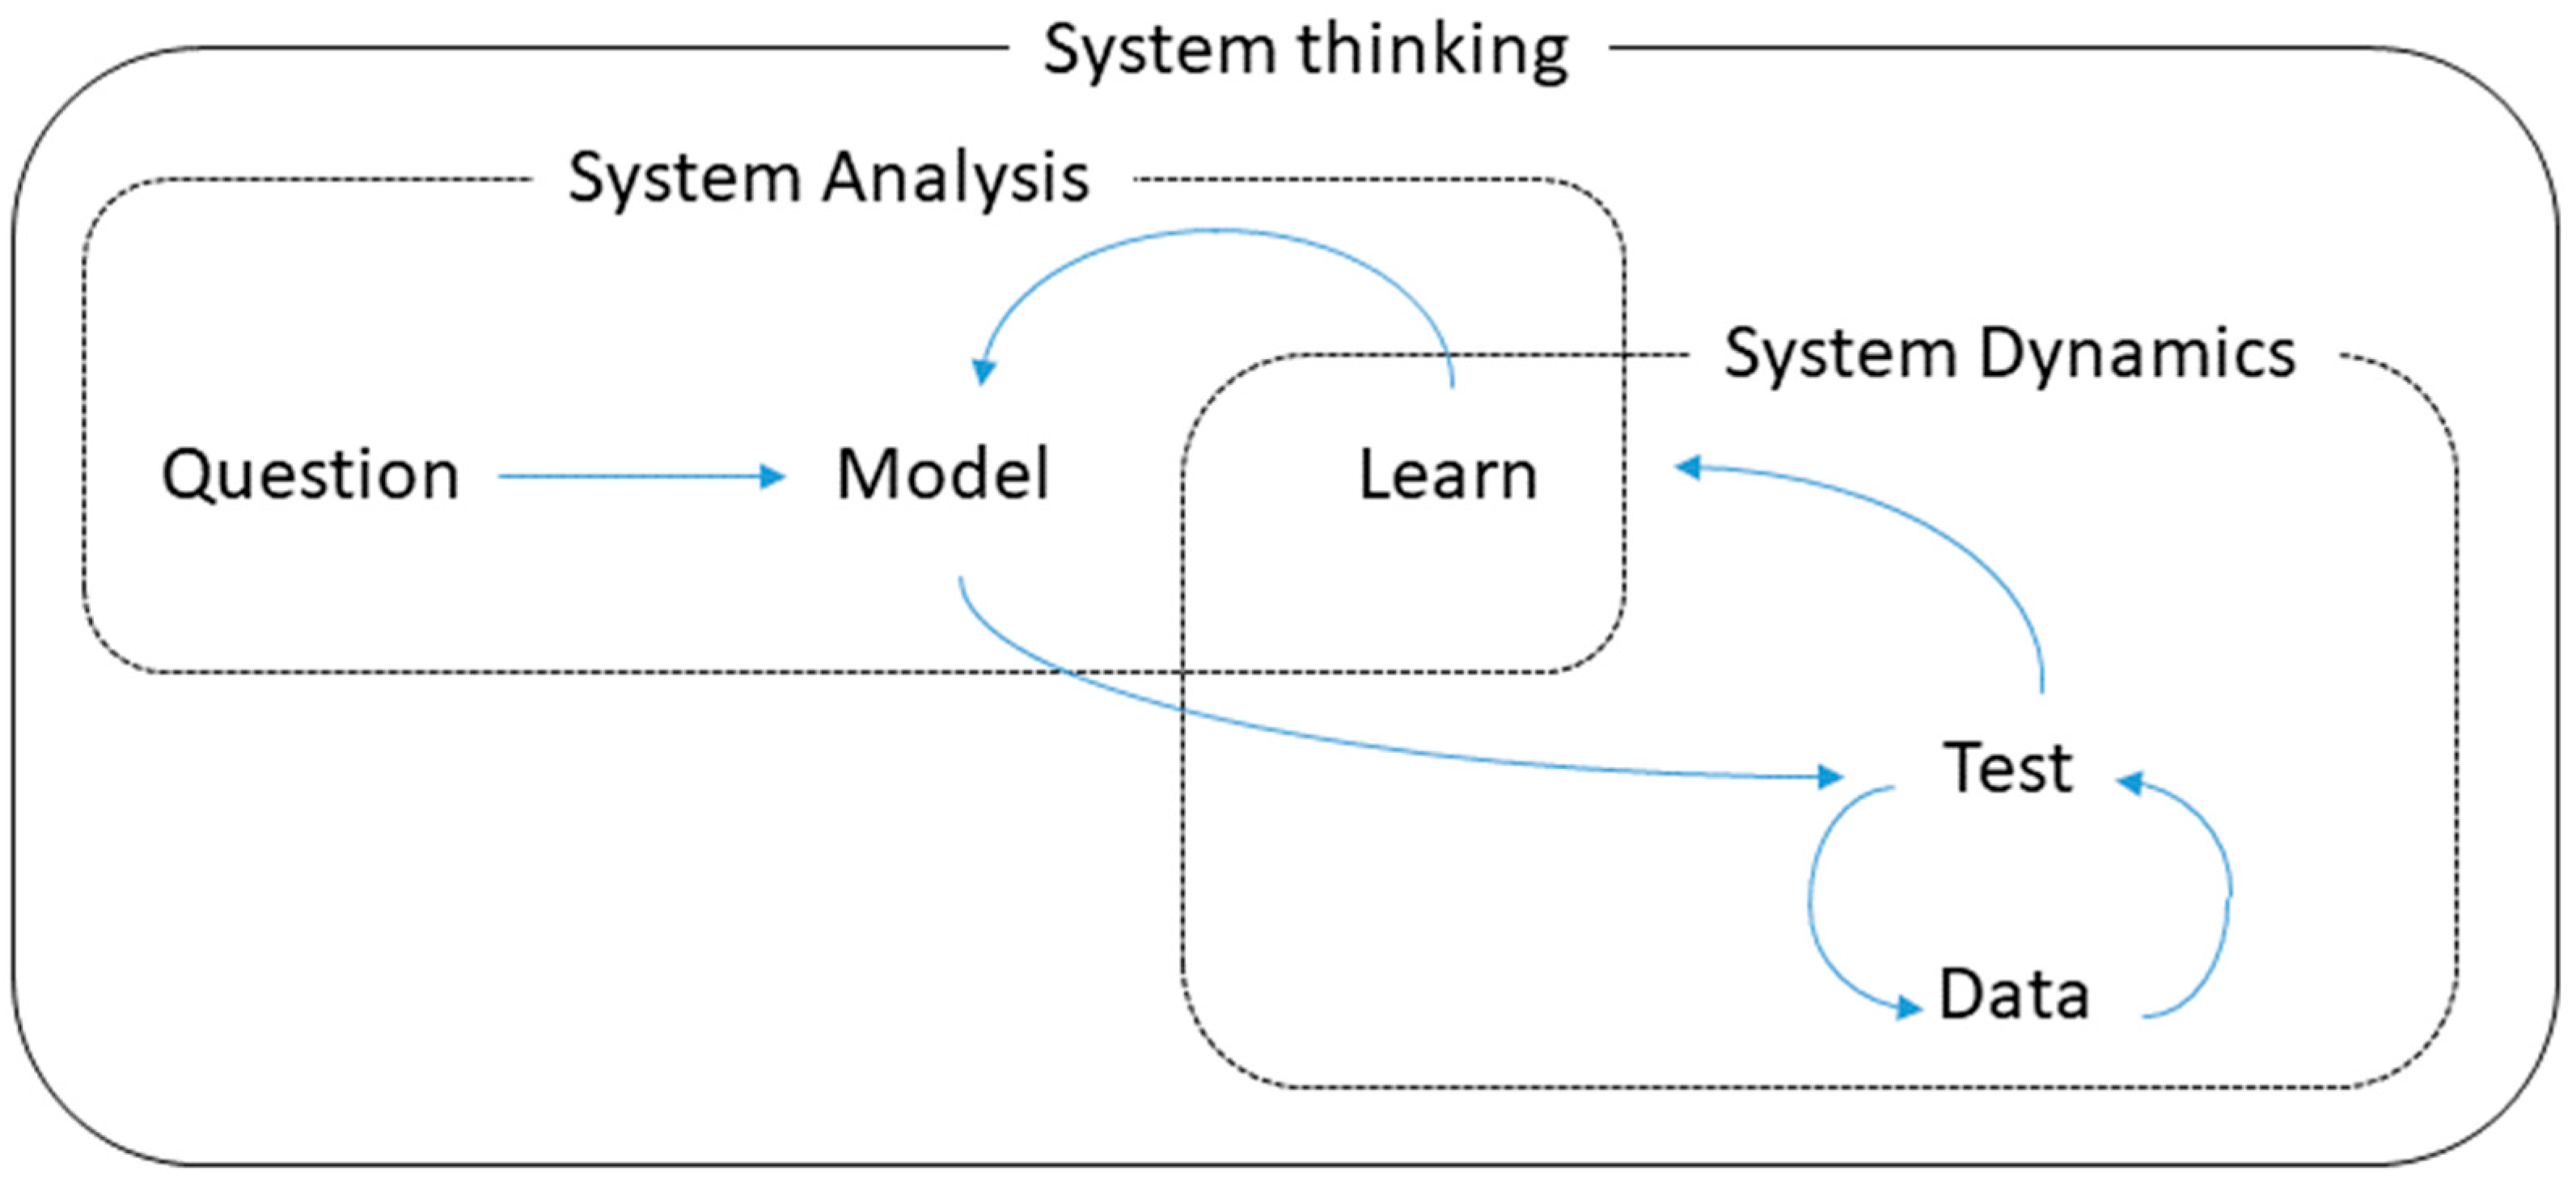
The method used to identify causal relationships in the literature was system analysis. System analysis is a practical application of system thinking. The objective of system thinking is to obtain an understanding of the connections and interactions of the distinct parts of a system, recognize patterns and thus identify causes and effects of complex problems within the system. System analysis involves identifying the components of a system, building a mental model of how they relate to one another and presenting it as a causal loop diagram. Once a mental model has been constructed, the dynamics of the system can be recreated using mathematical simulation models. Such models can then be used to explain past behavior of the system and predict and influence future outcomes. The relationship between system thinking, system analysis and system dynamics is presented in Figure 2.
System analysis is about identifying causal relationships, often through group model building or stakeholder interviews. Here, we take a slightly different approach to system analysis than presented by Haraldsson (2000), by constructing a mental model of employee productivity using information from the I-O psychology literature only. The selected papers were thoroughly scanned for indicators of causal relationships affecting employee productivity. The results of this literature analysis were presented as causal-loop-diagrams (CLDs). Most of the articles produced two diagrams, one from the theoretical background and one from the results, but a few only contained information on causal relationships in one of two sections.
2.2.2. Causal Loop Diagrams
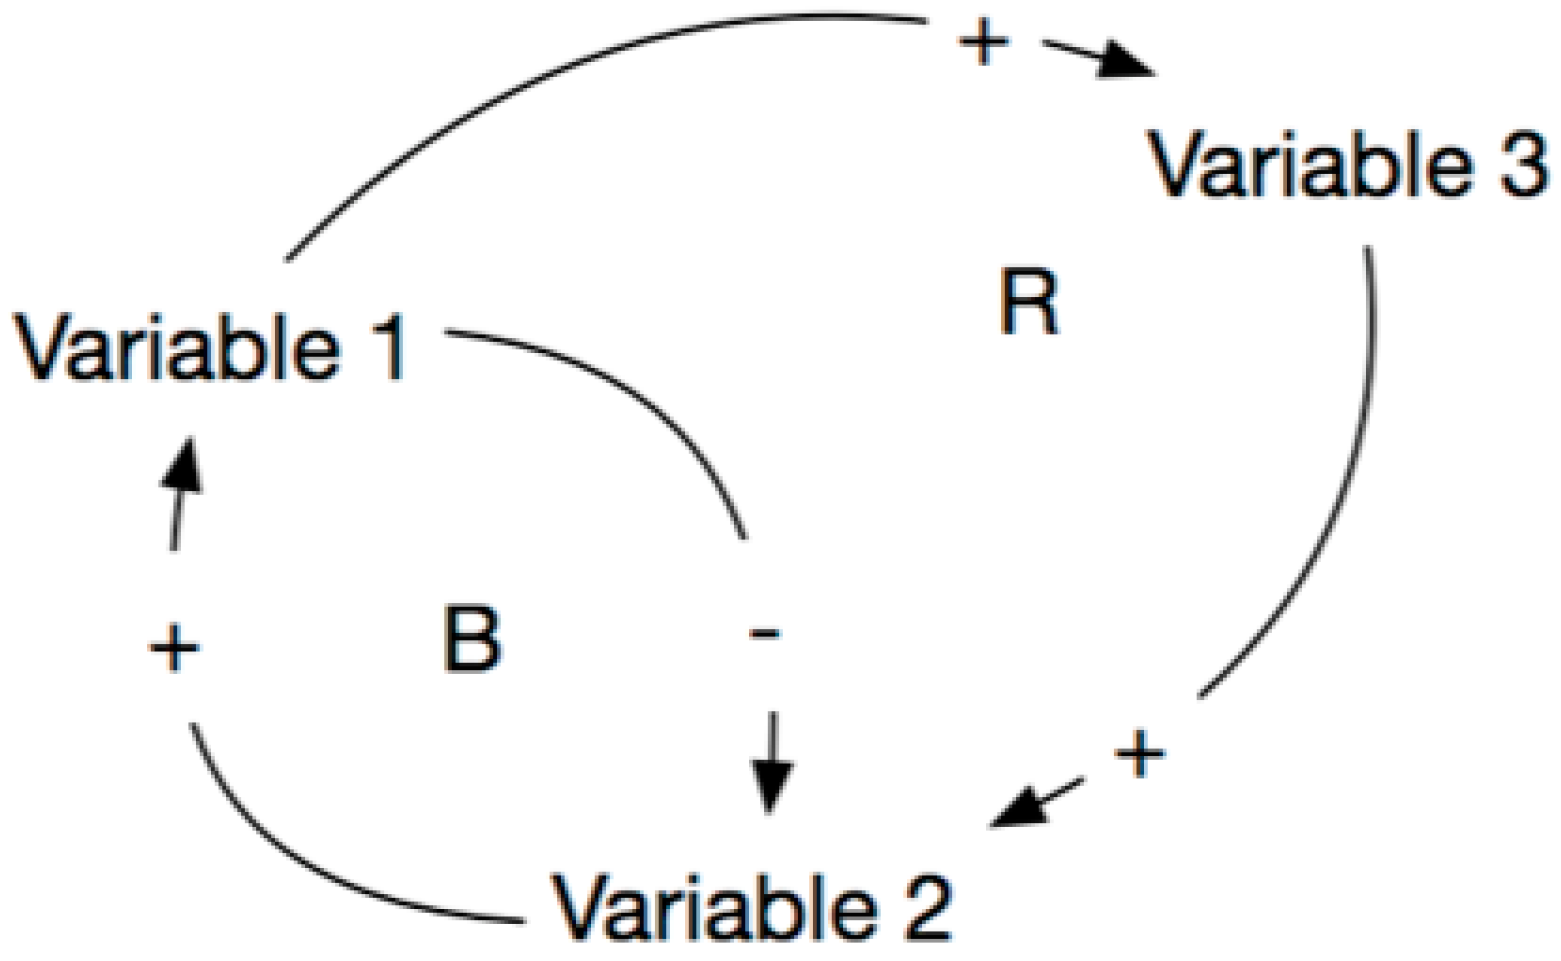
CLDs are used to describe a mental model of reality by identifying and presenting the causal links between the items in the model. The main motive for such an exercise is to observe a system or phenomena through feedbacks rather than linearly and thereby capturing the dynamics of its behavior. In a CLD, a causality is presented as an arrow between two items with either a plus sign or a minus sign. A plus sign indicates a positive relationship between variables, that given all else is equal, the variable at the tail of the arrow and the variable at the arrowhead change in the same direction, as the cause increases, so does the effect and if the cause decreases so does the effect. A minus sign indicates the opposite, a negative relationship between variables, that is that, given all else is equal, the effect goes in the opposite direction of the cause (Sterman 2000). An example of a causal loop diagram can be seen in Figure 3.
The result of this stage of the research was 45 distinct CLDs. It should be noted that all information used to construct the 45 CLDs comes from the selected 27 articles. The CLDs made from the theoretical background chapter of these 27 articles contain causal relationships described in over 200 journal articles and books from various fields of research. These sources were not read for this research and the presumptions made about causalities are based on how the authors of the selected articles described them. However, reference is made to the source articles on the CLDs, and a list of all references kept in a working document that is available as a Supplemental Material (see end of article).
2.2.3. Synthesis
The CLDs from the different articles were used as building blocks for the construction of a single mental model containing all the different factors that contribute to or discourage employee productivity according to the selected literature. In order to synthesize the diagrams, similar items, and their respective causal relationships, were joined and items that were considered less important for the big picture were discarded. As stated in the introduction, the purpose of this research was to obtain a macro rather than a micro view of employee productivity. One way of consolidating the information extracted from the literature would be simply to join the different CLDs together, only uniting identical items, and thereby preserving the original level of detail. This produces a highly complex model that is difficult to understand and therefore does not add much to the information in the isolated CLDs that each describes different causal relationships relating to employee productivity. The route taken here was therefore to simplify the big picture just enough so that the human mind can grasp its dynamics without losing sight of the essential elements. The synthesis was performed in two steps; the first step produced three CLDs with 84 individual items and the second step resulted in a single CLD with 36 items.
3. Results of Literature Analysis
The 27 articles deemed relevant for the research presented in this paper were analyzed using system analysis. Each article was examined in search of descriptions of causal relationships relating to productivity. The search was focused on one hand, on the theoretical background or literature review of each article, and, on the other hand, on its results. Identified causal relationships were presented in the form of causal loop diagrams. For every article, there are, therefore, typically two sets of analysis results: one diagram describing causal relationships identified in the theoretical background chapter of an article and one describing causal relationships from its results. There are exceptions, however, as some articles did not demonstrate identifiable causal relationships, either in the background section or in the results. All causal relationships identified in the theoretical background chapter of an article are marked with a reference. References for the causal relationships identified in the results chapters of the articles are not marked in the results CLDs as their source is always the article in question.
Similar or even identical items in separate articles typically go by different names. Such items were joined under one item name, representing the whole group. A list of the 115 distinctive items found on the initial 45 CLDs and their denotations in every article in which they were identified, was recorded in a working document that is available from the corresponding author upon request. In addition to the 115 items already mentioned there are 8 items that were defined as “effect items”. They are used to be able to present the mediating role of certain factors on the impact of other components. For example, the items goal commitment, goal difficulty, and goal specificity all increase the effect of goal setting, but do not increase goal setting per se. An “effect item”, the effect of goal setting, therefore, needs to be added as a link between goal setting and the components it affects. It is presumed that the “effect items” are closely related to, or even integral parts of the items whose effect they are to present, (e.g., goal setting is a necessary prerequisite for the existence of the effect of goal setting). They are therefore not considered proper items and are not included in the total sum of 115 items although they are present in the CLDs. A list of all items referred to in this research, including the “effect items” is available from the corresponding author upon request.
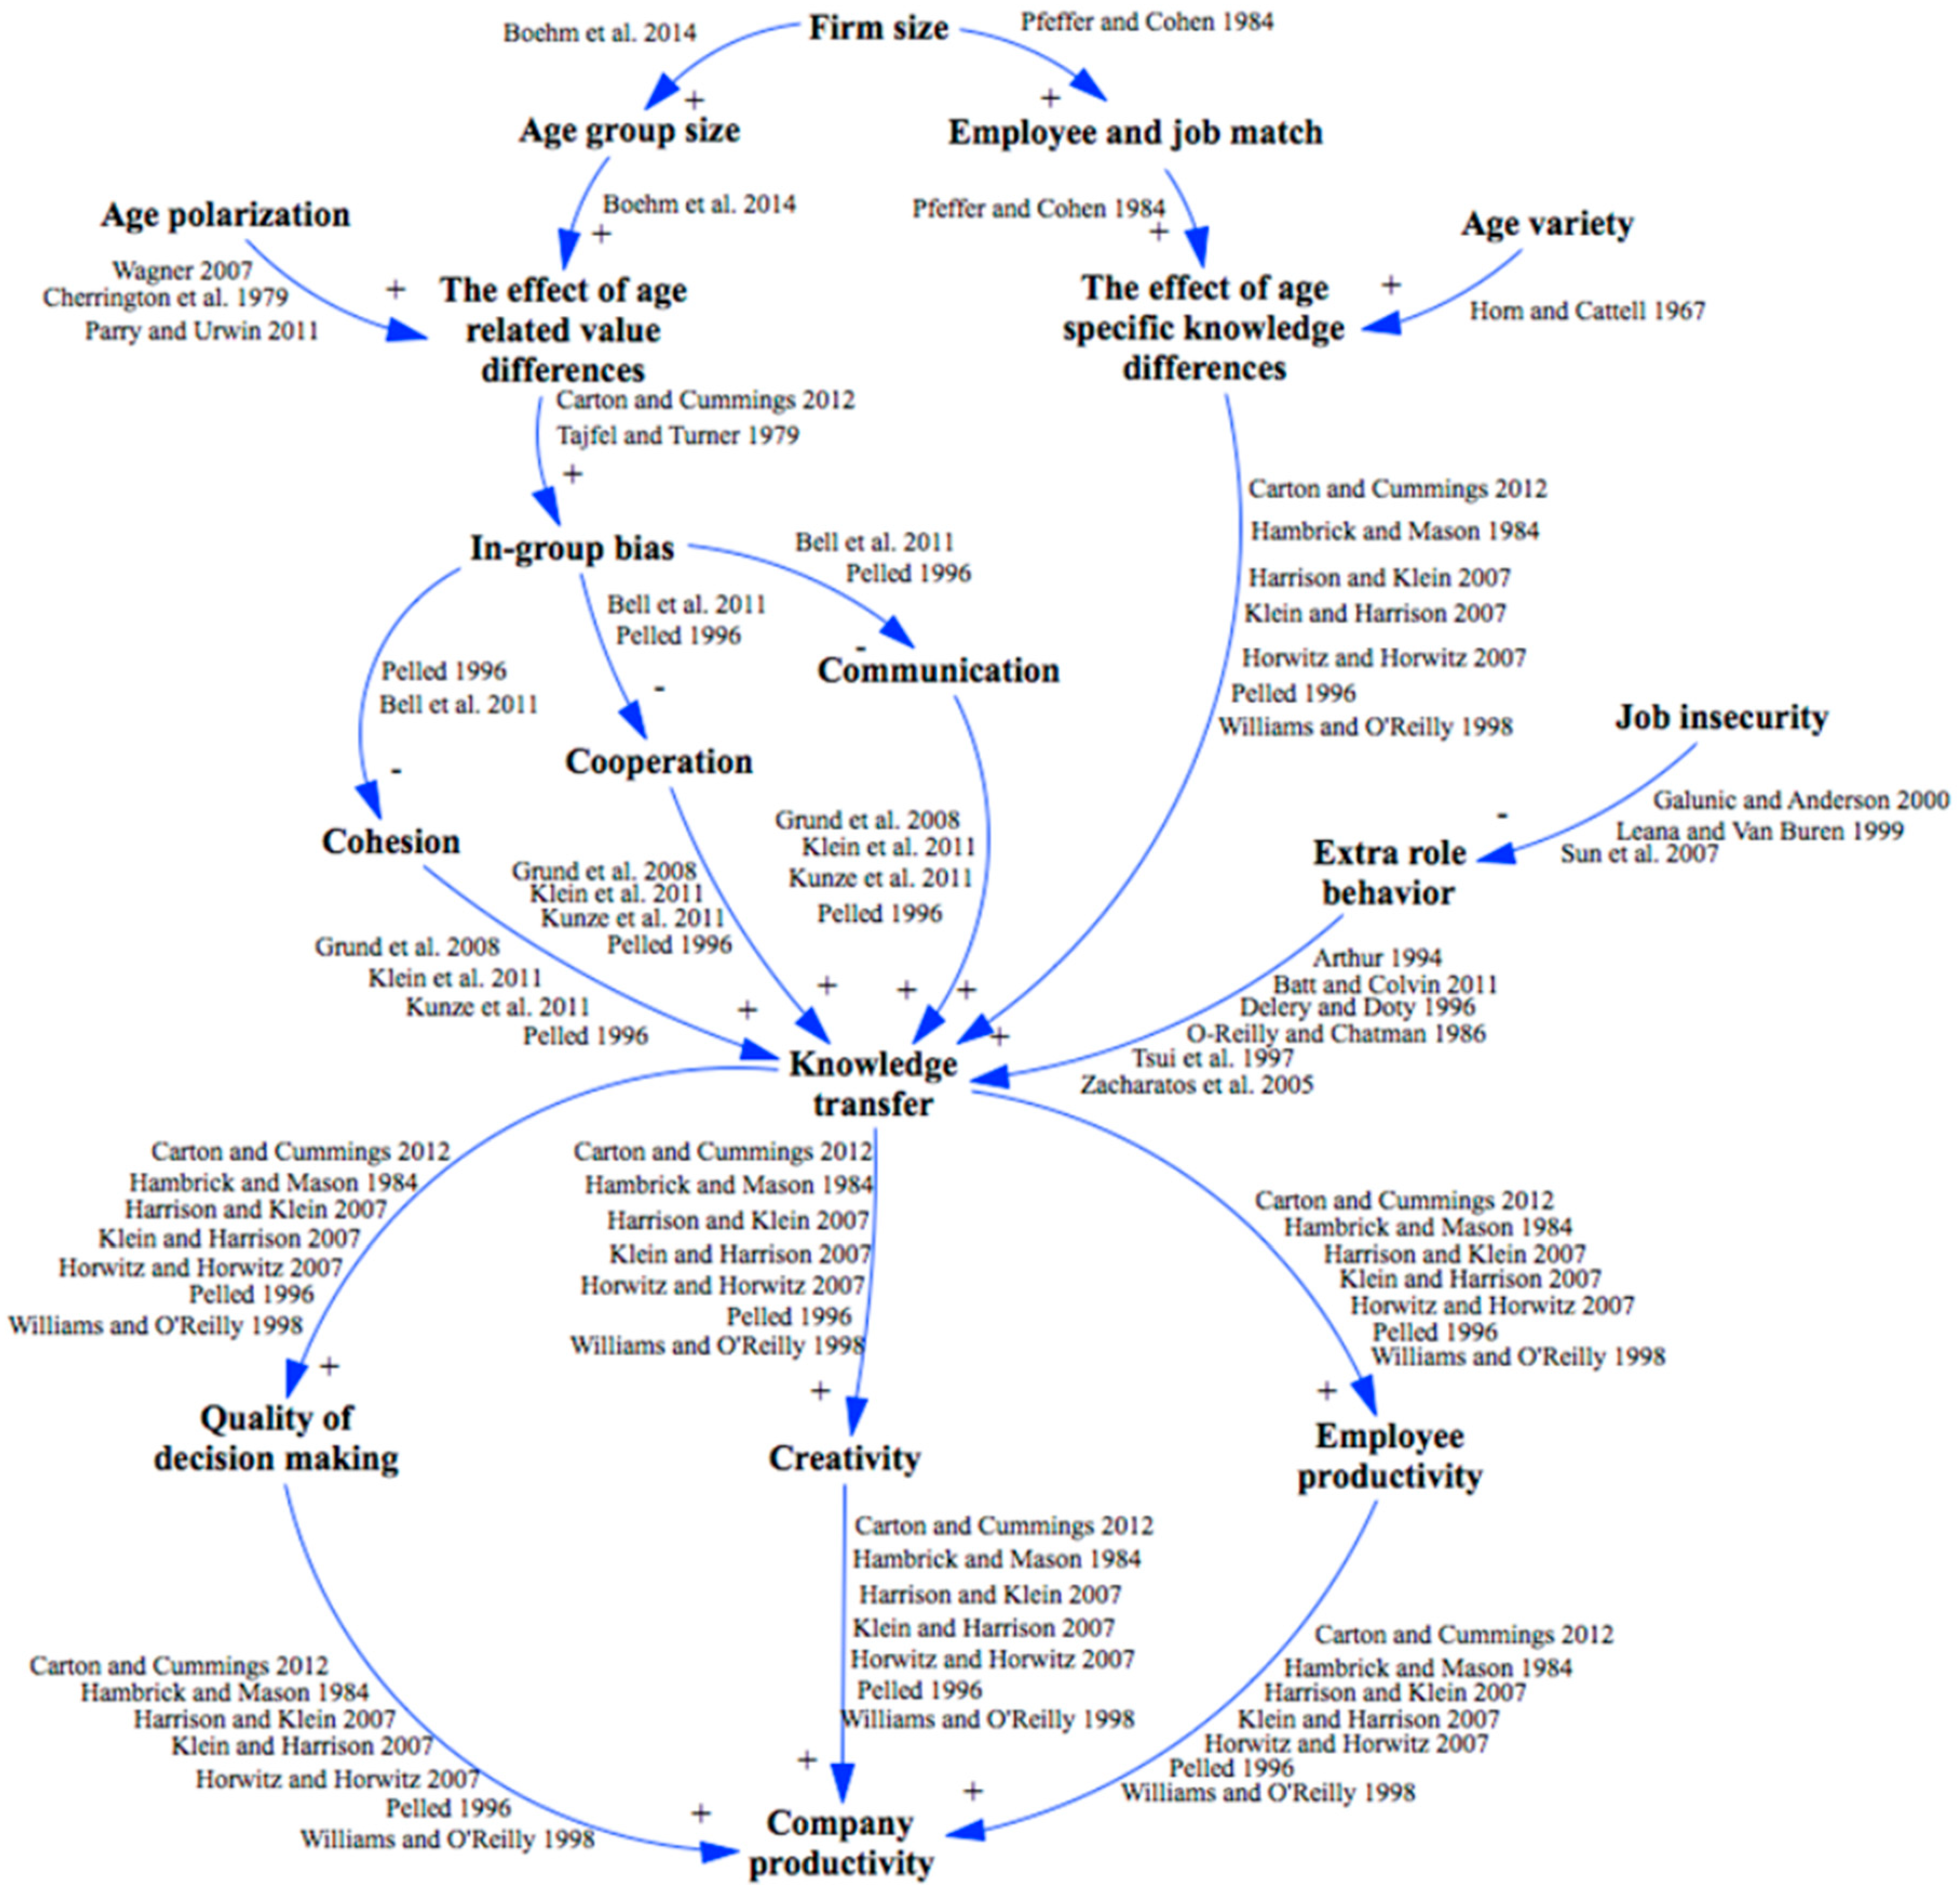
The result of the literature analysis was 45 distinct CLDs all describing different causal relationships affecting employee productivity in an organizational setting. As an example, one such CLD, from the theoretical background section of De Meulenaere et al. (2016) is presented in Figure 4.
De Meulenaere et al. (2016) based their research design on earlier findings on the effect of age diversity on labor productivity. They reference research results indicating that age variety, that is, the heterogeneity of ages within the firm, causes the manifestation of age-specific knowledge differences (Horn and Cattell 1967), and that age polarization, or the segmentation of the workforce into homogeneous groups, leads to age-related value differences (Cherrington et al. 1979; Parry and Urwin 2011; Wagner 2007). Further, they state that age-specific knowledge differences have been found to have a positive effect on knowledge transfer within the firm (Carton and Cummings 2012; Hambrick and Mason 1984; Harrison and Klein 2007; Horwitz and Horwitz 2007; Klein and Harrison 2007; Pelled 1996; Williams and O’Reilly 1998), while age-related value differences have a negative effect on knowledge transfer. They then state that it has been argued that the latter increases group formation amongst employees (Carton and Cummings 2012; Tajfel and Turner 1979) which leads to less cohesion, cooperation, and communication (Bell et al. 2011; Pelled 1996), thus negatively affecting knowledge transfer (Grund and Westergaard-Nielsen 2008; Klein et al. 2011; Kunze et al. 2011; Pelled 1996). Furthermore, they found that the transfer of knowledge between employees within the firm had been found to positively affect the quality of decisions made, creativity, and individual employee efficiency and effectiveness, ultimately affecting firm productivity (Carton and Cummings 2012; Hambrick and Mason 1984; Harrison and Klein 2007; Horwitz and Horwitz 2007; Klein and Harrison 2007; Pelled 1996; Williams and O’Reilly 1998).
De Meulenaere, Boone, and Buyl’s review of the literature also indicated that firm size affects both the effect of age-related value differences and age-specific knowledge differences. This is based on the presumption that in bigger firms, distinct age groups should be larger, which intensifies the effect of its members’ value differences (Boehm et al. 2014). When it comes to knowledge differences, however, a larger firm size enables the matching of employees with appropriate jobs, thus making it easier to take advantage of age-specific knowledge differences (Pfeffer and Cohen 1984).
Job security has, according to De Meulenaere et al. (2016) been found to positively impact extra-role behavior (Galunic and Anderson 2000; Leana and Van Buren 1999; Sun et al. 2007). Such employee behaviors make the flow of knowledge between employees more prominent, thereby intensifying the positive effect of age variety and diminishing the negative effect of age polarization on labor productivity (Arthur 1994; Batt and Colvin 2011; Delery and Doty 1996; Oreilly and Chatman 1986; Tsui et al. 1997; Zacharatos et al. 2005).
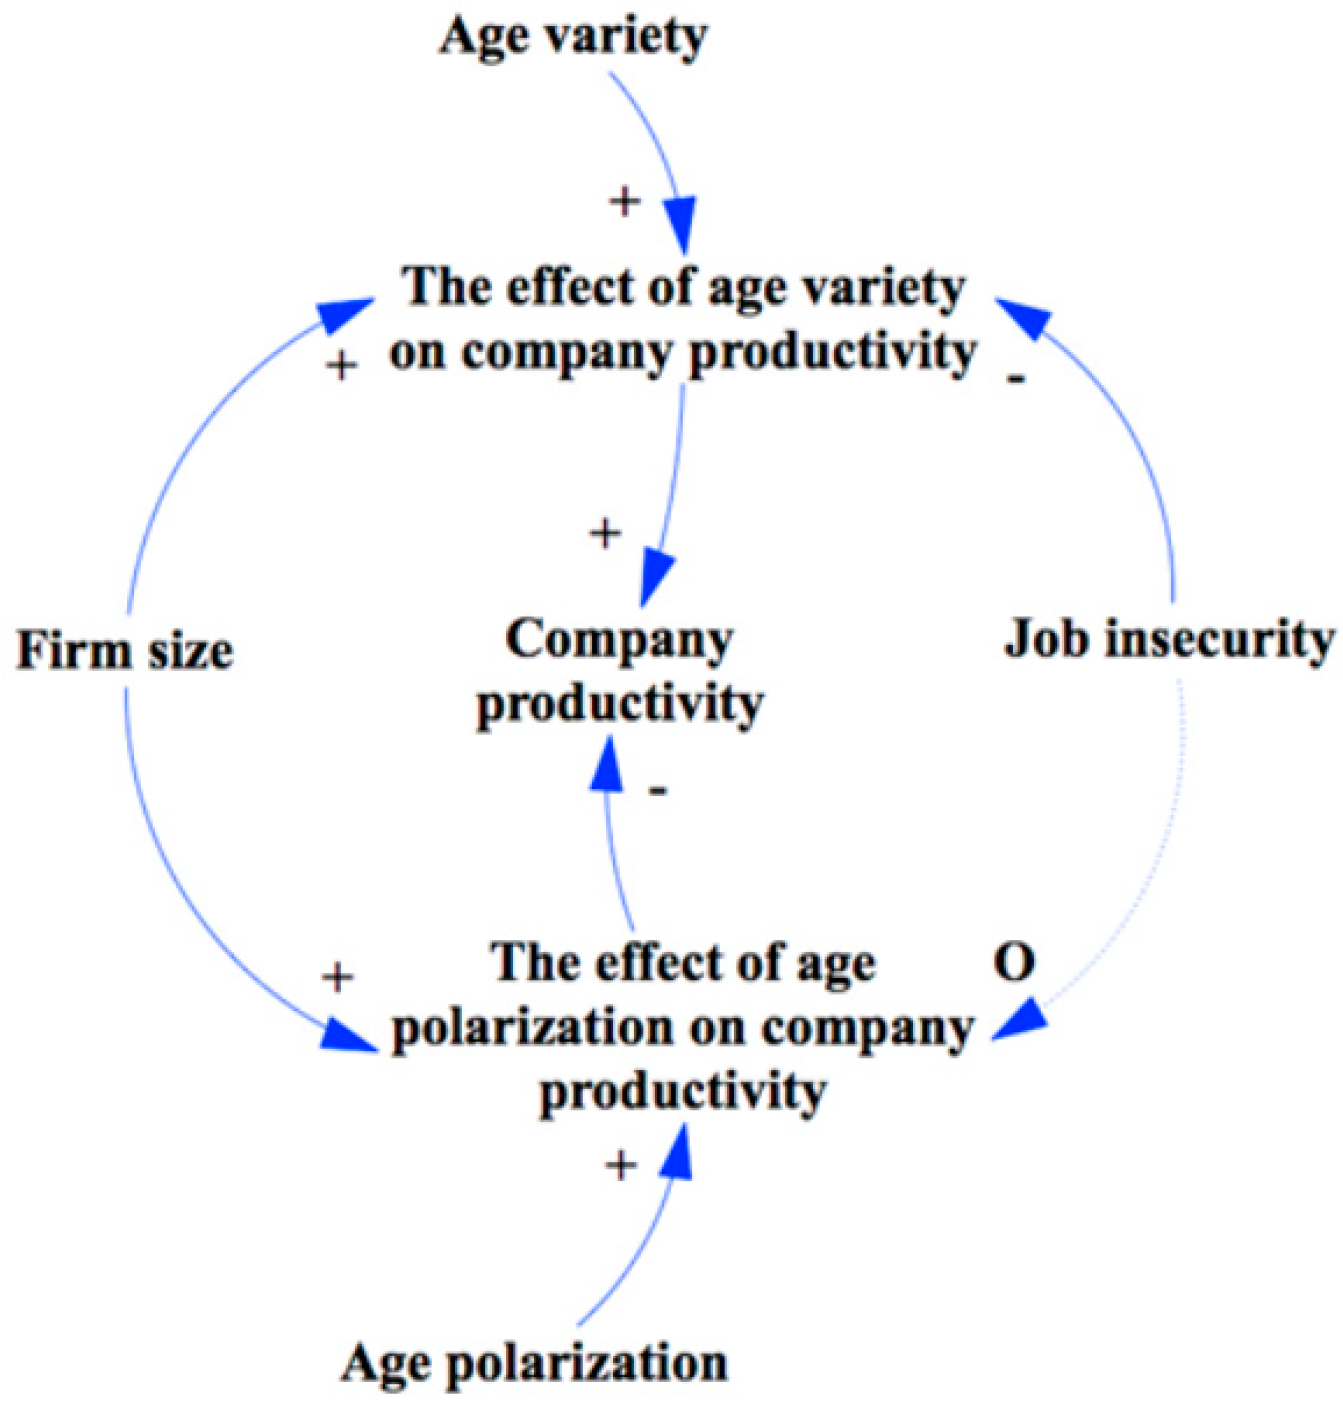
The CLD in Figure 5 describes the causal relationships identified in the results of the same article.
De Meulenaere et al. (2016) researched the impact of age variety and age polarization on labor productivity and concluded that age variety increases productivity, while age polarization decreases it. They also investigated the moderating effects of firm size and job security. Firm size intensified the impact of both age variety and age polarization, but job security only affected the impact of age variety. In the event that a hypothesized relationship was not confirmed in the results of an article a dashed line with a zero notation on the arrowhead was used to describe that relationship. That is the case for one of the causalities in Figure 5.
The remaining 26 articles were scanned in the same way for causal relationships relating to productivity in both their theoretical background and results. The resulting 45 CLDs will, in the next section, be synthesized in two steps in an effort to yield a single diagram describing the causal relationships of employee productivity in an organizational setting. All the CLDs are available as Supplementary Material (see the end of the article).
4. Synthesis of Items
The 45 CLDs resulting from the analysis of the literature were synthesized in two steps, thus creating a single CLD for productivity. In the first step, an attempt was made to join the 45 individual CLDs by identifying identical items in different diagrams and creating a link between them. The resulting CLD quickly became very complex and difficult to administer. To make synthesizing the diagrams easier, those with similar items were grouped together, creating three groups of CLDs that could then be used to create three separate synthesized CLDs. The groups that emerged when we identified CLDs with similar items respond well to common themes from the I-O psychology literature, namely employee wellbeing, employee motivation, and human resource management. The outcome of the first synthesis was therefore three separate CLDs constructed around common themes from the literature. The second synthesis step was a more significant attempt to decrease the complexity of the CLDs to be able to create a single one.
4.1. First Synthesis—Grouping
In the first synthesis step, the 45 CLDs were combined to create three diagrams. First, the CLDs were roughly divided into three groups by common themes in the I-O psychology literature: employee wellbeing, employee motivation, and human resource management. Next, items and causal relationships found in more than one CLD were identified, and a link was created between the respective diagrams. When all such common items and causal relationships had been spotted and connected, the result was three separate CLDs. Most of the articles consider topics relating to a single theme, (e.g., job satisfaction and wellbeing or goal setting and motivation) but in some cases, when applicable, different causal relationships from an article were presented in separate CLDs.
The 45 CLDs resulting from the literature analysis contained 115 distinct items. In the first synthesis, this number was decreased to 84 as 22 items were discarded, and 9 items were joined with other items.
The main goal of this synthesis step was to link the different CLDs without losing too much of the information about causal relationships they contain. There were, however, items that increased the complexity of the synthesized diagrams but were not considered to add much value to the bigger picture and were therefore discarded. A comprehensive item list is available from the corresponding author upon request.
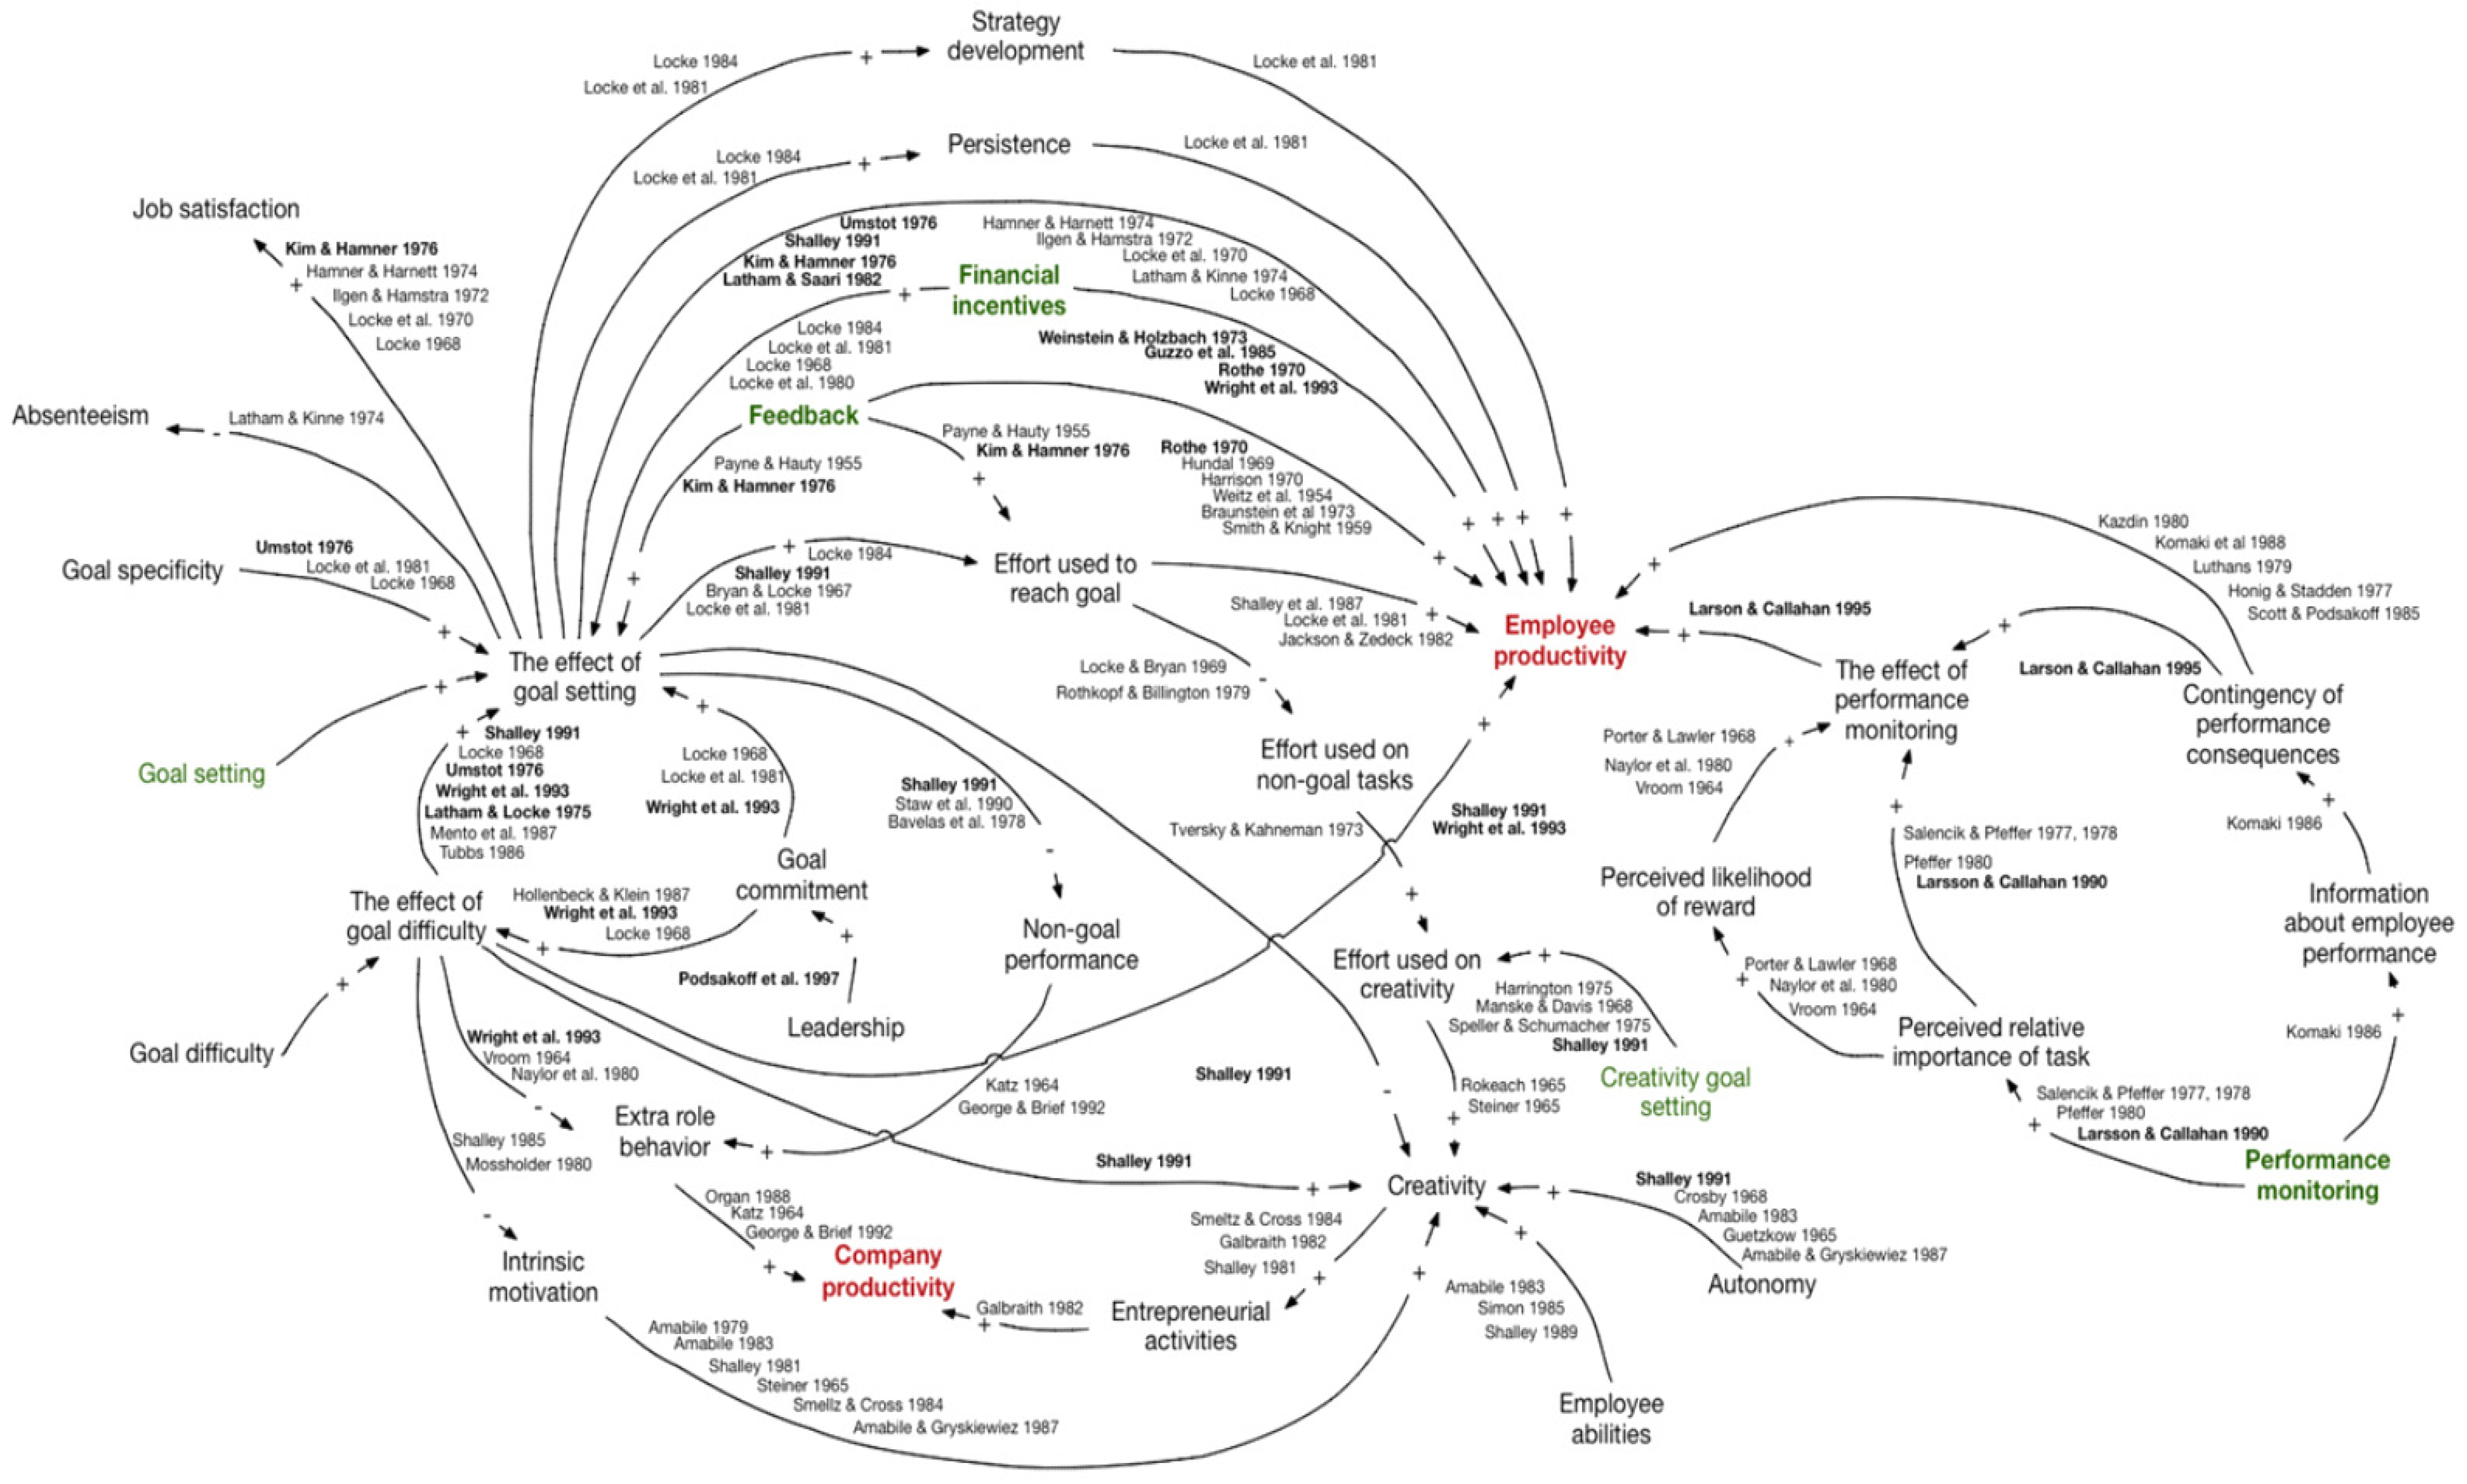
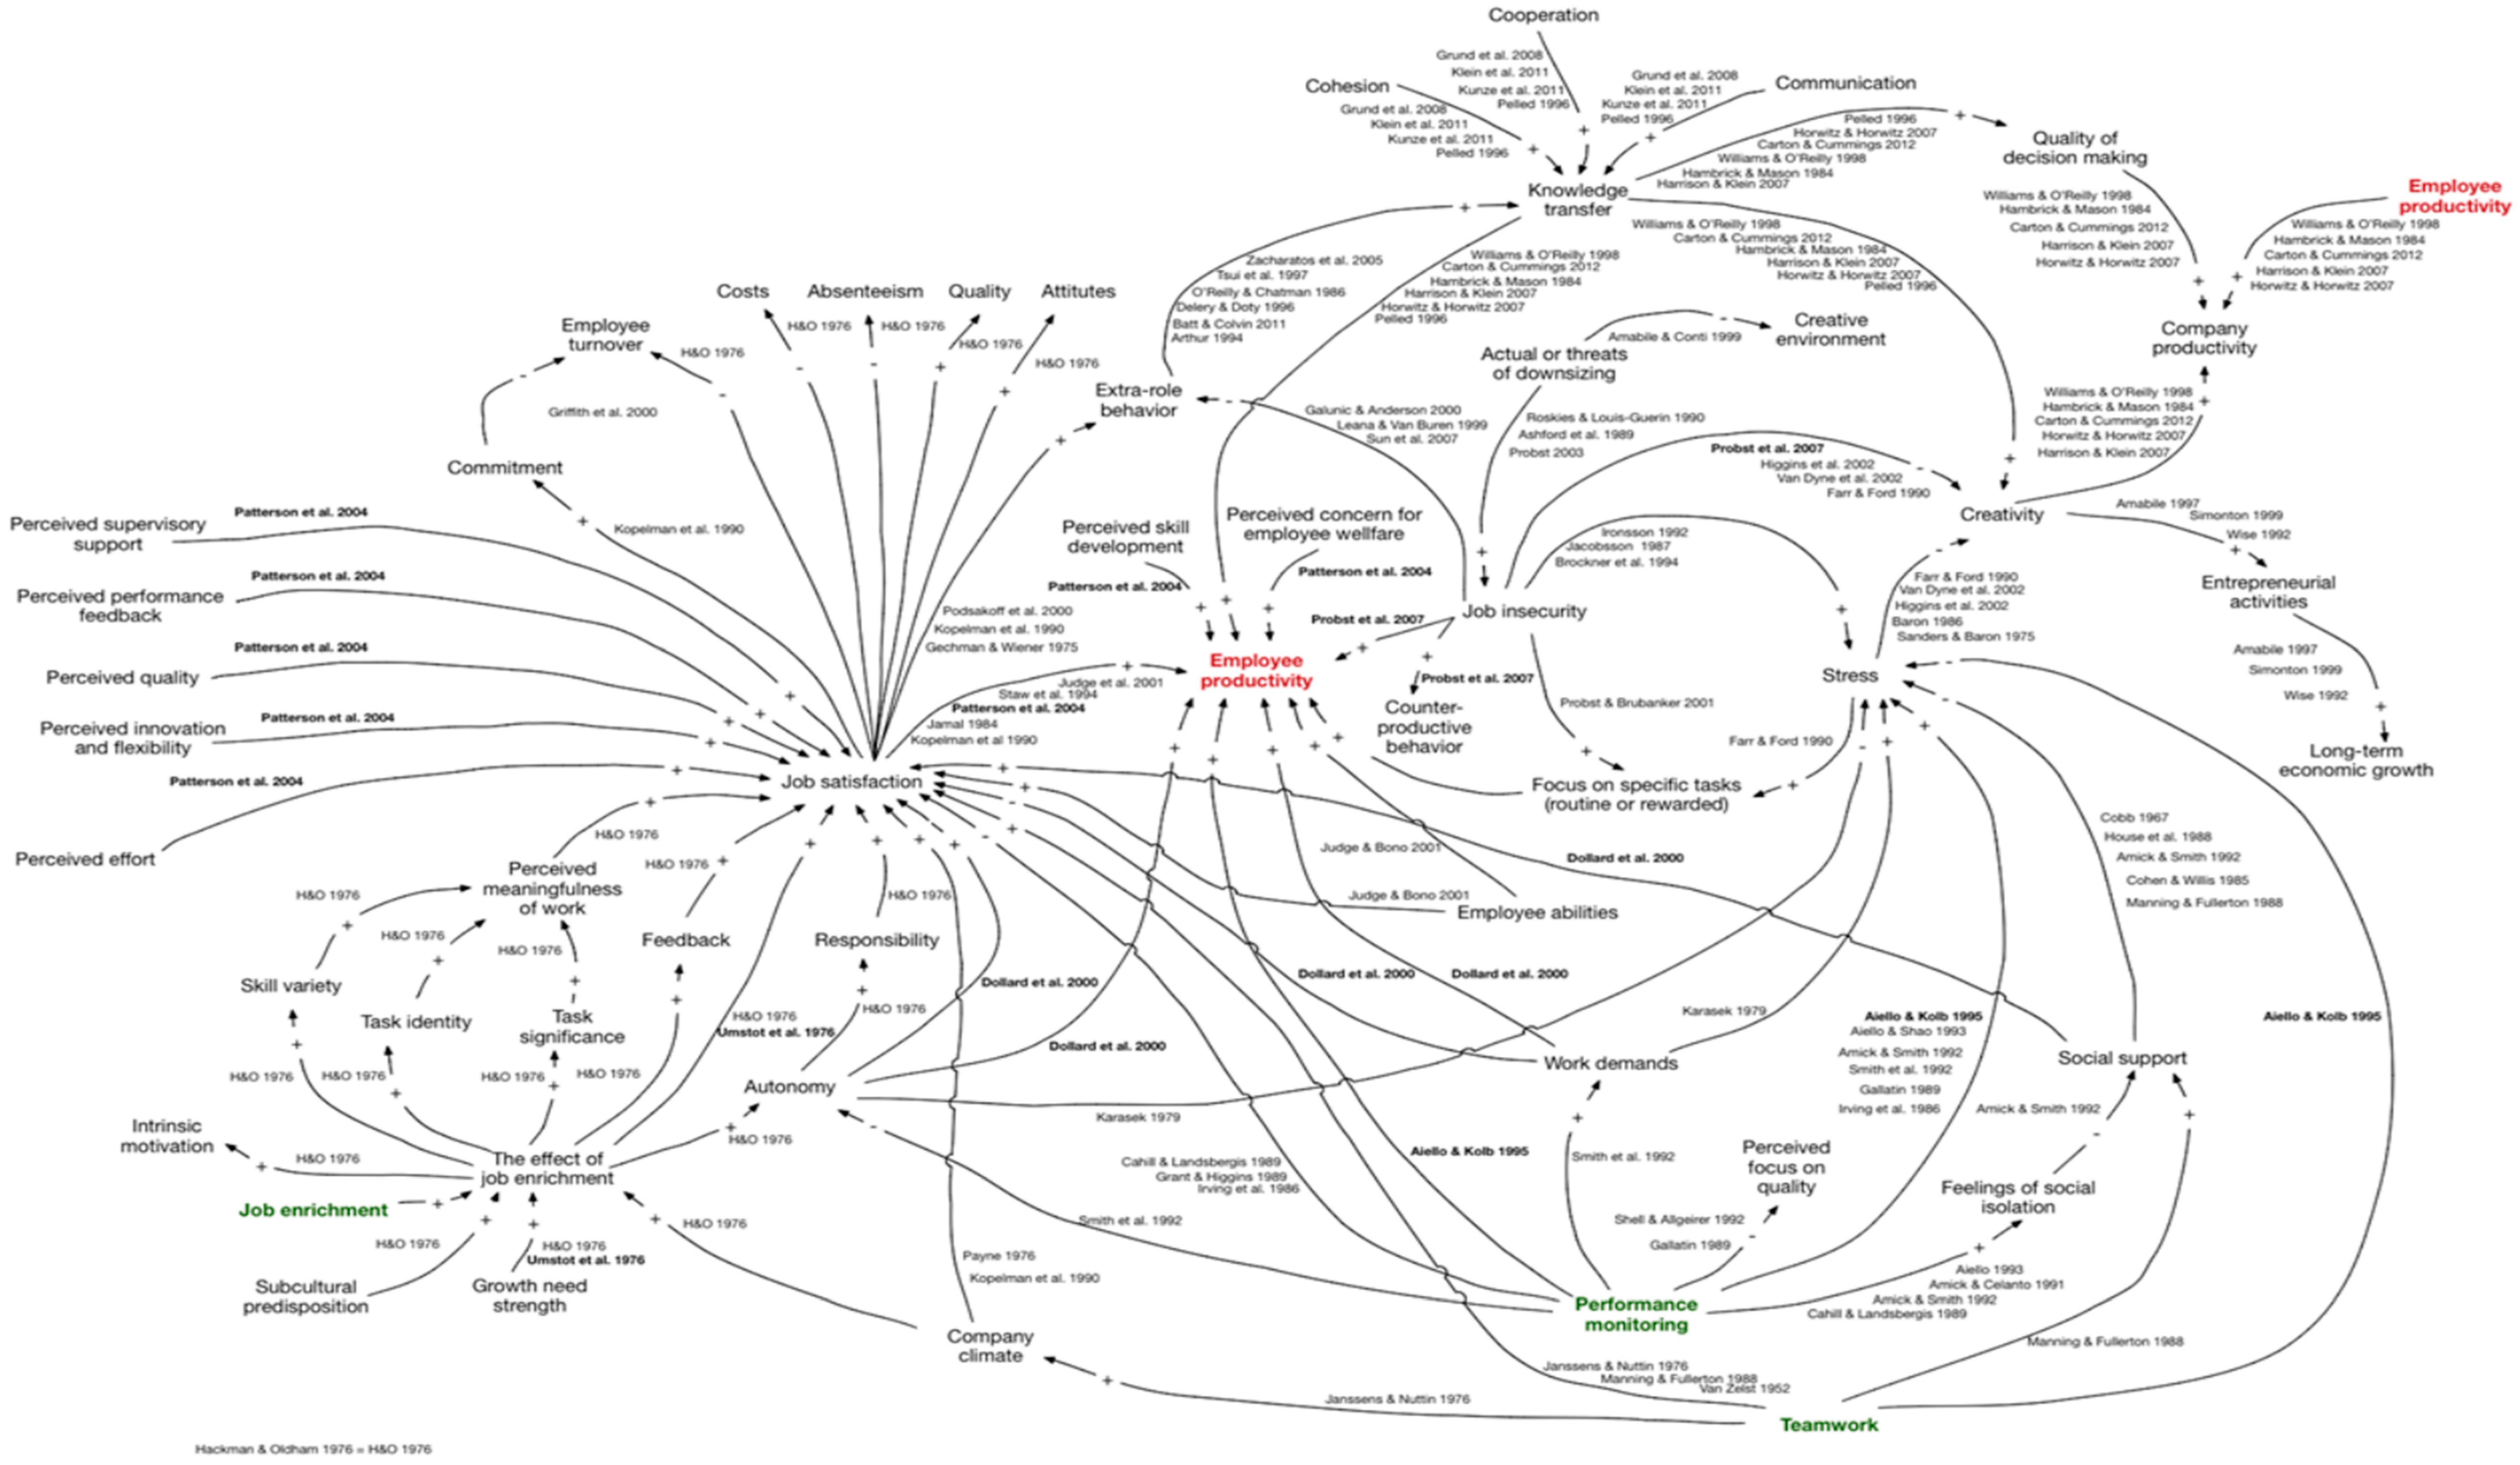
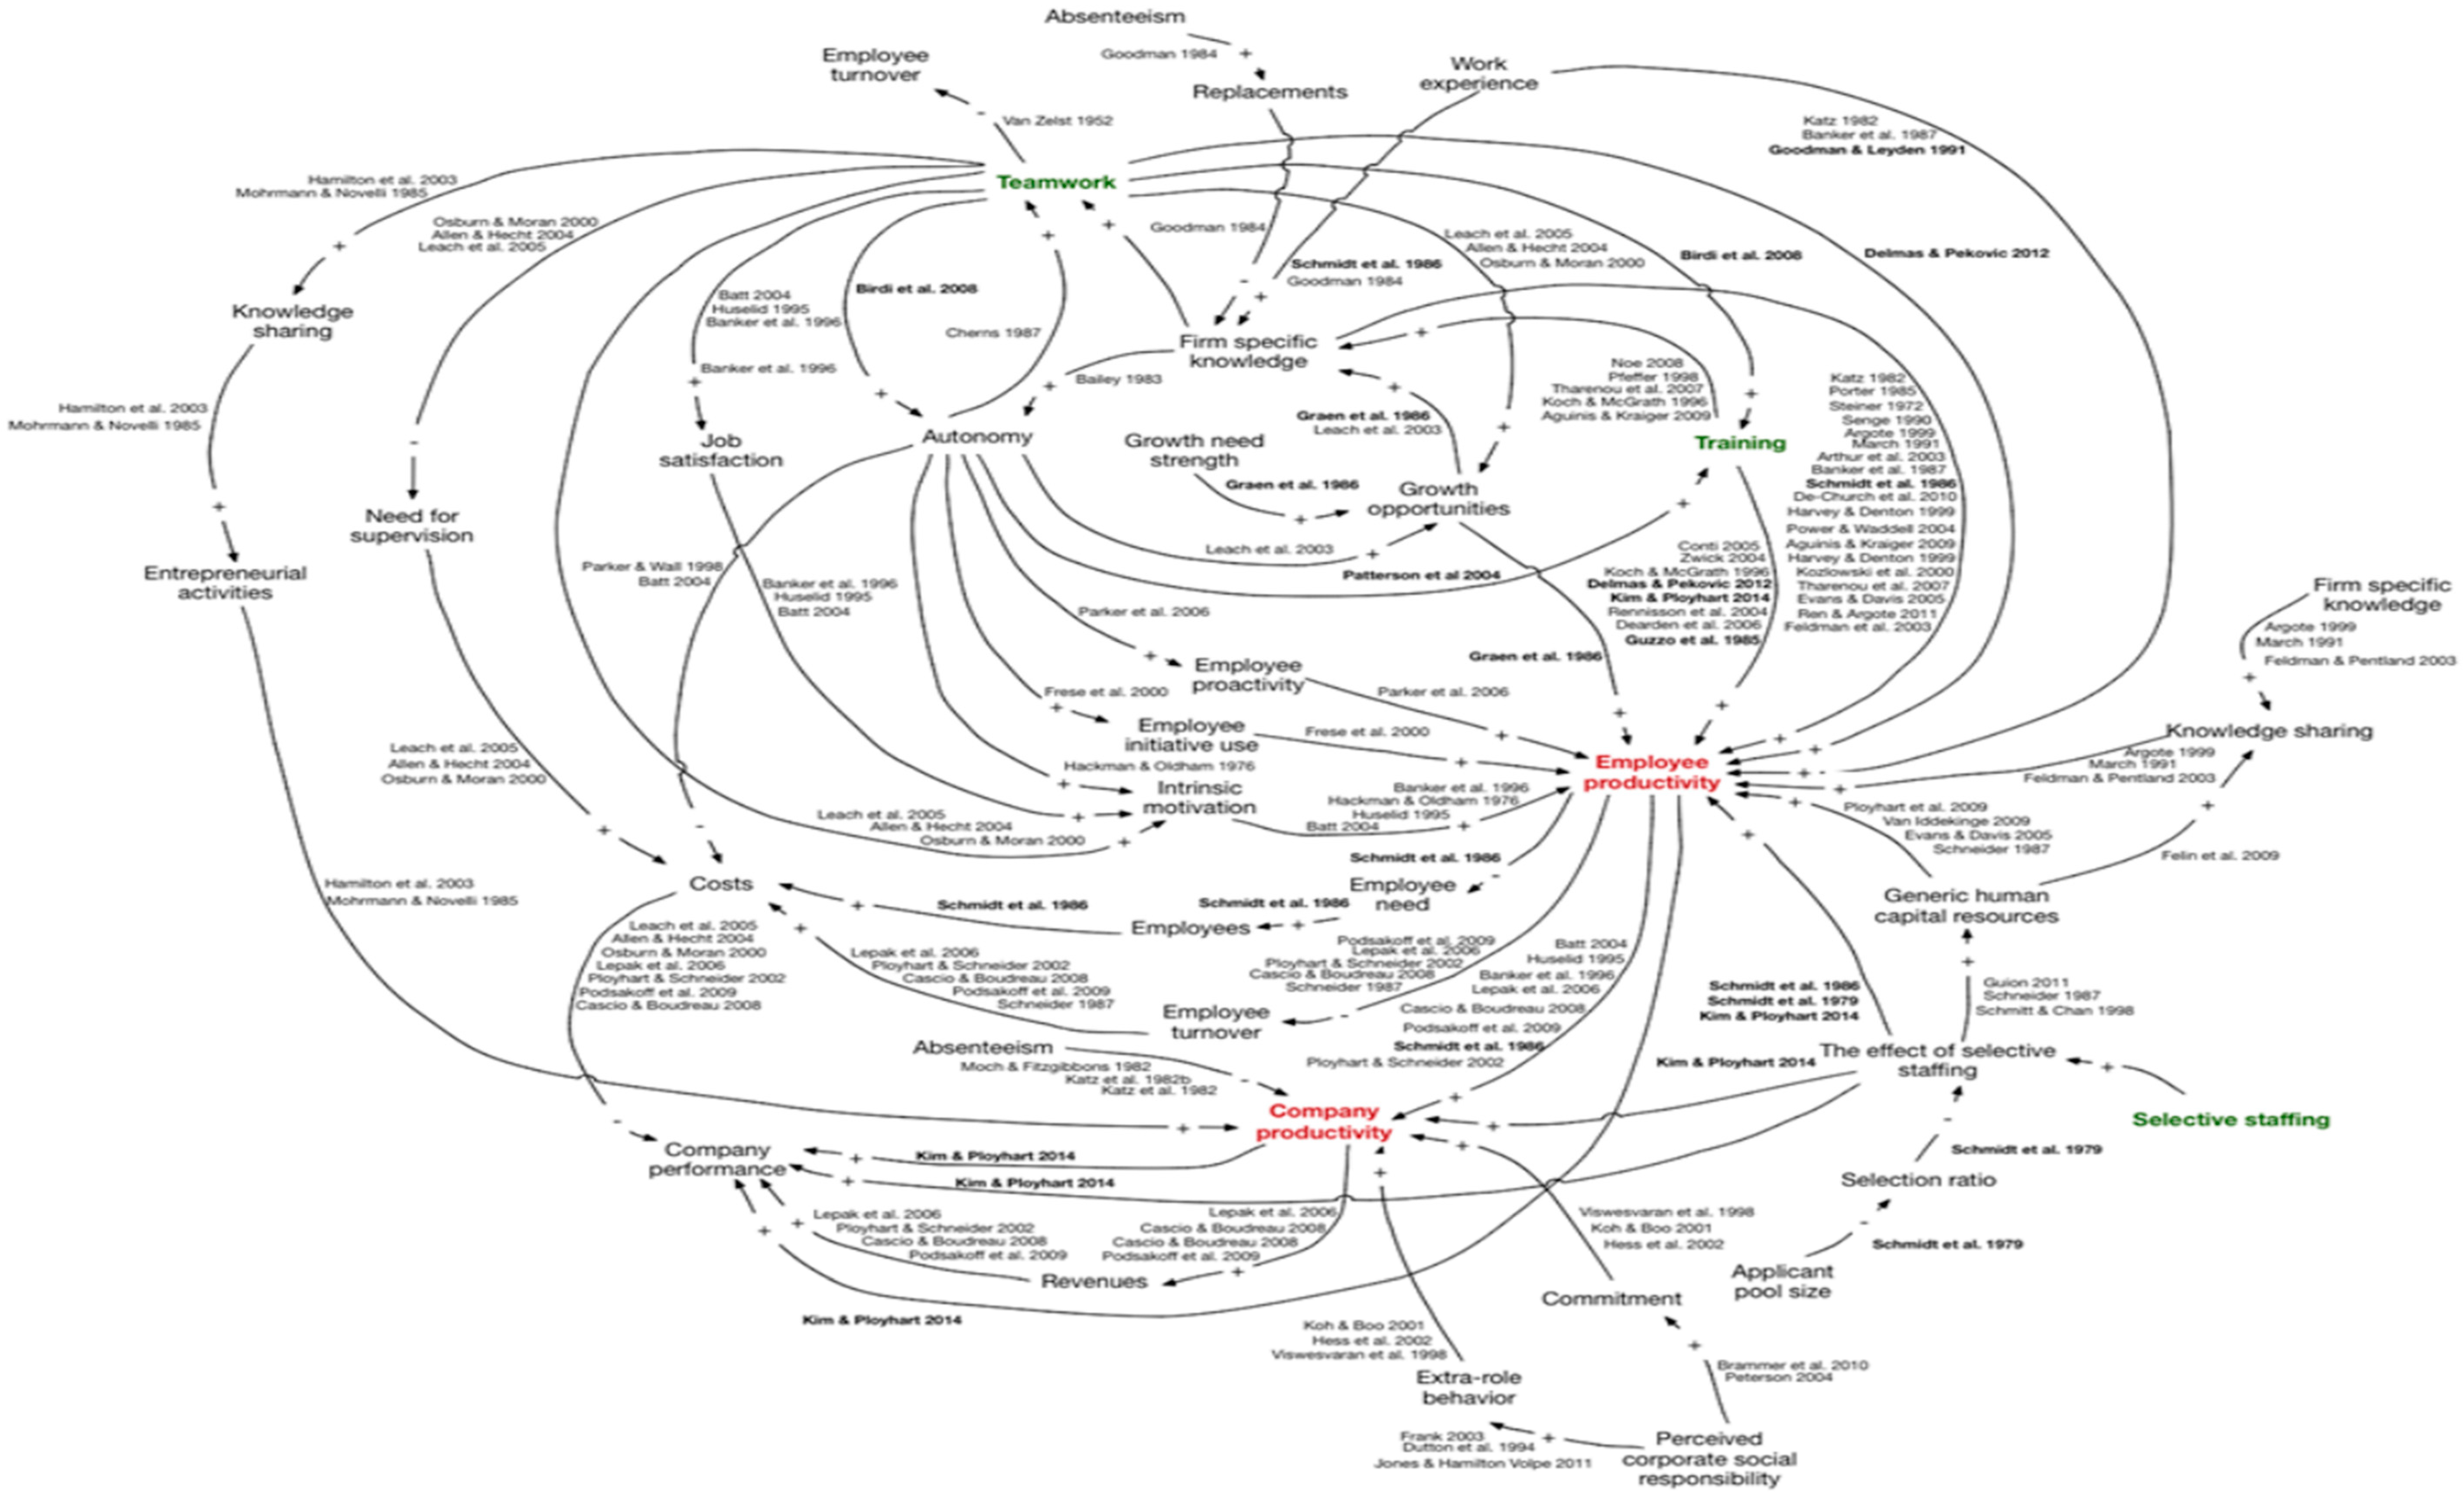
Following the item reductions, the causal relationships from the literature analysis were joined into three separate CLDs: motivation (see Figure 6 and Table 1), wellbeing (see Figure 7 and Table 2), and human resource management (see Figure 8 and Table 3). All causal relationships are marked with a reference to the relevant articles. The bold references are the 27 articles that were read as a part of this research. For each figure, there is a corresponding table that lists all items in the figure.
The complexity of these three diagrams is relatively high, making it difficult to use them to generate information about the dynamics of the system. The aim of this research is to take a step back and look at these relationships in a wider context. To be able to do that, the complexity of the system needs to be reduced by more aggressive measures. This is performed in step two of the synthesis.
4.2. Second Synthesis—Simplification
In an effort to make it easier to synthesize the diagrams further, in step two, the number of items was decreased from 84 items at the end of step one to 36 items. The item reductions were again performed either by joining similar items into one or by discarding items that were considered to have little relevance to the bigger picture.
The list of 84 items was scanned in search of items that could be joined for various reasons. Some had similar meaning or could be expected to have similar effects, and others only affected or were influenced by one other item and could therefore usually be joined with that item without forsaking any important causalities.
Some causal relationships are presented both as direct and indirect effects. In such cases, an effort was made to simplify the picture by removing the link that has less relevance to the bigger picture. There are 38 items that were merged with existing ones and these are shown in Table 4.
A link cannot be removed, however, if its removal affects other important causalities. The list was also scanned for items that add little or non-relevant information to the bigger picture and could therefore be discarded. These are: applicant pool size, commitment, employee abilities, employee need, employee turnover, employees, growth need strength, information about employee performance, perceived relative importance of task, replacements, and selection ratio.
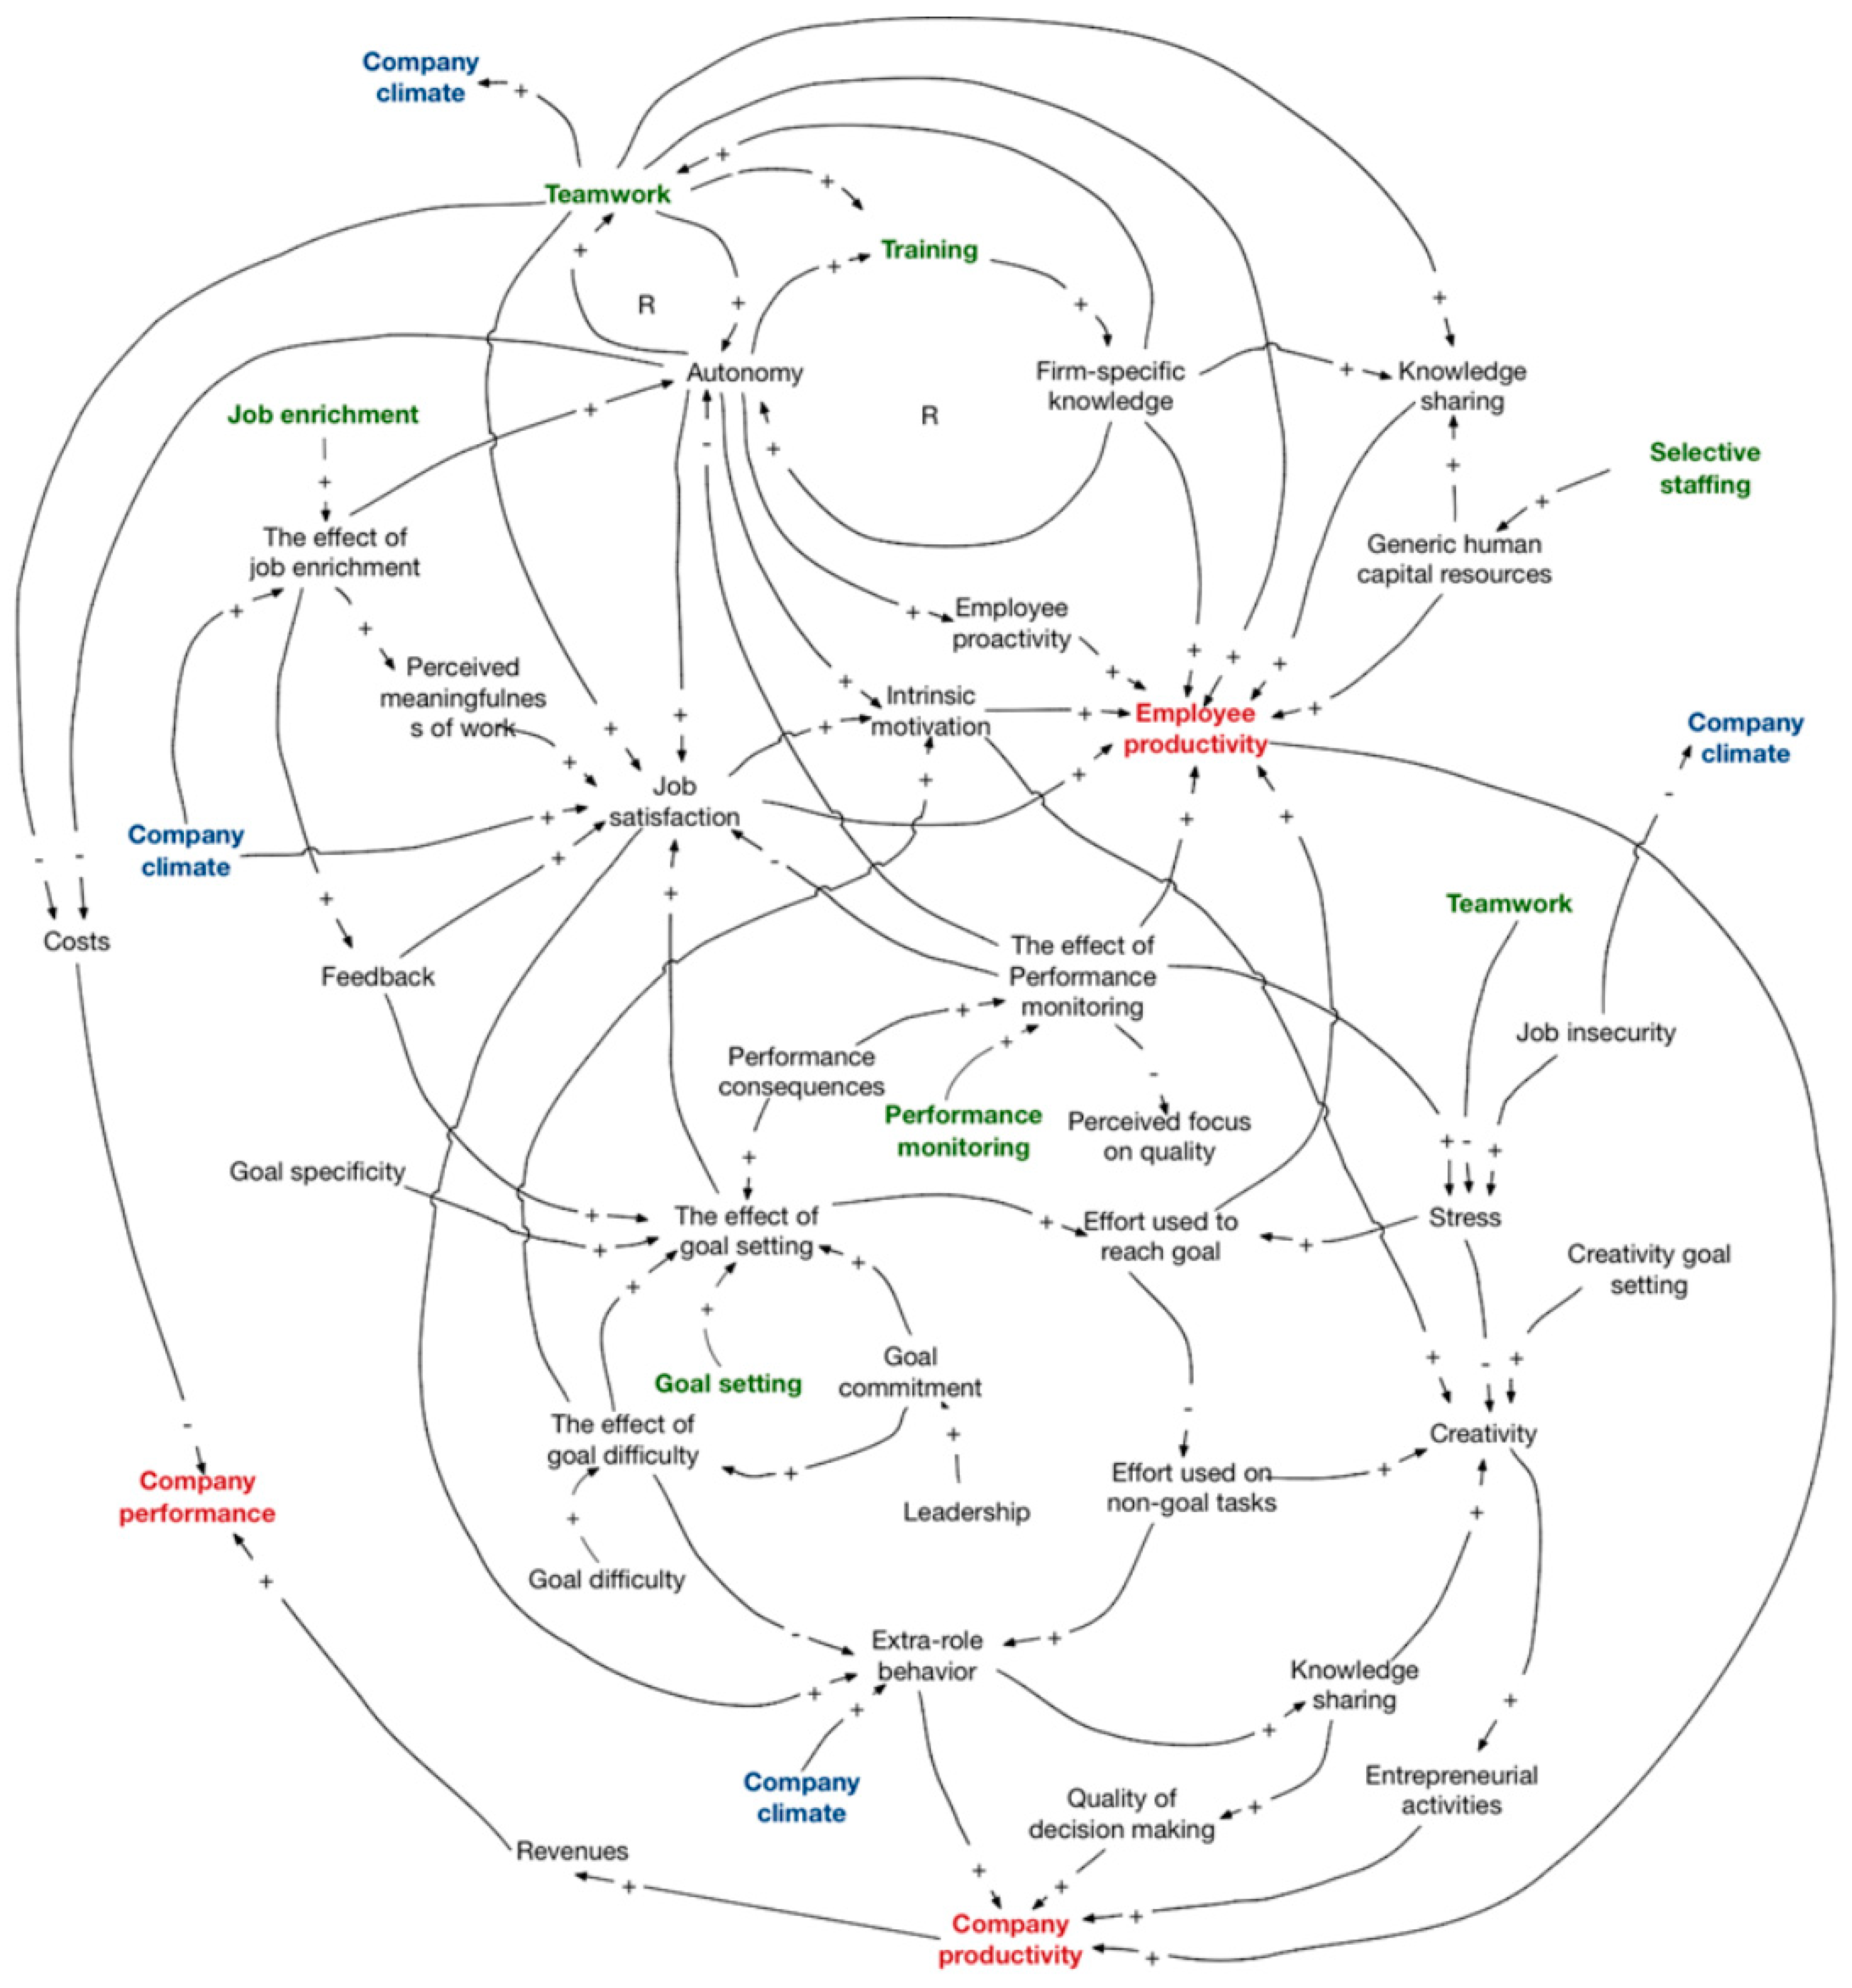
The resulting CLD is presented in Figure 9 and the items listed in Table 5. The complexity of this CLD is substantial and it presents an opportunity to obtain a bird’s eye view of the causal relationships of productivity.
At this stage, information from the I-O psychology literature has been used to construct a single diagram describing the causal relationships of productivity. A literature analysis using the method of systems analysis was used to identify relevant components according to the selected literature, and how they interact and thereupon affect productivity.
The result of this literature analysis was multiple CLDs based on causal relationships as described in the articles. Through two synthesis steps, the information from these CLDs was further consolidated to create a single CLD. During the synthesis process, empirical generalizations are made that can at a later stage be turned into theories that can be tested on different data. Although these steps in the theory-building process are outside the scope of this research, it is interesting, briefly, to reflect on the results and speculate about opportunities for future research. That is the matter of the discussion chapter that follows.
5. Discussion
The two synthesis steps resulted in a single CLD of productivity, based on the information gathered in the literature analysis. This final CLD is considerably less complex than the three CLDs resulting from the first synthesis step, and it is, therefore, more suitable for further analysis of the dynamics of the system. The final CLD can be roughly divided into the three themes used in the first synthesis step: human resource management, motivation, and wellbeing. It is not surprising that a model of productivity incorporates these themes, as they are common motives in the human resource and performance management literature (see, e.g., Combs et al. 2006). These fields of research have in their different ways considered the process of producing effective workers. Human resource management, mainly in the form of selection and training, is used to recruit and further develop employees competent enough to meet the personnel specification, created in the job description (Schuler and MacMillan 1984). To make these competent workers effective, they further need to be motivated and led in a corporate environment that fosters teamwork and a good company culture (Ogbonna and Harris 2000). The CLD resulting from the synthesis corresponds well to this process description.
Although the final CLD, describing productivity, corresponds well with the known process of producing effective workers (see, e.g., Combs et al. 2006), it has one clear advantage: it displays causal relationships and feedback. This makes it easier to track the overall effects of initiatives such as goal setting or training and trace the contributing factors of outcomes such as productivity. Mapping these causal relationships also helps in identifying the trade-offs in the system, which makes it easier to prioritize and choose the best initiative in each situation. An example of such a trade-off is the application of performance monitoring to motivate employees. Performance monitoring has been found to yield gains in terms of increased employee productivity (Larson and Callahan 1990) but at the cost of increased stress levels and less job satisfaction amongst employees (Aiello and Kolb 1995), thus potentially having a negative effect in the long run.
The result of this research, in the form of a CLD describing the causal relationships of productivity, is obviously limited by its literature foundation. The literature was selected using a systematic search only providing 27 relevant articles that nowhere near encompass the abundance of research on the topic. The result, however, seems to cover most of the major themes in the field, with some exceptions.
6. Conclusions
The objective of this research was to identify the causal relationships affecting productivity and view them in a larger context than previously presented. Through two synthesis steps, causal relationships identified in the literature were used to build a mental model of productivity, presented as a single causal-loop diagram where items are related to each other and causality between them is shown. The diagram builds on items from three main themes: wellbeing, human resource management, and motivation.
6.1. Theoretical and Managerial Implications
This work is a theoretical work building a foundation for later generating a work productivity theory. It is in its nature a very early step and deals with finding items and how they interact. The work does show that no current literature is dealing with work productivity as a whole and researchers tend to have a certain focus, often falling into one of the three themes, in the article reviewed here. The contribution to theory is the holistic view presented along with the synthesis of terms/thoughts. It shows that current research fields do line up to a coherent whole and that most of the items needed to construct a theory are known. However, this work does not end in a theory; it is only an early step that hopefully can later lead to a work productivity theory.
Though not designed to be directly applicable to managers, a certain insight can be gained from this work. The academic world is dealing with a lot of the items relevant to work productivity, but these items do not make a consistent whole. The manager can, from this work, obtain an idea of the complexity of interrelated items that affect work productivity and use that holistic picture as a guideline in their decision making.
6.2. Research Limitations
There are at least two major themes missing from the current literature review. The first is the focus on how individuals deal with their own productivity and the second is the limited presence of leadership and management. The knowledge worker is largely responsible for their own productivity (Óskarsdóttir and Oddsson 2017, #2235) (Óskarsdóttir and Oddsson 2017). The individual faces a two-folded challenge; what causes or impacts productivity and how to deal with it. The causes are many, both personal and professional and an attempt has been made to map them out (Óskarsdóttir et al. 2021). That work has then progressed towards a holistic model of the knowledge worker productivity (Óskarsdóttir et al. 2022).
Management commitment was mentioned in one article (Rodgers and Hunter 1991, #44) and leadership in another (Podsakoff et al. 1997). The effect of this otherwise thoroughly researched topic is absent in most of the selected literature on productivity, with these two exceptions. Strictly speaking, leadership and management are two different things. In general terms, management is about dealing with complexity and managing things, while leadership is about coping with change and influencing people’s behavior (Algahtani 2014). Ignoring this distinction, it seems apparent that both management and leadership play an important role in the productivity of employees (Akpoviroro et al. 2018; Chiok Foong Loke 2001; Nasution et al. 2016). Management is, in fact, the leading agent when it comes to setting standards for performance, measuring against these standards, and reacting to the results. The different methodologies present in the model, such as training, goal setting, and job enrichment all have their documented effect, but something must set their use in motion, and someone must make the decision to do so. These decision chains are rarely mentioned in the literature. That probably means that they are not considered relevant when these measures are examined in isolation, but they certainly matter if you want to look at the bigger picture.
Another factor scarcely represented in the model is economic realities. Although delivering profit is not the only purpose of an organization, being profitable is absolutely vital for its survival. Indeed, the purpose of raising productivity, by applying measures such as goal setting and training, must be to increase profit by positively affecting the top line results, and, according to the literature, these measures certainly have this effect. What is less apparent from the literature, however, is the fact that their application also costs money and thereby negatively affects profit. When viewing the causalities of productivity as a whole, and, especially when intending to use that information to make decisions, it is therefore important to take the financials into consideration. Usually, there is a limit to the amount of funds that can be allocated to human resource and performance management initiatives, so prioritizing and tailoring to circumstances becomes important. It is, therefore, necessary to take into account the cost of raising productivity, not least to ensure the efficiency and effectiveness of such efforts.
To address these gaps in the literature, an alternate, or rather, expanded, view of productivity is needed. In order to introduce the elements that were missing in the final CLD result: management, decision chains, and economic realities, further research is needed into their impact on the feedback structure of the system. Additionally, important for consideration are factors external to the firm, such as the economic environment, the political landscape, and rules and regulations that can have a positive or limiting effect on the company’s efforts to increase productivity.
6.3. Future Research
Future research can be built on the foundation laid by the one presented here. The current results were produced by making empirical generalizations that could serve as a basis for a theory of productivity in an organizational setting. The results of the current paper are only what relationships might be present. Further analysis is needed on these relationships, their intensity, their importance, their groupings, and their impact on productivity. These are all steps towards a theory of productivity in an organizational setting. The authors see at least the following possible future work, not necessarily in this order:
- Analyze the characteristics of relationships, e.g., intensity and importance.
- Group relationships.
- Analyze the effect of metrics (how productivity is defined) on the causality.
- Add missing factors, e.g., leadership, management, and economic factors to the relationship diagram.
- Evaluate the biggest factors that contribute to productivity.
- Construct the theory of work productivity.
From such a theory, hypotheses could be generated and tested. System dynamics is a tool that, using simulation models, is used to validate assumptions about the workings of a system, and, in continuation, predict future outcomes. A system dynamics model of productivity would certainly contribute profoundly to our knowledge of the topic by creating conditions for theory development and testing; thus, developing such a model will have positive implications in practice, that is, on the operation of organizations. There is, however, a long way to go before such a model can be put into service. An extended literature analysis with a focus on the missing elements that were identified is needed to finalize the CLD of productivity. Additionally, to be able to simulate the system, it is necessary to quantify the causal relationships. For some relationships in the model, statistical data are available, but, for others, further research is needed.
Supplementary Materials
The following supporting information can be downloaded at: https://www.mdpi.com/article/10.3390/admsci12030090/s1, all the CLDs along with all references.
Author Contributions
Conceptualization, I.Ý.G. and G.V.O.; methodology, I.Ý.G. and G.V.O.; formal analysis, I.Ý.G.; validation, G.V.O.; writing—original draft preparation, I.Ý.G.; writing—review and editing, G.V.O.; visualization, I.Ý.G.; supervision, G.V.O. All authors have read and agreed to the published version of the manuscript.
Funding
This research received no external funding.
Institutional Review Board Statement
Not applicable.
Informed Consent Statement
Not applicable.
Data Availability Statement
Not applicable.
Conflicts of Interest
The authors declare no conflict of interest.
Appendix A

Table A1.
The 27 articles used in the research.
| Author(s) (year) | Author(s) (year) |
|---|---|
| De Meulenaere et al. (2016) | Larson and Callahan (1990) |
| Kim and Ployhart (2014) | Graen et al. (1986) |
| Delmas and Pekovic (2013) | Schmidt et al. (1986) |
| Birdi et al. (2008) | Guzzo et al. (1985) |
| Grant (2008) | Latham and Saari (1982) |
| Probst et al. (2007) | Schmidt et al. (1979) |
| Patterson et al. (2004) | Kazanas (1978) |
| Dollard et al. (2000) | Schein et al. (1977) |
| Podsakoff et al. (1997) | Kim and Hamner (1976) |
| Aiello and Kolb (1995) | Umstot et al. (1976) |
| Wright et al. (1993) | Latham and Locke (1975) |
| Goodman and Leyden (1991) | Weinstein and Holzbach (1973) |
| Rodgers and Hunter (1991) | Rothe (1970) |
| Shalley (1991) |
References
- Aiello, John R., and Kathryn J. Kolb. 1995. Electronic performance monitoring and social-context—Impact on productivity and stress. Journal of Applied Psychology 80: 339–53. [Google Scholar] [CrossRef] [PubMed]
- Akpoviroro, Kowo Solomon, Bola Kadiri, and Sabitu Olalekan Owotutu. 2018. Effect of participative leadership style on employee’s productivity. International Journal of Economic Behavior (IJEB) 8: 47–60. [Google Scholar]
- Algahtani, Ali. 2014. Are leadership and management different? A review. Journal of Management Policies and Practices 2: 71–82. [Google Scholar] [CrossRef]
- Arnold, Ross D., and Jon P. Wade. 2015. A Definition of Systems Thinking: A Systems Approach. Procedia Computer Science 44: 669–78. [Google Scholar] [CrossRef] [Green Version]
- Arthur, Jeffrey B. 1994. Effects of human-resource systems on manufacturing performance and turnover. Academy of Management Journal 37: 670–87. [Google Scholar] [CrossRef]
- Batt, Rosemary, and Alexander J. S. Colvin. 2011. An employment systems approach to turnover: Human resources practices, quits, dismissals, and performance. Academy of Management Journal 54: 695–717. [Google Scholar] [CrossRef]
- Bell, Suzanne T., Anton J. Villado, Marc A. Lukasik, Larisa Belau, and Andrea L. Briggs. 2011. Getting Specific about Demographic Diversity Variable and Team Performance Relationships: A Meta-Analysis. Journal of Management 37: 709–43. [Google Scholar] [CrossRef]
- Birdi, Kamal, Chris Clegg, Malcolm Patterson, Andrew Robinson, Chris B. Stride, Toby D. Wall, and Stephen J. Wood. 2008. The impact of human resource and operational management practices on company productivity: A longitudinal study. Personnel Psychology 61: 467–501. [Google Scholar] [CrossRef]
- Boehm, Stephan A., David J. G. Dwertmann, Florian Kunze, Bjoern Michaelis, Kizzy M. Parks, and Daniel P. McDonald. 2014. Expanding Insights on the Diversity Climate-Performance Link: The Role of Workgroup Discrimination and Group Size. Human Resource Management 53: 379–402. [Google Scholar] [CrossRef] [Green Version]
- Carton, Andrew M., and Jonathon N. Cummings. 2012. A Theory of Subgroups in Work Teams. Academy of Management Review 37: 441–70. [Google Scholar] [CrossRef]
- Chadwick, Clint, Sean A. Way, Gerry Kerr, and James W. Thacker. 2013. Boundary Conditions of the High-Investment Human Resource Systems-Small-Firm Labor Productivity Relationship. Personnel Psychology 66: 311–43. [Google Scholar] [CrossRef]
- Cherrington, David J., Spencer J. Condie, and J. Lynn England. 1979. Age and work values. Academy of Management Journal 22: 617–23. [Google Scholar] [CrossRef]
- Chiok Foong Loke, Jennifer. 2001. Leadership behaviours: Effects on job satisfaction, productivity and organizational commitment. Journal of Nursing Management 9: 191–204. [Google Scholar] [CrossRef] [PubMed]
- Combs, James, Yongmei Liu, Angela Hall, and David Ketchen. 2006. How much do high-performance work practices matter? A meta-analysis of their effects on organizational performance. Personnel Psychology 59: 501–28. [Google Scholar] [CrossRef]
- De Meulenaere, Kim, Christophe Boone, and Tine Buyl. 2016. Unraveling the impact of workforce age diversity on labor productivity: The moderating role of firm size and job security. Journal of Organizational Behavior 37: 193–212. [Google Scholar] [CrossRef]
- Delery, John E., and D. Harold Doty. 1996. Modes of theorizing in strategic human resource management: Tests of universalistic, contingency, and configurational performance predictions. Academy of Management Journal 39: 802–35. [Google Scholar] [CrossRef]
- Delmas, Magali A., and Sanja Pekovic. 2013. Environmental standards and labor productivity: Understanding the mechanisms that sustain sustainability. Journal of Organizational Behavior 34: 230–52. [Google Scholar] [CrossRef] [Green Version]
- Dollard, Maureen F., Helen R. Winefield, Anthony H. Winefield, and Jan De Jonge. 2000. Psychosocial job strain and productivity in human service workers: A test of the demand-control-support model. Journal of Occupational and Organizational Psychology 73: 501–10. [Google Scholar] [CrossRef] [Green Version]
- Drucker, Peter F. 1999. Knowledge-worker productivity: The biggest challenge. California Management Review 41: 79–94. [Google Scholar] [CrossRef]
- Galunic, D. Charles, and Erin Anderson. 2000. From security to mobility: Generalized investments in human capital and agent commitment. Organization Science 11: 1–20. [Google Scholar] [CrossRef]
- Goodman, Paul S., and Dennis P. Leyden. 1991. Familiarity and group productivity. Journal of Applied Psychology 76: 578–86. [Google Scholar] [CrossRef]
- Graen, George B., Terri A. Scandura, and Michael R. Graen. 1986. A field experimental test of the moderating effects of growth need strength on productivity. Journal of Applied Psychology 71: 484–91. [Google Scholar] [CrossRef]
- Grant, Adam M. 2008. Does intrinsic motivation fuel the prosocial fire? Motivational synergy in predicting persistence, performance, and productivity. Journal of Applied Psychology 93: 48–58. [Google Scholar] [CrossRef] [PubMed] [Green Version]
- Grund, Christian, and Niels Westergaard-Nielsen. 2008. Age structure of the workforce and firm performance. International Journal of Manpower 29: 410–22. [Google Scholar] [CrossRef] [Green Version]
- Guzzo, Richard A., Richard D. Jette, and Raymond A. Katzell. 1985. The effects of psychologically based intervention programs on worker productivity—A meta-analysis. Personnel Psychology 38: 275–91. [Google Scholar] [CrossRef]
- Hambrick, Donald C., and Phyllis A. Mason. 1984. Upper echelons—The organization as a reflection of its top managers. Academy of Management Review 9: 193–206. [Google Scholar] [CrossRef]
- Haraldsson, Hördur V. 2000. Introduction to systems and causal loop diagrams. In System Dynamic Course. Lumes: Lund University. [Google Scholar]
- Harrison, David A., and Katherine J. Klein. 2007. What’s the difference? Diversity constructs as separation, variety, or disparity in organizations. Academy of Management Review 32: 1199–228. [Google Scholar] [CrossRef] [Green Version]
- Hopp, Wallace J., Seyed M. R. Iravani, and Fang Liu. 2009. Managing White-Collar Work: An Operations-Oriented Survey. Production and Operations Management 18: 1–33. [Google Scholar] [CrossRef]
- Horn, John L., and Raymond B. Cattell. 1967. Age differences in fluid and crystallized intelligence. Acta Psychologica 26: 107–29. [Google Scholar] [CrossRef]
- Horwitz, Sujin K., and Irwin B. Horwitz. 2007. The effects of team diversity on team outcomes: A meta-analytic review of team demography. Journal of Management 33: 987–1015. [Google Scholar] [CrossRef]
- Kazanas, H. C. 1978. Relationship of job satisfaction and productivity to work values of vocational-education graduates. Journal of Vocational Behavior 12: 155–64. [Google Scholar] [CrossRef]
- Kim, Jay S., and W. Clay Hamner. 1976. Effect of performance feedback and goal setting on productivity and satisfaction in an organizational setting. Journal of Applied Psychology 61: 48–57. [Google Scholar] [CrossRef]
- Kim, Youngsang, and Robert E. Ployhart. 2014. The Effects of Staffing and Training on Firm Productivity and Profit Growth Before, During, and After the Great Recession. Journal of Applied Psychology 99: 361–89. [Google Scholar] [CrossRef] [PubMed]
- Kitchenham, Barbara A. 2004. Procedures for Performing Systematic Reviews. NICTA Technical Report 400011T.1. Keele: Keele University. [Google Scholar]
- Klein, Katherine J., and David A. Harrison. 2007. On the diversity of diversity: Tidy logic, messier realities. Academy of Management Perspectives 21: 26–33. [Google Scholar] [CrossRef]
- Klein, Katherine J., Andrew P. Knight, Jonathan C. Ziegert, Beng Chong Lim, and Jessica L. Saltz. 2011. When team members’ values differ: The moderating role of team leadership Preface. Organizational Behavior and Human Decision Processes 114: 25–36. [Google Scholar] [CrossRef]
- Kunze, Florian, Stephan A. Boehm, and Heike Bruch. 2011. Age diversity, age discrimination climate and performance consequences-a cross organizational study. Journal of Organizational Behavior 32: 264–90. [Google Scholar] [CrossRef] [Green Version]
- Larson, James R., and Christine Callahan. 1990. Performance monitoring—How it affects work productivity. Journal of Applied Psychology 75: 530–38. [Google Scholar] [CrossRef]
- Latham, Gary P., and Edwin A. Locke. 1975. Increasing productivity with decreasing time limits—Field replication of parkinsons law. Journal of Applied Psychology 60: 524–26. [Google Scholar] [CrossRef]
- Latham, Gary P., and Lise M. Saari. 1982. The importance of union acceptance for productivity improvement through goal setting. Personnel Psychology 35: 781–87. [Google Scholar] [CrossRef]
- Leana, Carrie R., III, and Harry J. Van Buren. 1999. Organizational social capital and employment practices. Academy of Management Review 24: 538–55. [Google Scholar] [CrossRef]
- Nasution, Ade Parluangan, Ponco Bambang Mahargiono, and Yoyok Soesatyo. 2016. Effect of leadership styles, organizational climate and ethos of work on employee productivity (PT. HP Metals Indonesia the Powder Coating). International Journal of Business and Management 11: 262. [Google Scholar] [CrossRef]
- Ogbonna, Emmanuel, and Lloyd C Harris. 2000. Leadership style, organizational culture and performance: Empirical evidence from UK companies. International Journal of Human Resource Management 11: 766–88. [Google Scholar] [CrossRef]
- O’Reilly, Charles A., and Jennifer Chatman. 1986. Organizational commitment and psychological attachment—The effects of compliance, identification, and internalization on pro-social behavior. Journal of Applied Psychology 71: 492–99. [Google Scholar] [CrossRef]
- Óskarsdóttir, Helga Guðrún, and Guðmundur Valur Oddsson. 2017. A Soft Systems Approach to Knowledge Worker Productivity–Analysis of the Problem Situation. Economies 5: 28. [Google Scholar] [CrossRef] [Green Version]
- Óskarsdóttir, Helga Guðrún, Guðmundur Valur Oddsson, Jón Þór Sturluson, and Rögnvaldur Jóhann Sæmundsson. 2021. A Soft Systems Approach to Knowledge Worker Productivity: A Purposeful Activity Model for the Individual. Administrative Sciences 11: 110. [Google Scholar] [CrossRef]
- Óskarsdóttir, Helga Guðrún, Guðmundur Valur Oddsson, Jón Þór Sturluson, and Rögnvaldur Jóhann Sæmundsson. 2022. Towards a Holistic Framework of Knowledge Worker Productivity. Administrative Sciences 12: 50. [Google Scholar] [CrossRef]
- Parry, Emma, and Peter Urwin. 2011. Generational Differences in Work Values: A Review of Theory and Evidence. International Journal of Management Reviews 13: 79–96. [Google Scholar] [CrossRef]
- Patterson, Malcolm, Peter Warr, and Michael West. 2004. Organizational climate and company productivity: The role of employee affect and employee level. Journal of Occupational and Organizational Psychology 77: 193–216. [Google Scholar] [CrossRef] [Green Version]
- Pelled, Lisa Hope. 1996. Demographic diversity, conflict, and work group outcomes: An intervening process theory. Organization Science 7: 615–31. [Google Scholar] [CrossRef]
- Pfeffer, Jeffrey, and Yinon Cohen. 1984. Determinants of internal labor-markets in organizations. Administrative Science Quarterly 29: 550–72. [Google Scholar] [CrossRef]
- Podsakoff, Philip M., Scott B. MacKenzie, and Michael Ahearne. 1997. Moderating effects of goal acceptance on the relationship between group cohesiveness and productivity. Journal of Applied Psychology 82: 974–83. [Google Scholar] [CrossRef]
- Probst, Tahira M., Susan M. Stewart, Melissa L. Gruys, and Bradley W. Tierney. 2007. Productivity, counterproductivity and creativity: The ups and downs of job insecurity. Journal of Occupational and Organizational Psychology 80: 479–97. [Google Scholar] [CrossRef]
- Rodgers, Robert, and John E Hunter. 1991. Impact of management by objectives on organizational productivity. Journal of Applied Psychology 76: 322. [Google Scholar] [CrossRef]
- Rothe, Harold F. 1970. Output rates among welders—Productivity and consistency following removal of a financial incentive system. Journal of Applied Psychology 54: 549. [Google Scholar] [CrossRef]
- Schein, Virginia E., Elizabeth H. Maurer, and Jan F. Novak. 1977. Impact of flexible working hours on productivity. Journal of Applied Psychology 62: 463–65. [Google Scholar] [CrossRef]
- Schmidt, Frank L., John E. Hunter, Alice N. Outerbridge, and Marvin H. Trattner. 1986. The economic-impact of job selection methods on size, productivity, and payroll costs of the federal work force—An empirically based demonstration. Personnel Psychology 39: 1–29. [Google Scholar] [CrossRef]
- Schmidt, Frank L., John E. Hunter, Robert C. McKenzie, and Tressie W. Muldrow. 1979. Impact of valid selection procedures on work-force productivity. Journal of Applied Psychology 64: 609–26. [Google Scholar] [CrossRef]
- Schuler, Randall S, and Ian C MacMillan. 1984. Gaining competitive advantage through human resource management practices. Human Resource Management 23: 241–55. [Google Scholar] [CrossRef]
- Shalley, Christina E. 1991. Effects of productivity goals, creativity goals, and personal discretion on individual creativity. Journal of Applied Psychology 76: 179–85. [Google Scholar] [CrossRef]
- Sterman, John. 2000. Business Dynamics: Systems Thinking and Modeling for a Complex World. Huntersville: Irwin, New York: McGraw-Hill. [Google Scholar]
- Sun, Li-Yun, Samuel Aryee, and Kenneth S. Law. 2007. High-performance human resource practices, citizenship behavior, and organizational performance: A relational perspective. Academy of Management Journal 50: 558–77. [Google Scholar] [CrossRef]
- Tajfel, Henri, and John C Turner. 1979. An integrative theory of intergroup conflict. The Social Psychology of Intergroup Relations 33: 74. [Google Scholar]
- Tsui, Anne S., Jone L. Pearce, Lyman W. Porter, and Angela M. Tripoli. 1997. Alternative approaches to the employee-organization relationship: Does investment in employees pay off? Academy of Management Journal 40: 1089–121. [Google Scholar] [CrossRef]
- Umstot, Denis D., Cecil H. Bell, and Terence R. Mitchell. 1976. Effects of job enrichment and task goals on satisfaction and productivity—Implications for job design. Journal of Applied Psychology 61: 379–94. [Google Scholar] [CrossRef]
- Wagner, David. 2007. Managing an age-diverse work force. Mit Sloan Management Review 48: 9. [Google Scholar]
- Weinstein, Alan G., and Robert L. Holzbach. 1973. Impact of individual differences, reward distribution, and task structure on productivity in a simulated work environment. Journal of Applied Psychology 58: 296–301. [Google Scholar] [CrossRef]
- Williams, Katherine Y., and Charlies A. O’Reilly. 1998. Demography and diversity in organizations: A review of 40 years of research. Research in Organizational Behavior 20: 77–140. [Google Scholar]
- Wright, Patrick M., Jennifer M. George, S. Regena Farnsworth, and Gary C. McMahan. 1993. Productivity and extra-role behavior—The effects of goals and incentives on spontaneous helping. Journal of Applied Psychology 78: 374–81. [Google Scholar] [CrossRef]
- Zacharatos, Anthea, Julian Barling, and Roderick D. Iverson. 2005. High-performance work systems and occupational safety. Journal of Applied Psychology 90: 77–93. [Google Scholar] [CrossRef]
Figure 1.
The three stages of the research process.

Figure 2.
A visual representation of the relationship between system thinking, system analysis, and system dynamics, based on (Haraldsson 2000).
Figure 2.
A visual representation of the relationship between system thinking, system analysis, and system dynamics, based on (Haraldsson 2000).

Figure 3.
An example of a causal loop diagram with positive and negative relationships between variables, based on (Haraldsson 2000; Sterman 2000).
Figure 3.
An example of a causal loop diagram with positive and negative relationships between variables, based on (Haraldsson 2000; Sterman 2000).

Figure 4.
Authors drawing of the causal relationships from the literature of De Meulenaere et al. (2016).
Figure 4.
Authors drawing of the causal relationships from the literature of De Meulenaere et al. (2016).

Figure 5.
Authors drawing of the causal relationships from the results of De Meulenaere et al. (2016).
Figure 5.
Authors drawing of the causal relationships from the results of De Meulenaere et al. (2016).

Figure 6.
Motivation CLD from synthesis step 1.

Figure 7.
Wellbeing CLD from synthesis step 1.

Figure 8.
HR management CLD from synthesis step 1.

Figure 9.
The final result: the synthesis step 2 CLD describing the causalities of employee productivity in an organizational setting.
Figure 9.
The final result: the synthesis step 2 CLD describing the causalities of employee productivity in an organizational setting.

Table 1.
Items in on the motivation theme.
| Item | Item | Item |
|---|---|---|
| Absenteeism | Entrepreneurial activities | Non-goal performance |
| Autonomy | Extra-role behavior | Perceived relative importance of task |
| Creativity | Performance monitoring | Perceived likelihood of reward |
| Goal difficulty | Financial incentives | Effort used on non-goal tasks |
| Goal setting | Strategy development | Effort used to reach goals |
| Goal specificity | Company productivity | Information about employee performance |
| Employee abilities | Employee productivity | The effect of performance monitoring |
| Feedback | Creativity goal setting | Contingency of performance consequences |
| Leadership | Total commitment | Effort used on creativity |
| Persistence | Job satisfaction | Intrinsic motivation |
Table 2.
Items in on the wellbeing theme.
| Item | Item | Item |
|---|---|---|
| Skill variety | Perceived quality | Perceived supervisory support |
| Feedback | Perceived effort | Perceived performance feedback |
| Responsibility | Intrinsic motivation | Perceived innovation and flexibility |
| Autonomy | Job enrichment | Perceived meaningfulness of work |
| Teamwork | Commitment | Growth need strength |
| Social support | Employee abilities | Focus on specific tasks (routine or rewarded) |
| Stress | Work demands | Perceived skill development |
| Costs | Employee productivity | Perceived concern for employee welfare |
| Absenteeism | Extra-role behavior | Actual or threats of downsizing |
| Quality | knowledge transfer | Subcultural predisposition |
| Attitudes | Company productivity | Performance monitoring |
| Cohesion | Employee productivity | Perceived focus on quality |
| Cooperation | Task identity | Fallings of social isolation |
| Communication | Task significance | Counter-productive behavior |
| Job insecurity | Company climate | Quality of decision making |
| Creativity | Creative environment | Long term economic growth |
| Job satisfaction | Employee turnover | Entrepreneurial activities |
Table 3.
Items in Figure 8 on the human resource theme.
Table 3.
Items in Figure 8 on the human resource theme.
| Item | Item | Item |
|---|---|---|
| Absenteeism | Employee turnover | Need for supervision |
| Replacements | Company performance | Knowledge sharing |
| Work experience | Company productivity | Entrepreneurial activities |
| Teamwork | Employee turnover | Perceived corporate social responsibility |
| Autonomy | Intrinsic motivation | Selection ratio |
| Job satisfaction | Employee initiative use | Selective staffing |
| Costs | Employee proactivity | Absenteeism |
| Revenues | Employee productivity | Generic human capital resources |
| Employees | Extra-role behavior | Knowledge sharing |
| Commitment | Applicant pool size | Firm specific knowledge |
| Training | Growth opportunities | Growth need strength |
Table 4.
Items in on the synthesized CLD that have incorporated other items.
| Joined Item Name | Previous Item Names |
|---|---|
| Job insecurity | Actual or threats of downsizing |
| Employee proactivity | Employee initiative use |
| Effort used on non-goal tasks | Effort used on creativity and non-goal task performance |
| Teamwork | Cohesion, communication, cooperation, feelings of social isolation, and social support |
| Performance consequences | Contingency of performance consequences, financial incentive and perceived likelihood of performance reward |
| Employee productivity | Counterproductive behavior, absenteeism, attitudes Persistence, quality, and strategy development |
| Company climate | Creative environment, perceived concern for employee welfare, perceived corporate social responsibility, perceived effort, perceived innovation and flexibility, perceived performance feedback, perceived quality, perceived skill development, perceived supervisory support, and subcultural predisposition |
| Firm-specific knowledge | Work experience |
| Effort used to reach goal | Focus on specific tasks (routine or rewarded) |
| Training | Growth opportunities |
| Company performance | Long-term economic growth |
| Autonomy | Need for supervision and responsibility |
| Perceived meaningfulness of work | Skill variety, task identity, and task significance |
| The effect of performance monitoring | Work demands |
Table 5.
Items in Figure 9 on the synthesized CLD.
Table 5.
Items in Figure 9 on the synthesized CLD.
| Item | Item | Item |
|---|---|---|
| Autonomy | Extra-role behavior | Company performance |
| Company climate | Creativity goal setting | Company productivity |
| Goal setting | Firm-specific knowledge | Perceived focus on quality |
| Feedback | Selective staffing | Perceived meaningfulness of work |
| Costs | Goal commitment | Performance consequences |
| Creativity | Knowledge sharing | Performance monitoring |
| Revenues | Goal specificity | Quality of decision making |
| Stress | Intrinsic motivation | Generic human capital resources |
| Teamwork | Job enrichment | Effort used to reach goal |
| Training | Job insecurity | Employee productivity |
| Leadership | Job satisfaction | Entrepreneurial activities |
| Goal difficulty | Employee proactivity | Effort used on non-goal tasks |
Publisher’s Note: MDPI stays neutral with regard to jurisdictional claims in published maps and institutional affiliations. |
© 2022 by the authors. Licensee MDPI, Basel, Switzerland. This article is an open access article distributed under the terms and conditions of the Creative Commons Attribution (CC BY) license (https://creativecommons.org/licenses/by/4.0/).
Share and Cite
MDPI and ACS Style
Guðbrandsdóttir, I.Ý.; Oddsson, G.V. Productivity in an Organizational Setting: A Systematic View of the Causalities at Work. Adm. Sci. 2022, 12, 90. https://doi.org/10.3390/admsci12030090
AMA Style
Guðbrandsdóttir IÝ, Oddsson GV. Productivity in an Organizational Setting: A Systematic View of the Causalities at Work. Administrative Sciences. 2022; 12(3):90. https://doi.org/10.3390/admsci12030090
Chicago/Turabian StyleGuðbrandsdóttir, Ingunn Ýr, and Guðmundur Valur Oddsson. 2022. "Productivity in an Organizational Setting: A Systematic View of the Causalities at Work" Administrative Sciences 12, no. 3: 90. https://doi.org/10.3390/admsci12030090
Note that from the first issue of 2016, this journal uses article numbers instead of page numbers. See further details here.