
Optimized Workflow Framework in Construction Projects to Control the Environmental Properties of Soil


1
Department of Investments Technology and Environment, Swedish Transport Administration, Neptunigatan 52, P.O. Box 366, SE-201 23 Malmö, Sweden
2
Division of Building Materials, Department of Building and Environmental Technology, Faculty of Engineering (LTH), Lund University, P.O. Box 118, SE-221 00 Lund, Sweden
3
Laboratory of Image Synthesis and Analysis (LISA), École Polytechnique de Bruxelles (Brussels Faculty of Engineering), Université Libre de Bruxelles (ULB), Building L, Campus de Solbosch, ULB–LISA CP165/57, Avenue Franklin Roosevelt 50, 1000 Brussels, Belgium
*
Author to whom correspondence should be addressed.
Algorithms 2023, 16(6), 303; https://doi.org/10.3390/a16060303
Submission received: 1 June 2023
/
Revised: 11 June 2023
/
Accepted: 16 June 2023
/
Published: 17 June 2023
(This article belongs to the Collection Feature Papers in Algorithms for Multidisciplinary Applications)
Abstract
:To optimize the workflow of civil engineering construction in a harbour, this paper developed a framework of the contaminant leaching assessment carried out on the stabilized/solidified dredged soil material. The specimens included the sampled sediments collected from the in situ fieldwork in Arendal and Kongshavn. The background levels of the concentration of pollutants were evaluated to assess the cumulative surface leaching of substances from samples over two months. The contamination of soil was assessed using a structured workflow scheme on the following toxic substances, heavy metals—As, Pb, Cd, Cr, Hg, Ni, and Zn; organic compounds—PAH-16 and PCB; and organotin compounds—TBT. The numerical computation and data analysis were applied to the results of geochemical testing creating computerised solutions to soil quality evaluation in civil engineering. Data modelling enabled the estimation of leaching of the contaminants in one year. The estimated leaching of As is 0.9153 mg/m2, for Ni—2.8178 mg/m2, for total PAH-16 as 0.0507 mg/m2, and for TBT—0.00061 mg/m2 per year. The performance of the sediments was examined with regard to permeability through a series of the controlled experiments. The environmental engineering tests were implemented in the Swedish Geotechnical Institute (SGI) in a triplicate mode over 64 days. The results were compared for several sites and showed that the amount of As is slightly higher in Kongshavn than for Arendal, while the content of Cd, Cr, and Ni is lower. For TBT, the levels are significantly lower than for those at Arendal. The algorithm of permeability tests evaluated the safety of foundation soil for construction of embankments and structures. The optimized assessment methods were applied for monitoring coastal areas through the evaluated permeability of soil and estimated leaching rates of heavy metals, PHB, PACs, and TBT in selected test sites in harbours of southern Norway.
Keywords:
optimization; quality control; material science; chemical contamination; workflow; soil stabilisation; binders; solidification; leaching; decontaminationPACS:
81.40.Cd; 81.40.Ef; 62.20.Qp; 83.50.Xa; 45.70.Mg; 92.40.Lg; 81.40.Lm; 62.20.M-MSC:
74E20; 74E30; 74F10; 93C57JEL Classification:
Q00; Q01; Q24; Q55; Q561. Introduction
Soil treatment is a challenging civil engineering task with many applications, such as soil stabilization [1,2,3,4], soil remediation [5,6,7], and increasing soil permeability [8,9,10]. These tasks aim at improving geotechnical and environmental properties of soil prior to construction works [11,12,13,14]. The stabilization of soil foundations with binders improves its strength properties [15,16,17,18,19], while soil washing removes the pollutants and contaminants from soil through separating it by particle size or leaching [20,21,22].
Improving the environmental properties of polluted soil aims at to removing the contaminants, which can be performed using diverse washing solutions [23,24]. Leaching is then performed by cleaning the soil from organic and inorganic compounds that are bind to soil particles. At the same time, the granulometric type of soil affects its behaviour during leaching and stabilization [25,26,27]. Thus, soil texture affects the degree of contamination due to different permeability and capacity to retain pollutants. As a result, fine-grained silt and clays (particle size of 0.002 to 0.6 mm) typical in the cold environment of Norway [28,29,30] retain more contaminants due to to clogging of the pores compared to the middle-grained sand (0.6 to 2 mm) or coarse-grained gravel with >2 mm of particle size [31,32].
A key ingredient for effective soil processing in environmental engineering is the development of the optimised design fit for experiments [33,34,35,36,37,38], since methods of soil treatment differ depending on its type (fine-, middle-, or coarse-grained) and properties (water content, density, and temperature). Existing methods of soil remediation used in environmental engineering include the evaluation of leaching potential from soil and immobilization of contaminants [39,40]. Diverse contaminants can be tested, such as toxic heavy metals, (As, Pb, Cd, Cr, Hg, Ni, and Zn) [41,42,43,44], Polycyclic Aromatic Hydrocarbon (PAH) [45], Polychlorinated biphenyl (PCB) [46], and organotin compounds Tributyltin (TBT) [47,48,49,50]. Depending on the approaches, soil leaching may be implemented with or without the renewed leachate [51], and using either dynamic or extraction tests [52].
A popular approach of the environmental engineering evaluation of soil properties includes the common leaching test [53,54,55]. Other examples use the water leach test [56,57], toxicity characteristic leaching [58], column leach test [59,60], or soil layering over the substance drainage system [61]. Existing methods follow the existing standards to make use of the well-known approaches in soil testing. Such methods focus on remediation of the ecologically degraded and contaminated soil, assuming that its properties conform to the models in the existing workflow [62,63,64]. As a consequence, none of the resulting approaches are tailored to a better understanding of how the variation of soil properties, such as soil moisture, grain size, and permeability, affect its behaviour in leaching. At the same time, soil quality is significantly affected by the the selection of binder types used for stabilization [65,66,67], the proportion of water–binder ratio [68] and binder content [69].
Modelling this information, as most dimensionality reduction methods do, introduces additional parameters, and therefore, improves the workflow of soil detoxification and removal of chemical pollutants. Workflow strategies of soil decontamination and remediation have high costs [70,71,72]. The process of soil decontamination includes a complex expensive chain of remediation techniques to remove pollutants, heavy metals, organic and inorganic toxins, and organotin compounds [73,74,75]. Normally, this includes both in situ (excavating the samples) and ex situ (batch-wise treatment of specimens using percolating water in a laboratory) [76,77,78]. Given the constraints of high cost and time pressure related to soil treatment in large-scale construction works [79,80,81], it becomes essential to optimise a workflow at a small scale using parametric simulation and modelling of soil performance prior to industrial applications [82].
The method proposed in this article is inspired by the optimization techniques of soil treatment [83,84,85,86,87]. The main idea is to factorise the parameters that affect soil properties into sub-classes having linear and non-linear distribution of data over time for various soil samples. In this way, the optimization of the procedure improved the workflow of soil decontamination in a small-scale using several batches of soil samples modelled prior to construction works. The data obtained from the numerical experiments on evaluating the leaching behaviour of contaminants were processed by statistical methods. Using modelling algorithms, we demonstrated the non-linear performance of leaching for various pollutants. The suitability of the presented approach to soil treatment is illustrated in graphical plots and tables where the behaviour of soil leaching is compared for various contaminants. The benefits of the proposed approach are compared with the existing techniques on soil leaching tests, immobilisation of contaminants, and permeability tests.
2. Materials and Methods
2.1. Sampling and Transportation
The laboratory experiments on soil quality and surface leaching were carried out in the Department of Building Materials of Lunds Tekniska Högskola LTH (Faculty of Engineering), Lund University. The geotechnical tests were implemented in the Swedish Geotechnical Institute (SGI). Sampling of dredged sediment material was performed by the Norconsult AS. The tests were evaluated in the framework of the research project run by SGI and financed by Swedish Transport Administration. Soil samples were collected from the test sites in Arendal municipality and Kongshavn, Port of Oslo (southern Norway).
The stabilizing agents and soil specimens were mixed for 5 min to achieve the homogeneity of the material. Afterwards, soil samples were moulded into the piston sleeves which had an inner diameter of 50 mm and a height of 170 mm. The sampling procedure included four batches. A large Batch 1 of samples is subdivided into the three additional produced batches of soil specimens (Batches 2, 3, and 4). Batch 2 contains the activated carbon (powdered charcoal). Batch 3 was pre-treated with the activated carbon one month before the stabilization process. Batch 4 was stabilized with the Belite Calcium Sulfoaluminate (BCSA) cement. The BCSA cement was selected due to its properties, it is an environmentally-friendly type of cement with low level of CO2 emissions.
2.2. Soil Stabilization
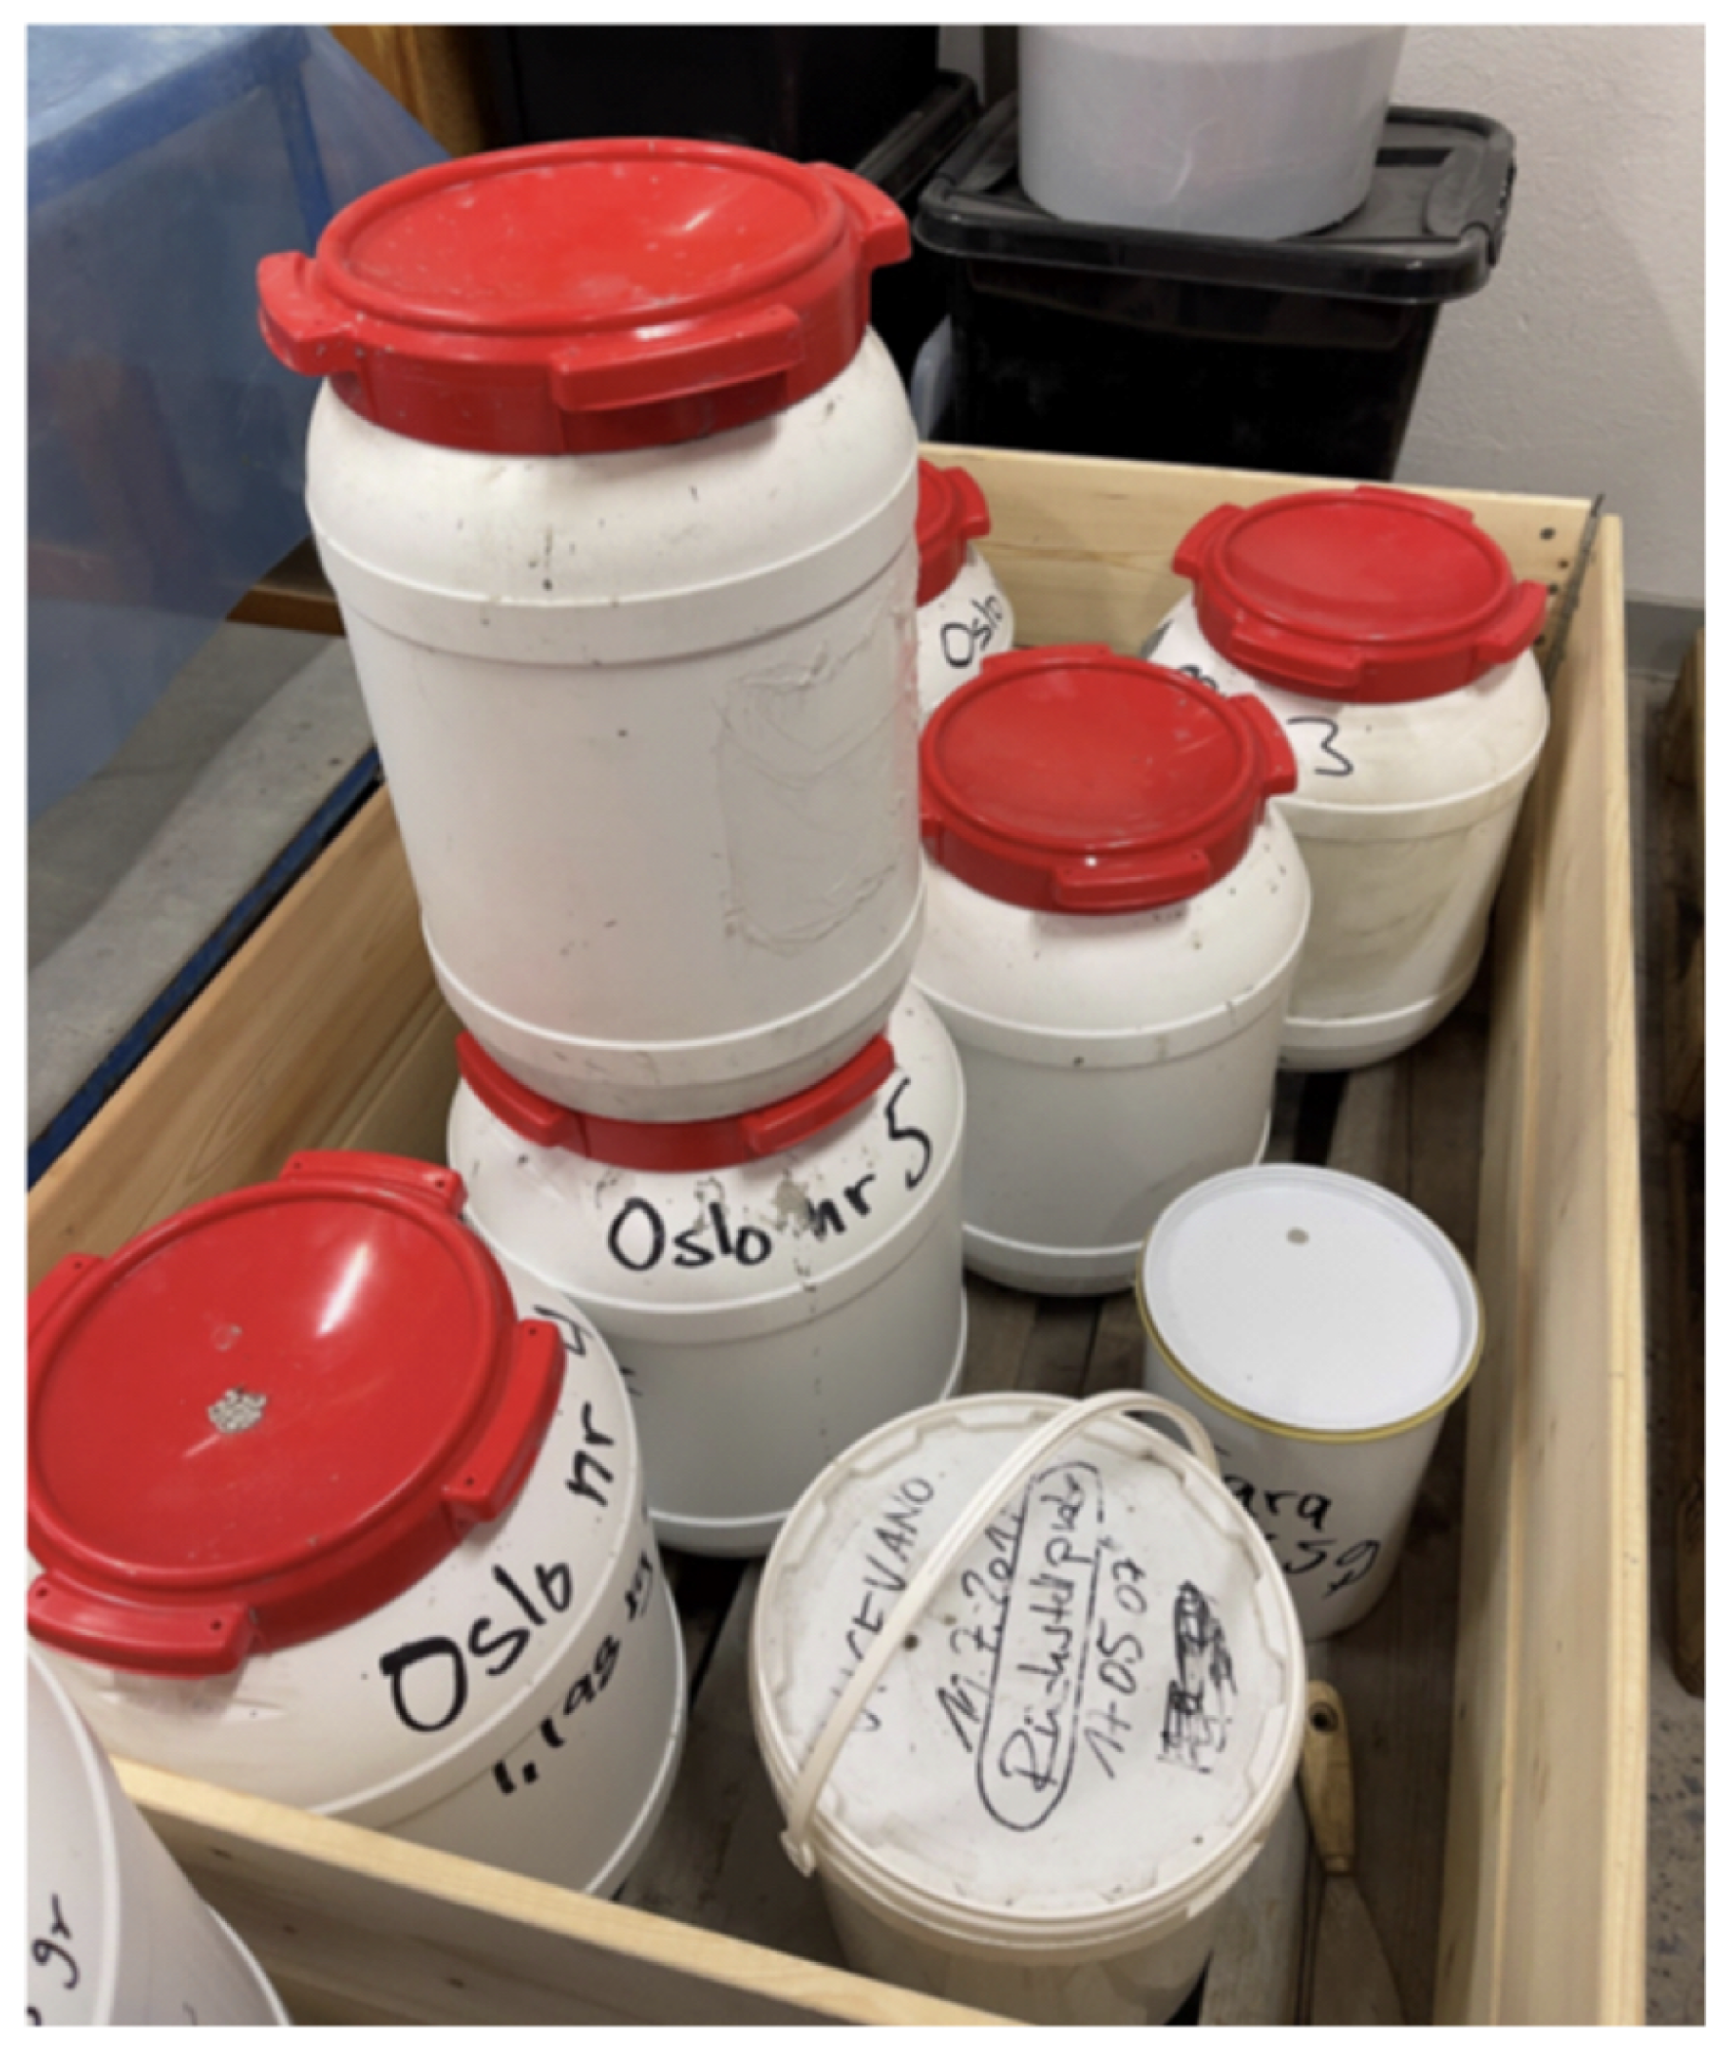
The engineering tests aimed at evaluating the environmental properties of soil. The workflow consisted of experiments on soil stabilization, permeability tests, surface leaching, and shake table testing. Due to vibrations during transportation, there is always a certain separation in the material which leads to the damage of some of the containers and leakage of water. Therefore, the clay masses were then homogenised for each sample and placed in tight containers with screw lids, see Figure 1.
The screw lids had a gasket to prevent leakage and evaporation. The samples were then transported to Lund in these containers marked with the respective test labels. After the transfer, the specimens were homogenised, and the water ratio and density determined. The water ratio is the ratio of the amount of water with regard to the mass of the solid phase (soil). After homogenisation with a mixer, soil samples were stabilized using different combinations of binders. The choice of binder was based on the previous experience from several similar projects in Sweden. In the mixing tests, a binder combination of 30% CEM I (SS-EN 197-1) [88] and 70% slag (SS-EN 15167-1) [89] was used. Furthermore, the tests were carried out with different ratios of weight of water divided by weight of binder, known as the water–binder number (vbt). The choice of the vbt was based on previous experiences, including the works from Arendal 2 in Gothenburg [90].
2.3. Permeability Tests
The permeability tests were performed using the standard SS-EN ISO 17892-11:2019 for geotechnical investigation and testing of soil using permeability tests in a laboratory [91]. The aim was to evaluate the flow of water through a soil sample and, thus, to estimate the suitability and safety of soil for construction works through the calculation of the permeability coefficient. The permeability tests were carried out after the homogenisation and stabilisation of specimens, in the SGI using the specimens fabricated in LTH. The specimens were used from the same series of soil samples that were tested for compressive strength after the stabilization. The permeability test was carried out in a cell pressure permeameter using a standard permeameter device, according to method SGI No. 15. This method is used in tests performed both in Arendal (Norway) and Östrand (Sweden). Additionally, the shake table testing has been carried out by the Swedish Geotechnical Institute (SGI) in Linköping; however, this kind of test is less suitable for the monolithic materials such as soil dredged masses.
The objective of the tests on permeability consists in sustainable stabilization of the dredged soil material. The characteristics of the specimen tested for the permeability tests are common for all the samples and include the following technical parameters, sample diameter (mm)—50.0 and test temperature (C)—. The experiments are recorded in SGI under the diary number 1.1-2107-0587. The sample preparation/compaction method included the trimming of the pieces of specimen from the main stabilized soil sample. The individual characteristics of tested soil specimens are summarised in Table 1.
2.4. Surface Leaching Tests
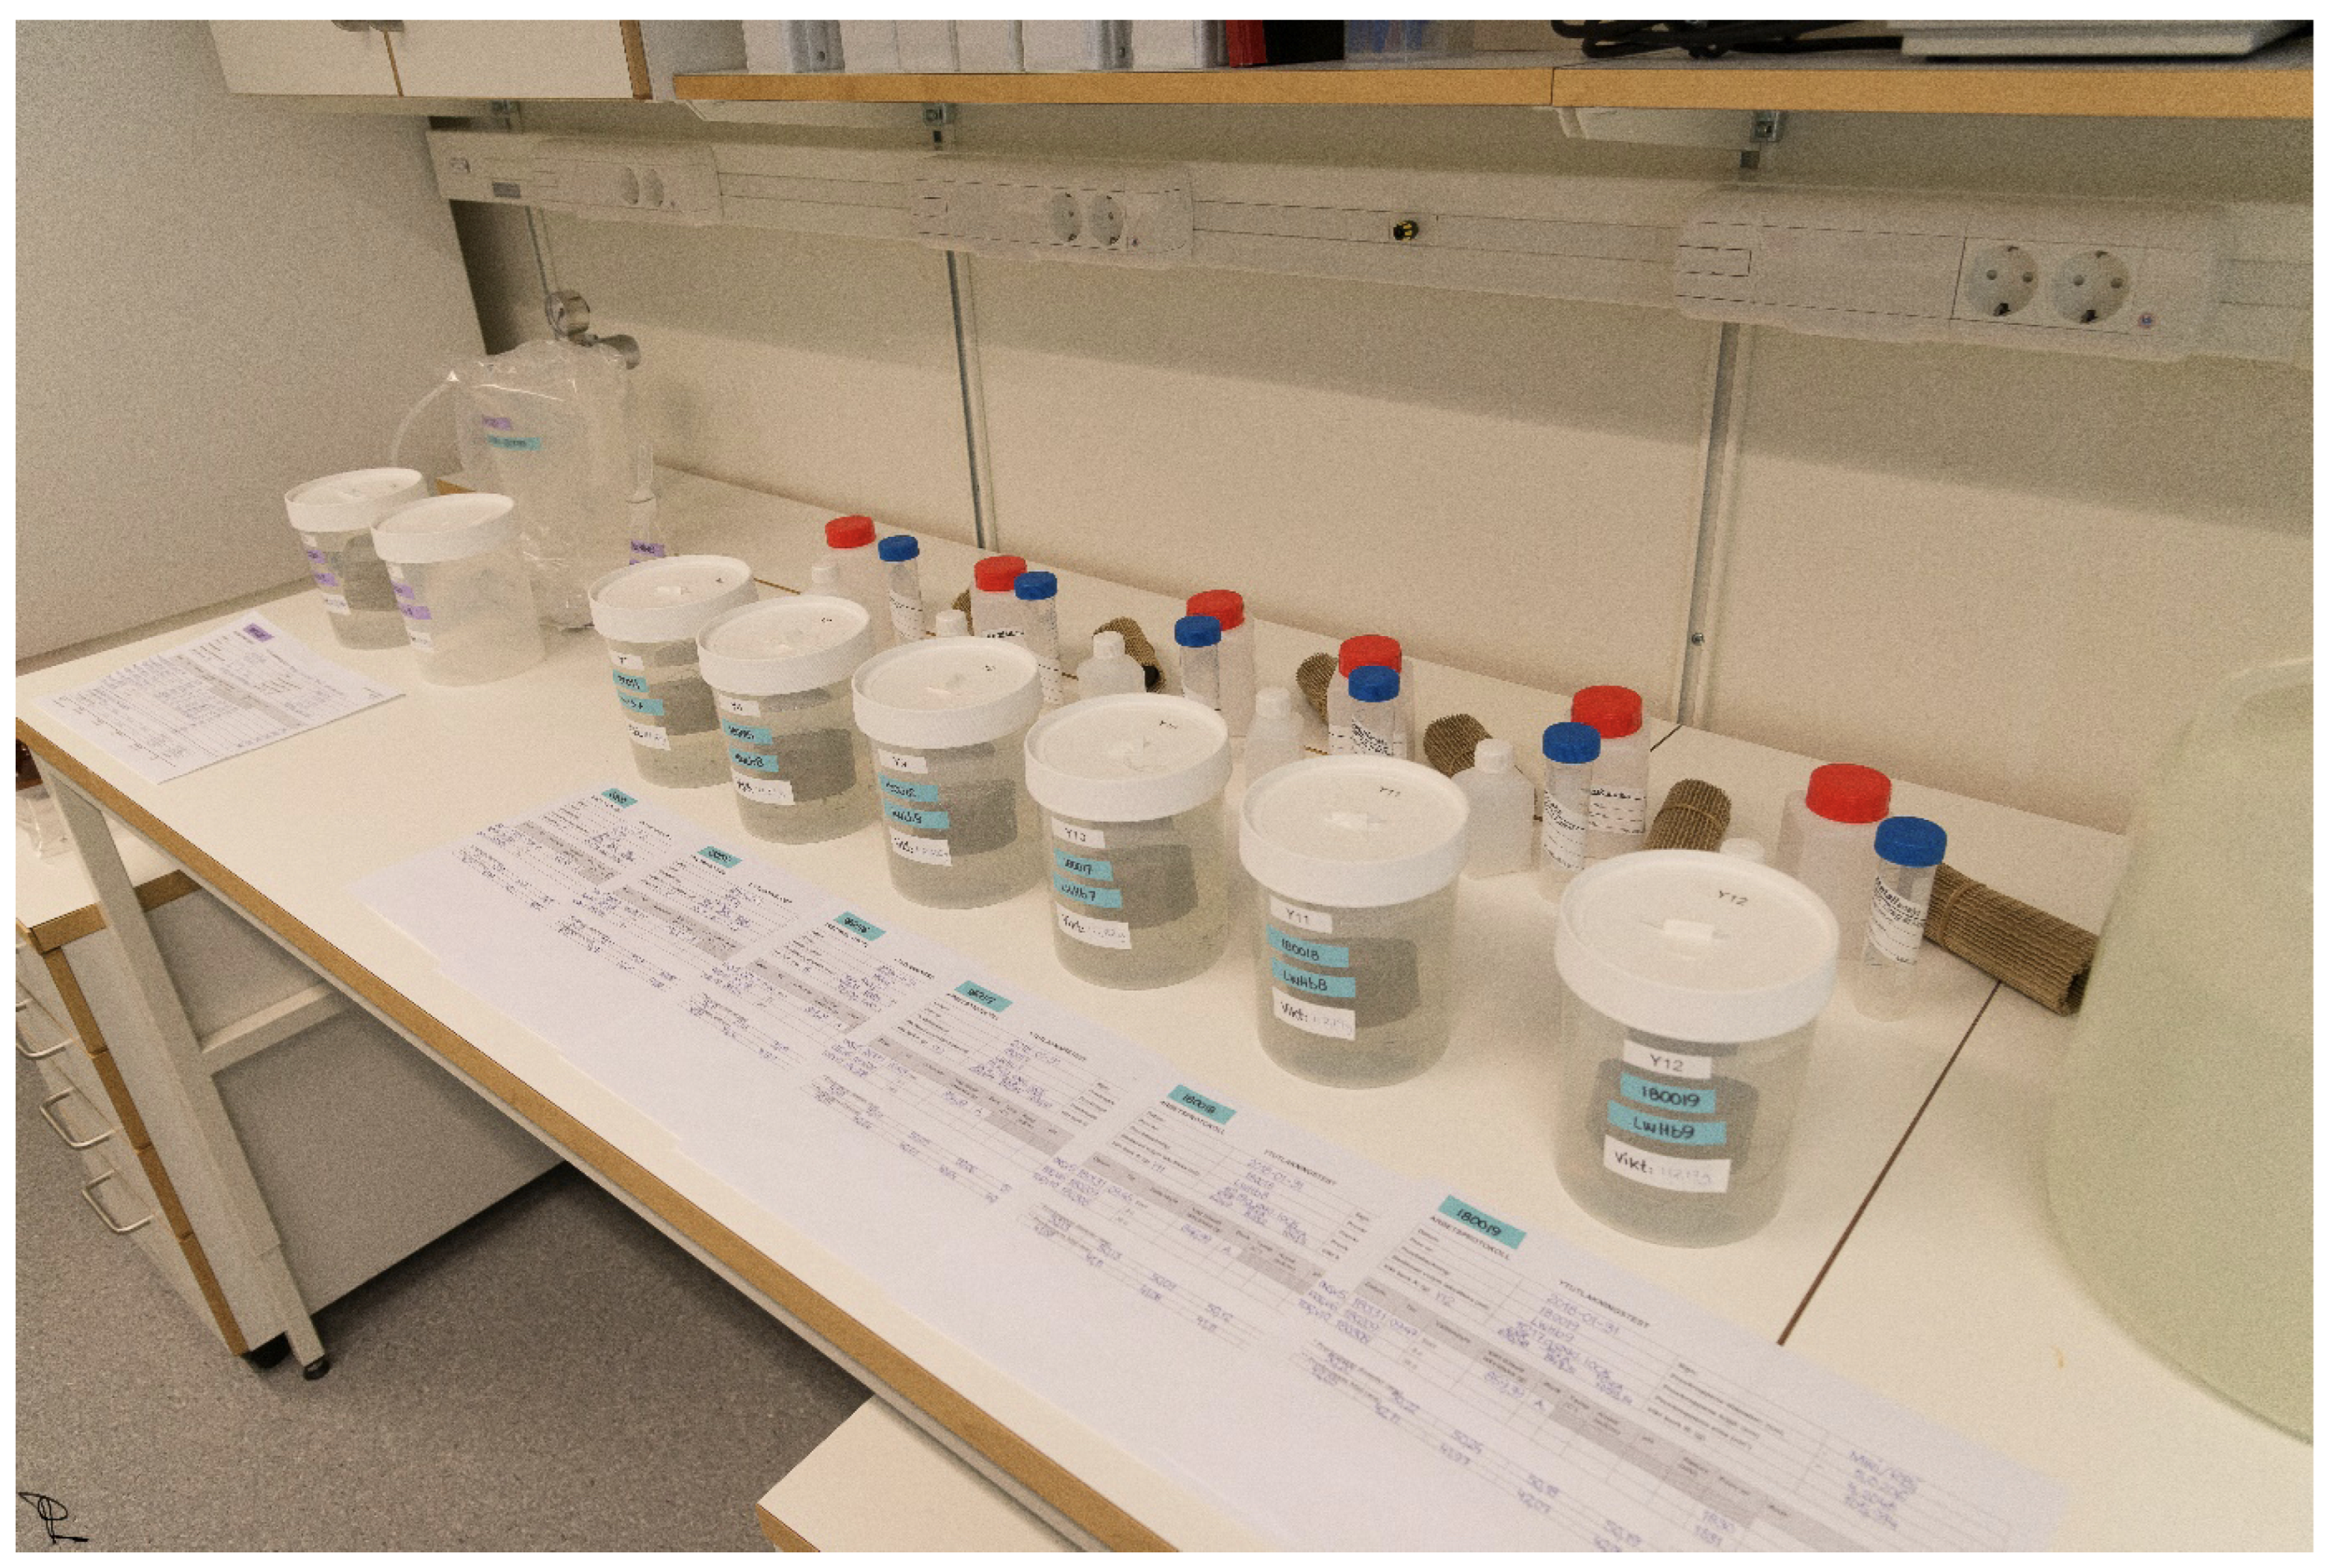
The surface leaching tests have been carried out in SGI in Linköping, Sweden, and the analysis of the leachate is carried out by ALS Scandinavia AB. The experiments were performed according to standard SS-EN 15863 according to the European Standard used for evaluating the leaching behaviour of monolithic soil under dynamic and changing environmental conditions [92], see Figure 2. The tests entail the following procedure. A stabilized test sample with a known surface area is lowered into a water bath. The water is then changed after 6 h, 1 day, 2.25, 4, 9, 16, 32, and 64 days, see Tables in Appendices: Table A1, Table A3 and Table A5 for surface leaching, and Table A2, Table A4 and Table A6 for cumulative surface leaching. At each water change, the leachate is analysed under fixed experimental conditions and the concentrations are evaluated for heavy metals (As, Pb, Cd, Cr, Hg, Ni, and Zn), PAHs (16 pcs), PCBs (7 pcs), and organotin compounds (TBT).
The surface leaching was performed as a triplicate test with specimens having designations within the test series. According to this standard, the release of pollutants is evaluated as a function of time when the contaminants are immobilised from a monolithic soil mass during a period of active contact with a leachate aqueous solution. The samples were named Bach1, Sample 6, Sample 7, and Sample 8A. Three tested specimens were fabricated using the dredged material collected from various test points.
The chemical analysis of the dredged masses was carried out during sampling of soil on leaching. The test method is performed in accordance to the standard SS-EN 15863 to evaluate leaching behaviour in monolithic material using regularly shaped test portions of soil samples with a periodical renewal of leachate from 6 h to 64 days. The main idea of this approach consist in exposing the soil material to a water leachate for a certain period of time, then analysing the obtained solution with concentration of contaminants. The requirement of the minimum size of 40 mm in all directions is satisfied in the current experiments where the sleeves for soil samples had the dimensions of 50 mm. The aim of the chemical analysis was to determine the background levels of the chemical elements (heavy metals, PAHs, PCB, and TBT) and compare them to level from the leached concentrations from the tested soil specimens in the end of the experiment. In addition, the test aimed to identify, which of the sample points within the sample area in the harbour was the most contaminated and, therefore, would be used in surface leaching tests.
In previous projects, the ultrapure Milli-Q water has been used obtained from the extra purification water systems; however, it results in a biased outcome due to the content of extra pure water. Therefore, the later projects, such as those run in the Arendal 2 and Östrand, have been tested with the leachate from the respective local area. In this study, the leachate from the Port of Oslo has been used to adjust local environmental setting. The sample point was selected for surface leaching based on the materials of the experiments. According to this method, the specimen is suspended using the nylon ropes so that surface leaching can take place on the entire surface of the soil specimen.
3. Results and Discussion
The results of this study are based on the optimised workflow framework developed for the updated environmental engineering tests with adjusted binder proportions. The study resulted in evaluated properties of soil obtained during the following workflow:
- The soil samples were collected from the Kongshavn Harbour, Port of Oslo; the representative soil specimens were excavated from different locations (test sites) and placed in containers for further soil treating in a batchwise mode.
- The soil was homogenised using a surface mixer and stabilised with various combination of binders (cement/slag) tested experimentally. The soil samples were cropped and trimmed in leach piles to a defined height of specimen to minimise the workflow; unnecessary parts were subtracted from the samples using piles.
- The permeability of soil was analysed using a permeameter device according to the method SGI No. 15, and compared with optimal parameters for several specimens; the temperature and humidity conditions were maintained in the laboratory.
- The immobilisation of the environmentally critical contaminants was performed through leaching with evaluated concentrations of seven types of heavy metals, PAH, PCB, and TNT. The dynamics of leaching speed and value was recorded and evaluated for 6 h to 64 days with labelling of soil leaching over the defined time intervals.
- The obtained data were recorded for statistical analysis and computer-based modelling. The dynamics of concentration of the contaminants in soil was modelled on the graphs. The behaviour of soil was evaluated using intervals through repetitive soil sampling in laboratory SGI.
- Statistical correction of the outliers caused by biased sampling was performed in the dataset to obtain statistically sound results.
- The prognosis of leaching behaviour was numerically modelled using the developed equations and statistical data analysis. The comparison of the achieved levels of pollution and leached contaminants were compared on the original (background) level to estimate the degree of contamination for environmental risk assessment.
The presented workflow of soil treatment enabled the processing of samples of soil specimens in soil samples collected from Kongshavn, Port of Oslo, southern Norway. The experiments resulted in evaluated dynamics of leaching and permeability over time of 64 days. The data were extracted form prognosis modelling for one year based on the computer-assisted statistical analysis. The trends in dynamics of contamination were evaluated over time and compared against the original (background) levels of contaminants.
Using the optimised techniques, we tested different experimental conditions, as follows. In separated batches of soil, different ratios of binders were used to estimate their effects on soil quality (BCSA cement/slag); different ratios of water amount to binder amount and the water binder number (vbt) were evaluated. The permeability and leaching of soil data were tested on six cases to achieve a statistical soundness of the results. The numerical experiments and statistical data processing were performed to derive the average and standard deviation on the measured data. The experiments have shown the importance of exploiting the diverse binder combinations for improving soil properties through stabilization/solidification and leaching. The non-linearity of the permeability and leaching behaviour of soil were evaluated with regard to binder content used for soil stabilization.
3.1. Soil Permeability
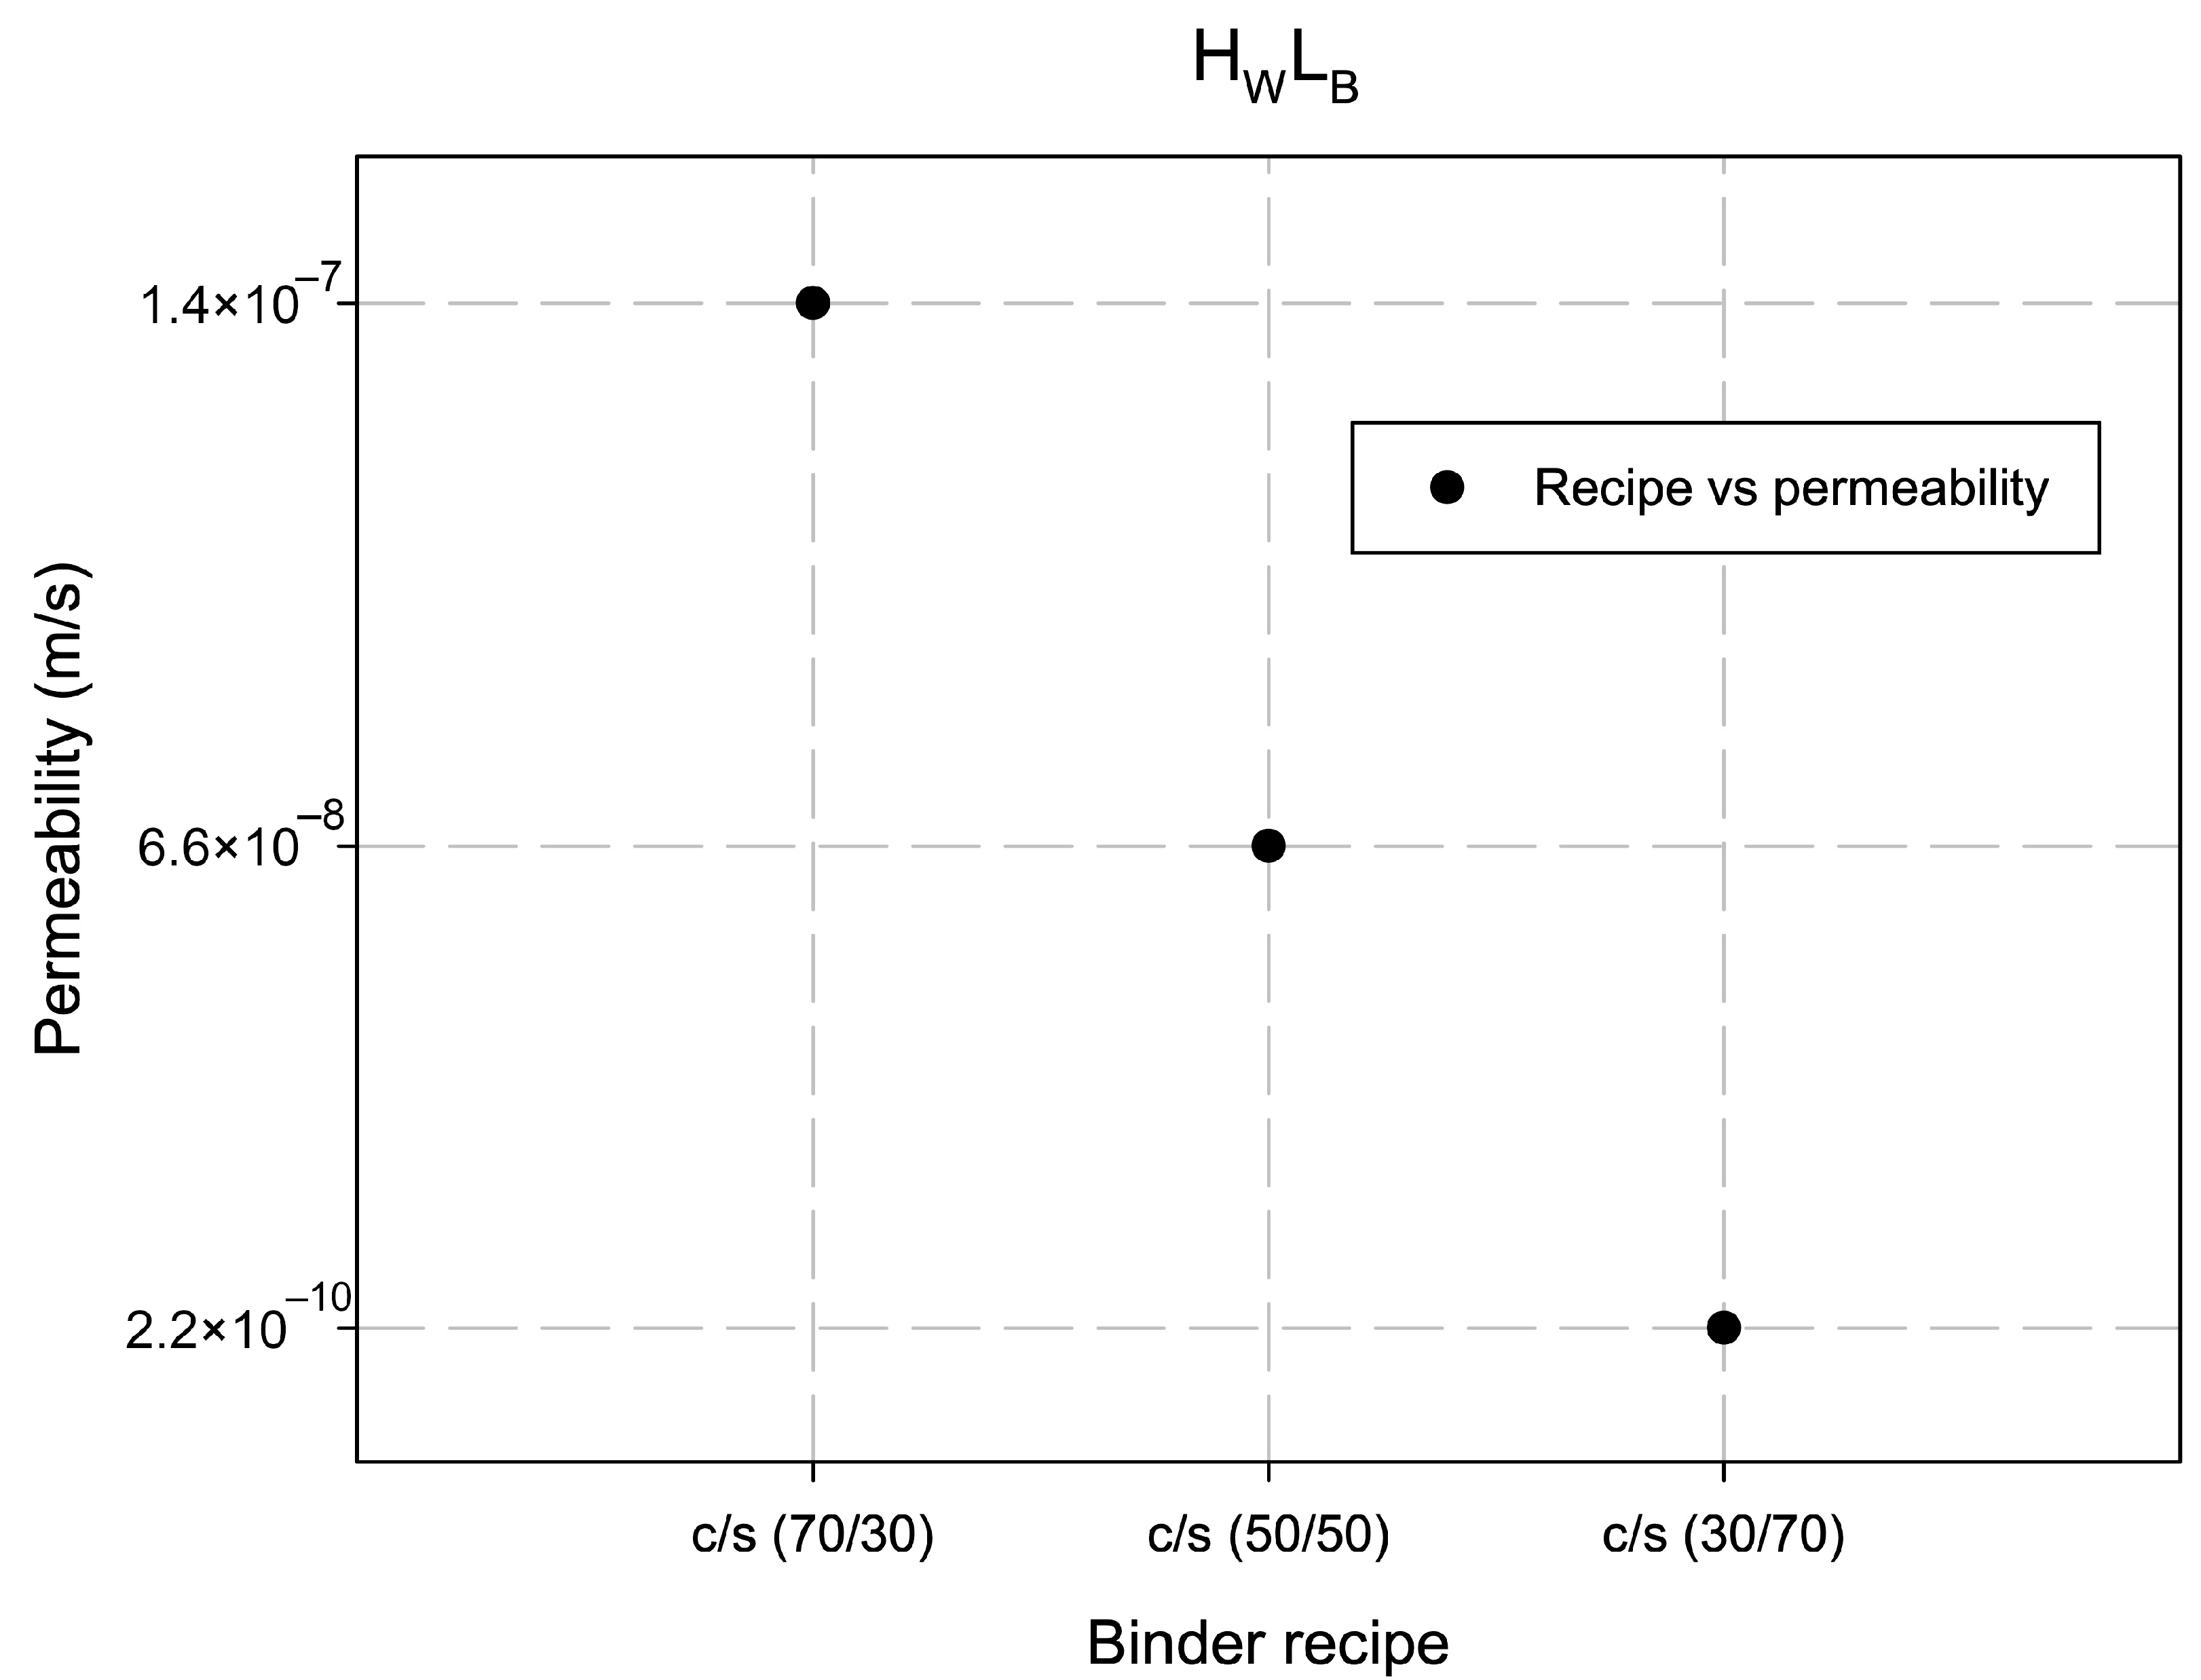
The results of the permeability testing demonstrated low permeability level achieved for all tested samples of the dredged soil masses. Figure 3 shows the permeability of soil stabilized with different combinations of binders (cement and slag). The best effect was obtained at 70% added slag admixture in the total amount of binder. Table 2 shows measured permeability for various tested soil specimens. The maximal achieved permeability for sample is 1.5 after 122.22 h of treatment; for the specimen —; for the specimen —; for the specimen —; for the specimen —, and for the specimen —.
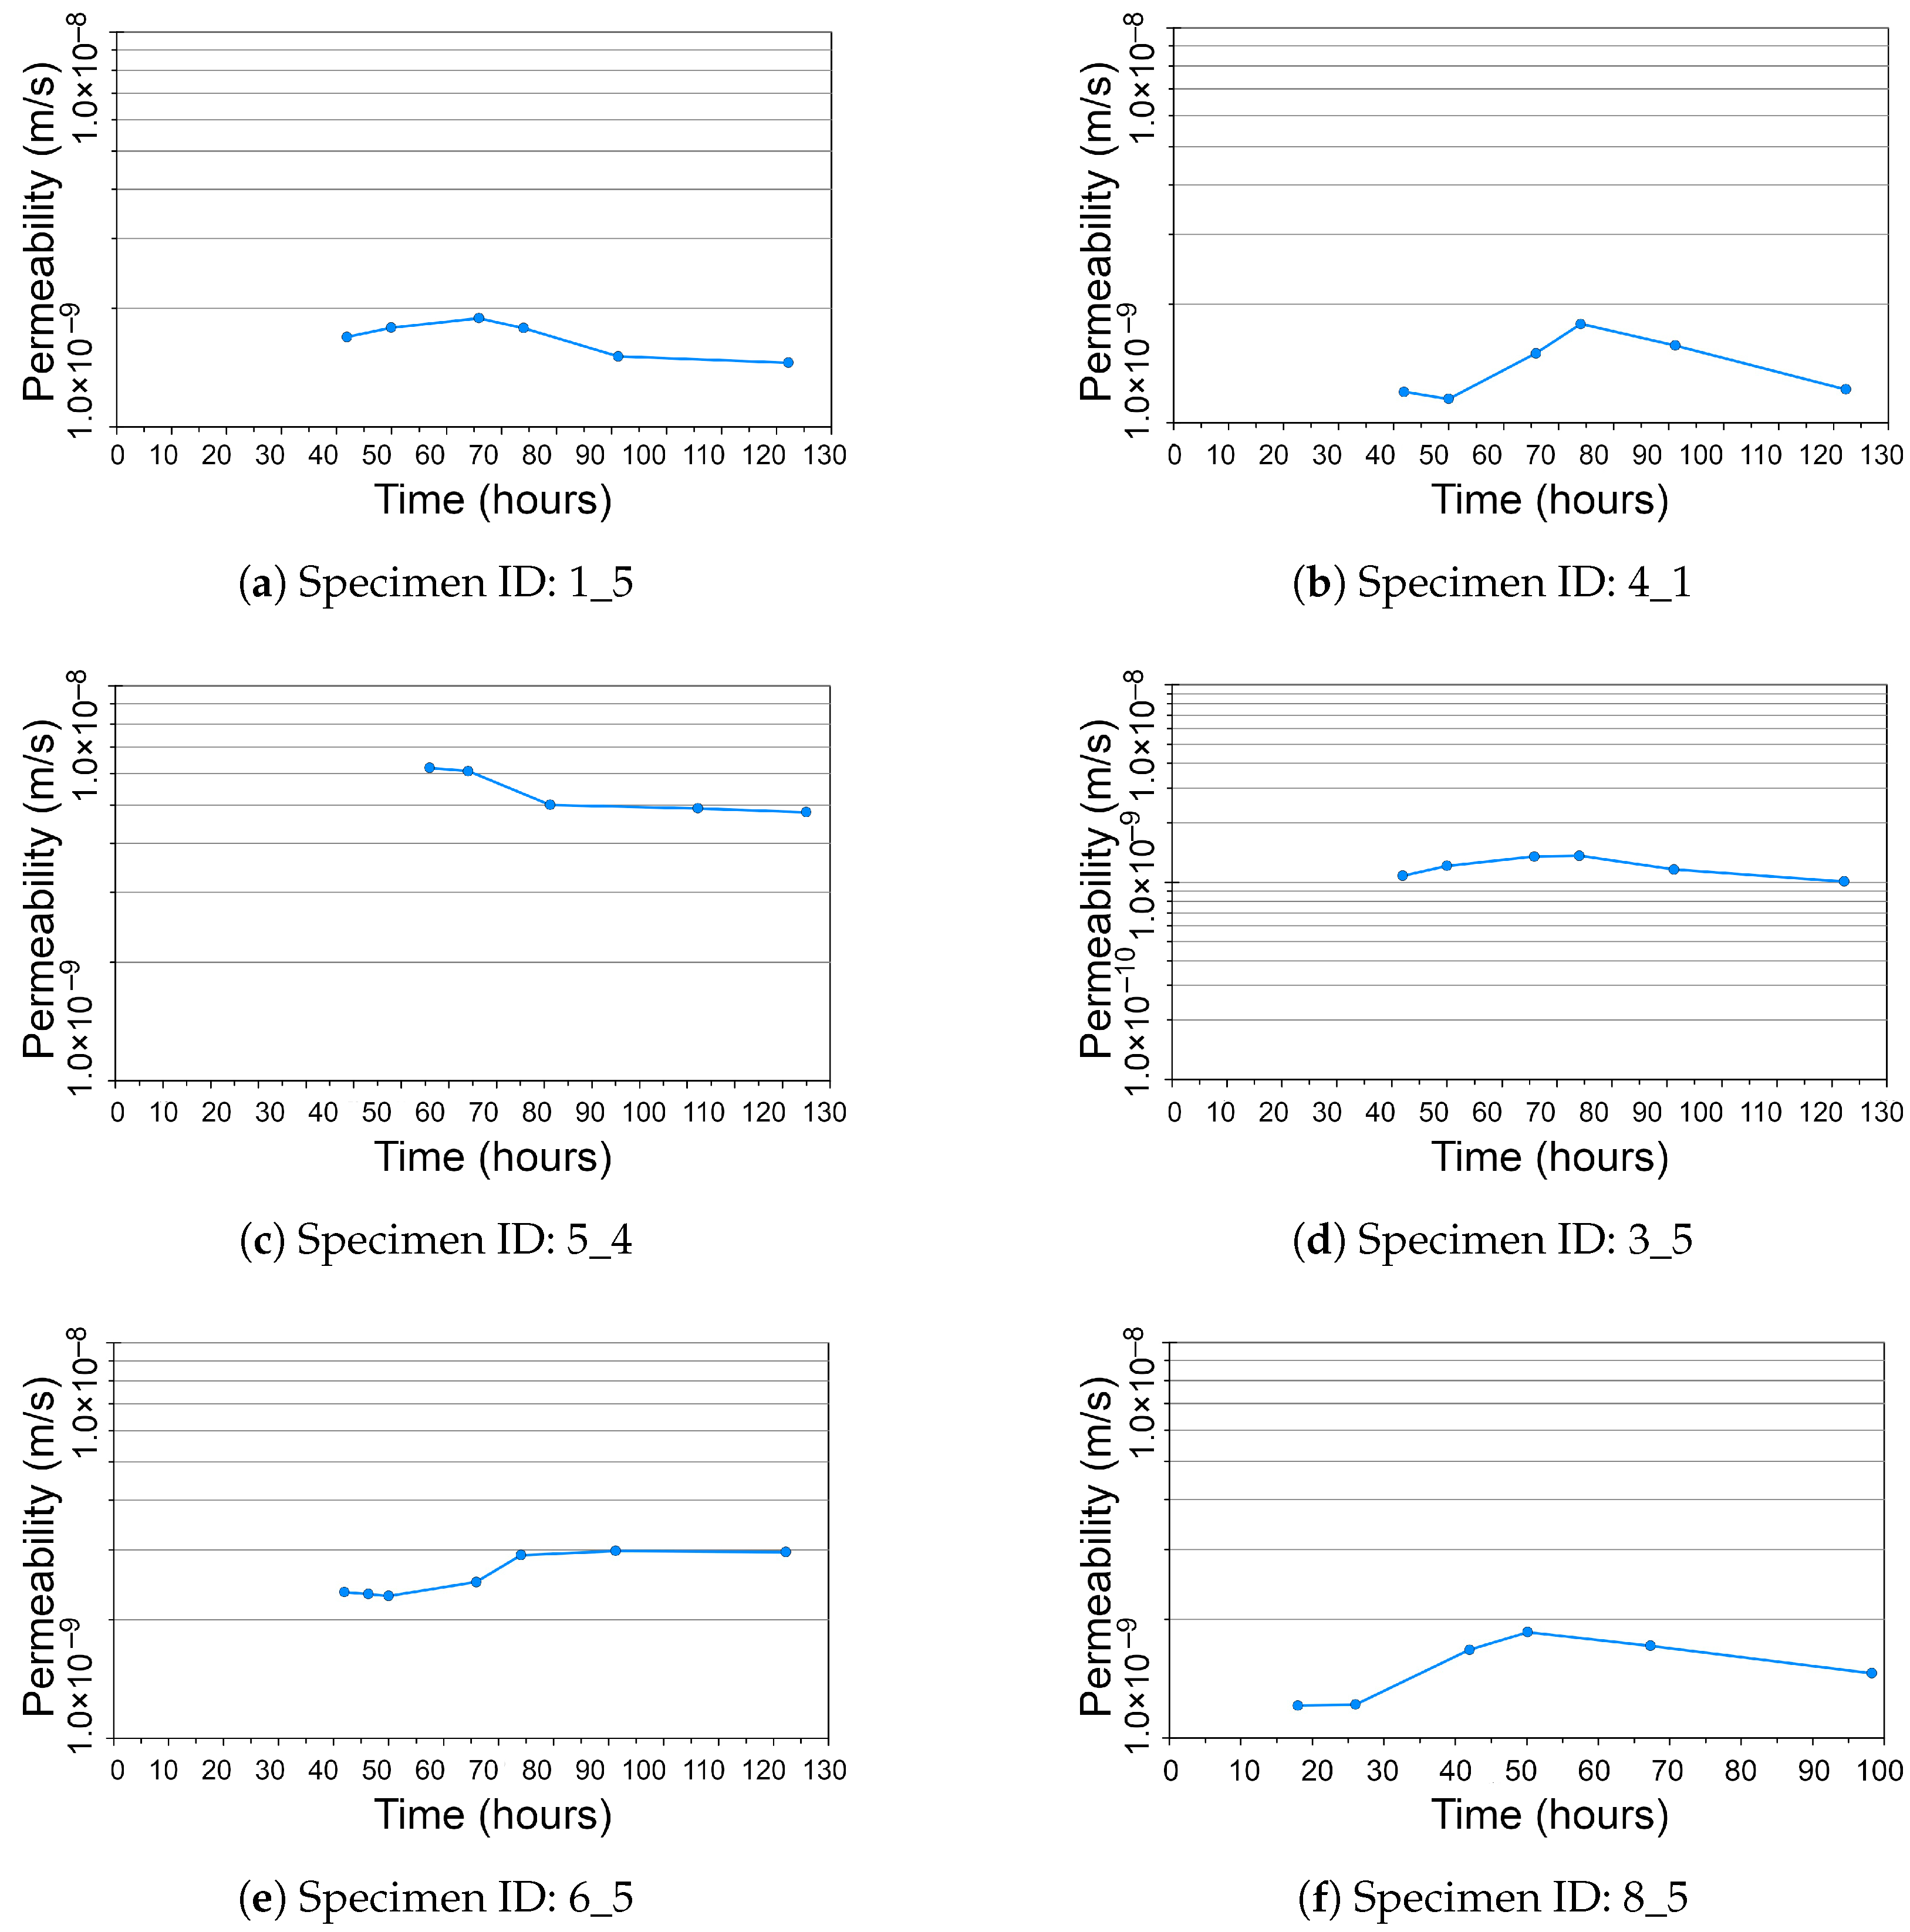
Figure 4 shows the dynamics of the permeability of soil over time in hours. The specimens used in the experiment are indicated by their IDs. Here, the lines show the dynamics and the overall trend in permeability level with respect to the time of treatment of soil samples during stabilization/solidification procedure. The original values of the permeability plotted on the graph show their variations with a general slight decrease in trend which proves the effective selected technique of soil treatment for the increase in strength.
3.2. Concentrations of Contaminants
The detailed chemical information was obtained as concentrations of pollutants in the leachate of soil samples evaluating the leaching mechanism of the contaminants. The obtained results with full data are summarised in Tables and presented in the Appendix of this study. The Appendix A contains the results of leaching of contaminants in sampling passes 2317–2324; Appendix B presents the results of leaching of contaminants in sampling passes 2325–2332, and Appendix C summarises the results of leaching of contaminants in sampling passes 2333–2340.
The background (original) levels of the concentration of contaminants were evaluated and presented in Table 3. The analysis of the original level of contaminants enabled to perform the evaluation of the decontamination of soil based on the discriminating the actual values of pollutants against those of the original (background) level. In such a way, the degree of concentration of contaminants in soil samples was evaluated using the analysis of leaching dynamics for each contaminant, respectively. Reading these data obtained from the leaching experiments include the analysis of information on the amount and concentration of the resolved pollutants with respect to the overall amount of soil and, thus, to evaluate the obtained level of contamination to prevent ecological risks. The evaluated substances included seven (7) types of heavy metals (mg/kg), total PAH-16 (mg/kg) and Tributyltin-Sn (TBT) (g Sn/kg), as shown in Table 3.
The most important parameters in the context of soil contamination by heavy metals have been assessed for the following metal types, arsenic (As), lead (Pb), cadmium (Cd), chromium (Cr), mercury (Hg), nickel (Ni), zinc (Zn), as shown in Table 3. The tests also evaluating the concentrations of elements in soil samples were tested for the organic compounds—16 priority Polycyclic Aromatic Hydrocarbon (PAH) and organotin compounds Tributyltin (TBT), Table 3, and for organic chemicals Polychlorinated biphenyl (PCB) (7 pcs), Table 4. The hydraulic conductivity evaluated the leachate percolation through the soil monolith, and reported in the Appendix in Table A1 showing 251–275 S for samplings 2317–2324, Table A3 showing 253–274 S for samplings 2325–2332, and in Table A5 showing 252–276 S for sampling 2333–2340. Thus, in all cases the conductivity slightly increases in course of the experiment from 6 h to 64 days.
The withdrawal of water for analysis of surface leaching was performed with the following intervals of time periods after 6h of testing, 1 d (24 h), 2.25 days (54 h), and then on days 4, 9, 16, 36, and 64. The repetitions of the tests arranged periodically with a non-linear time gaps in the laboratory across the soil samples enabled to indicate the marks of leaching levels of each of the contaminants separating the amounts of the leached substances from the soil samples. The analysis demonstrated the following leaching values (mg/m2): the highest values of As reached 0.88 with average 0.71; the highest values of Ni reached 2.48 with average 2.20; the maximal leaching of PAH-16 is 0.053 with average 0.039; and the leaching of TBT increased to 0.0010 with average of 0.0009, respectively.
In order to make a comparison of the contamination level in current state against the pre-industrial conditions, the deviation classification for heavy metals in sediments has been carried out according to the existing Swedish standards [93]. The table is recalculated using values from tables 34 and 36 in the Swedish Environmental Protection Agency’s report 4914 (mg/kg TS). Thus, the identification of the high level marks in contamination enables to extract information on changes in concentration of the contaminants during the assessed period, while the amplitude of contamination enables to evaluate the degree and extent of the increase in pollution for each types of contaminant. Here, the evaluation was performed by classes for target substances, such as heavy metals, TBT, PCB, and PAH, compared to the pre-industrial period with a lower pollution level in soil.
The obtained results show that dredged soil material collected from the Kongshavn tested areas are generally above Class 1 (Table 5). The classes in deviation ranking of heavy metals are visually breaking the dataset into five clusters of data according to the value of pollution repetitively for each type of the analysed heavy metals, as shown in Table 5. The description of these values of contamination were stored and used for the comparison of the dynamics of the contaminants for diverse periods, days 1, 2.25, 4, 9, 16, 36, and 64. The full data presented in Appendix of this article included the records on the contamination level, the names of the contaminants, and location of the sample sites.
3.3. Surface Leaching
Tables summarising the analysis of the leachate are presented in the Appendix. The analysis of the results of the surface leaching tests resulted in a lower values than the expected limits of contaminants, which is reported in the tests protocols see the Appendix A, Appendix B and Appendix C for full chemical protocols. In such cases, when the levels of pollutants are lower than the reported limits, it can be concluded that the leaching of the evaluated substance has a low level, and the soil is environmentally safe. Table 6 shows the distribution of values above or below the reporting limit for metals summarised in the additional Tables of Appendix A, Appendix B and Appendix C.
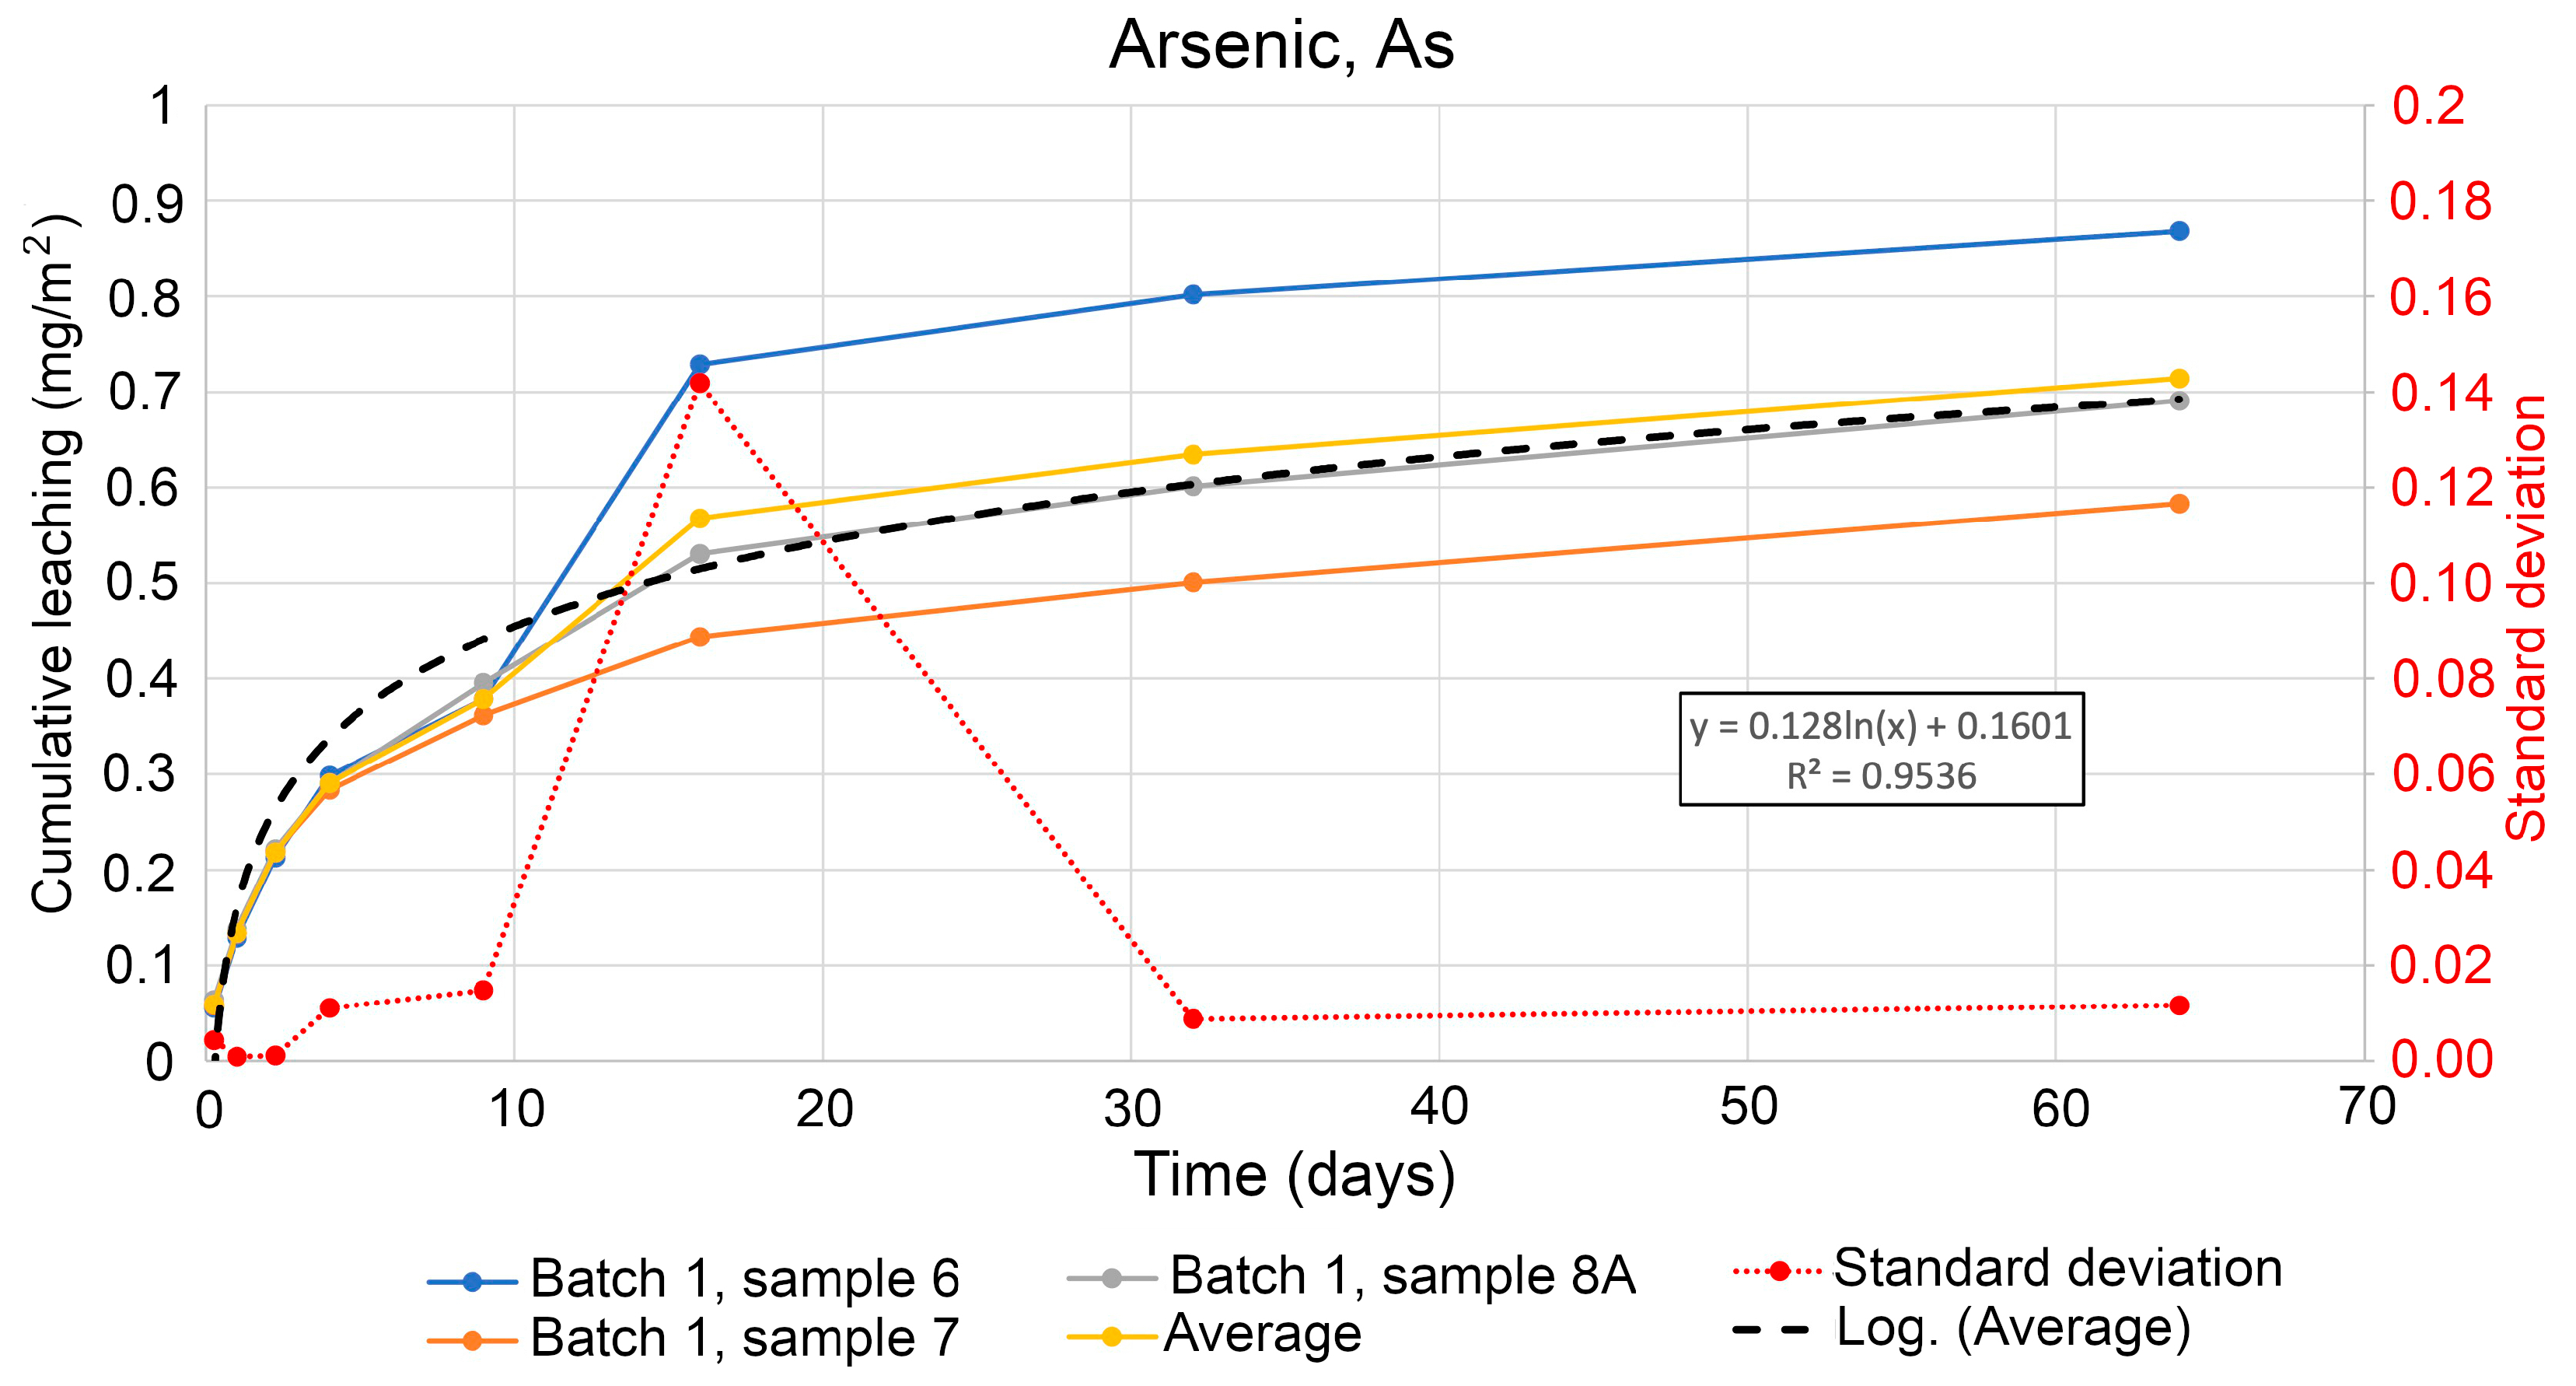
Among the analysed heavy metals, arsenic (As) and nickel (Ni) demonstrated the levels of concentration above the detection limit for specimens treated during the entire period from 6 h to 64 days of leaching. Figure 5 shows the cumulative leaching of arsenic (As) over time where leaching can be considered as diffusion controlled, as shown in Figure 5. The lines on the graphs were interpolated as several segments of splines, separated by the Batches and Samples between each measurement and compared for average values, logarithm curve and standard deviation between the samples within the same time gap. The lines on the graph show the contamination level as curvatures for each Batch for evaluated specimens. A standard deviation of the leached As on day 16 was significantly higher, e.g., in sample No. 6. It may indicate a biased measurement in the laboratory on a given specific sample. Nevertheless, for the analysis of leaching, the data remain statistical unbiased, and were included in the calculation of the amount of the leached As. The average value of the three samples is used to visualise a statistical trend line. The equation from the trend line is calculated to estimated the expected leaching of As after one year.
The intensive industrial development in the region of Kongshavn (Port of Oslo) in recent decades resulted in significant areas of degraded lands and contaminated soil. Therefore, the need for remediation of soil requires a comparison of data on the contamination level both in a retrospective mode and as a prognosis. The estimation of possible future leaching of the selected contaminants has been performed for arsenic (As), nickel (Ni), PAH-16, and TBT. Using the regression equation from Figure 5 and a time period of 365 days, the potential leaching amount was modelled per m2 for one year, as shown in Equation (1). This gives an estimated leaching of arsenic (As) of 0.9153 mg/m2 per year.
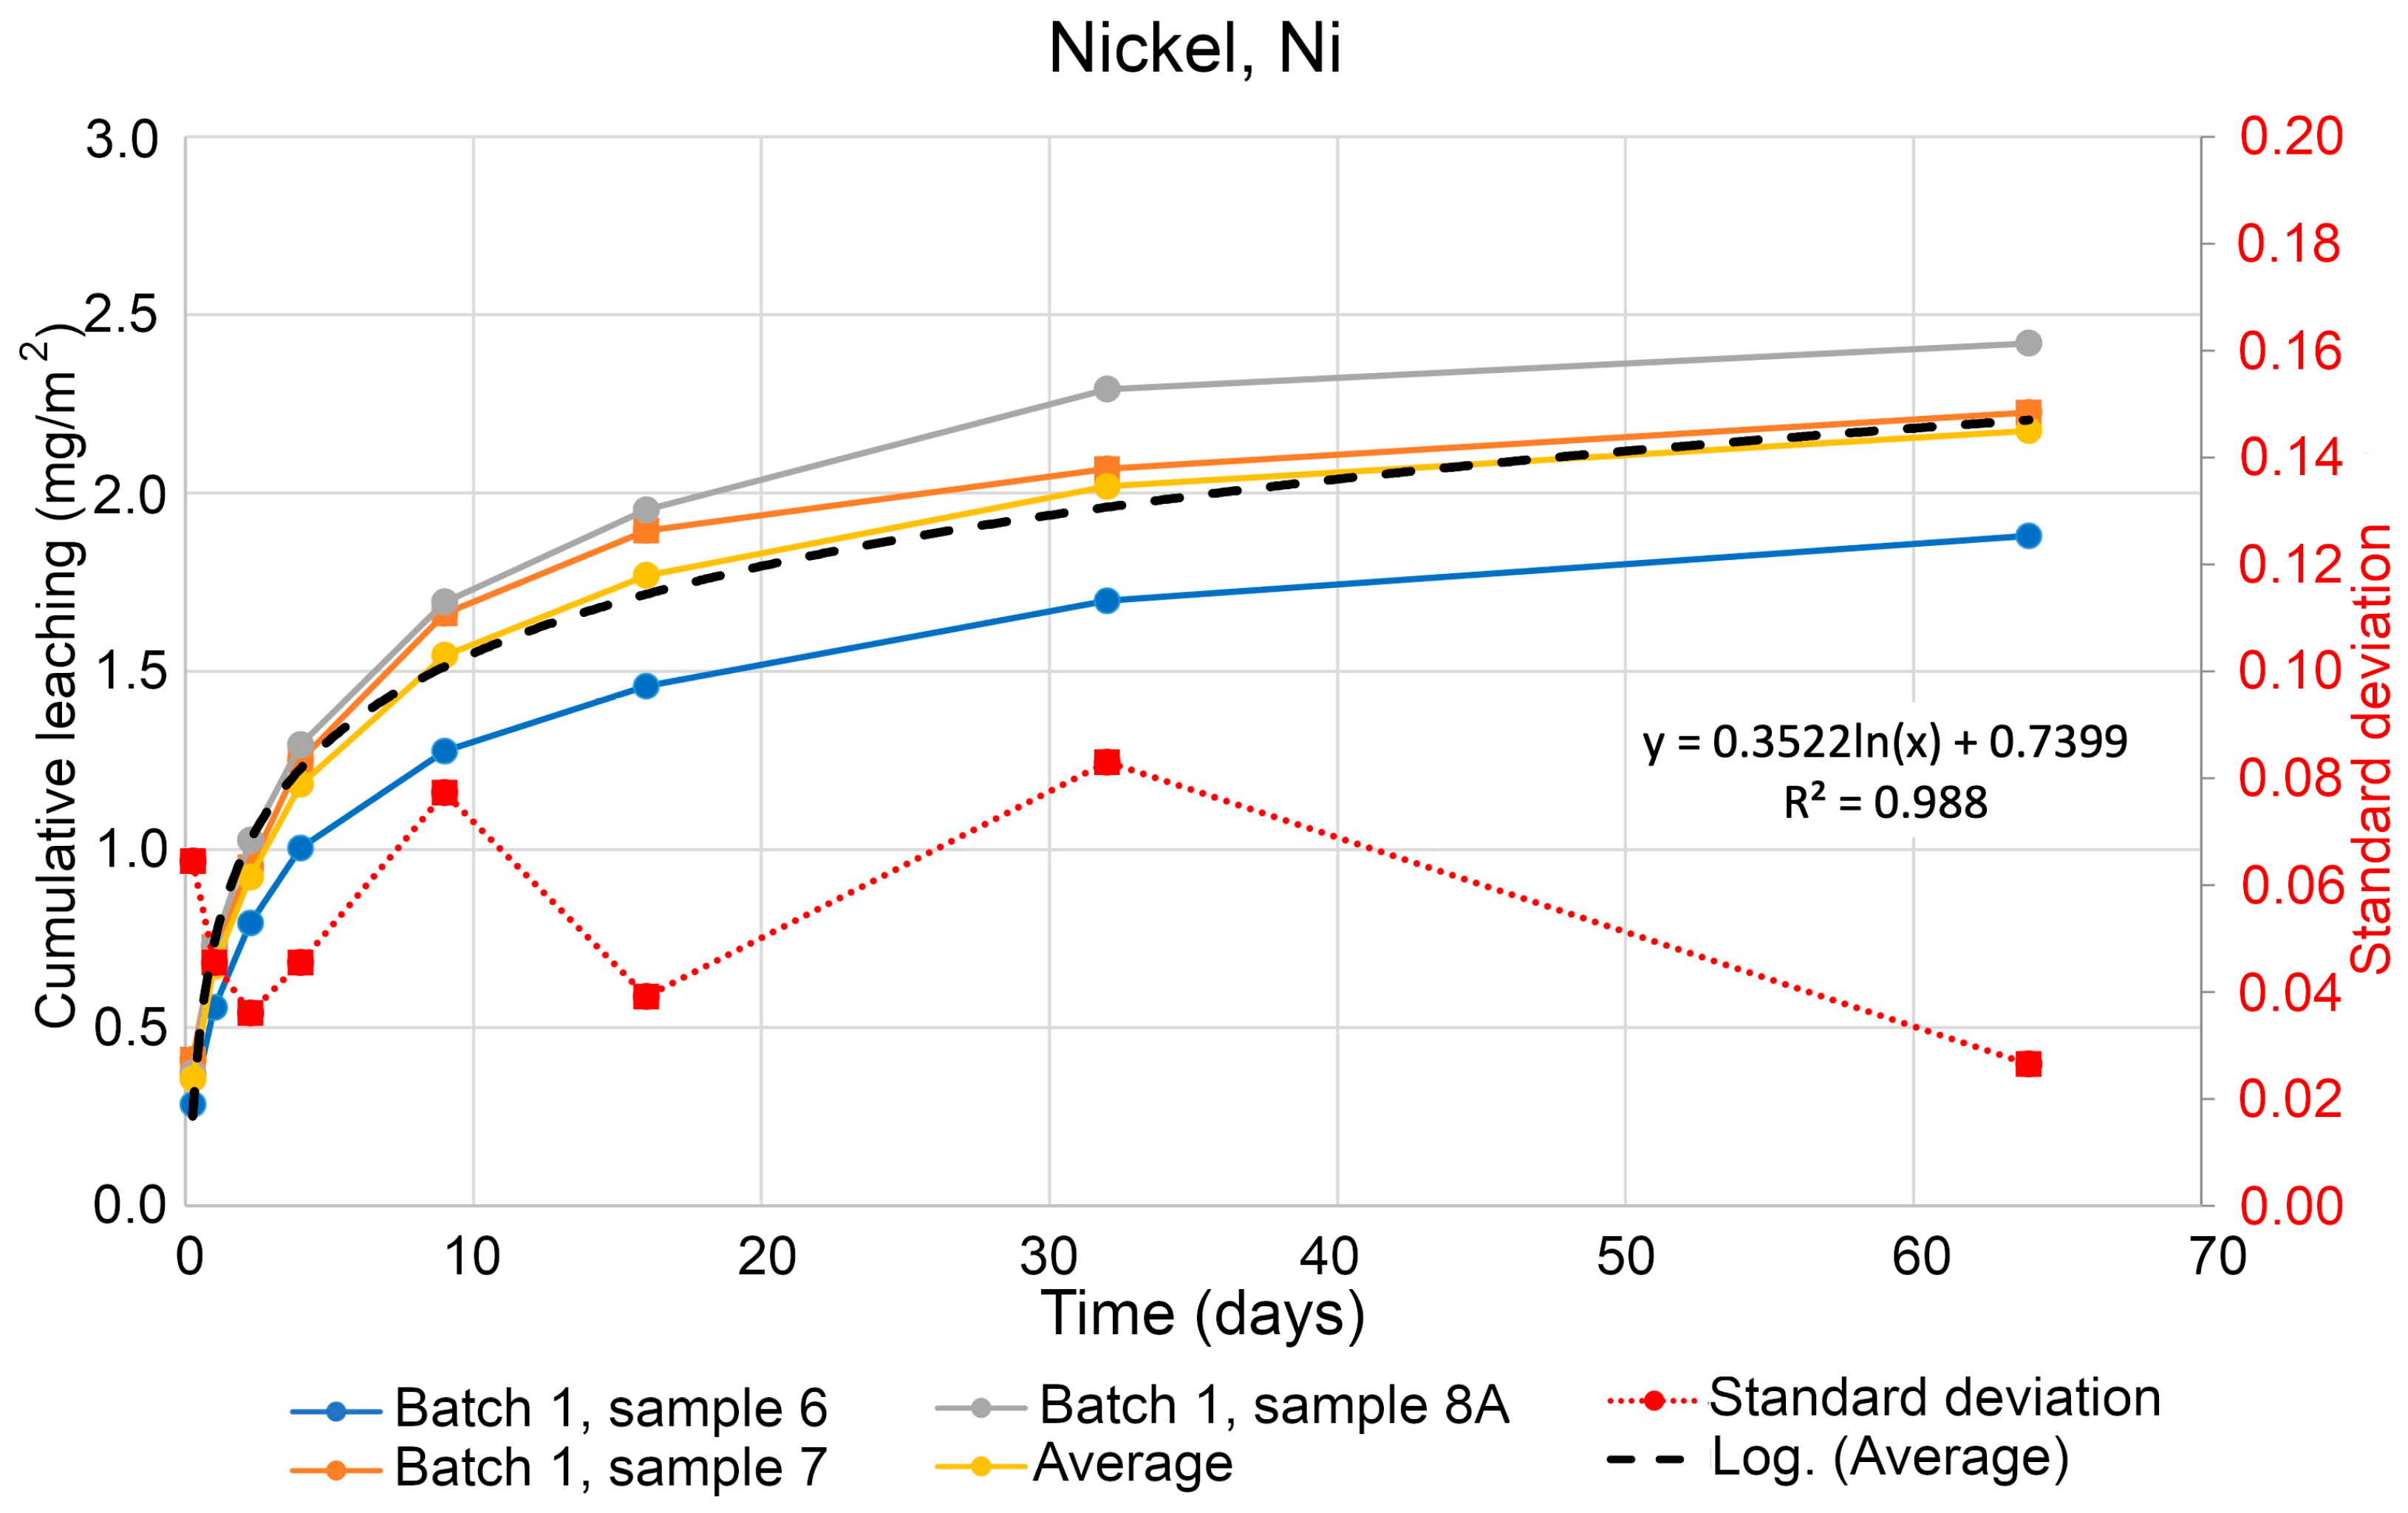
Figure 6 shows a cumulative leaching of nickel (Ni) over time. The average value of the three samples is used to plot a statistical trend line showing general development and the interpolated trend in the increase in leaching of Ni. The equation from the trend line is used to calculate the expected leaching of Ni in one year. A trend of Ni leaching is based on the evaluated data from Batch 1 using Samples 6, 7, and 8A. For Ni, the results of estimated leaching look similar and in the same way as for As. Likewise, the regression equation was used from Figure 7 for modelling the data using a time span of 365 days to evaluate possible leaching of Ni per m2 during one year by Equation (2). The computed data give an estimated amount of leaching of Ni as 2.8178 mg/m2 per year.
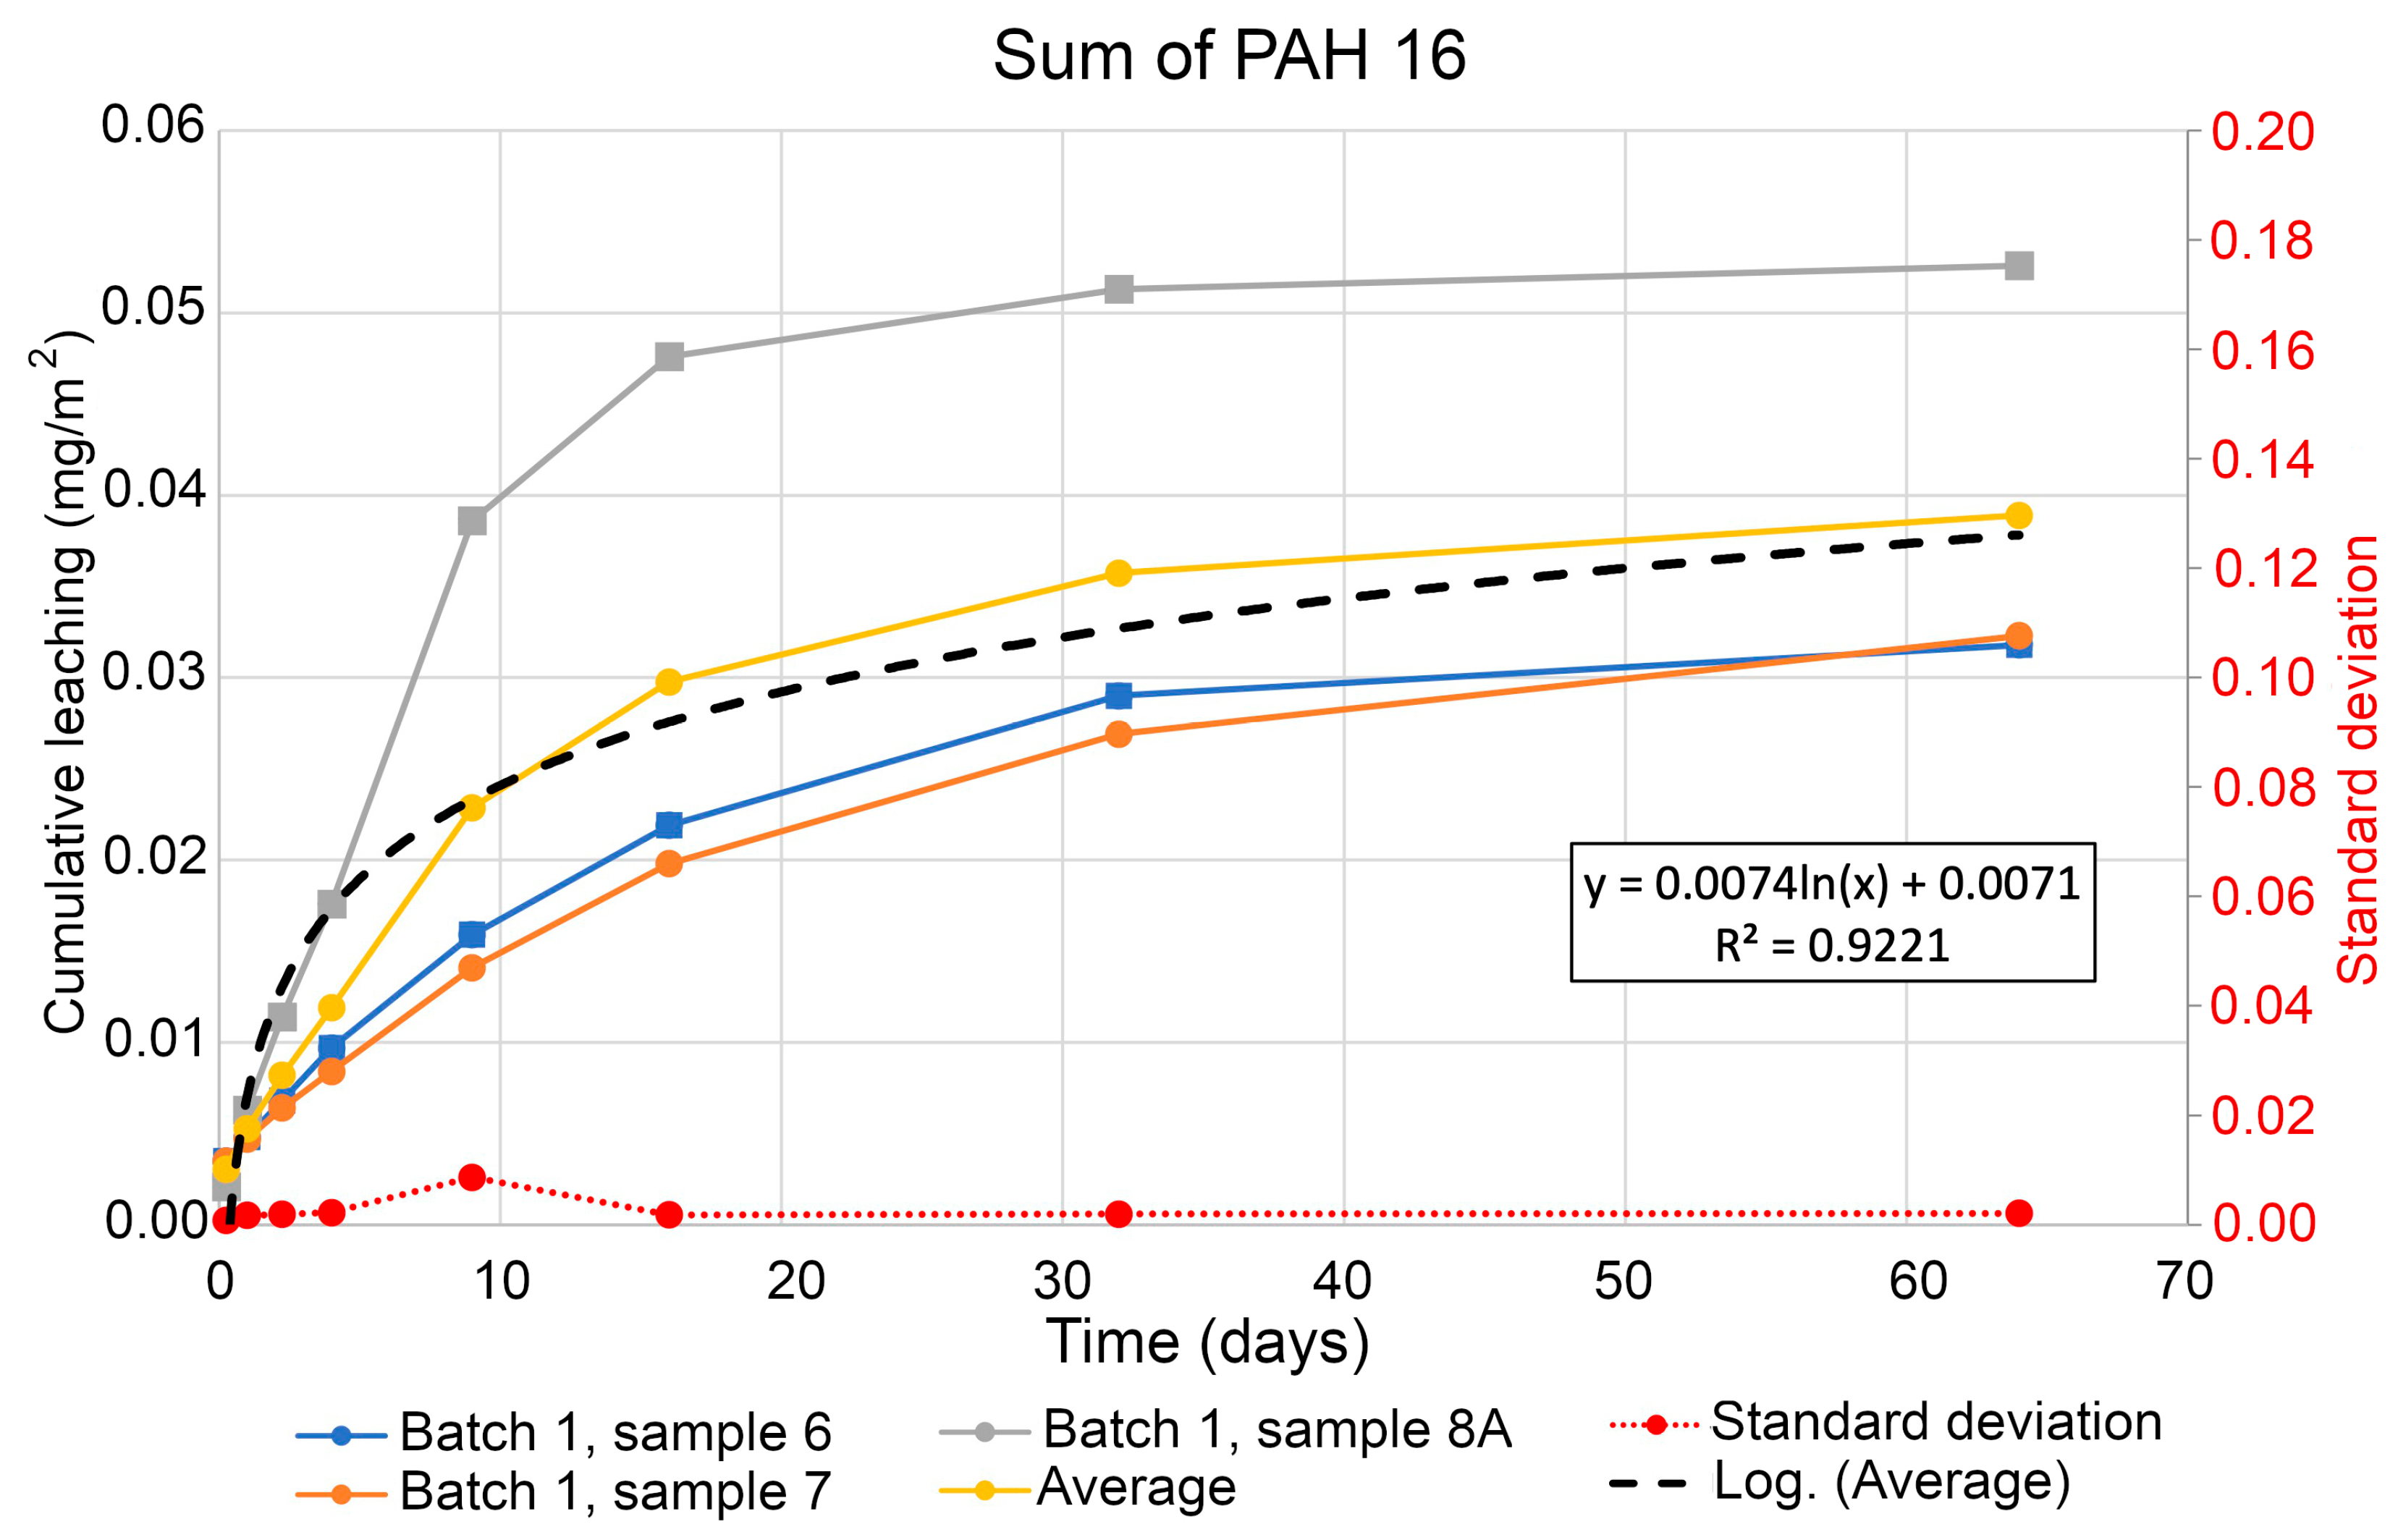
Figure 7 shows a graph of the cumulative leaching of PAH-16 in soil samples over time. Here, the results vary a little between sample 8A and samples 6 and 7. However, the standard deviation between those samples is low. The average value of the three samples is used to visualise a statistical trend line. The equation from this line is then used to calculate the expected leaching of PAH-16 after 365 days in m2, according to Equation (3). This gives an estimated value of possible leaching of total PAH-16 as 0.0507 mg/m2 from the soil in Kongshavn per one calendar year.
The actual content of the PAH-16 substance reflects the results of the statistical analysis. The location of sampling marks was identified with each sampling case representing a central point of the line in a given transect. The detection limit was determined with regard to the standard deviation (Figure 7) obtained when evaluating soil samples. Leaching of PAH-16 is determined as 10 times the standard deviation for specimens and is roughly three times higher than the detected limits of PAH-16 presented in specimens. The dynamics of the PAH-16 leaching was detected based on the frequent measurements as regular samplings of the soil, represented on the lines of the graphs as dots encountered once for the period of measurements on each line segment. The lowest concentration level of PAH-16 was determined as a limit of quantification, that is, quantitatively assessed with a satisfactory certainty.
The overall trend of PAH-16 leaching is increasing with regard to the line path, i.e., the total amount of contaminant is gradually released from the specimens along with soil treatment. This proves a positive effect of solidification and stabilization of soil on the removal of PAH-16 contaminants from soil. The leaching of PCB was not calculated since the values for leached amount of PCBs are positive, i.e., lower than the threshold limit.
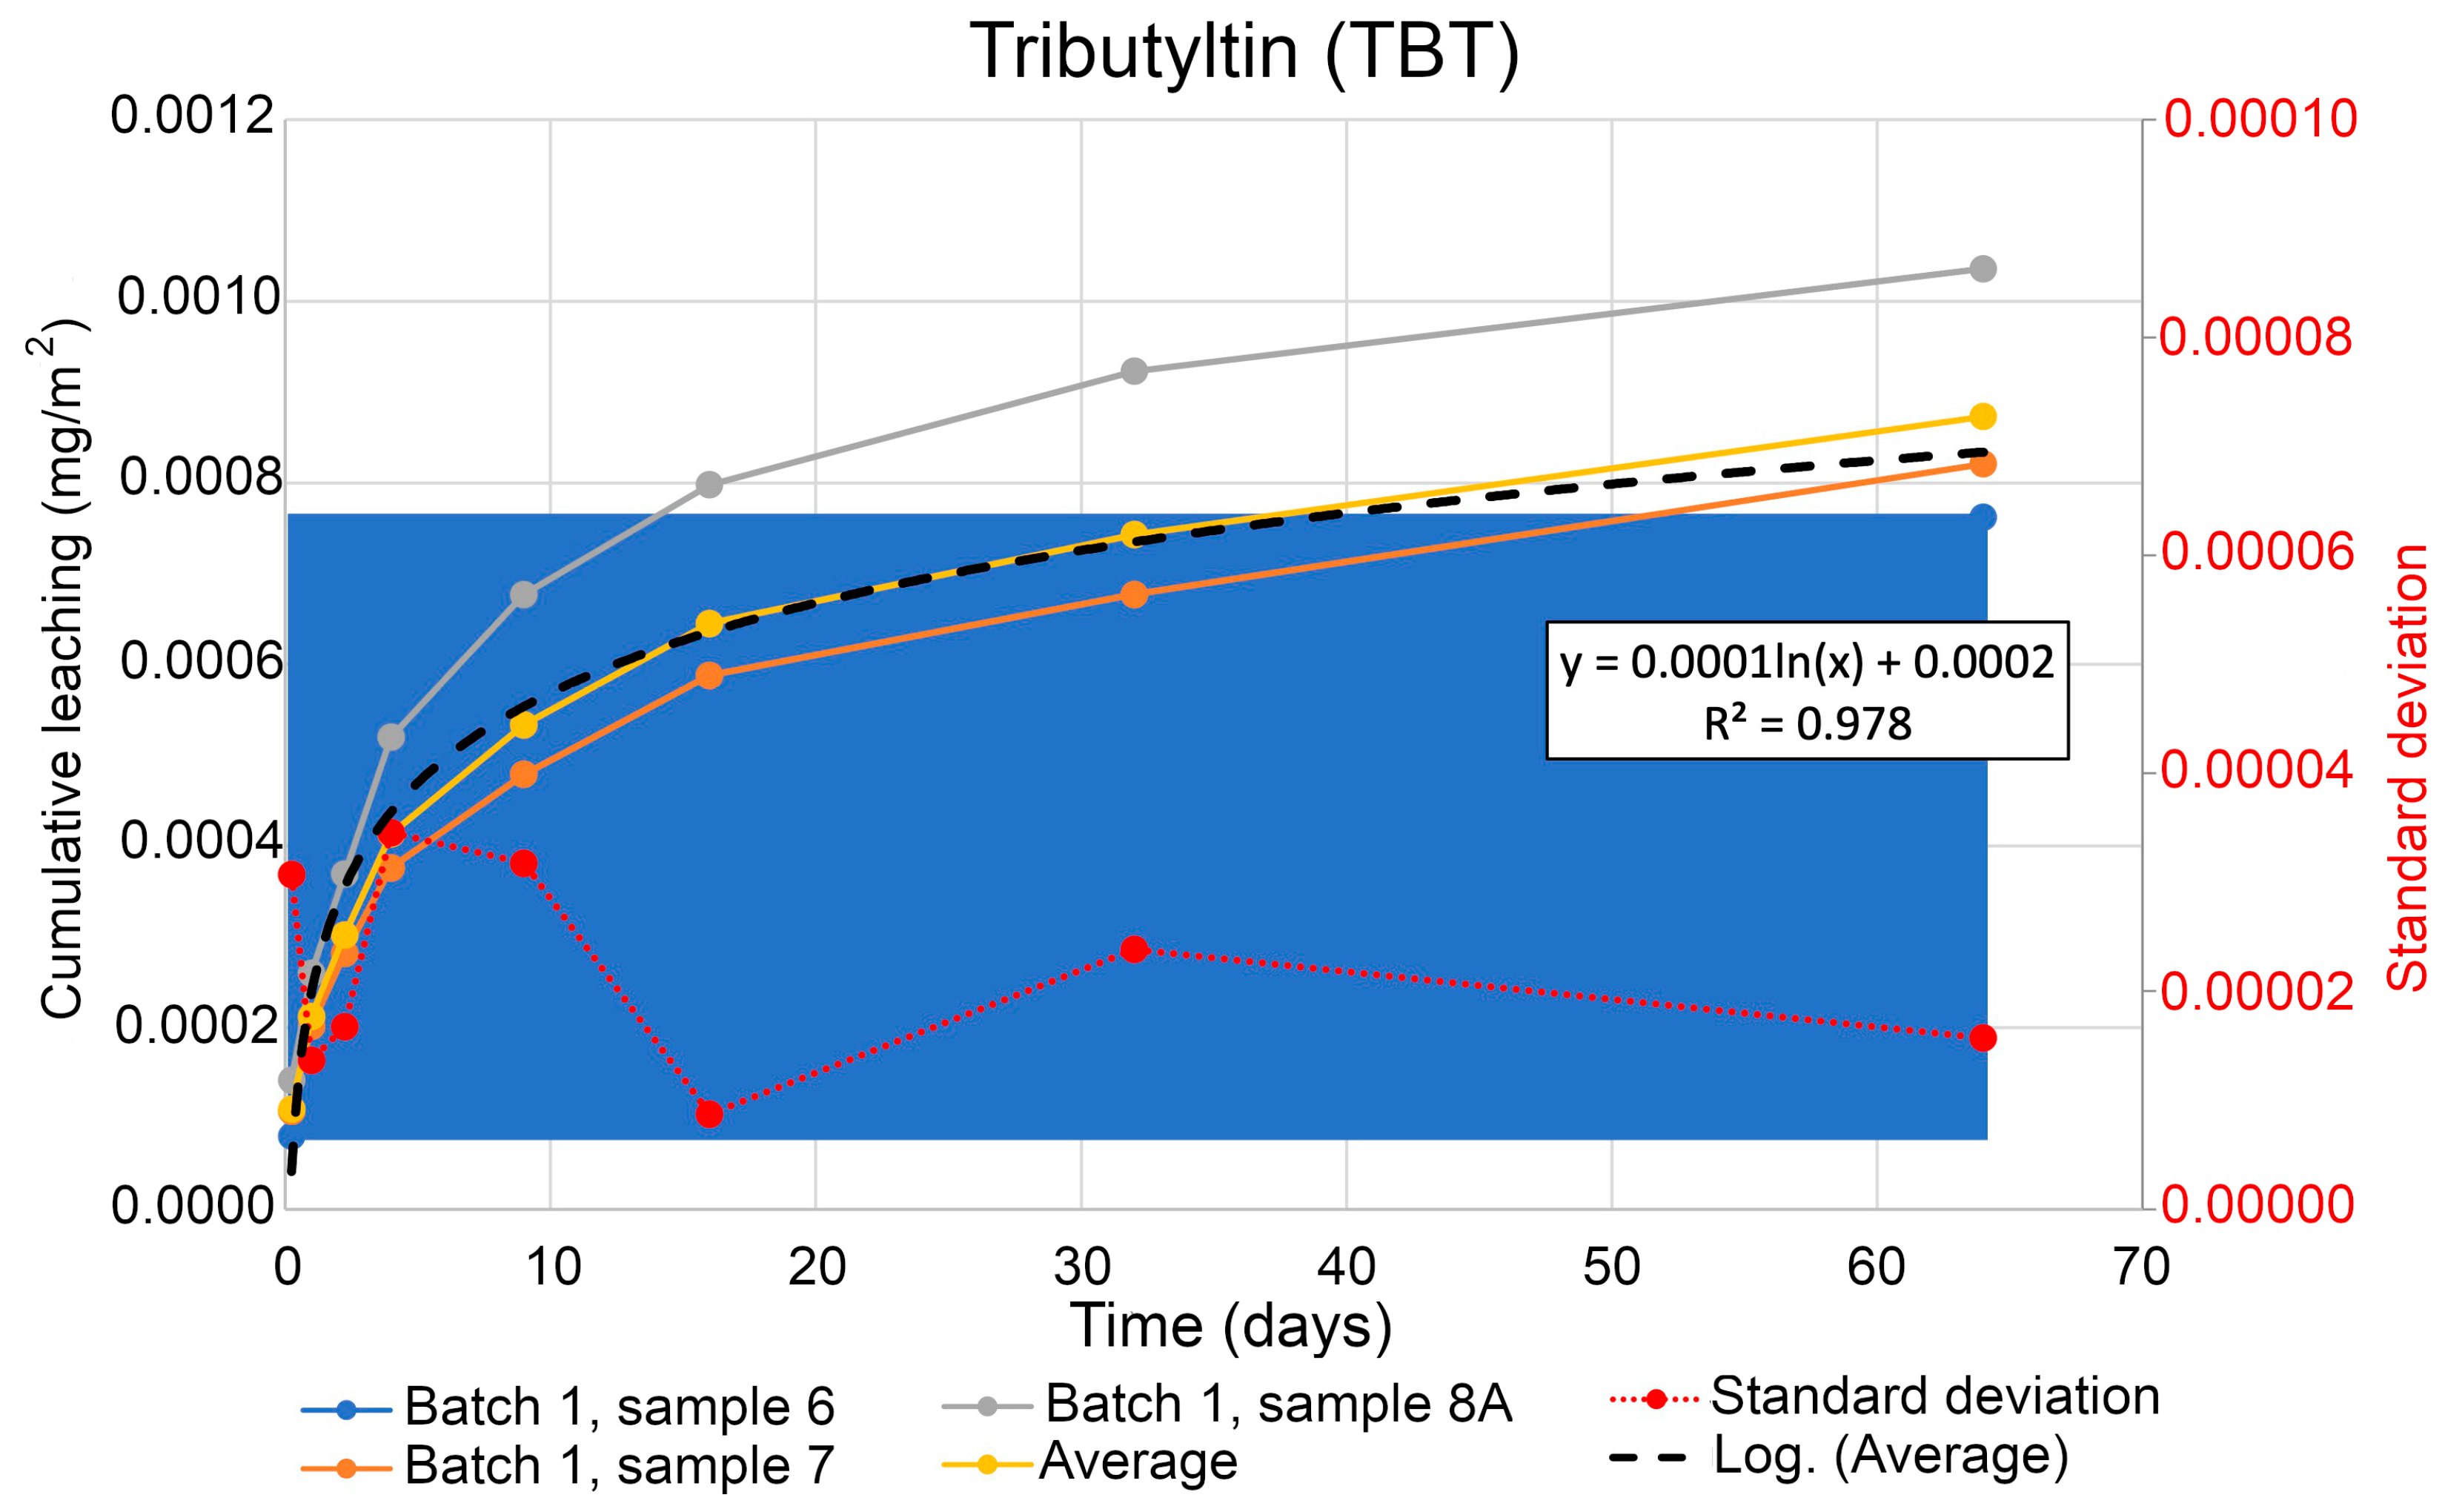
Figure 8 shows the dynamics of the cumulative leaching of organotin compound tributyltin (TBT) over time. Using the regression equation from Figure 8 extrapolated for a time period 365 days, the TBT leaching was modelled for a year in m2, following Equation (4). The obtained results give an estimated amount of leaching of TBT of 0.00061 mg/m2 per year. The average value of the three samples is used to draw a statistical trend line which was used to calculate the equation for the expected leaching of TBT within one year. The threshold limit specified for TBT is standard for the concentration parameter. The variations in the TBT concentration can be affected by the dilution due to matrix disturbances, limited sample quantity, or low dry matter content. The threshold limit of chemical substances was estimated following the analytical method which evaluates the lowest level of concentration at which the contaminants are detected in a soil sample.
For evaluation of the obtained results, a comparison has been completed between the results for surface leaching received in the present study against those from other studies [94,95,96]. More specifically, ref. [97] demonstrates similar results on leaching of As, Pb, and Sb; the immobilisation of Cr, Cu, and Zn were assessed by [98]. Furthermore, ref. [99] reports the leaching of diverse heavy metals from remediated soil. The removal of PHB that is a waste product from the aluminium industry is reported in [100] using stabilization and neutralization methods.
Table 7 summarises the values of leaching recorded in samples from Oslo (O), Arendal (A), and Timrå (T). The results are based on the measurements performed after 9 days of soil testing, and show surface leaching of contaminants (heavy metals and TBT, mg/m2) from soil after 9 days of testing, as shown in Table 7. The threshold limits of contaminant concentration of TBT and heavy metals with regard to the content of binder (water–binder ratio) were evaluated in soil samples as a collective designation for the highest levels of the substances in samples and compared for various test locations, as shown in Table 7. The analysis of Table 7 indicates that the amount of As is slightly higher in Kongshavn Port of Oslo (O) than for Arendal (A) and Timrå (T); however, the content of Cd, Cr, and Ni is lower. Similar results were reported earlier in the study on the immobilisation of Mg, Cu, Zn, Al, and K which were evaluated in Swedish soils in Timrå [101].
As for TBT, the levels are significantly lower in Oslo than for the corresponding sample in Arendal. The TBT was not analysed in the Timrå project, and, therefore, could only be compared between the sampling results from Oslo and Arendal. The threshold limit for for contaminants was determined as a quantification limit of seven types of heavy metals, PAH-16, TBT, and PCB. The applied methodology was optimised to evaluate and report the concentration values in the contaminants from soil stabilised with various binder proportions. The specimens were treated using geotechnical and environmental engineering tests and then evaluated using quantitative methods of the statistical analysis. The comparison of the leaching levels was performed using estimated levels over time as accumulative leaching compared to the background level of toxic contaminants.
4. Conclusions
Recent industrialisation has resulted in the increased soil contamination by heavy metals, TBT, PCB, and PAH. The need for decontamination and remediation of soil aimed at removing contaminants in large quantities necessitates the development of effective optimised methods for soil treatment. Using adjusted stabilization workflow with experimentally adjusted proportions of binders, the scheme of soil remediation has been employed in polluted sediments collected from the Port of Oslo (Kongshavn), Norway. This method demonstrated a particular effectiveness for immobilisation of heavy metals, TBT, PAH, and PCB from soil samples.
We have proposed an optimised approach to leaching experiments on soil for physical decontamination from heavy metals and chemical PAH, PCB, and TBT that relies on processing the soil samples using multi-factor tests. To this end, we have performed a series of the experiments on soil testing that allow modelling the non-linear behaviour of leaching from soil and the evaluation of the effects from the combination of binders. This method of soil decontamination provided additional information on the concentration of contaminants in the sampled soil collected in Kongshavn (Port of Oslo) and enabled the estimation of a prognosis of leaching for one year based on the obtained results simulated for long term release.
Soil contamination is a significant environmental problem that includes threats to human health and environmental sustainability. At the same time, large construction and industrial projects increase soil contamination. This project contributed to establish the links between the construction engineering and environmental monitoring. Specifically, the presented scheme of the workflow enabled to perform accurate decontamination and remediation of soil based on the proposed integrated approaches of in situ soil sampling and statistical data analysis. As a result of the implemented framework, soil specimens were processed, stabilized, solidified, and decontaminated. Such workflow presented a model for the further processing of large quantities of soil material in harbours and marine ports. For environmental purposes, data extrapolation was presented for the estimation of possible leaching dynamics during one year. The visualised examples of leaching behaviour from contaminated soil are presented graphically and in tables with provided detailed comments and formulae used for numerical modelling.
Optimization of workflow is a crucial issue in large-scale projects, such as harbour construction and civil engineering. A current limitation of our project is its use of dredged sediments collected from the harbour. This has shortcomings, since sampling of the marine sediments decreases the availability of suitable disposal specimens and increases the transportation and storage costs. At the same time, soil processing for industrial projects involves a lengthy, costly, and difficult process and high capital costs. As a continuation of this work, we intend to study the soil properties using samples collected at different depths. We also plan to investigate how statistical methods could be exploited to model soil collected in large quantities (hundreds of tons) for optimization of large-scale industrial projects such as harbour construction.
This study contributes to a better understanding of leaching behaviour in the stabilized soil and can be considered and compared in similar research. The obtained results can be used as information for the environmental risk assessment and evaluation of soil quality. This article gives an insight on the durability of the treated soil based on the performed environmental engineering workflow. The results can be reused for estimation of the pollution level in the areas of Kongshavn. As a recommendation for future similar works where large quantity of soil should be processed for industrial construction purposes with optimised workflow, a pilot project should always be carried out to ensure the reduced cost of soil processing in a large volume before testing. Second, when comparing laboratory tests and pilot scale, the temperature of the dredged soil masses should be taken into account since it plays a role in the development of soil strength. Moreover, to control soil properties, temperature measurements should be included at different depths.
Author Contributions
Supervision, conceptualization, methodology, visualization, software, resources, data curation, formal analysis, validation, funding acquisition, and project administration, P.L. (Per Lindh); writing—original draft preparation, methodology, software, formal analysis, writing—review and editing, and investigation, P.L. (Polina Lemenkova). All authors have read and agreed to the published version of the manuscript.
Funding
This research received no external funding.
Data Availability Statement
Not applicable.
Acknowledgments
The authors thank the reviewers for reading, suggestions and comments that improved an earlier version of this manuscript.
Conflicts of Interest
The authors declare no conflict of interest.
Abbreviations
The following abbreviations are used in this manuscript:
| BCSA | Belite Calcium Sulfoaluminate |
| BaP | Benz[a]pyrene |
| BghiP | Benz[g,h,i]perylene |
| DBT | Dibutyltin |
| DBahA | Dibenz[a,h]anthracene |
| DOT | Dioctyltin |
| DPhT | Diphenyltin |
| IP | Indeno[1,2,3-cd]pyrene |
| MBT | Monobutyltin |
| MOT | Monooctyltin |
| MPhT | Monophenyltin |
| PAH | Polycyclic Aromatic Hydrocarbon |
| PCB | Polychlorinated biphenyl |
| SGI | Swedish Geotechnical Institute |
| TBT | Tributyltin |
| TPhT | Triphenyltin |
| TCyT | Tricyclohexyltin |
| TTBT | Tetrabutyltin |
Appendix A. Leaching of Contaminants: Sampling 2317–2324
Appendix A.1. Surface Leaching of Contaminants
Notations for common for all the samples in Table A1; the applied Methodology is based on standard SS-EN 15863:2015. The start and end days of the tests are from 30 January 2023 until 4 April 2023. The experiments were performed in Swedish Geotechnical Institute. The amount of leachate for all samples is 1.50 L. Conductivity was measured in mS/m by temperature of sampling at 25 C. The period refers to the day of sampling. Surface: 0.0197 m2. Redox (mVolts) refers to oxidation (reduction) potential of solutions or chemical species to acquire/lose electrons and be reduced/oxidised. Leached amount/withdrawal is given in mg/m2 for all the samples.
Abbreviations for organic compounds: Acy—acenaphthylene; BaP—Benz(a)pyrene; B[a]A—Benz[a]anthracene; BjF—Benzo[j]fluoranthene; BkF—Benzo[k]fluoranthene; MBT—Monobutyltin; DBT—Dibutyltin; TBT—Tributyltin; TTBT—Tetrabutyltin; MOT—Monooctyltin; DOT—Dioctyltin; TCyT—Tricyclohexyltin; MPhT—Monophenyltin; DPhT—Diphenyltin; IP—Indeno[1,2,3-cd]pyrene; DBahA—Dibenz[a,h]anthracene; BghiP—Benz[g,h,i]perylene; TPhT—Triphenyltin; Total oth. PAH—Total other PAH; Total carc. PAH—Total amount of carcinogenic PAH.

Table A1.
Surface leaching of contaminants (heavy metals, organic compounds, PCB and PAH, mg/m2) from soil specimens during period of 64 days of sampling (2317–2324).
Table A1.
Surface leaching of contaminants (heavy metals, organic compounds, PCB and PAH, mg/m2) from soil specimens during period of 64 days of sampling (2317–2324).
| Period | 6 h | 1 Days | 2.25 Days | 4 Days | 9 Days | 16 Days | 36 Days | 64 Days |
|---|---|---|---|---|---|---|---|---|
| Sample No | 2317 | 2318 | 2319 | 2320 | 2321 | 2322 | 2323 | 2324 |
| pH | 8.93 | 9.12 | 8.85 | 9.18 | 9.17 | 8.95 | 8.43 | 8.11 |
| Conductivity | 2510 | 2500 | 2980 | 2760 | 2740 | 2750 | 2770 | 2750 |
| Redox (mV) | 29 | 73 | 33 | 34 | 21 | 19 | 48 | 84 |
| Al | 2.08 | 1.69 | 1.49 | 1.29 | 0.755 | 0.751 | 0.585 | 0.531 |
| As | 0.0553 | 0.0736 | 0.084 | 0.0852 | 0.0807 | 0.35 | 0.0728 | 0.0669 |
| Ba | 6.31 | 7.02 | 8.4 | 7.5 | 13.1 | 13.3 | 21.6 | 22 |
| Ca | 15,500 | 17,000 | 19,600 | 19,300 | 24,300 | 25,300 | 34,600 | 38,200 |
| Cd | <0.004 | <0.004 | <0.004 | <0.004 | <0.004 | <0.004 | <0.004 | <0.004 |
| Co | 0.038 | 0.0306 | 0.0244 | 0.0202 | 0.0333 | 0.0244 | 0.0358 | 0.0508 |
| Cr | <0.04 | <0.04 | <0.04 | <0.04 | <0.04 | <0.04 | <0.04 | <0.04 |
| Cu | 1.58 | 1.03 | 0.744 | 0.532 | 0.653 | 0.5 | 0.86 | 0.634 |
| Fe | 0.898 | 0.739 | 0.664 | 0.486 | <0.3 | <0.3 | <0.3 | <0.3 |
| Hg | <0.002 | <0.002 | <0.002 | <0.002 | <0.002 | <0.002 | <0.002 | <0.002 |
| K | 15,900 | 15,600 | 17,300 | 16,200 | 15,700 | 15,700 | 16,300 | 15,400 |
| Mg | 39,000 | 38,700 | 43,100 | 40,000 | 33,100 | 34,300 | 26,200 | 25,400 |
| Mn | 1.2 | 0.944 | 0.566 | 0.661 | 0.218 | 0.321 | 0.0646 | 0.0921 |
| Mo | 0.807 | 0.709 | 0.807 | 0.727 | 0.91 | 0.776 | 1.13 | 1.18 |
| Na | 374,000 | 374,000 | 414,000 | 390,000 | 368,000 | 370,000 | 356,000 | 360,000 |
| Ni | 0.285 | 0.271 | 0.237 | 0.211 | 0.272 | 0.182 | 0.24 | 0.182 |
| Pb | <0.02 | <0.02 | <0.02 | <0.02 | <0.02 | <0.02 | <0.02 | <0.02 |
| V | 0.153 | 0.212 | 0.24 | 0.282 | 0.391 | 0.264 | 0.155 | 0.139 |
| Zn | 0.18 | <0.2 | <0.2 | 0.179 | <0.2 | <0.2 | <0.2 | <0.2 |
| B | 140 | 142 | 157 | 145 | 126 | 126 | 101 | 101 |
| Sb | 0.0467 | 0.0534 | 0.0496 | 0.0575 | 0.0822 | 0.0688 | 0.11 | 0.116 |
| Se | <0.2 | <0.2 | <0.2 | <0.2 | <0.2 | 7.2 | <0.2 | <0.2 |
| Naphthalene | <0.002 | <0.002 | <0.002 | <0.002 | <0.002 | <0.002 | <0.002 | <0.002 |
| Acy | <0.0008 | <0.0008 | <0.0008 | <0.0008 | <0.0008 | <0.0008 | <0.0008 | <0.0008 |
| Acenaphthene | <0.0008 | <0.0008 | <0.0008 | <0.0008 | 0.00099 | 0.00084 | <0.0008 | <0.0008 |
| Fluorine | <0.0008 | <0.0008 | <0.0008 | <0.0008 | <0.0008 | <0.0008 | <0.0008 | <0.0008 |
| Phenanthrene | <0.002 | <0.002 | <0.002 | <0.002 | <0.002 | <0.002 | <0.002 | <0.002 |
| Anthracene | <0.0008 | <0.0008 | <0.0008 | <0.0008 | <0.0008 | <0.0008 | <0.0008 | <0.0008 |
| Fluoranthene | <0.0008 | <0.0008 | <0.0008 | <0.00084 | 0.002 | 0.0014 | 0.0019 | <0.0008 |
| Pyrene | <0.0008 | 0.0013 | 0.002 | 0.0021 | 0.0037 | 0.004 | 0.0052 | 0.0028 |
| B[a]A | <0.0008 | <0.0008 | <0.0008 | <0.0008 | <0.0008 | <0.0008 | <0.0008 | <0.0008 |
| Chrysene | <0.0008 | <0.0008 | <0.0008 | <0.0008 | <0.0008 | <0.0008 | <0.0008 | <0.0008 |
| BjF | <0.0008 | <0.0008 | <0.0008 | <0.0008 | <0.0008 | <0.0008 | <0.0008 | <0.0008 |
| BkF | <0.0008 | <0.0008 | <0.0008 | <0.0008 | <0.0008 | <0.0008 | <0.0008 | <0.0008 |
| BaP | <0.0008 | <0.0008 | <0.0008 | <0.0008 | <0.0008 | <0.0008 | <0.0008 | <0.0008 |
| DBahA | <0.0008 | <0.0008 | <0.0008 | <0.0008 | <0.0008 | <0.0008 | <0.0008 | <0.0008 |
| BghiP | <0.0008 | <0.0008 | <0.0008 | <0.0008 | <0.0008 | <0.0008 | <0.0008 | <0.0008 |
| IP | <0.0008 | <0.0008 | <0.0008 | <0.0008 | <0.0008 | <0.0008 | <0.0008 | <0.0008 |
| Total PAH 16 | <0.0072 | 0.0013 | 0.002 | 0.0029 | 0.0062 | 0.006 | 0.0071 | 0.0028 |
| Total carc. PAH | <0.0027 | <0.0027 | <0.0027 | <0.0027 | <0.0027 | <0.0027 | <0.0027 | <0.0027 |
| Total oth. PAH | <0.005 | 0.0013 | 0.002 | 0.0029 | 0.0062 | 0.006 | 0.0071 | 0.0028 |
| Total PAH L | <0.0019 | <0.0019 | <0.0019 | <0.0019 | 0.00099 | 0.00084 | <0.0019 | <0.0019 |
| Total PAH M | <0.002 | 0.0013 | 0.002 | 0.0029 | 0.0052 | 0.0052 | 0.0071 | 0.0028 |
| Total PAH H | <0.003 | <0.003 | <0.003 | <0.003 | <0.003 | <0.003 | <0.003 | <0.003 |
| MBT | 0.000404 | 0.00326 | 0.00202 | 0.00223 | 0.00536 | 0.0055 | 0.0044 | 0.00711 |
| DBT | <0.00008 | <0.00008 | <0.00008 | <0.00008 | 0.000142 | 0.000112 | 0.000153 | 0.00024 |
| TBT | 0.0000807 | 0.0000951 | <0.00008 | 0.0000883 | 0.000101 | 0.000104 | 0.0000799 | 0.000133 |
| TTBT | <0.00008 | <0.00008 | <0.00008 | <0.00008 | <0.00008 | <0.00008 | <0.00008 | <0.00008 |
| MOT | <0.00008 | <0.00008 | <0.00008 | <0.00008 | <0.00008 | <0.00008 | <0.00008 | <0.00008 |
| DOT | <0.00008 | <0.00008 | <0.00008 | <0.00008 | <0.00008 | <0.00008 | <0.00008 | <0.00008 |
| TCyT | <0.00008 | <0.00008 | <0.00008 | <0.00008 | <0.00008 | <0.00008 | <0.00008 | <0.00008 |
| MPhT | <0.00008 | <0.00008 | <0.00008 | <0.00008 | <0.00008 | <0.00008 | <0.00008 | <0.00008 |
| DPhT | <0.00008 | <0.00008 | <0.00008 | <0.00008 | <0.00008 | <0.00008 | <0.00008 | <0.00008 |
| TPhT | <0.00008 | <0.00008 | <0.00008 | <0.00008 | <0.00008 | <0.00008 | <0.00008 | <0.00008 |
| PCB 28 | <0.000084 | <0.000084 | <0.000084 | <0.000084 | <0.000084 | <0.000084 | <0.000084 | <0.000084 |
| PCB 52 | <0.000084 | <0.000084 | <0.000084 | <0.000084 | <0.000084 | <0.000084 | <0.000084 | <0.000084 |
| PCB 101 | <0.000084 | <0.000084 | <0.000084 | <0.000084 | <0.000084 | <0.000084 | <0.000084 | <0.000084 |
| PCB 118 | <0.000084 | <0.000084 | <0.000084 | <0.000084 | <0.000084 | <0.000084 | <0.000084 | <0.000084 |
| PCB 138 | <0.000091 | <0.000091 | <0.000091 | <0.000091 | <0.000091 | <0.000091 | <0.000091 | <0.000091 |
| PCB 153 | <0.000084 | <0.000084 | <0.000084 | <0.000084 | <0.000084 | <0.000084 | <0.000084 | <0.000084 |
| PCB 180 | <0.000084 | <0.000084 | <0.000084 | <0.000084 | <0.000084 | <0.000084 | <0.000084 | <0.000084 |
| Total PCB 7 | <0.0003 | <0.0003 | <0.0003 | <0.0003 | <0.0003 | <0.0003 | <0.0003 | <0.0003 |
Appendix A.2. Cumulative Surface Leaching of Contaminants
Notations for Table A2: The applied methodology is based on the three approaches:
- Standards SS-EN ISO 10523:2012 with measurement uncertainty of ±0.05 pH-enh;
- SS-EN 27888-1:1994 with measurement uncertainty ±2.9%;
- SGI-method with measurement uncertainty pf ± 25%.
Abbreviations for organic compounds in Table A2: Acy—acenaphthylene; BaP—Benz[a]pyrene; B[a]A—Benz[a]anthracene; BjF—Benzo[j]fluoranthene; BghiP—Benz[g,h,i]perylene; BkF—Benzo[k]fluoranthene; MBT—Monobutyltin; DBT—Dibutyltin; TBT—Tributyltin; TTBT—Tetrabutyltin; MOT—Monooctyltin; DOT—Dioctyltin; TCyT—Tricyclohexyltin; MPhT—Monophenyltin; DPhT—Diphenyltin; IP—Indeno[1,2,3-cd]pyrene; DBahA—Dibenz[a,h]anthracene; TPhT—Triphenyltin; Total oth. PAH—Total other PAH; Total carc. PAH—Total amount of carcinogenic PAH.
Table A2.
Cumulative surface leaching (heavy metals, organic compounds, PCB and PAH, mg/m2) from soil specimens during period of 64 days of sampling (2317–2324).
Table A2.
Cumulative surface leaching (heavy metals, organic compounds, PCB and PAH, mg/m2) from soil specimens during period of 64 days of sampling (2317–2324).
| Period | 6 h | 1 Days | 2.25 Days | 4 Days | 9 Days | 16 Days | 36 Days | 64 Days |
|---|---|---|---|---|---|---|---|---|
| Sample No | 2317 | 2318 | 2319 | 2320 | 2321 | 2322 | 2323 | 2324 |
| Al | 2.08 | 3.77 | 5.26 | 6.55 | 7.3 | 8.05 | 8.64 | 9.17 |
| As | 0.0553 | 0.129 | 0.21 | 0.298 | 0.379 | 0.73 | 0.802 | 0.868 |
| Ba | 6.31 | 13.3 | 22 | 29.2 | 42.3 | 55.6 | 77.2 | 99 |
| Ca | 15,500 | 32,000 | 51,900 | 71,200 | 95,500 | 121,000 | 155,000 | 194,000 |
| Cd | <0.004 | <0.008 | <0.01 | <0.02 | <0.02 | <0.02 | <0.03 | <0.03 |
| Co | 0.038 | 0.0686 | 0.093 | 0.113 | 0.147 | 0.171 | 0.207 | 0.258 |
| Cr | <0.04 | <0.08 | <0.1 | <0.2 | <0.1 | <0.1 | <0.3 | <0.3 |
| Cu | 1.58 | 2.6 | 3.35 | 3.88 | 4.53 | 5 | 5.89 | 6.53 |
| Fe | 0.898 | 1.64 | 2.3 | 2.79 | <3 | <3 | <4 | <4 |
| Hg | <0.002 | <0.003 | <0.005 | <0.006 | <0.008 | <0.009 | <0.01 | <0.01 |
| K | 15,900 | 31,500 | 48,800 | 65,000 | 80,700 | 96,400 | 113,000 | 128,000 |
| Mg | 39,000 | 77,500 | 121,000 | 161,000 | 194,000 | 228,000 | 254,000 | 280,000 |
| Mn | 1.2 | 2.16 | 2.73 | 3.39 | 3.61 | 3.93 | 3.99 | 4.08 |
| Mo | 0.807 | 1.52 | 2.32 | 3.05 | 4 | 4.74 | 5.87 | 7.05 |
| Na | 374,000 | 748,000 | 1,160,000 | 1,550,000 | 1,920,000 | 2,290,000 | 2,650,000 | 3,000,000 |
| Ni | 0.285 | 0.556 | 0.793 | 1 | 1.28 | 1.46 | 1.7 | 1.88 |
| Pb | <0.02 | <0.03 | <0.05 | <0.06 | <0.08 | <0.09 | <0.1 | <0.1 |
| V | 0.153 | 0.365 | 0.605 | 0.887 | 1.28 | 1.54 | 1.7 | 1.84 |
| Zn | 0.18 | <0.3 | <0.5 | 0.666 | <0.8 | <1 | <1 | <1 |
| B | 140 | 282 | 438 | 584 | 710 | 836 | 937 | 1040 |
| Sb | 0.0467 | 0.1 | 0.15 | 0.207 | 0.289 | 0.358 | 0.468 | 0.584 |
| Se | <0.2 | <0.5 | <0.7 | <0.9 | <1 | 8.34 | <9 | <9 |
| Naphthalene | <0.002 | <0.005 | <0.007 | <0.009 | <0.01 | <0.01 | <0.02 | <0.02 |
| Acy | <0.0008 | <0.002 | <0.002 | <0.003 | <0.004 | <0.005 | <0.005 | <0.006 |
| Acenaphthene | <0.0008 | <0.002 | <0.002 | <0.003 | <0.004 | 0.0049 | <0.006 | <0.006 |
| Fluorine | <0.0008 | <0.002 | <0.002 | <0.003 | <0.004 | <0.005 | <0.005 | <0.006 |
| Phenanthrene | <0.002 | <0.003 | <0.005 | <0.006 | <0.008 | <0.009 | <0.01 | <0.01 |
| Anthracene | <0.0008 | <0.002 | <0.002 | <0.003 | <0.004 | <0.005 | <0.002 | <0.006 |
| Fluoranthene | <0.0008 | <0.002 | <0.002 | 0.0031 | 0.005 | 0.006 | 0.0079 | <0.009 |
| Pyrene | <0.0008 | 0.0021 | 0.004 | 0.0056 | 0.0093 | 0.01 | 0.018 | 0.021 |
| B[a]A | <0.0008 | <0.002 | <0.002 | <0.003 | <0.004 | <0.005 | <0.005 | <0.006 |
| Chrysene | <0.0008 | <0.002 | <0.002 | <0.003 | <0.004 | <0.005 | <0.005 | <0.006 |
| BjF | <0.0008 | <0.002 | <0.002 | <0.003 | <0.004 | <0.005 | <0.005 | <0.006 |
| BkF | <0.0008 | <0.002 | <0.002 | <0.003 | <0.004 | <0.005 | <0.005 | <0.006 |
| BaP | <0.0008 | <0.002 | <0.002 | <0.003 | <0.004 | <0.005 | <0.005 | <0.006 |
| DBahA | <0.0008 | <0.002 | <0.002 | <0.003 | <0.004 | <0.005 | <0.005 | <0.006 |
| BghiP | <0.0008 | <0.002 | <0.002 | <0.003 | <0.004 | <0.005 | <0.005 | <0.006 |
| IP | <0.0008 | <0.002 | <0.002 | <0.003 | <0.004 | <0.005 | <0.005 | <0.006 |
| Total PAH 16 | <0.0072 | 0.0085 | 0.01 | 0.013 | 0.019 | 0.025 | 0.032 | 0.035 |
| Total carc. PAH | <0.0027 | <0.0053 | <0.008 | <0.011 | <0.013 | <0.016 | <0.019 | <0.021 |
| Total oth. PAH | <0.005 | 0.0059 | 0.007 | 0.01 | 0.016 | 0.022 | 0.03 | 0.032 |
| Total PAH L | <0.0019 | <0.0038 | <0.0057 | <0.0076 | 0.0086 | 0.0094 | <0.011 | <0.013 |
| Total PAH M | <0.002 | 0.0036 | 0.005 | 0.008 | 0.013 | 0.018 | 0.025 | 0.028 |
| Total PAH H | <0.003 | <0.006 | <0.009 | <0.01 | <0.02 | <0.02 | <0.02 | <0.02 |
| MBT | 0.000404 | 0.00366 | 0.00569 | 0.00792 | 0.0133 | 0.0188 | 0.0232 | 0.0303 |
| DBT | <0.00008 | <0.0002 | <0.0002 | <0.0003 | 0.000446 | 0.000558 | 0.000711 | 0.00095 |
| TBT | 0.0000807 | 0.000176 | <0.0003 | 0.00034 | 0.000441 | 0.000545 | 0.000625 | 0.000758 |
| TTBT | <0.00008 | <0.0002 | <0.0002 | <0.0003 | <0.0004 | <0.0005 | <0.0005 | <0.0006 |
| MOT | <0.00008 | <0.0002 | <0.0002 | <0.0003 | <0.0004 | <0.0005 | <0.0005 | <0.0006 |
| DOT | <0.00008 | <0.0002 | <0.0002 | <0.0003 | <0.0004 | <0.0005 | <0.0005 | <0.0006 |
| TCyT | <0.00008 | <0.0002 | <0.0002 | <0.0003 | <0.0004 | <0.0005 | <0.0005 | <0.0006 |
| MPhT | <0.00008 | <0.0002 | <0.0002 | <0.0003 | <0.0004 | <0.0005 | <0.0005 | <0.0006 |
| DPhT | <0.00008 | <0.0002 | <0.0002 | <0.0003 | <0.0004 | <0.0005 | <0.0005 | <0.0006 |
| TPhT | <0.00008 | <0.0002 | <0.0002 | <0.0003 | <0.0004 | <0.0005 | <0.0005 | <0.0006 |
| PCB 28 | <0.000084 | <0.00017 | <0.00025 | <0.00033 | <0.00042 | <0.0005 | <0.00059 | <0.00067 |
| PCB 52 | <0.000084 | <0.00017 | <0.00025 | <0.00033 | <0.00042 | <0.0005 | <0.00059 | <0.00067 |
| PCB 101 | <0.000084 | <0.00017 | <0.00025 | <0.00033 | <0.00042 | <0.0005 | <0.00059 | <0.00067 |
| PCB 118 | <0.000084 | <0.00017 | <0.00025 | <0.00033 | <0.00042 | <0.0005 | <0.00059 | <0.00067 |
| PCB 138 | <0.000091 | <0.00018 | <0.00027 | <0.00037 | <0.00046 | <0.00055 | <0.00064 | <0.00073 |
| PCB 153 | <0.000084 | <0.00017 | <0.00025 | <0.00033 | <0.00042 | <0.0005 | <0.00059 | <0.00067 |
| PCB 180 | <0.000084 | <0.00017 | <0.00025 | <0.00033 | <0.00042 | <0.0005 | <0.00059 | <0.00067 |
| Total PCB 7 | <0.0003 | <0.00059 | <0.00089 | <0.0012 | <0.0015 | <0.0018 | <0.0021 | <0.0024 |
Appendix B. Leaching of Contaminants: Sampling 2325–2332
Appendix B.1. Surface Leaching of Contaminants
Notations for common for all the samples in Table A3. The applied Methodology contains Batch 1, Prov 7. The start and end days of the tests are from 30 January 2023 until 4 April 2023. The experiments were performed by Robert Selegård in Swedish Geotechnical Institute, registered under Diary Nr. 1.1-2107-0587. The amount of leachate for all samples is 1.50 L. Conductivity was measured in mS/m by temperature of sampling at 25 C. The period refers to the day of sampling. Surface: 0.0197 m2. Redox (mVolts) refers to oxidation (reduction) potential of solutions or chemical species to acquire/lose electrons and be reduced/oxidised. Leached amount/withdrawal is given in mg/m2 for all the samples.
Abbreviations for organic compounds: Acy—acenaphthylene; BaP—Benz[a]pyrene; B[a]A—Benz[a]anthracene; BjF—Benzo[j]fluoranthene; BkF—Benzo[k]fluoranthene; MBT—Monobutyltin; DBT—Dibutyltin; TBT—Tributyltin; TTBT—Tetrabutyltin; MOT—Monooctyltin; DOT—Dioctyltin; TCyT—Tricyclohexyltin; MPhT—Monophenyltin; DPhT—Diphenyltin; IP—Indeno[1,2,3-cd]pyrene; DBahA—Dibenz[a,h]anthracene; BghiP—Benz[g,h,i]perylene; TPhT—Triphenyltin; Total oth. PAH—Total other PAH; Total carc. PAH—Total amount of carcinogenic PAH.
Table A3.
Surface leaching of contaminants (heavy metals, organic compounds, PCB and PAH, mg/m2) from soil specimens during period of 64 days of sampling (2325–2332).
Table A3.
Surface leaching of contaminants (heavy metals, organic compounds, PCB and PAH, mg/m2) from soil specimens during period of 64 days of sampling (2325–2332).
| Period | 6 h | 1 Days | 2.25 Days | 4 Days | 9 Days | 16 Days | 36 Days | 64 Days |
|---|---|---|---|---|---|---|---|---|
| Sample No | 2325 | 2326 | 2327 | 2328 | 2329 | 2330 | 2331 | 2332 |
| pH | 8.94 | 9.21 | 9.1 | 9.2 | 9.22 | 9.06 | 8.42 | 8.21 |
| Conductivity | 2530 | 2510 | 2840 | 2860 | 2600 | 2760 | 2730 | 2740 |
| Redox (mV) | 36 | 70 | 36 | 39 | 30 | 27 | 58 | 87 |
| Al | 1.86 | 1.73 | 1.4 | 1.34 | 0.68 | 0.61 | 0.417 | 0.387 |
| As | 0.0581 | 0.0753 | 0.0859 | 0.0642 | 0.0782 | 0.0821 | 0.0569 | 0.0828 |
| Ba | 6.04 | 6.89 | 7.66 | 6.65 | 13.1 | 13.4 | 21 | 20.1 |
| Ca | 15,900 | 17,400 | 19,600 | 19,000 | 24,200 | 24,300 | 32,300 | 35,000 |
| Cd | 0.0042 | 0.00505 | <0.004 | <0.004 | <0.004 | <0.004 | <0.004 | 0.00431 |
| Co | 0.037 | 0.0295 | 0.0239 | 0.0266 | 0.0419 | 0.0271 | 0.0292 | 0.0413 |
| Cr | <0.04 | <0.04 | <0.04 | <0.04 | <0.04 | <0.04 | <0.04 | <0.04 |
| Cu | 1.3 | 0.936 | 0.674 | 0.539 | 0.599 | 0.594 | 0.89 | 0.967 |
| Fe | 0.859 | 0.66 | 0.59 | 0.463 | <0.3 | <0.3 | <0.3 | <0.3 |
| Hg | <0.002 | <0.002 | <0.002 | <0002 | <0.002 | <0.002 | <0.002 | <0.002 |
| K | 16,000 | 15,600 | 17,500 | 16,300 | 16,000 | 15,400 | 16,200 | 15,500 |
| Mg | 39,400 | 39,400 | 43,600 | 40,700 | 34,000 | 34,300 | 26,700 | 27,200 |
| Mn | 1.33 | 1.03 | 0.542 | 0.561 | 0.196 | 0.271 | 0.0798 | 0.0427 |
| Mo | 0.782 | 0.72 | 0.782 | 0.68 | 0.898 | 0.798 | 1.1 | 1.17 |
| Na | 380,000 | 371,000 | 418,000 | 394,000 | 371,000 | 364,000 | 350,000 | 359,000 |
| Ni | 0.411 | 0.315 | 0.224 | 0.301 | 0.411 | 0.233 | 0.173 | 0.158 |
| Pb | <0.02 | <0.02 | <0.02 | <0.02 | <0.02 | <0.02 | <0.02 | <0.02 |
| V | 0.141 | 0.21 | 0.243 | 0.242 | 0.351 | 0.24 | 0.15 | 0.116 |
| Zn | 0.278 | <0.2 | <0.2 | <0.2 | <0.2 | <0.2 | <0.2 | <0.2 |
| B | 144 | 144 | 157 | 149 | 128 | 124 | 101 | 104 |
| Sb | 0.044 | 0.0485 | 0.0501 | 0.0511 | 0.0882 | 0.0725 | 0.114 | 0.11 |
| Se | <0.2 | <0.2 | <0.2 | <0.2 | <0.2 | 4.2 | <0.2 | <0.2 |
| Naphthalene | <0.002 | <0.002 | <0.002 | <0.002 | <0.002 | <0.002 | <0.002 | <0.002 |
| Acy | <0.0008 | <0.0008 | <0.0008 | <0.0008 | <0.0008 | <0.0008 | <0.0008 | <0.0008 |
| Acenaphthene | <0.0008 | <0.0008 | <0.0008 | <0.0008 | 0.00092 | 0.0008 | <0.0008 | <0.0008 |
| Fluorine | <0.0008 | <0.0008 | <0.0008 | <0.0008 | <0.0008 | <0.0008 | <0.0008 | <0.0008 |
| Phenanthrene | <0.002 | <0.002 | <0.002 | <0.002 | <0.002 | <0.002 | <0.002 | <0.002 |
| Anthracene | <0.0008 | <0.0008 | <0.0008 | <0.0008 | <0.0008 | <0.0008 | <0.0008 | <0.0008 |
| Fluoranthene | <0.0008 | <0.0008 | <0.0008 | <0.0008 | 0.0012 | 0.0012 | 0.0018 | 0.001 |
| Pyrene | <0.0008 | 0.0012 | 0.0017 | 0.002 | 0.0035 | 0.0037 | 0.0053 | 0.0044 |
| B[a]A | <0.0008 | <0.0008 | <0.0008 | <0.0008 | <0.0008 | <0.0008 | <0.0008 | <0.0008 |
| Chrysene | <0.0008 | <0.0008 | <0.0008 | <0.0008 | <0.0008 | <0.0008 | <0.0008 | <0.0008 |
| BjF | <0.0008 | <0.0008 | <0.0008 | <0.0008 | <0.0008 | <0.0008 | <0.0008 | <0.0008 |
| BkF | <0.0008 | <0.0008 | <0.0008 | <0.0008 | <0.0008 | <0.0008 | <0.0008 | <0.0008 |
| BaP | <0.0008 | <0.0008 | <0.0008 | <0.0008 | <0.0008 | <0.0008 | <0.0008 | <0.0008 |
| DBahA | <0.0008 | <0.0008 | <0.0008 | <0.0008 | <0.0008 | <0.0008 | <0.0008 | <0.0008 |
| BghiP | <0.0008 | <0.0008 | <0.0008 | <0.0008 | <0.0008 | <0.0008 | <0.0008 | <0.0008 |
| IP | <0.0008 | <0.0008 | <0.0008 | <0.0008 | <0.0008 | <0.0008 | <0.0008 | <0.0008 |
| Total PAH 16 | <0.0073 | 0.0012 | 0.0017 | 0.002 | 0.0057 | 0.0057 | 0.0071 | 0.0054 |
| Total carc. PAH | <0.0027 | <0.0027 | <0.0027 | <0.0027 | <0.0027 | <0.0027 | <0.0027 | <0.0027 |
| Total oth. PAH | <0.005 | 0.0012 | 0.0017 | 0.002 | 0.0057 | 0.0057 | 0.0071 | 0.0054 |
| Total PAH L | <0.0019 | <0.0019 | <0.0019 | <0.0019 | 0.00092 | 0.0008 | <0.0019 | <0.0019 |
| Total PAH M | <0.002 | 0.0012 | 0.0017 | 0.002 | 0.0048 | 0.0049 | 0.0071 | 0.0054 |
| Total PAH H | <0.003 | <0.003 | <0.003 | <0.003 | <0.003 | <0.003 | <0.003 | <0.003 |
| MBT | 0.000333 | 0.0027 | 0.00229 | 0.00335 | 0.00398 | 0.0153 | 0.00515 | 0.0174 |
| DBT | <0.00008 | <0.00008 | <0.00008 | <0.00008 | 0.00013 | 0.000108 | 0.000132 | 0.000272 |
| TBT | 0.000108 | 0.0000936 | <0.00008 | 0.0000944 | 0.000103 | 0.000109 | 0.000089 | 0.000144 |
| TTBT | <0.00008 | <0.00008 | <0.00008 | <0.00008 | <0.00008 | <0.00008 | <0.00008 | <0.00008 |
| MOT | <0.00008 | <0.00008 | <0.00008 | <0.00008 | <0.00008 | <0.00008 | <0.00008 | <0.00008 |
| DOT | <0.00008 | <0.00008 | <0.00008 | <0.00008 | <0.00008 | <0.00008 | <0.00008 | <0.00008 |
| TCyT | <0.00008 | <0.00008 | <0.00008 | <0.00008 | <0.00008 | <0.00008 | <0.00008 | <0.00008 |
| MPhT | <0.00008 | <0.00008 | <0.00008 | <0.00008 | <0.00008 | <0.00008 | <0.00008 | <0.00008 |
| DPhT | <0.00008 | <0.00008 | <0.00008 | <0.00008 | <0.00008 | <0.00008 | <0.00008 | <0.00008 |
| TPhT | <0.00008 | <0.00008 | <0.00008 | <0.00008 | <0.00008 | <0.00008 | <0.00008 | <0.00008 |
| PCB 28 | <0.000084 | <0.000084 | <0.000084 | <0.000084 | <0.000084 | <0.000084 | <0.000084 | <0.000084 |
| PCB 52 | <0.000084 | <0.000084 | <0.000084 | <0.000084 | <0.000084 | <0.000084 | <0.000084 | <0.000084 |
| PCB 101 | <0.000084 | <0.000084 | <0.000084 | <0.000084 | <0.000084 | <0.000084 | <0.000084 | <0.000084 |
| PCB 118 | <0.000084 | <0.000084 | <0.000084 | <0.000084 | <0.000084 | <0.000084 | <0.000084 | <0.000084 |
| PCB 138 | <0.000092 | <0.000092 | <0.000092 | <0.000092 | <0.000092 | <0.000092 | <0.000092 | <0.000092 |
| PCB 153 | <0.000084 | <0.000084 | <0.000084 | <0.000084 | <0.000084 | <0.000084 | <0.000084 | <0.000084 |
| PCB 180 | <0.000084 | <0.000084 | <0.000084 | <0.000084 | <0.000084 | <0.000084 | <0.000084 | <0.000084 |
| Total PCB 7 | <0.0003 | <0.0003 | <0.0003 | <0.0003 | <0.0003 | <0.0003 | <0.0003 | <0.0003 |
Appendix B.2. Cumulative Surface Leaching of Contaminants
Notations for Table A4. The applied methodology is based on the three approaches:
- Standards SS-EN ISO 10523:2012 with measurement uncertainty of ±0.05 pH-enh;
- SS-EN 27888-1:1994 with measurement uncertainty ±2.9%;
- SGI-method with measurement uncertainty pf ± 25%.
Table A4.
Cumulative surface leaching (heavy metals, organic compounds, PCB and PAH, mg/m2) from soil specimens during period of 64 days of sampling (2325–2332).
Table A4.
Cumulative surface leaching (heavy metals, organic compounds, PCB and PAH, mg/m2) from soil specimens during period of 64 days of sampling (2325–2332).
| Period | 6 h | 1 Days | 2.25 Days | 4 Days | 9 Days | 16 Days | 36 Days | 64 Days |
|---|---|---|---|---|---|---|---|---|
| Sample No | 2325 | 2326 | 2327 | 2328 | 2329 | 2330 | 2331 | 2332 |
| Al | 1.86 | 3.6 | 5 | 6.32 | 7 | 7.6 | 8.02 | 8.41 |
| As | 0.0581 | 0.133 | 0.219 | 0.284 | 0.362 | 0.444 | 0.501 | 0.584 |
| Ba | 6.04 | 12.9 | 20.6 | 27.2 | 40.3 | 53.8 | 74 | 94.6 |
| Ca | 15,900 | 33,300 | 52,900 | 72,000 | 96,300 | 121,000 | 15,300 | 190,000 |
| Cd | 0.0042 | 0.00927 | <0.01 | <0.02 | <0.02 | <0.02 | <0.03 | 0.0328 |
| Co | 0.037 | 0.0663 | 0.0902 | 0.117 | 0.159 | 0.186 | 0.215 | 0.256 |
| Cr | <0.04 | <0.08 | <0.1 | <0.2 | <0.2 | <0.2 | <0.3 | <0.3 |
| Cu | 1.3 | 2.23 | 2.91 | 3.45 | 4.04 | 4.64 | 5.53 | 6.5 |
| Fe | 0.859 | 1.52 | 2.1 | 2.57 | <3 | <3 | <3 | <4 |
| Hg | <0.002 | <0.003 | <0.005 | <0.006 | <0.008 | <0.009 | <0.01 | <0.01 |
| K | 16,000 | 31,600 | 49,100 | 65,400 | 81,300 | 96,700 | 113,000 | 128,000 |
| Mg | 39,400 | 78,800 | 122,000 | 163,000 | 197,000 | 231,000 | 258,000 | 285,000 |
| Mn | 1.33 | 2.35 | 2.9 | 3.46 | 3.65 | 3.92 | 4 | 4.05 |
| Mo | 0.782 | 1.5 | 2.29 | 3 | 3.87 | 4.66 | 5.7 | 6.9 |
| Na | 380,000 | 747,000 | 1,170,000 | 1,560,000 | 1,930,000 | 2,290,000 | 2,600,000 | 3,010,000 |
| Ni | 0.411 | 0.726 | 0.95 | 1.25 | 1.66 | 1.9 | 2.07 | 2.23 |
| Pb | <0.02 | <0.03 | <0.05 | <0.06 | <0.08 | <0.09 | <0.1 | <0.1 |
| V | 0.141 | 0.35 | 0.591 | 0.833 | 1.18 | 1.4 | 1.57 | 1.69 |
| Zn | 0.278 | <0.4 | <0.6 | <0.7 | <0.9 | <1 | <1 | <1 |
| B | 144 | 288 | 445 | 594 | 722 | 846 | 947 | 1050 |
| Sb | 0.044 | 0.0924 | 0.143 | 0.194 | 0.282 | 0.354 | 0.469 | 0.579 |
| Se | <0.2 | <0.5 | <0.7 | <0.9 | <1 | 5.35 | <6 | <6 |
| Naphthalene | <0.002 | <0.005 | <0.007 | <0.009 | <0.01 | <0.01 | <0.02 | <0.02 |
| Acy | <0.0008 | <0.002 | <0.002 | <0.003 | <0.004 | <0.005 | <0.005 | <0.006 |
| Acenaphthene | <0.0008 | <0.002 | <0.002 | <0.003 | 0.004 | 0.005 | <0.006 | <0.006 |
| Fluorine | <0.0008 | <0.002 | <0.002 | <0.003 | 0.004 | 0.005 | <0.005 | <0.006 |
| Phenanthrene | <0.0008 | <0.002 | <0.002 | <0.003 | 0.004 | 0.005 | <0.005 | <0.006 |
| Anthracene | <0.0008 | <0.002 | <0.002 | <0.003 | 0.004 | 0.005 | <0.005 | <0.006 |
| Fluoranthene | <0.0008 | <0.002 | <0.002 | <0.003 | 0.0043 | 0.0055 | <0.0074 | <0.0084 |
| Pyrene | <0.0008 | 0.0019 | 0.0036 | 0.0056 | 0.0091 | 0.013 | 0.018 | 0.023 |
| B[a]A | <0.0008 | <0.002 | <0.002 | <0.003 | <0.004 | <0.005 | <0.005 | <0.006 |
| Chrysene | <0.0008 | <0.002 | <0.002 | <0.003 | <0.004 | <0.005 | <0.005 | <0.006 |
| BjF | <0.0008 | <0.002 | <0.002 | <0.003 | <0.004 | <0.005 | <0.005 | <0.006 |
| BkF | <0.0008 | <0.002 | <0.002 | <0.003 | <0.004 | <0.005 | <0.005 | <0.006 |
| BaP | <0.0008 | <0.002 | <0.002 | <0.003 | <0.004 | <0.005 | <0.005 | <0.006 |
| DBahA | <0.0008 | <0.002 | <0.002 | <0.003 | <0.004 | <0.005 | <0.005 | <0.006 |
| BghiP | <0.0008 | <0.002 | <0.002 | <0.003 | <0.004 | <0.005 | <0.005 | <0.006 |
| IP | <0.0008 | <0.002 | <0.002 | <0.003 | <0.004 | <0.005 | <0.005 | <0.006 |
| Total PAH 16 | <0.0073 | 0.0084 | 0.01 | 0.012 | 0.018 | 0.023 | 0.031 | 0.036 |
| Total carc. PAH | <0.0027 | <0.0054 | <0.0081 | <0.011 | <0.013 | <0.016 | <0.019 | <0.021 |
| Total oth. PAH | <0.005 | 0.0058 | 0.0074 | 0.0094 | 0.015 | 0.021 | 0.028 | 0.033 |
| Total PAH L | <0.0019 | <0.0038 | <0.0058 | <0.0077 | 0.0086 | 0.009 | <0.011 | <0.013 |
| Total PAH M | <0.002 | 0.0035 | 0.0051 | 0.0071 | 0.012 | 0.017 | 0.024 | 0.029 |
| Total PAH H | <0.003 | <0.006 | <0.009 | <0.01 | <0.02 | <0.02 | <0.02 | <0.02 |
| MBT | 0.000333 | 0.003 | 0.00531 | 0.00866 | 0.0126 | 0.0279 | 0.0331 | 0.0505 |
| DBT | <0.00008 | <0.0002 | <0.0002 | <0.0003 | 0.000436 | 0.000545 | 0.000677 | 0.000948 |
| TBT | 0.000108 | 0.000202 | <0.0003 | 0.000373 | 0.000476 | 0.000585 | 0.000674 | 0.000818 |
| TTBT | <0.00008 | <0.0002 | <0.0002 | <0.0003 | <0.0004 | <0.0005 | <0.0005 | <0.0006 |
| MOT | <0.00008 | <0.0002 | <0.0002 | <0.0003 | <0.0004 | <0.0005 | <0.0005 | <0.0006 |
| DOT | <0.00008 | <0.0002 | <0.0002 | <0.0003 | <0.0004 | <0.0005 | <0.0005 | <0.0006 |
| TCyT | <0.00008 | <0.0002 | <0.0002 | <0.0003 | <0.0004 | <0.0005 | <0.0005 | <0.0006 |
| MPhT | <0.00008 | <0.0002 | <0.0002 | <0.0003 | <0.0004 | <0.0005 | <0.0005 | <0.0006 |
| DPhT | <0.00008 | <0.0002 | <0.0002 | <0.0003 | <0.0004 | <0.0005 | <0.0005 | <0.0006 |
| TPhT | <0.00008 | <0.0002 | <0.0002 | <0.0003 | <0.0004 | <0.0005 | <0.0005 | <0.0006 |
| PCB 28 | <0.000084 | <0.00017 | <0.00025 | <0.00034 | <0.00042 | <0.00051 | <0.00059 | <0.00068 |
| PCB 52 | <0.000084 | <0.00017 | <0.00025 | <0.00034 | <0.00042 | <0.00051 | <0.00059 | <0.00068 |
| PCB 101 | <0.000084 | <0.00017 | <0.00025 | <0.00034 | <0.00042 | <0.00051 | <0.00059 | <0.00068 |
| PCB 118 | <0.000084 | <0.00017 | <0.00025 | <0.00034 | <0.00042 | <0.00051 | <0.00059 | <0.00068 |
| PCB 138 | <0.000092 | <0.00018 | <0.00028 | <0.00037 | <0.00046 | <0.00055 | <0.00064 | <0.00074 |
| PCB 153 | <0.000084 | <0.00017 | <0.00025 | <0.00034 | <0.00042 | <0.00051 | <0.00059 | <0.00068 |
| PCB 180 | <0.000084 | <0.00017 | <0.00025 | <0.00034 | <0.00042 | <0.00051 | <0.00059 | <0.00068 |
| Total PCB 7 | <0.0003 | <0.0006 | <0.0009 | <0.0012 | <0.0015 | <0.0018 | <0.0021 | <0.0024 |
Appendix C. Leaching of Contaminants: Sampling 2333–2340
Appendix C.1. Surface Leaching of Contaminants
Notations for all the samples in Table A5. The applied Methodology contains Batch 1, Prov 8A. The start and end days of the tests are from 30 January 2023 until 4 April 2023. The experiments were performed by Robert Selegård in Swedish Geotechnical Institute, registered under Diary Nr. 1.1-2107-0587. The amount of leachate for all samples is 1.5 L. Conductivity was measured in mS/m by temperature of sampling at 25 C. The period refers to the day of sampling. Surface: 0.0197 m2. Redox (mVolts) refers to oxidation (reduction) potential of solutions or chemical species to acquire / lose electrons and be reduced/oxidised. Leached amount/withdrawal is given in mg/m2 for all the samples.
Table A5.
Surface leaching of contaminants (heavy metals, organic compounds, PCB and PAH, mg/m2) from soil specimens during period of 64 days of sampling (2333–2340).
Table A5.
Surface leaching of contaminants (heavy metals, organic compounds, PCB and PAH, mg/m2) from soil specimens during period of 64 days of sampling (2333–2340).
| Period | 6 h | 1 Days | 2.25 Days | 4 Days | 9 Days | 16 Days | 36 Days | 64 Days |
|---|---|---|---|---|---|---|---|---|
| Sample No | 2333 | 2334 | 2335 | 2336 | 2337 | 2338 | 2339 | 2340 |
| pH | 8.75 | 8.68 | 8.57 | 8.72 | 8.8 | 8.49 | 8.15 | 7.87 |
| Conductivity | 2520 | 2510 | 2660 | 2860 | 2750 | 2760 | 2740 | 2760 |
| Redox (mV) | 46 | 84 | 74 | 57 | 45 | 42 | 74 | 75 |
| Al | 2.25 | 2.03 | 1.75 | 1.6 | 0.749 | 0.78 | 0.624 | 0.646 |
| As | 0.0637 | 0.074 | 0.084 | 0.0687 | 0.105 | 0.135 | 0.071 | 0.0895 |
| Ba | 8.11 | 9.25 | 11.3 | 10.4 | 19.4 | 20.5 | 30.3 | 26.8 |
| Ca | 16,700 | 18,100 | 22,000 | 22,000 | 30,100 | 31,500 | 50,000 | 47,000 |
| Cd | 0.0056 | 0.00637 | <0.004 | <0.004 | <0.004 | <0.004 | <0.004 | 0.00499 |
| Co | 0.0414 | 0.036 | 0.033 | 0.0226 | 0.042 | 0.028 | 0.0486 | 0.0499 |
| Cr | 0.0414 | 0.036 | 0.033 | 0.0226 | 0.042 | 0.028 | 0.0486 | 0.0499 |
| Cu | 1.46 | 1.13 | 0.803 | 0.722 | 0.739 | 0.741 | 0.941 | 0.941 |
| Fe | 0.902 | 0.84 | 0.556 | 0.593 | <0.3 | <0.3 | <0.3 | <0.3 |
| Hg | <0.002 | <0.002 | <0.002 | <0.002 | <0.002 | <0.002 | <0.002 | <0.002 |
| K | 16,000 | 15,800 | 17,500 | 16,200 | 15,900 | 15,600 | 16,400 | 20,000 |
| Mg | 38,800 | 37,900 | 41,800 | 38,400 | 29,500 | 29,900 | 20,000 | 20,500 |
| Mn | 1.28 | 1.1 | 0.612 | 0.772 | 0.135 | 0.0856 | 0.0263 | 0.0247 |
| Mo | 0.811 | 0.772 | 0.895 | 0.772 | 1.04 | 0.948 | 1.19 | 1.29 |
| Na | 375,000 | 370,000 | 415,000 | 389,000 | 370,000 | 366,000 | 360,000 | 364,000 |
| Ni | 0.372 | 0.362 | 0.292 | 0.268 | 0.4 | 0.259 | 0.338 | 0.129 |
| Pb | <0.02 | <0.02 | <0.02 | <0.02 | <0.02 | <0.02 | <0.02 | <0.02 |
| V | 0.172 | 0.284 | 0.353 | 0.364 | 0.45 | 0.295 | 0.154 | 0.122 |
| Zn | 0.294 | 0.183 | 0.216 | 0.2 | <0.2 | <0.2 | <0.2 | <0.2 |
| B | 139 | 139 | 151 | 141 | 116 | 110 | 88.7 | 91.8 |
| Sb | 0.0561 | 0.0664 | 0.0699 | 0.0724 | 0.108 | 0.0971 | 0.135 | 0.135 |
| Se | <0.2 | <0.2 | <0.2 | <0.2 | 0.55 | 4.47 | <0.2 | <0.2 |
| Naphthalene | <0.002 | <0.002 | <0.002 | <0.002 | 0.004 | <0.002 | <0.002 | <0.002 |
| Acy | <0.0008 | <0.0008 | <0.0008 | <0.0008 | <0.0008 | <0.0008 | <0.0008 | <0.0008 |
| Acenaphthene | <0.0008 | <0.0008 | <0.0008 | <0.0008 | 0.0017 | <0.0008 | <0.0008 | <0.0008 |
| Fluorine | <0.0008 | <0.0008 | <0.0008 | <0.0008 | 0.00099 | <0.0008 | <0.0008 | <0.0008 |
| Phenanthrene | <0.002 | <0.002 | <0.002 | <0.002 | 0.0041 | <0.002 | <0.002 | <0.002 |
| Anthracene | <0.0008 | <0.0008 | <0.0008 | <0.0008 | <0.0008 | <0.0008 | <0.0008 | <0.0008 |
| Fluoranthene | 0.00099 | 0.002 | 0.0022 | 0.0028 | 0.0043 | 0.0036 | <0.0008 | <0.0008 |
| Pyrene | 0.0011 | 0.0022 | 0.0029 | 0.0034 | 0.0057 | 0.0057 | 0.0037 | 0.0013 |
| B[a]A | <0.0008 | <0.0008 | <0.0008 | <0.0008 | <0.0008 | <0.0008 | <0.0008 | <0.0008 |
| Chrysene | <0.0008 | <0.0008 | <0.0008 | <0.0008 | <0.0008 | <0.0008 | <0.0008 | <0.0008 |
| BjF | <0.0008 | <0.0008 | <0.0008 | <0.0008 | <0.0008 | <0.0008 | <0.0008 | <0.0008 |
| BkF | <0.0008 | <0.0008 | <0.0008 | <0.0008 | <0.0008 | <0.0008 | <0.0008 | <0.0008 |
| BaP | <0.0008 | <0.0008 | <0.0008 | <0.0008 | <0.0008 | <0.0008 | <0.0008 | <0.0008 |
| DBahA | <0.0008 | <0.0008 | <0.0008 | <0.0008 | <0.0008 | <0.0008 | <0.0008 | <0.0008 |
| BghiP | <0.0008 | <0.0008 | <0.0008 | <0.0008 | <0.0008 | <0.0008 | <0.0008 | <0.0008 |
| IP | <0.0008 | <0.0008 | <0.0008 | <0.0008 | <0.0008 | <0.0008 | <0.0008 | <0.0008 |
| Total PAH 16 | 0.0021 | 0.0042 | 0.0051 | 0.0062 | 0.021 | 0.00933 | 0.0037 | 0.0013 |
| Total carc. PAH | <0.0027 | <0.0027 | <0.0027 | <0.0027 | <0.0027 | <0.0027 | <0.0027 | <0.0027 |
| Total oth. PAH | 0.0021 | 0.0042 | 0.0051 | 0.0062 | 0.021 | 0.00933 | 0.0037 | 0.0013 |
| Total PAH L | <0.0019 | <0.0019 | <0.0019 | <0.0019 | 0.0057 | <0.0019 | <0.0019 | <0.0019 |
| Total PAH M | 0.0021 | 0.0042 | 0.0051 | 0.0062 | 0.015 | 0.00933 | 0.0037 | 0.0013 |
| Total PAH H | <0.003 | <0.003 | <0.003 | <0.003 | <0.003 | <0.003 | <0.003 | <0.003 |
| MBT | 0.00142 | 0.00255 | 0.00189 | 0.00262 | 0.00453 | 0.00902 | 0.00554 | 0.00661 |
| DBT | 0.000091 | 0.00011 | 0.0000849 | 0.00011 | 0.000211 | 0.000248 | 0.000236 | 0.000593 |
| TBT | 0.000142 | 0.000118 | 0.000109 | 0.000151 | 0.000157 | 0.000121 | 0.000125 | 0.000113 |
| TTBT | <0.00008 | <0.00008 | <0.00008 | <0.00008 | <0.00008 | <0.00008 | <0.00008 | <0.00008 |
| MOT | <0.00008 | <0.00008 | <0.00008 | <0.00008 | <0.00008 | <0.00008 | <0.00008 | <0.00008 |
| DOT | <0.00008 | <0.00008 | <0.00008 | <0.00008 | <0.00008 | <0.00008 | <0.00008 | <0.00008 |
| TCyT | <0.00008 | <0.00008 | <0.00008 | <0.00008 | <0.00008 | <0.00008 | <0.00008 | <0.00008 |
| MPhT | <0.00008 | <0.00008 | <0.00008 | <0.00008 | <0.00008 | <0.00008 | <0.00008 | <0.00008 |
| DPhT | <0.00008 | <0.00008 | <0.00008 | <0.00008 | <0.00008 | <0.00008 | <0.00008 | <0.00008 |
| TPhT | <0.00008 | <0.00008 | <0.00008 | <0.00008 | <0.00008 | <0.00008 | <0.00008 | <0.00008 |
| PCB 28 | <0.000084 | <0.000084 | <0.000084 | <0.000084 | <0.000084 | <0.000084 | <0.000084 | <0.000084 |
| PCB 52 | <0.000084 | <0.000084 | <0.000084 | <0.000084 | <0.000084 | <0.000084 | <0.000084 | <0.000084 |
| PCB 101 | <0.000084 | <0.000084 | <0.000084 | <0.000084 | <0.000084 | <0.000084 | <0.000084 | <0.000084 |
| PCB 118 | <0.000084 | <0.000084 | <0.000084 | <0.000084 | <0.000084 | <0.000084 | <0.000084 | <0.000084 |
| PCB 138 | <0.000092 | <0.000092 | <0.000092 | <0.000092 | <0.000092 | <0.000092 | <0.000092 | <0.000092 |
| PCB 153 | <0.000084 | <0.000084 | <0.000084 | <0.000084 | <0.000084 | <0.000084 | <0.000084 | <0.000084 |
| PCB 180 | <0.000084 | <0.000084 | <0.000084 | <0.000084 | <0.000084 | <0.000084 | <0.000084 | <0.000084 |
| Total PCB 7 | <0.0003 | <0.0003 | <0.0003 | <0.0003 | <0.0003 | <0.0003 | <0.0003 | <0.0003 |
Appendix C.2. Cumulative Surface Leaching of Contaminants
Table A6.
Cumulative surface leaching (heavy metals, organic compounds, PCB and PAH, mg/m2) from soil specimens during period of 64 days of sampling (2333–2340).
Table A6.
Cumulative surface leaching (heavy metals, organic compounds, PCB and PAH, mg/m2) from soil specimens during period of 64 days of sampling (2333–2340).
| Period | 6 h | 1 Days | 2.25 Days | 4 Days | 9 Days | 16 Days | 36 Days | 64 Days |
|---|---|---|---|---|---|---|---|---|
| Sample No | 2333 | 2334 | 2335 | 2336 | 2337 | 2338 | 2339 | 2340 |
| Al | 2.25 | 4.28 | 6.03 | 7.63 | 8.38 | 9.16 | 9.78 | 10.4 |
| As | 0.0637 | 0.138 | 0.22 | 0.29 | 0.395 | 0.53 | 0.6 | 0.69 |
| Ba | 8.11 | 17.4 | 28.7 | 39.1 | 58.5 | 79 | 109 | 136 |
| Ca | 16,700 | 34,800 | 57,000 | 79,000 | 109,000 | 141,000 | 200,000 | 230,000 |
| Cd | 0.0056 | 0.012 | <0.02 | <0.02 | <0.02 | <0.03 | <0.03 | 0.0361 |
| Co | 0.0414 | 0.0775 | 0.11 | 0.133 | 0.18 | 0.2 | 0.251 | 0.301 |
| Cr | <0.04 | <0.08 | <0.1 | <0.2 | <0.2 | <0.2 | <0.3 | <0.3 |
| Cu | 1.46 | 2.59 | 3.4 | 4.12 | 4.86 | 5.6 | 6.54 | 7.48 |
| Fe | 0.902 | 1.7 | 2.3 | 2.89 | <3 | <4 | <4 | <4 |
| Hg | <0.002 | <0.003 | <0.005 | <0.006 | <0.008 | <0.009 | <0.01 | <0.01 |
| K | 16,000 | 31,800 | 49,300 | 65,500 | 81,400 | 97,000 | 113,000 | 100,000 |
| Mg | 38,800 | 76,800 | 119,000 | 157,000 | 186,000 | 216,000 | 236,000 | 257,000 |
| Mn | 1.28 | 2.39 | 3 | 3.77 | 3.91 | 3.99 | 4.02 | 4.04 |
| Mo | 0.811 | 1.58 | 2.48 | 3.25 | 4.29 | 5.24 | 6.43 | 7.72 |
| Na | 375,000 | 750,000 | 1,170,000 | 1,550,000 | 1,900,000 | 2,290,000 | 2,600,000 | 3,010,000 |
| Ni | 0.372 | 0.733 | 1.03 | 1.29 | 1.7 | 1.95 | 2.29 | 2.42 |
| Pb | <0.02 | <0.03 | <0.05 | <0.06 | <0.08 | <0.09 | <0.1 | <0.1 |
| V | 0.172 | 0.456 | 0.81 | 1.17 | 1.6 | 1.92 | 2.07 | 2.2 |
| Zn | 0.294 | 0.477 | 0.693 | 0.893 | <1 | <1 | <1 | <2 |
| B | 139 | 278 | 430 | 570 | 686 | 796 | 885 | 976 |
| Sb | 0.0561 | 0.123 | 0.192 | 0.265 | 0.373 | 0.47 | 0.604 | 0.74 |
| Se | <0.2 | <0.5 | <0.7 | <0.9 | 1.5 | 5.94 | <6 | <6 |
| Naphthalene | <0.002 | <0.005 | <0.007 | <0.009 | 0.013 | <0.02 | <0.02 | <0.02 |
| Acy | <0.0008 | <0.002 | <0.002 | <0.003 | <0.004 | <0.005 | <0.005 | <0.006 |
| Acenaphthene | <0.0008 | <0.002 | <0.002 | <0.003 | 0.0047 | <0.006 | <0.006 | <0.007 |
| Fluorine | <0.0008 | <0.002 | <0.002 | <0.003 | <0.0041 | <0.005 | <0.006 | <0.006 |
| Phenanthrene | <0.002 | <0.003 | <0.005 | <0.006 | 0.01 | <0.01 | <0.01 | <0.01 |
| Anthracene | <0.0008 | <0.002 | <0.002 | <0.003 | <0.004 | <0.005 | <0.005 | <0.006 |
| Fluoranthene | 0.00099 | 0.003 | 0.0052 | 0.008 | 0.012 | 0.016 | <0.02 | <0.02 |
| Pyrene | 0.0011 | 0.0033 | 0.0062 | 0.0096 | 0.015 | 0.021 | 0.025 | 0.026 |
| B[a]A | <0.0008 | <0.002 | <0.002 | <0.003 | <0.004 | <0.005 | <0.005 | <0.006 |
| Chrysene | <0.0008 | <0.002 | <0.002 | <0.003 | <0.004 | <0.005 | <0.005 | <0.006 |
| BjF | <0.0008 | <0.002 | <0.002 | <0.003 | <0.004 | <0.005 | <0.005 | <0.006 |
| BkF | <0.0008 | <0.002 | <0.002 | <0.003 | <0.004 | <0.005 | <0.005 | <0.006 |
| BaP | <0.0008 | <0.002 | <0.002 | <0.003 | <0.004 | <0.005 | <0.005 | <0.006 |
| DBahA | <0.0008 | <0.002 | <0.002 | <0.003 | <0.004 | <0.005 | <0.005 | <0.006 |
| BghiP | <0.0008 | <0.002 | <0.002 | <0.003 | <0.004 | <0.005 | <0.005 | <0.006 |
| IP | <0.0008 | <0.002 | <0.002 | <0.003 | <0.004 | <0.005 | <0.005 | <0.006 |
| Total PAH 16 | 0.0021 | 0.0063 | 0.011 | 0.018 | 0.038 | 0.0476 | 0.051 | 0.053 |
| Total carc. PAH | <0.0027 | <0.0054 | <0.008 | <0.011 | <0.013 | <0.016 | <0.019 | <0.021 |
| Total oth. PAH | 0.0021 | 0.0063 | 0.011 | 0.018 | 0.038 | 0.0476 | 0.051 | 0.053 |
| Total PAH L | <0.0019 | <0.0038 | <0.0057 | <0.0076 | 0.013 | <0.015 | <0.017 | <0.019 |
| Total PAH M | 0.0021 | 0.0063 | 0.011 | 0.018 | 0.0326 | 0.0419 | 0.046 | 0.047 |
| Total PAH H | <0.003 | <0.006 | <0.009 | <0.01 | <0.02 | <0.02 | <0.02 | <0.02 |
| MBT | 0.00142 | 0.00398 | 0.00586 | 0.00849 | 0.013 | 0.022 | 0.0276 | 0.0342 |
| DBT | 0.000091 | 0.0002 | 0.000283 | 0.00039 | 0.000601 | 0.000849 | 0.00108 | 0.00168 |
| TBT | 0.000142 | 0.00026 | 0.000369 | 0.000519 | 0.000676 | 0.000797 | 0.000922 | 0.00104 |
| TTBT | <0.00008 | <0.0002 | <0.0002 | <0.0003 | <0.0004 | <0.0005 | <0.0005 | <0.0006 |
| MOT | <0.00008 | <0.0002 | <0.0002 | <0.0003 | <0.0004 | <0.0005 | <0.0005 | <0.0006 |
| DOT | <0.00008 | <0.0002 | <0.0002 | <0.0003 | <0.0004 | <0.0005 | <0.0005 | <0.0006 |
| TCyT | <0.00008 | <0.0002 | <0.0002 | <0.0003 | <0.0004 | <0.0005 | <0.0005 | <0.0006 |
| MPhT | <0.00008 | <0.0002 | <0.0002 | <0.0003 | <0.0004 | <0.0005 | <0.0005 | <0.0006 |
| DPhT | <0.00008 | <0.0002 | <0.0002 | <0.0003 | <0.0004 | <0.0005 | <0.0005 | <0.0006 |
| TPhT | <0.00008 | <0.0002 | <0.0002 | <0.0003 | <0.0004 | <0.0005 | <0.0005 | <0.0006 |
| PCB 28 | <0.000084 | <0.00017 | <0.00025 | <0.00034 | <0.00042 | <0.0005 | <0.00059 | <0.00067 |
| PCB 52 | <0.000084 | <0.00017 | <0.00025 | <0.00034 | <0.00042 | <0.0005 | <0.00059 | <0.00067 |
| PCB 101 | <0.000084 | <0.00017 | <0.00025 | <0.00034 | <0.00042 | <0.0005 | <0.00059 | <0.00067 |
| PCB 118 | <0.000084 | <0.00017 | <0.00025 | <0.00034 | <0.00042 | <0.0005 | <0.00059 | <0.00067 |
| PCB 138 | <0.000092 | <0.00018 | <0.00028 | <0.00037 | <0.00046 | <0.00055 | <0.00064 | <0.00073 |
| PCB 153 | <0.000084 | <0.00017 | <0.00025 | <0.00034 | <0.00042 | <0.0005 | <0.00059 | <0.00067 |
| PCB 180 | <0.000084 | <0.00017 | <0.00025 | <0.00034 | <0.00042 | <0.0005 | <0.00059 | <0.00067 |
| Total PCB 7 | <0.0003 | <0.0006 | <0.00089 | <0.0012 | <0.0015 | <0.0018 | <0.0021 | <0.0024 |
References
- Chesworth, W. (Ed.) Soil stabilization. In Encyclopedia of Soil Science; Springer: Dordrecht, The Netherlands, 2008; p. 705. [Google Scholar] [CrossRef]
- Arias-Jaramillo, Y.P.; Gómez-Cano, D.; Carvajal, G.I.; Hidalgo, C.A.; Muñoz, F. Evaluation of the Effect of Binary Fly Ash-Lime Mixture on the Bearing Capacity of Natural Soils: A Comparison with Two Conventional Stabilizers Lime and Portland Cement. Materials 2023, 16, 3996. [Google Scholar] [CrossRef]
- Yi, Y.; Liska, M.; Al-Tabbaa, A. Properties of Two Model Soils Stabilized with Different Blends and Contents of GGBS, MgO, Lime, and PC. J. Mater. Civ. Eng. 2014, 26, 267–274. [Google Scholar] [CrossRef]
- Correia, A.A.S.; Figueiredo, D.; Rasteiro, M.G. An Experimental Design Methodology to Evaluate the Key Parameters on Dispersion of Carbon Nanotubes Applied in Soil Stabilization. Appl. Sci. 2023, 13, 4880. [Google Scholar] [CrossRef]
- Benschoten, J.E.V.; Matsumoto, M.R.; Young, W.H. Evaluation and Analysis of Soil Washing for Seven Lead-Contaminated Soils. J. Environ. Eng. 1997, 123, 217–224. [Google Scholar] [CrossRef]
- Chu, W. Remediation of Contaminated Soils by Surfactant-Aided Soil Washing. In Practice Periodical of Hazardous, Toxic, and Radioactive Waste Management; ASCE: Reston, VA, USA, 2003; Volume 7, pp. 19–24. [Google Scholar] [CrossRef]
- Bhandari, A.; Dove, D.C.; Novak, J.T. Soil Washing and Biotreatment of Petroleum-Contaminated Soils. J. Environ. Eng. 1994, 120, 1151–1169. [Google Scholar] [CrossRef]
- Rangeard, D.; Hicher, Y.P.; Zentar, R. Determining soil permeability from pressuremeter tests. Int. J. Numer. Anal. Methods Geomech. 2003, 27, 1–24. [Google Scholar] [CrossRef] [Green Version]
- Lindh, P.; Lemenkova, P. Permeability, compressive strength and Proctor parameters of silts stabilised by Portland cement and ground granulated blast furnace slag (GGBFS). Arch. Mech. Eng. 2022, 69, 667–692. [Google Scholar] [CrossRef]
- Schultz, C. Model estimates soil permeability using induced polarization. Eos Trans. Am. Geophys. Union 2012, 93, 150–151. [Google Scholar] [CrossRef]
- Mohammed, H.; Kennedy, J.B.; Smith, P. Improving the Response of Soil-Metal Structures during Construction. J. Bridge Eng. 2002, 7, 6–13. [Google Scholar] [CrossRef]
- Zayyat, M.M.; Jackson, A.W.; Tanaka, T.; Hino, T.; Matsuba, Y. Foundation Soil Improvement Using Vibro Compaction Combined with Geo Grids. In Innovations in Grouting and Soil Improvement; ASCE: Reston, VA, USA, 2005; pp. 1–10. [Google Scholar] [CrossRef]
- Sheob, M.; Sajid, M.; Asim Ansari, M.; Rais, I.; Sadique, M.; Ahmad, S. Using a blend of cement and waste glass powder to improve the properties of clayey soil. Mater. Today Proc. 2023. [Google Scholar] [CrossRef]
- Tiwari, B.; Ajmera, B.; Moubayed, S.; Lemmon, A.; Styler, K.; Martinez, J.G. Improving Geotechnical Behavior of Clayey Soils with Shredded Rubber Tires—Preliminary Study. In Geo-Congress 2014 Technical Papers; ASCE: Reston, VA, USA, 2014; pp. 3734–3743. [Google Scholar] [CrossRef]
- Dharini, V.; Balamaheswari, M.; Nevis Presentia, A. Enhancing the strength of expansive clayey soil using lime as soil stabilizing agent along with sodium silicate as grouting chemical. Mater. Today Proc. 2023. [Google Scholar] [CrossRef]
- El Hariri, A.; Elawad Eltayeb Ahmed, A.; Kiss, P. Review on soil shear strength with loam sand soil results using direct shear test. J. Terramechanics 2023, 107, 47–59. [Google Scholar] [CrossRef]
- Eissa, A.; Bassuoni, M.T.; Ghazy, A.; Alfaro, M. Improving the Properties of Soft Clay Using Cement, Slag, and Nanosilica: Experimental and Statistical Modeling. J. Mater. Civ. Eng. 2022, 34, 4022031. [Google Scholar] [CrossRef]
- Zhang, C.; Zhu, Z.; Liu, F.; Yang, Y.; Wan, Y.; Huo, W.; Yang, L. Efficient machine learning method for evaluating compressive strength of cement stabilized soft soil. Constr. Build. Mater. 2023, 392, 131887. [Google Scholar] [CrossRef]
- Hogentogler, C.A.; Willis, E.A. Essential Consideration in the Stabilization of Soil. Trans. Am. Soc. Civ. Eng. 1938, 103, 1163–1183. [Google Scholar] [CrossRef]
- Fristad, W.E. Case study: Using soil washing/leaching for the removal of heavy metal at the twin cities army ammunition plant. Remediat. J. 1995, 5, 61–72. [Google Scholar] [CrossRef]
- Finney, D.S.; Himmer, T.; Morris, J.J.; Coladonato, S. Demonstrating Leaching Reductions of NAPL-Impacted Soils Treated with Stabilization/Solidification Using Modified EPA Method 1315. J. Hazard. Toxic Radioact. Waste 2015, 19, C4014002. [Google Scholar] [CrossRef]
- Hanson, A.T.; Dwyer, B.; Samani, Z.A.; York, D. Remediation of Chromium-Containing Soils by Heap Leaching: Column Study. J. Environ. Eng. 1993, 119, 825–841. [Google Scholar] [CrossRef]
- He, L.; Zhou, X.; Cao, J.; Shen, L. Ultrasound-Assisted Soil Washing for Metals-Contaminated Soil Using Various Washing Solutions. Clean—Soil Air Water 2022, 50, 2100419. [Google Scholar] [CrossRef]
- Mizutani, S.; Ikegami, M.; Sakanakura, H.; Kanjo, Y. Test Methods for the Evaluation of Heavy Metals in Contaminated Soil. In Environmental Remediation Technologies for Metal-Contaminated Soils; Springer: Tokyo, Japan, 2016; pp. 67–97. [Google Scholar] [CrossRef]
- Hoang, T.; Alleman, J.; Cetin, B.; Choi, S.G. Engineering Properties of Biocementation Coarse- and Fine-Grained Sand Catalyzed By Bacterial Cells and Bacterial Enzyme. J. Mater. Civ. Eng. 2020, 32, 04020030. [Google Scholar] [CrossRef]
- Schaefers, K.; Nam, S. Improving the Shear Strength of Soils by Adding Agricultural By-Products. In IFCEE 2015; ASCE: Reston, VA, USA, 2015; pp. 2777–2786. [Google Scholar] [CrossRef]
- Krisdani, H.; Rahardjo, H.; Leong, E.C. Behaviour of Capillary Barrier System Constructed using Residual Soil. In Waste Containment and Remediation; ASCE: Reston, VA, USA, 2005; pp. 1–15. [Google Scholar] [CrossRef]
- Bache, B.K.F.; Wiersholm, P.; Paniagua, P.; Emdal, A. Effect of Temperature on the Strength of Lime-Cement Stabilized Norwegian Clays. J. Geotech. Geoenvironmental Eng. 2022, 148, 04021198. [Google Scholar] [CrossRef]
- Andersen, K.H.; Rosenbrand, W.F.; Brown, S.F.; Pool, J.H. Cyclic and Static Laboratory Tests on Drammen Clay. J. Geotech. Eng. Div. 1980, 106, 499–529. [Google Scholar] [CrossRef]
- Zhang, Y.; Andersen, K.H.; Jeanjean, P.; Karlsrud, K.; Haugen, T. Validation of Monotonic and Cyclic p-y Framework by Lateral Pile Load Tests in Stiff, Overconsolidated Clay at the Haga Site. J. Geotech. Geoenvironmental Eng. 2020, 146, 04020080. [Google Scholar] [CrossRef]
- Binner, R.; Homberg, U.; Prohaska, S.; Kalbe, U.; Witt, K.J. Identification of Descriptive Parameters of the Soil Pore Structure Using Experiments and CT Data. In Scour and Erosion, Proceedings of the Chapter International Conference on Scour and Erosion (ICSE-5), San Francisco, CA, USA, 7–10 November 2010; ASCE: Reston, VA, USA, 2010; pp. 397–407. [Google Scholar] [CrossRef]
- Kulkarni, K.; Basavaraj, P.; Babu, S. Effect of Grain Size Distribution of Soil on Immobilization of Cadmium and Nickel in Contaminated Soil Using Nano Zerovalent Iron: A Factorial Design and Response Surface Methodology Approach. J. Hazard. Toxic Radioact. Waste 2023, 27, 04023008. [Google Scholar] [CrossRef]
- Ibrahim, R.; Nissen, M. Emerging Technology to Model Dynamic Knowledge Creation and Flow among Construction Industry Stakeholders during the Critical Feasibility-Entitlements Phase. In Towards a Vision for Information Technology in Civil Engineering; ASCE: Reston, VA, USA, 2012; pp. 1–14. [Google Scholar] [CrossRef]
- Ninić, J.; Bui, H.G.; Koch, C.; Meschke, G. Computationally Efficient Simulation in Urban Mechanized Tunneling Based on Multilevel BIM Models. J. Comput. Civ. Eng. 2019, 33, 04019007. [Google Scholar] [CrossRef]
- Lindh, P.; Lemenkova, P. Simplex Lattice Design and X-ray Diffraction for Analysis of Soil Structure: A Case of Cement-Stabilised Compacted Tills Reinforced with Steel Slag and Slaked Lime. Electronics 2022, 11, 3726. [Google Scholar] [CrossRef]
- Zhang, L.; Wu, X.; Liu, W.; Skibniewski, M.J. Optimal Strategy to Mitigate Tunnel-Induced Settlement in Soft Soils: Simulation Approach. J. Perform. Constr. Facil. 2019, 33, 4019058. [Google Scholar] [CrossRef]
- Lindh, P.; Lemenkova, P. Utilising Pareto efficiency and RSM to adjust binder content in clay stabilisation for Yttre Ringvägen, Malmö. Acta Polytech. 2023, 63, 140–157. [Google Scholar] [CrossRef]
- Wei, W. Optimization of the Mixing in a Produced Water Storage Tank with CFD. In World Environmental and Water Resources Congress 2023; ASCE: Reston, VA, USA, 2023; pp. 1175–1184. [Google Scholar] [CrossRef]
- Mohammed, S.A.S.; Sanaulla, P.F.; Alnuaim, A.M.; Moghal, A.A.B. Role of Different Leaching Methods to Arrest the Transport of Ni2+ in Soil and Soil Amended with Nano Calcium Silicate. In Proceedings of the Geo-China 2016, Shandong, China, 25–27 July 2016; ASCE: Reston, VA, USA, 2016; pp. 49–56. [Google Scholar] [CrossRef]
- Simon, F.G.; Kalbe, U.; Berger, W. Waste Characterization by Leaching and Extraction Procedures. In Proceedings of the GeoCongress 2008, New Orleans, LA, USA, 9–12 March 2008; ASCE: Reston, VA, USA, 2008; pp. 676–683. [Google Scholar] [CrossRef]
- Naghipour, D.; Jaafari, J.; Ashrafi, S.D.; Mahvi, A.H. Remediation of Heavy Metals Contaminated Silty Clay Loam Soil by Column Extraction with Ethylenediaminetetraacetic Acid and Nitrilo Triacetic Acid. J. Environ. Eng. 2017, 143, 04017026. [Google Scholar] [CrossRef]
- Wang, F.; Al-Tabbaa, A. Leachability of 17-Year-Old Stabilized/Solidified Contaminated Site Soils. In Geo-Congress 2014 Technical Papers; ASCE: Reston, VA, USA, 2014; pp. 1612–1624. [Google Scholar] [CrossRef]
- Li, L.Y.; Li, F. Heavy Metal Sorption and Hydraulic Conductivity Studies Using Three Types of Bentonite Admixes. J. Environ. Eng. 2001, 127, 420–429. [Google Scholar] [CrossRef]
- Xia, W.Y.; Feng, Y.S.; Du, Y.J.; Reddy, K.R.; Wei, M.L. Solidification and Stabilization of Heavy Metal–Contaminated Industrial Site Soil Using KMP Binder. J. Mater. Civ. Eng. 2018, 30, 4018080. [Google Scholar] [CrossRef]
- Liang, Y. Biodegradation of Pyrene in Soil Microcosms: Identification of a Toxic Intermediate. In Impacts of Global Climate Change; ASCE: Reston, VA, USA, 2005; pp. 1–9. [Google Scholar] [CrossRef]
- Aydilek, A.H.; Edil, T.B. Solidification/Stabilization of PCB-Contaminated Wastewater Treatment Sludges. In Proceedings of the GeoCongress 2008, New Orleans, LA, USA, 9–12 March 2008; ASCE: Reston, VA, USA, 2008; pp. 724–731. [Google Scholar] [CrossRef]
- Kucharski, D.; Giebułtowicz, J.; Drobniewska, A.; Nałęcz-Jawecki, G.; Skowronek, A.; Strzelecka, A.; Mianowicz, K.; Drzewicz, P. The study on contamination of bottom sediments from the Odra River estuary (SW Baltic Sea) by tributyltin using environmetric methods. Chemosphere 2022, 308, 136133. [Google Scholar] [CrossRef] [PubMed]
- Lindh, P.; Lemenkova, P. Soil contamination from heavy metals and persistent organic pollutants (PAH, PCB and HCB) in the coastal area of Västernorrland, Sweden. Gospod. Surowcami Miner.—Miner. Resour. Manag. 2022, 38, 147–168. [Google Scholar] [CrossRef]
- Marcic, C.; Le Hecho, I.; Denaix, L.; Lespes, G. TBT and TPhT persistence in a sludged soil. Chemosphere 2006, 65, 2322–2332. [Google Scholar] [CrossRef]
- Lindh, P.; Lemenkova, P. Evaluation of Different Binder Combinations of Cement, Slag and CKD for S/S Treatment of TBT Contaminated Sediments. Acta Mech. Autom. 2021, 15, 236–248. [Google Scholar] [CrossRef]
- Chandler, A.J.; Eighmy, T.T.; Hartlén, J.; Hjelmar, O.; Kosson, D.S.; Sawell, S.E.; van der Sloot, H.A.; Vehlow, J. Chapter 14—Leaching tests. In Municipal Solid Waste Incinerator Residues; Studies in Environmental Science; Elsevier: Amsterdam, The Netherlands, 1997; Volume 67, pp. 579–606. [Google Scholar] [CrossRef]
- Lindh, P.; Lemenkova, P. Geochemical tests to study the effects of cement ratio on potassium and TBT leaching and the pH of the marine sediments from the Kattegat Strait, Port of Gothenburg, Sweden. Baltica 2022, 35, 47–59. [Google Scholar] [CrossRef]
- Chittoori, B.C.S.; Puppala, A.J.; Wejrungsikul, T.; Hoyos, L.R. Experimental Studies on Stabilized Clays at Various Leaching Cycles. J. Geotech. Geoenvironmental Eng. 2013, 139, 1665–1675. [Google Scholar] [CrossRef]
- Beauchesne, I.; Blais, J.F.; Mercier, G.; Ouarda, T.B. Multicriteria Optimization of a Chemical Leaching Process for Sewage Sludge Decontamination. In Practice Periodical of Hazardous, Toxic, and Radioactive Waste Management; ASCE: Reston, VA, USA, 2008; Volume 12, pp. 150–158. [Google Scholar] [CrossRef]
- Lindh, P.; Lemenkova, P. Leaching of Heavy Metals from Contaminated Soil Stabilised by Portland Cement and Slag Bremen. Ecol. Chem. Eng. S 2022, 29, 537–552. [Google Scholar] [CrossRef]
- Schreck, S.; Mahedi, M.; Cetin, B. Leaching Behavior of Metals and Sulfate from Taconite Tailings Used in Pavement Construction. In Proceedings of the Geo-Congress 2020, Minneapolis, MN, USA, 25–28 February 2020; ASCE: Reston, VA, USA, 2020; pp. 159–168. [Google Scholar] [CrossRef]
- Becker, J.; Aydilek, A.H.; Davis, A.P.; Seagren, E.A. Evaluation of Leaching Protocols for Testing of High-Carbon Coal Fly Ash-Soil Mixtures. J. Environ. Eng. 2013, 139, 642–653. [Google Scholar] [CrossRef]
- Fuessle, R.W.; Taylor, M.A. Long-Term Solidification/Stabilization and Toxicity Characteristic Leaching Procedure for an Electric Arc Furnace Dust. J. Environ. Eng. 2004, 130, 492–498. [Google Scholar] [CrossRef]
- Dayioglu, A.Y.; Aydilek, A.H.; Cimen, O.; Cimen, M. Trace Metal Leaching from Steel Slag Used in Structural Fills. J. Geotech. Geoenvironmental Eng. 2018, 144, 04018089. [Google Scholar] [CrossRef]
- Sauer, J.J.; Benson, C.H.; Aydilek, A.H.; Edil, T.B. Trace Elements Leaching from Organic Soils Stabilized with High Carbon Fly Ash. J. Geotech. Geoenvironmental Eng. 2012, 138, 968–980. [Google Scholar] [CrossRef]
- Yu, X.; Dan, H.C.; Xin, P. Method for Improving Leaching Efficiency of Coastal Subsurface Drainage Systems. J. Irrig. Drain. Eng. 2018, 144, 04018019. [Google Scholar] [CrossRef]
- Alpaslan, B.; Yukselen, M.A. Remediation of Lead Contaminated Soils by Stabilization/Solidification. Water Air Soil Pollut. 2002, 133, 253–263. [Google Scholar] [CrossRef]
- Liu, J.; Wu, D.; Tan, X.; Yu, P.; Xu, L. Review of the Interactions between Conventional Cementitious Materials and Heavy Metal Ions in Stabilization/Solidification Processing. Materials 2023, 16, 3444. [Google Scholar] [CrossRef]
- Huang, H.; Shi, L.; Chen, R.; Yuan, J. Effect of Modified Illite on Cd Immobilization and Fertility Enhancement of Acidic Soils. Sustainability 2023, 15, 4950. [Google Scholar] [CrossRef]
- Paniagua, P.; Ritter, S.; Moseid, M.; Okkenhaug, G. Bioashes and Steel Slag as Alternative Binders in Ground Improvement of Quick Clays. In Geo-Congress 2023: Soil Improvement, Geoenvironmental, and Sustainability; ASCE: Reston, VA, USA, 2023; pp. 25–34. [Google Scholar] [CrossRef]
- Tonini de Araújo, M.; Tonatto Ferrazzo, S.; Mansur Chaves, H.; Gravina da Rocha, C.; Cesar Consoli, N. Mechanical behavior, mineralogy, and microstructure of alkali-activated wastes-based binder for a clayey soil stabilization. Constr. Build. Mater. 2023, 362, 129757. [Google Scholar] [CrossRef]
- Filho, H.C.S.; Saldanha, R.B.; da Rocha, C.G.; Consoli, N.C. Sustainable Binders Stabilizing Dispersive Clay. J. Mater. Civ. Eng. 2021, 33, 06020026. [Google Scholar] [CrossRef]
- Kukko, H. Stabilization of Clay with Inorganic By-Products. J. Mater. Civ. Eng. 2000, 12, 307–309. [Google Scholar] [CrossRef]
- Lam, K.P.; lei Kou, H.; Xie, B.; Chu, J.; He, J. Use of a Waste-Based Binder for High Water Content Soil Treatment. J. Mater. Civ. Eng. 2018, 30, 06018009. [Google Scholar] [CrossRef]
- Ghavami, S.; Jahanbakhsh, H.; Saeedi Azizkandi, A.; Nejad, F.M. Influence of sodium chloride on cement kiln dust-treated clayey soil: Strength properties, cost analysis, and environmental impact. Environ. Dev. Sustain. 2021, 23, 683–702. [Google Scholar] [CrossRef]
- Mishra, S.; Sachdeva, S.N.; Manocha, R. Subgrade Soil Stabilization Using Stone Dust and Coarse Aggregate: A Cost Effective Approach. Int. J. Geosynth. Ground Eng. 2019, 5, 20. [Google Scholar] [CrossRef]
- Lu, S.F.; Wu, Y.L.; Chen, Z.; Li, T.; Shen, C.; Xuan, L.K.; Xu, L. Remediation of contaminated soil and groundwater using chemical reduction and solidification/stabilization method: A case study. Environ. Sci. Pollut. Res. 2021, 28, 12766–12779. [Google Scholar] [CrossRef]
- Agarwal, S.; Al-Abed, S.R.; Dionysiou, D.D. In Situ Technologies for Reclamation of PCB-Contaminated Sediments: Current Challenges and Research Thrust Areas. J. Environ. Eng. 2007, 133, 1075–1078. [Google Scholar] [CrossRef]
- Du, J.; Chadalavada, S.; Chen, Z.; Naidu, R. Environmental remediation techniques of tributyltin contamination in soil and water: A review. Chem. Eng. J. 2014, 235, 141–150. [Google Scholar] [CrossRef]
- Sarker, A.; Masud, M.A.A.; Deepo, D.M.; Das, K.; Nandi, R.; Ansary, M.W.R.; Islam, A.R.M.T.; Islam, T. Biological and green remediation of heavy metal contaminated water and soils: A state-of-the-art review. Chemosphere 2023, 332, 138861. [Google Scholar] [CrossRef]
- Lu, L.; Xie, Y.; Yang, Z.; Chen, B. Sustainable decontamination of heavy metal in wastewater and soil with novel rectangular wave asymmetrical alternative current electrochemistry. J. Hazard. Mater. 2023, 442, 130021. [Google Scholar] [CrossRef]
- Chen, A.; Lin, C.; Lu, W.; Ma, Y.; Bai, Y.; Chen, H.; Li, J. Chemical dynamics of acidity and heavy metals in a mine water-polluted soil during decontamination using clean water. J. Hazard. Mater. 2010, 175, 638–645. [Google Scholar] [CrossRef] [PubMed]
- Kavamura, V.N.; Esposito, E. Biotechnological strategies applied to the decontamination of soils polluted with heavy metals. Biotechnol. Adv. 2010, 28, 61–69. [Google Scholar] [CrossRef] [PubMed]
- Chen, W.; Li, H. Cost-Effectiveness Analysis for Soil Heavy Metal Contamination Treatments. Water Air Soil Pollut. Vol. 2018, 229, 126. [Google Scholar] [CrossRef]
- Karachaliou, T.; Protonotarios, V.; Kaliampakos, D.; Menegaki, M. Using Risk Assessment and Management Approaches to Develop Cost-Effective and Sustainable Mine Waste Management Strategies. Recycling 2016, 1, 328–342. [Google Scholar] [CrossRef]
- Ahmed, I.B.; Nwaichi, E.O.; Ugwoha, E.; Ugbebor, J.N.; Arokoyu, S.B. Cost reduction strategies in the remediation of petroleum hydrocarbon contaminated soil. Open Res. Afr. 2022, 5, 21. [Google Scholar] [CrossRef] [PubMed]
- Zhang, J.; Wu, C.; Wang, L.; Mao, X.; Wu, Y. The Work Flow and Operational Model for Geotechnical Investigation Based on BIM. IEEE Access 2016, 4, 7500–7508. [Google Scholar] [CrossRef]
- Lindh, P. Optimising binder blends for shallow stabilisation of fine-grained soils. Proc. Inst. Civ. Eng.—Ground Improv. 2001, 5, 23–34. [Google Scholar] [CrossRef]
- Boumezerane, D. Recent Tendencies in the Use of Optimization Techniques in Geotechnics: A Review. Geotechnics 2022, 2, 114–132. [Google Scholar] [CrossRef]
- Rehman, A.U.; Moghal, A.A.B. The Influence and Optimization of Treatment Strategy in Enhancing Semiarid Soil Geotechnical Properties. Arab. J. Sci. Eng. 2018, 43, 5129–5141. [Google Scholar] [CrossRef]
- Yin, Z.Y.; Jin, Y.F.; Shen, J.S.; Hicher, P.Y. Optimization techniques for identifying soil parameters in geotechnical engineering: Comparative study and enhancement. Int. J. Numer. Anal. Methods Geomech. 2018, 42, 70–94. [Google Scholar] [CrossRef]
- Onyelowe, K.C.; Mojtahedi, F.F.; Ebid, A.M.; Rezaei, A.; Osinubi, K.J.; Eberemu, A.O.; Salahudeen, B.; Gadzama, E.W.; Rezazadeh, D.; Jahangir, H.; et al. Selected AI optimization techniques and applications in geotechnical engineering. Cogent Eng. 2023, 10, 2153419. [Google Scholar] [CrossRef]
- SS-EN 197-1:2011; Cement—Part 1: Composition, specifications and conformity criteria for common cements. Swedish Institute for Standards: Stockholm, Sweden, 2011; 48p.
- SS-EN 15167-1:2006; Ground granulated blast furnace slag for use in concrete, mortar and grout—Part 1: Definitions, specifications and conformity criteria. Swedish Institute for Standards: Stockholm, Sweden, 2006.
- Lindh, P.; Lemenkova, P. Resonant Frequency Ultrasonic P-Waves for Evaluating Uniaxial Compressive Strength of the Stabilized Slag–Cement Sediments. Nord. Concr. Res. 2021, 65, 39–62. [Google Scholar] [CrossRef]
- SS-EN ISO 17892-11:2019; Geotechnical investigation and testing—Laboratory testing of soil—Part 11: Permeability tests (ISO 17892-11:2019). Swedish Institute for Standards: Stockholm, Sweden, 2019.
- STD-8013628; Karaktärisering av Avfall—Test av GrundläGgande Lakegenskaper—Dynamisk Laktest för Monoliter Med Periodiskt Utbyte av LakväTska vid BestäMda TestföRhåLlanden [Characterization of waste—Test of basic leach properties—Dynamic Leach Test for Monoliths with Periodic Exchange of Leach Liquid at Specified Test Conditions]. Swedish Institute for Standards: Stockholm, Sweden, 2015. (In Swedish)
- Zeffer, A.; Samuelsson, P.O. Sedimentprovtagning i SmåBåTshamnar i Stenungsund [Sediment Sampling in Marinas in Stenungsund]; Technical Report; Stenungsund Municipality: Stenungsund, Sweden, 2011; 62p. (In Swedish) [Google Scholar]
- Inui, T.; Kamon, M.; Katsumi, T.; Kida, A. Evaluating Cr(VI) Leaching from Recycled Waste Concrete Aggregate Using Acceleration Tests. In Proceedings of the GeoCongress 2008, New Orleans, LA, USA, 9–12 March 2008; ASCE: Reston, VA, USA, 2008; pp. 280–287. [Google Scholar] [CrossRef]
- Holleran, I.; Wilson, D.J.; Holleran, G.; Walubita, L.F. Reclaimed Asphalt Pavements and Contaminant Leaching-A Literature Review Study. In Proceedings of the Geo-China 2016, Shandong, China, 25–27 July 2016; ASCE: Reston, VA, USA, 2016; pp. 19–28. [Google Scholar] [CrossRef]
- Chen, J.; Eun, J.; Feng, Y.; Tinjum, J.M. Long-Term Leaching Behavior of Chromite Ore Processing Residue as Backfill Material and the Propagation of Chromium in the Surrounding Soil. J. Hazard. Toxic Radioact. Waste 2021, 25, 04021017. [Google Scholar] [CrossRef]
- Sandhu, N.K.; Axe, L.B.; Jahan, K.; Ramanujachary, K.V.; Magdaleno, T.F. Leaching of Arsenic, Lead, and Antimony from Highway-Marking Glass Beads. J. Environ. Eng. 2013, 139, 1168–1177. [Google Scholar] [CrossRef]
- Lin, Y.T.; Weng, C.H.; Lee, S.Y. Spatial Distribution of Heavy Metals in Contaminated Agricultural Soils Exemplified by Cr, Cu, and Zn. J. Environ. Eng. 2012, 138, 299–306. [Google Scholar] [CrossRef]
- Kim, S.O.; Kim, K.W.; Stüben, D. Evaluation of Electrokinetic Removal of Heavy Metals from Tailing Soils. J. Environ. Eng. 2002, 128, 705–715. [Google Scholar] [CrossRef]
- Bongo, G.; Mercier, G.; Chartier, M.; Dhenain, A.; Blais, J.F. Treatment of Aluminum Plant Hazardous Wastes Containing Fluorides and PAH. J. Environ. Eng. 2009, 135, 159–166. [Google Scholar] [CrossRef]
- Nordmark, D.; Vestin, J.; Lagerkvist, A.; Lind, B.B.; Arm, M.; Hallgren, P. Geochemical Behavior of a Gravel Road Upgraded with Wood Fly Ash. J. Environ. Eng. 2014, 140, 05014002. [Google Scholar] [CrossRef]
Figure 1.
Containers in which dredged soil materials were stored after transportation. Photo source: Per Lindh.
Figure 1.
Containers in which dredged soil materials were stored after transportation. Photo source: Per Lindh.

Figure 2.
Process of surface leaching test on soil specimens. Photo source: Per Lindh.

Figure 3.
Permeability of soil in relation to the ratio between cement (c) and slag (s) for dredged soil. The best results with the lowest permeability of soil show the combination of binders for 30% cement and 70% slag. The abbreviation stands for “high water–low binder” level in a mixture.
Figure 3.
Permeability of soil in relation to the ratio between cement (c) and slag (s) for dredged soil. The best results with the lowest permeability of soil show the combination of binders for 30% cement and 70% slag. The abbreviation stands for “high water–low binder” level in a mixture.

Figure 4.
Permeability of soil samples changing over time of experiment (in hours), Specimen IDs: (a) , (b) , (c) , (d) , (e) , and (f) .
Figure 4.
Permeability of soil samples changing over time of experiment (in hours), Specimen IDs: (a) , (b) , (c) , (d) , (e) , and (f) .

Figure 5.
Cumulative leaching of arsenic (As) against time in tested specimen samples.

Figure 6.
Cumulative leaching of nickel (Ni) over time in tested soil specimens.

Figure 7.
Cumulative leaching of PAH-16 in tested soil samples.

Figure 8.
Developed leaching of TBT from the soil samples over time. Blue area represents the significant level of cumulative leaching.
Figure 8.
Developed leaching of TBT from the soil samples over time. Blue area represents the significant level of cumulative leaching.

Table 1.
Parameters of the six soil specimens tested for permeability using permeameter in SGI.
| Sample ID | Sample Water Ratio (%) | Bulk Density (t/m3) | Dry Density (t/m3) |
|---|---|---|---|
| 60.8 | 1.62 | 1.01 | |
| 75.3 | 1.49 | 0.85 | |
| 107 | 1.40 | 0.68 | |
| 63.5 | 1.62 | 0.99 | |
| 45.2 | 1.77 | 1.22 | |
| 45.5 | 1.72 | 1.18 |
Table 2.
Development of permeability (p, m/s) of the soil specimen over time (t, hours). The maximal achieved permeability level in soil specimen after the period of treatment is in bold text.
Table 2.
Development of permeability (p, m/s) of the soil specimen over time (t, hours). The maximal achieved permeability level in soil specimen after the period of treatment is in bold text.
| Sample 1_5 | Sample 3_5 | Sample 4_1 | Sample 5_4 | Sample 6_5 | Sample 8_5 | ||||||
|---|---|---|---|---|---|---|---|---|---|---|---|
| t | p | t | p | t | p | t | p | t | p | t | p |
| 41.90 | 1.7 | 41.94 | 1.1 | 41.91 | 1.2 | 65.91 | 6.2 | 41.96 | 2.3 | 17.98 | 1.2 |
| 49.96 | 1.8 | 49.99 | 1.2 | 49.97 | 1.1 | 74.05 | 6.1 | 46.29 | 2.3 | 26.02 | 1.2 |
| 65.88 | 1.9 | 65.93 | 1.4 | 65.89 | 1.5 | 91.27 | 5.0 | 50.00 | 2.3 | 41.96 | 1.7 |
| 74.02 | 1.8 | 74.07 | 1.4 | 74.03 | 1.8 | 122.25 | 4.9 | 65.94 | 2.5 | 50.11 | 1.9 |
| 91.23 | 1.5 | 91.29 | 1.2 | 91.24 | 1.6 | – | – | 74.09 | 2.9 | 67.32 | 1.7 |
| – | – | – | – | – | – | – | – | 91.31 | 3.0 | – | – |
| 122.22 | 1.5 | 122.26 | 1.0 | 122.23 | 1.2 | 144.98 | 4.8 | 122.27 | 3.0 | 98.28 | 1.5 |
Table 3.
Original level of contaminants: 7 types of heavy metals (mg/kg), total PAH-16 (mg/kg), and TBT (g Sn/kg) collected in various test sites (TS) of Kongshavn.
Table 3.
Original level of contaminants: 7 types of heavy metals (mg/kg), total PAH-16 (mg/kg), and TBT (g Sn/kg) collected in various test sites (TS) of Kongshavn.
| Test Site | Heavy Metals | Total PAH-16 | TBT-Sn | ||||||
|---|---|---|---|---|---|---|---|---|---|
| As | Pb | Cd | Cr | Hg | Ni | Zn | |||
| 1–2 | 13 | 47 | 0.5 | 47 | 0.365 | 41 | 200 | 9.4 | 37 |
| 3–4 | 10 | 34 | 0.2 | 43 | 0.17 | 38 | 140 | 0.5 | 2.8 |
| 5 | 9 | 38 | 0.32 | 45 | 0.174 | 30 | 140 | 0.94 | <2.0 |
| 6 | 7.5 | 45 | 0.1 | 37 | 0.317 | 26 | 180 | 1.4 | 38 |
| 8 | 13 | 100 | 0.86 | 52 | 0.574 | 50 | 350 | 8.1 | 5.9 |
Table 4.
Concentration level of origin for PCBs in Kongshavn test sites (TS) (mg/kg TS).
| TS | PCB 28 | PCB 52 | PCB 101 | PCB 118 | PCB 153 | PCB 138 | PCB 180 | ∑ 7 PCB |
|---|---|---|---|---|---|---|---|---|
| 1–2 | 0.0054 | 0.019 | 0.014 | 0.0098 | 0.20 | 0.20 | 0.013 | 0.1 |
| 3–4 | <0.00050 | 0.00061 | <0.00050 | <0.00050 | 0.00063 | 0.00063 | <0.00050 | 0.0019 |
| 5 | <0.00053 | <0.00053 | <0.00053 | <0.00053 | 0.0011 | 0.0011 | 0.00070 | 0.0029 |
| 6 | 0.0017 | 0.0059 | 0.0026 | 0.0031 | 0.0033 | 0.0033 | 0.0022 | 0.022 |
| 8 | 0.0063 | 0.017 | 0.015 | 0.012 | 0.012 | 0.012 | 0.0071 | 0.081 |
Table 5.
Deviation classification of heavy metals according to the Swedish standards (mg/kg TS).
| Metal | Class 1 | Class 2 | Class 3 | Class 4 | Class 5 |
|---|---|---|---|---|---|
| As | <10 | 10–17 | 17–28 | 28–45 | >45 |
| Cd | <0.2 | 1.2–0.5 | 0.5–1.2 | 1.2 | >3 |
| Cr | <40 | 40–48 | 48–60 | 60–72 | >72 |
| Cu | <15 | 15–30 | 30–49.5 | 49.5–79.5 | >79.5 |
| Hg | <0.04 | 0.04–0.12 | 0.12–0.4 | 0.4–1 | >1 |
| Ni | <30 | 30–45 | 46–66 | 66–99 | >99 |
| Pb | <25 | 25–40 | 40–65 | 65–110 | >110 |
| Zn | <85 | 85–127.5 | 127.5–204 | 204–357 | >357 |
Notations for Classes in Table 5: Class 1—No insignificant deviation from comparative values; Class 2—Small deviation the comparative value; Class 3—Clear deviation from comparative values; Class 4—Large deviation from comparative values; Class 5—Very large deviation from comparative values.
Table 6.
Values of concentrations of leaching contaminants (mg/m2) from soil samples: above or below the reported limits.
Table 6.
Values of concentrations of leaching contaminants (mg/m2) from soil samples: above or below the reported limits.
| Sample | As | Pb | Cd | Cr | Hg | Ni | Zn |
|---|---|---|---|---|---|---|---|
| B 1, S-6 | above | below | below | below | below | above | both |
| B 1, S-7 | above | below | below | below | below | above | below |
| B 1, S-8A | above | below | below | below | below | above | both |
Notations for abbreviations in Table 6: B1—Batch 1; S6—Sample 6; S7—Sample 7; S-8A—Sample 8A; As—Arsenic; Pb—Lead; Cd—Cadmium; Cr—Chromium; Hg—Mercury; Ni—Nickel; Zn—Zinc.
Table 7.
Surface leaching of contaminants (heavy metals and TBT, mg/m2) from soil after 9 days.
| Metal | A 23 | A 17 | A 18 | T 11 | T 09 | |||
|---|---|---|---|---|---|---|---|---|
| As | 0.0807 | 0.0782 | 0.105 | 0.0276 | 0.0050 | <0.0014 | 0.0042 | 0.0090 |
| Cd | <0.004 | <0.004 | <0.004 | 0.0025 | 0.00035 | <0.00028 | <0.0003 | <0.0003 |
| Cr | <0.04 | <0.04 | <0.04 | 0.006 | 0.010 | 0.0091 | 0.0091 | 0.024 |
| Hg | <0.002 | <0.002 | <0.002 | <0.0063 | <0.0070 | <0.0070 | <0.0076 | <0.0082 |
| Ni | 0.272 | 0.411 | 0.4 | 0.52 | 1.1 | 0.14 | 0.46 | 0.69 |
| Zn | <0.2 | <0.2 | <0.2 | <0.013 | <0.014 | <0.014 | <0.015 | <0.02 |
| TBT | 101 | 103 | 157 | 275 | 1180 | 315 | – | – |
Notations for Table 7: indicate a “high water/low binder” ratio in a mixture. The abbreviations indicate the locations where measurements were performed: Oslo (O), Arendal (A), and Timrå (T).
Disclaimer/Publisher’s Note: The statements, opinions and data contained in all publications are solely those of the individual author(s) and contributor(s) and not of MDPI and/or the editor(s). MDPI and/or the editor(s) disclaim responsibility for any injury to people or property resulting from any ideas, methods, instructions or products referred to in the content. |
© 2023 by the authors. Licensee MDPI, Basel, Switzerland. This article is an open access article distributed under the terms and conditions of the Creative Commons Attribution (CC BY) license (https://creativecommons.org/licenses/by/4.0/).
Share and Cite
MDPI and ACS Style
Lindh, P.; Lemenkova, P. Optimized Workflow Framework in Construction Projects to Control the Environmental Properties of Soil. Algorithms 2023, 16, 303. https://doi.org/10.3390/a16060303
AMA Style
Lindh P, Lemenkova P. Optimized Workflow Framework in Construction Projects to Control the Environmental Properties of Soil. Algorithms. 2023; 16(6):303. https://doi.org/10.3390/a16060303
Chicago/Turabian StyleLindh, Per, and Polina Lemenkova. 2023. "Optimized Workflow Framework in Construction Projects to Control the Environmental Properties of Soil" Algorithms 16, no. 6: 303. https://doi.org/10.3390/a16060303
Note that from the first issue of 2016, this journal uses article numbers instead of page numbers. See further details here.