Effect of Injection Molding Conditions on Crystalline Structure and Electrical Resistivity of PP/MWCNT Nanocomposites

 , ,
, ,  ,
, 
Abstract
:1. Introduction
2. Materials and Methods
2.1. Materials
2.2. Processing
2.3. Electrical Properties
2.4. Morphology
2.5. Rheology
2.6. Differential Scanning Calorimetry
3. Results and Discussion
3.1. Electrical Properties
3.2. Morphological Characterization
3.3. Effect of Processing Conditions
3.3.1. Electrical Properties
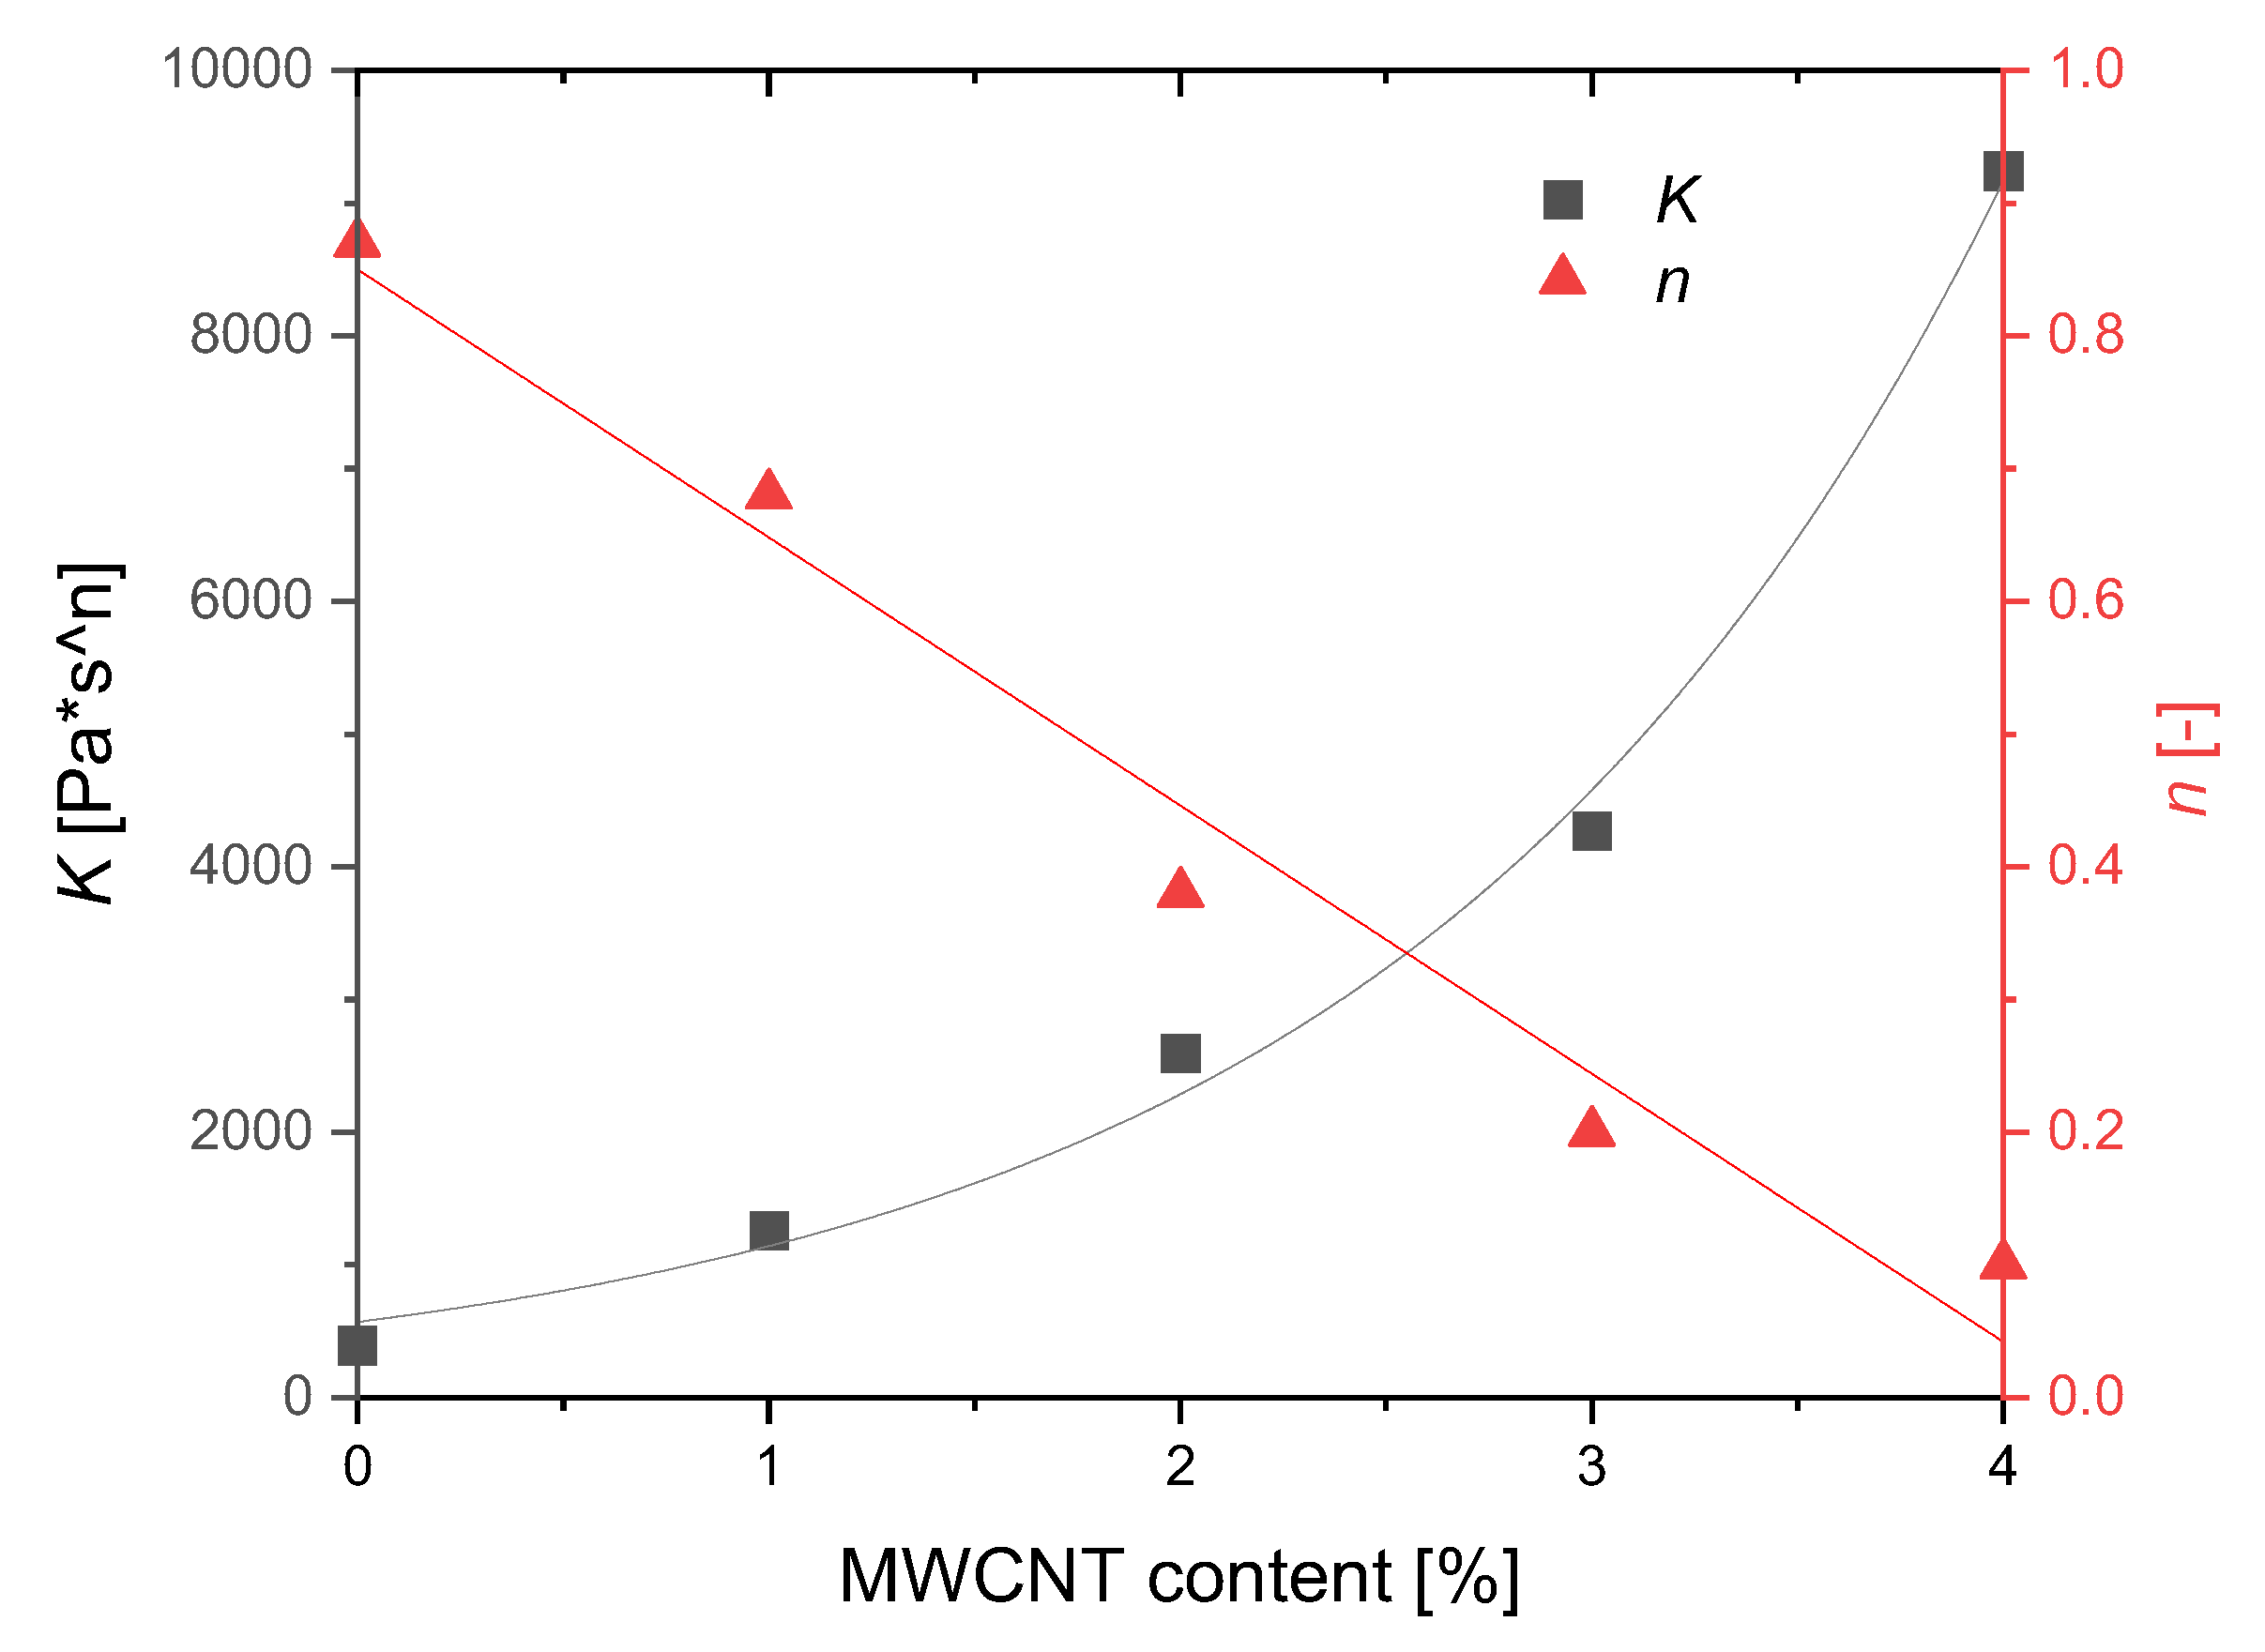
3.3.2. Rheology
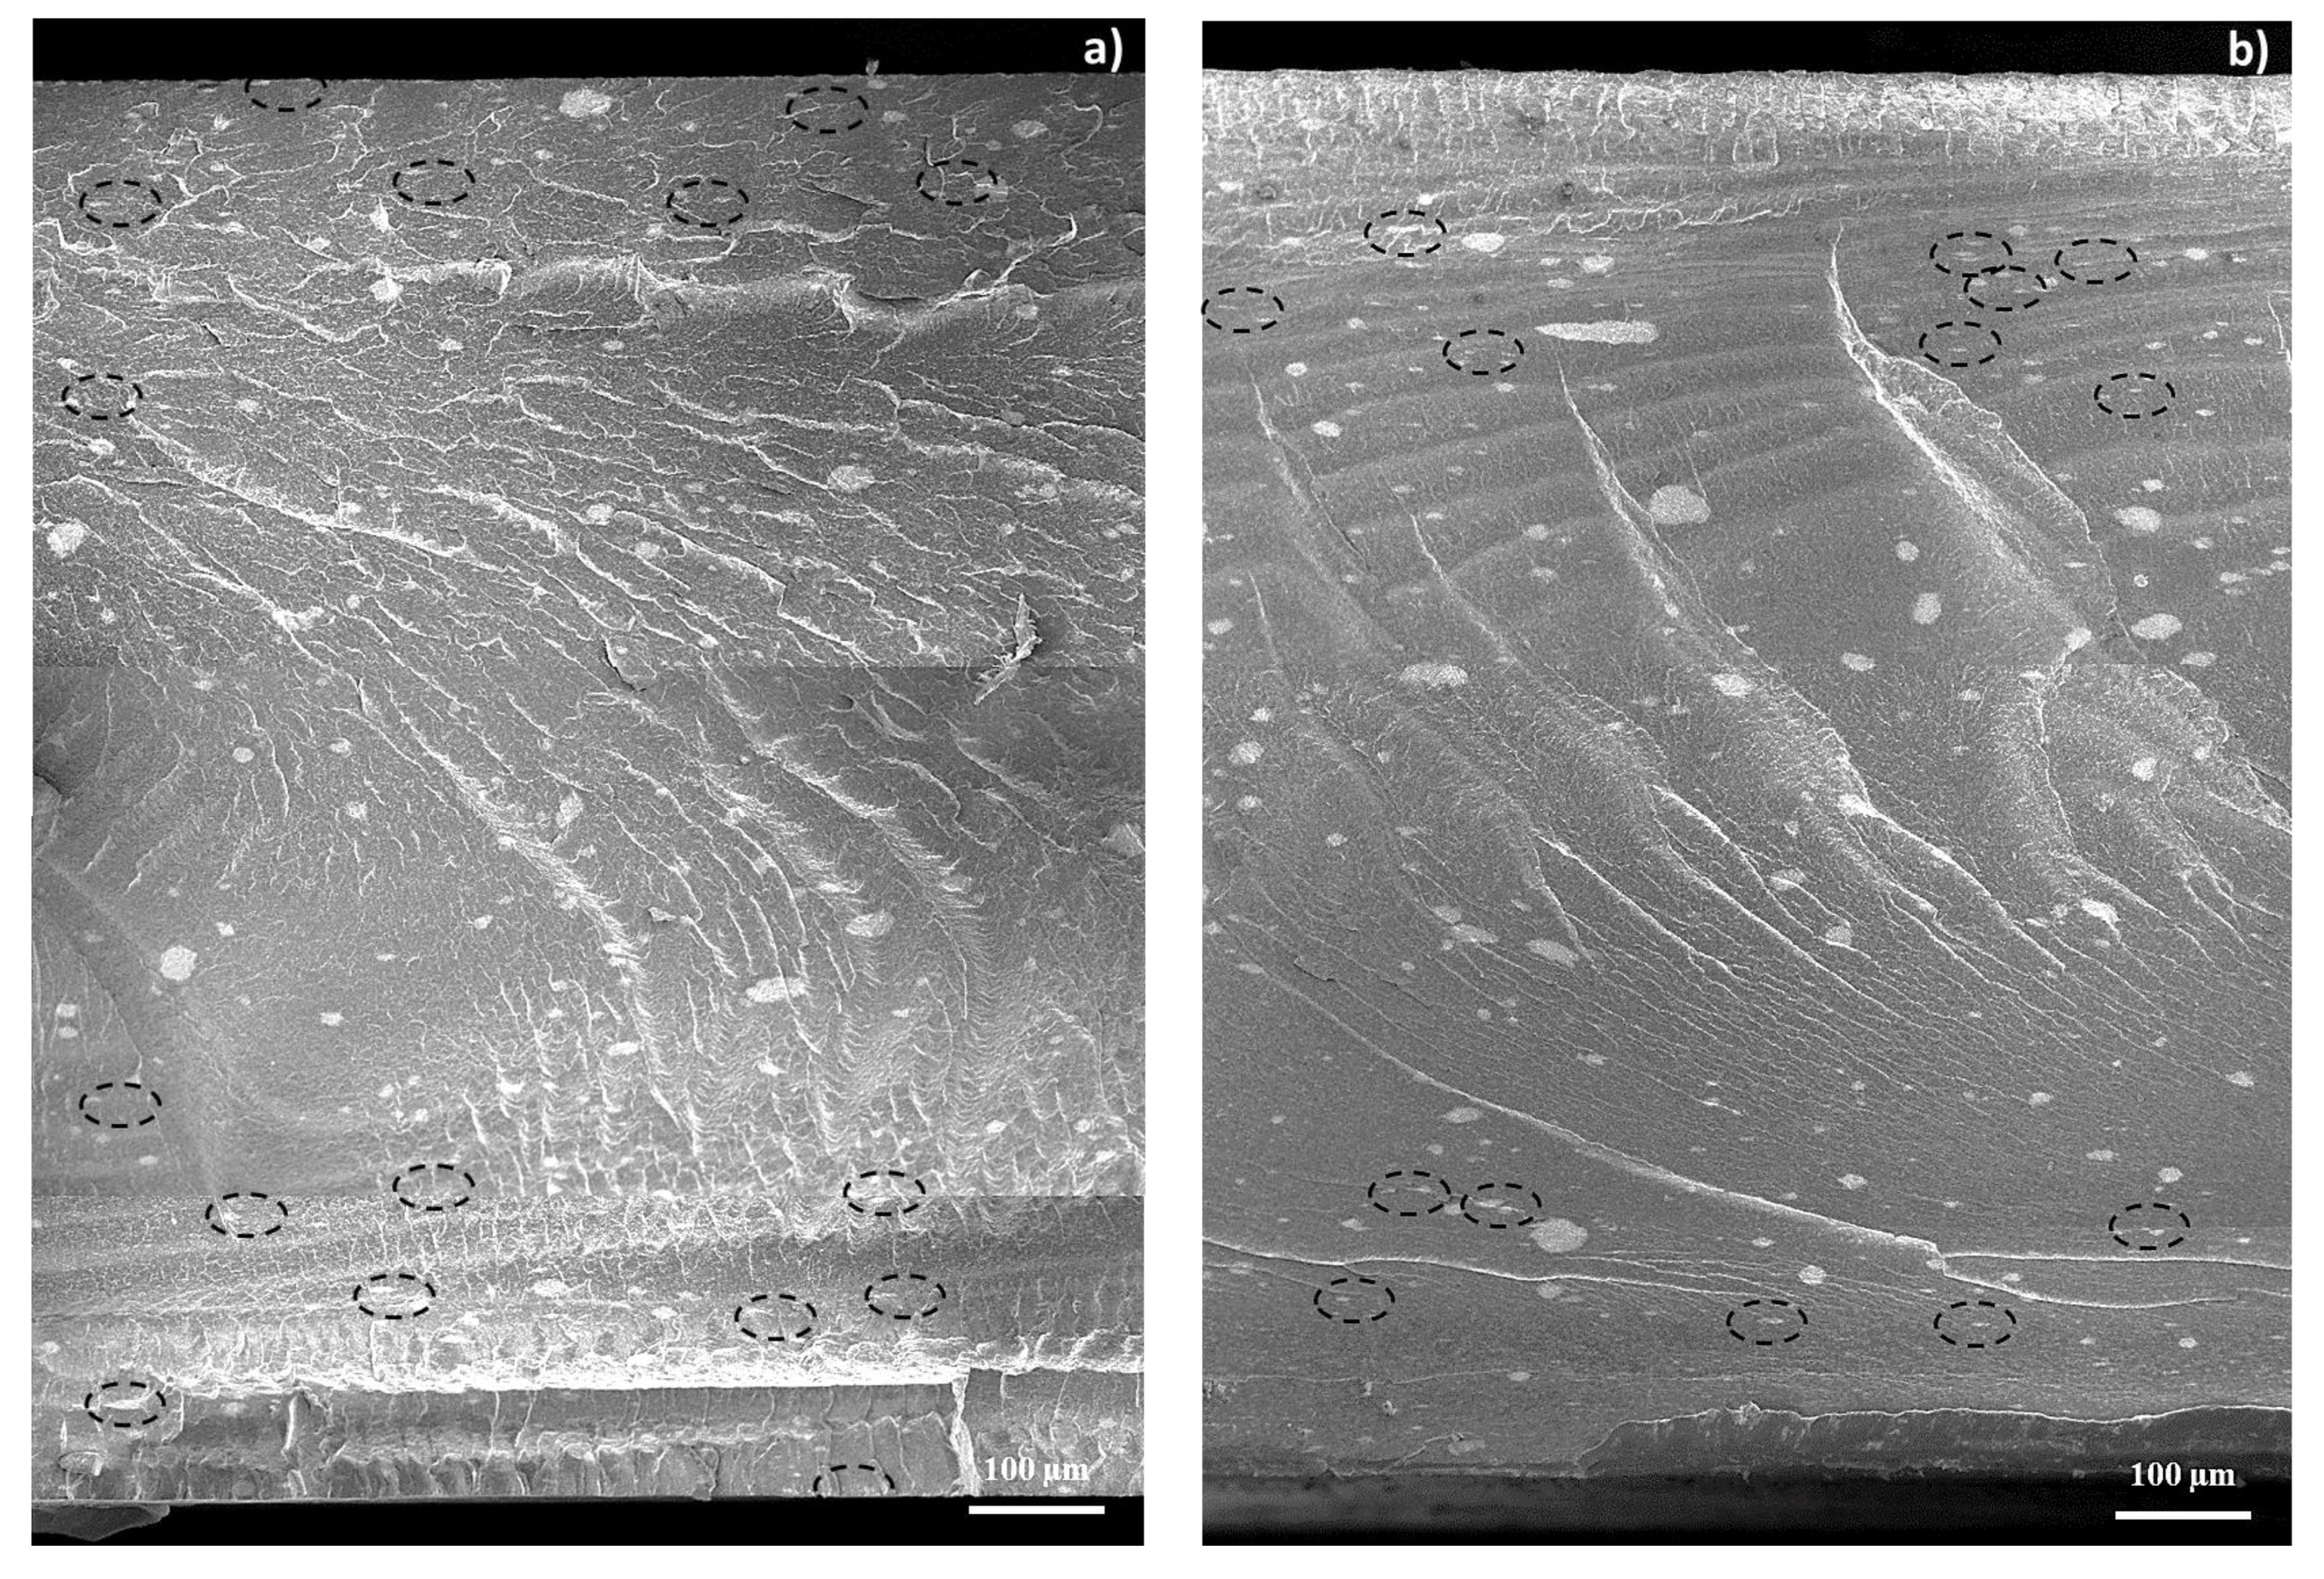
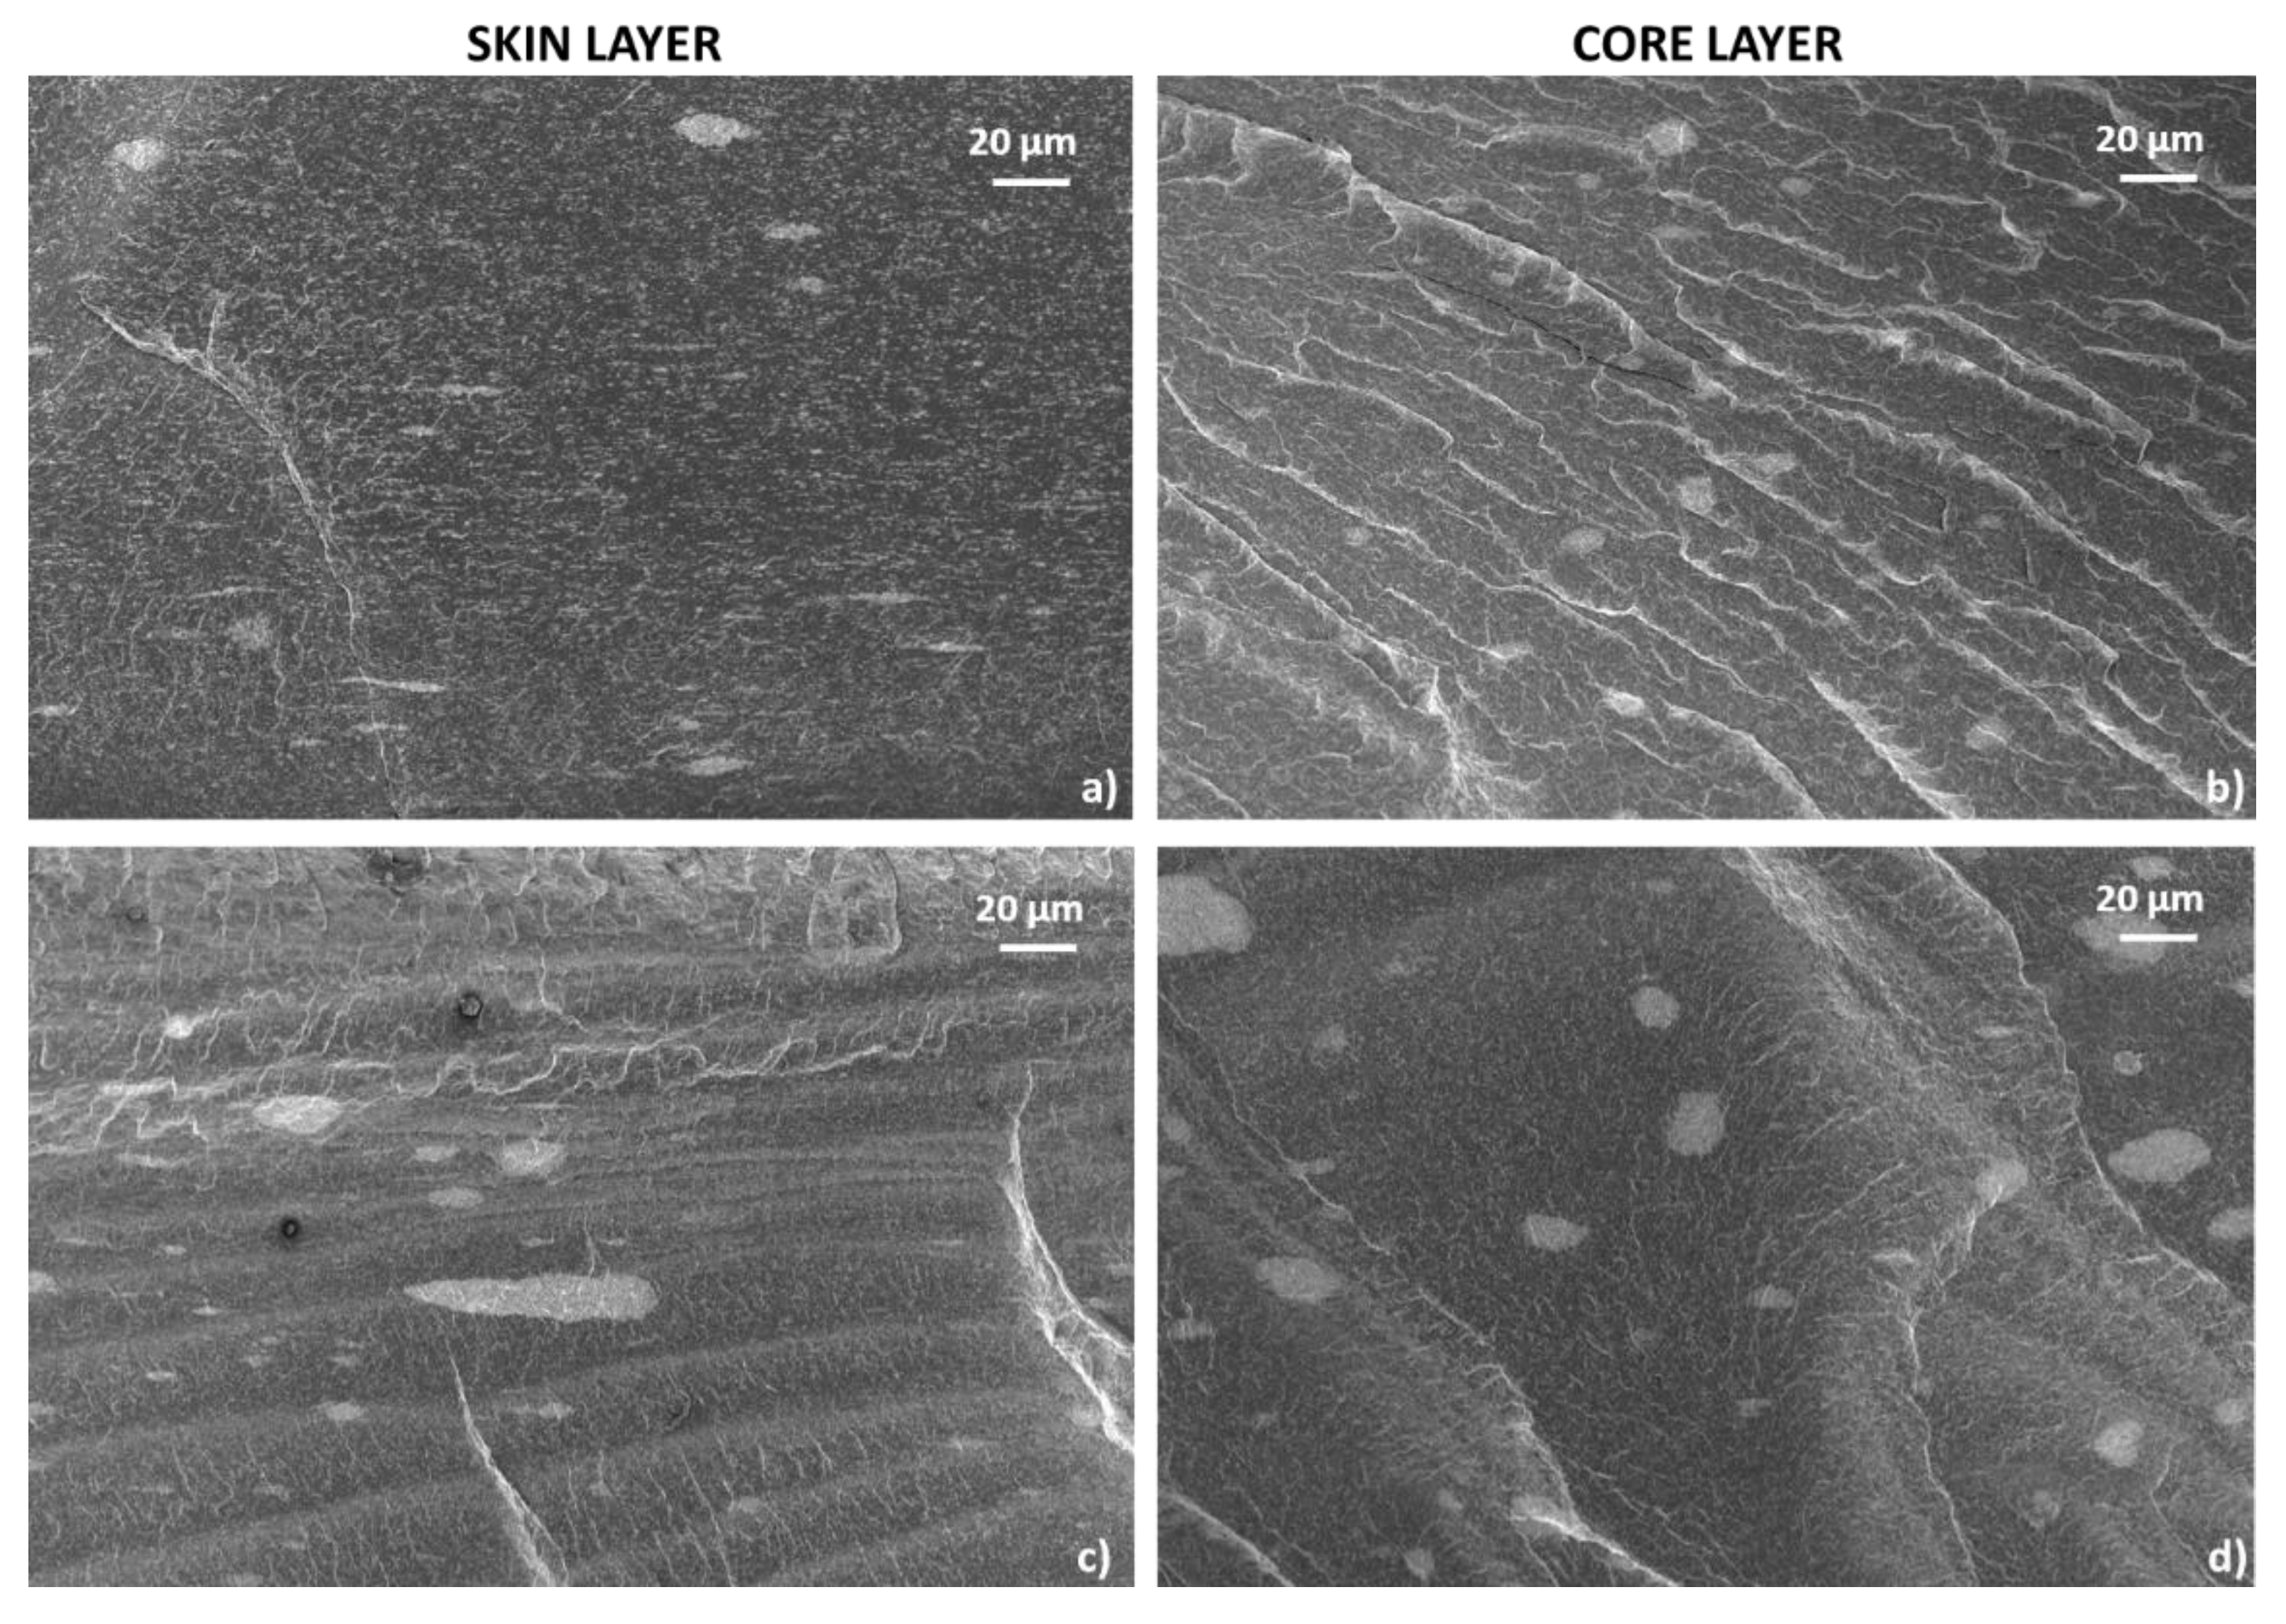
3.3.3. Morphology
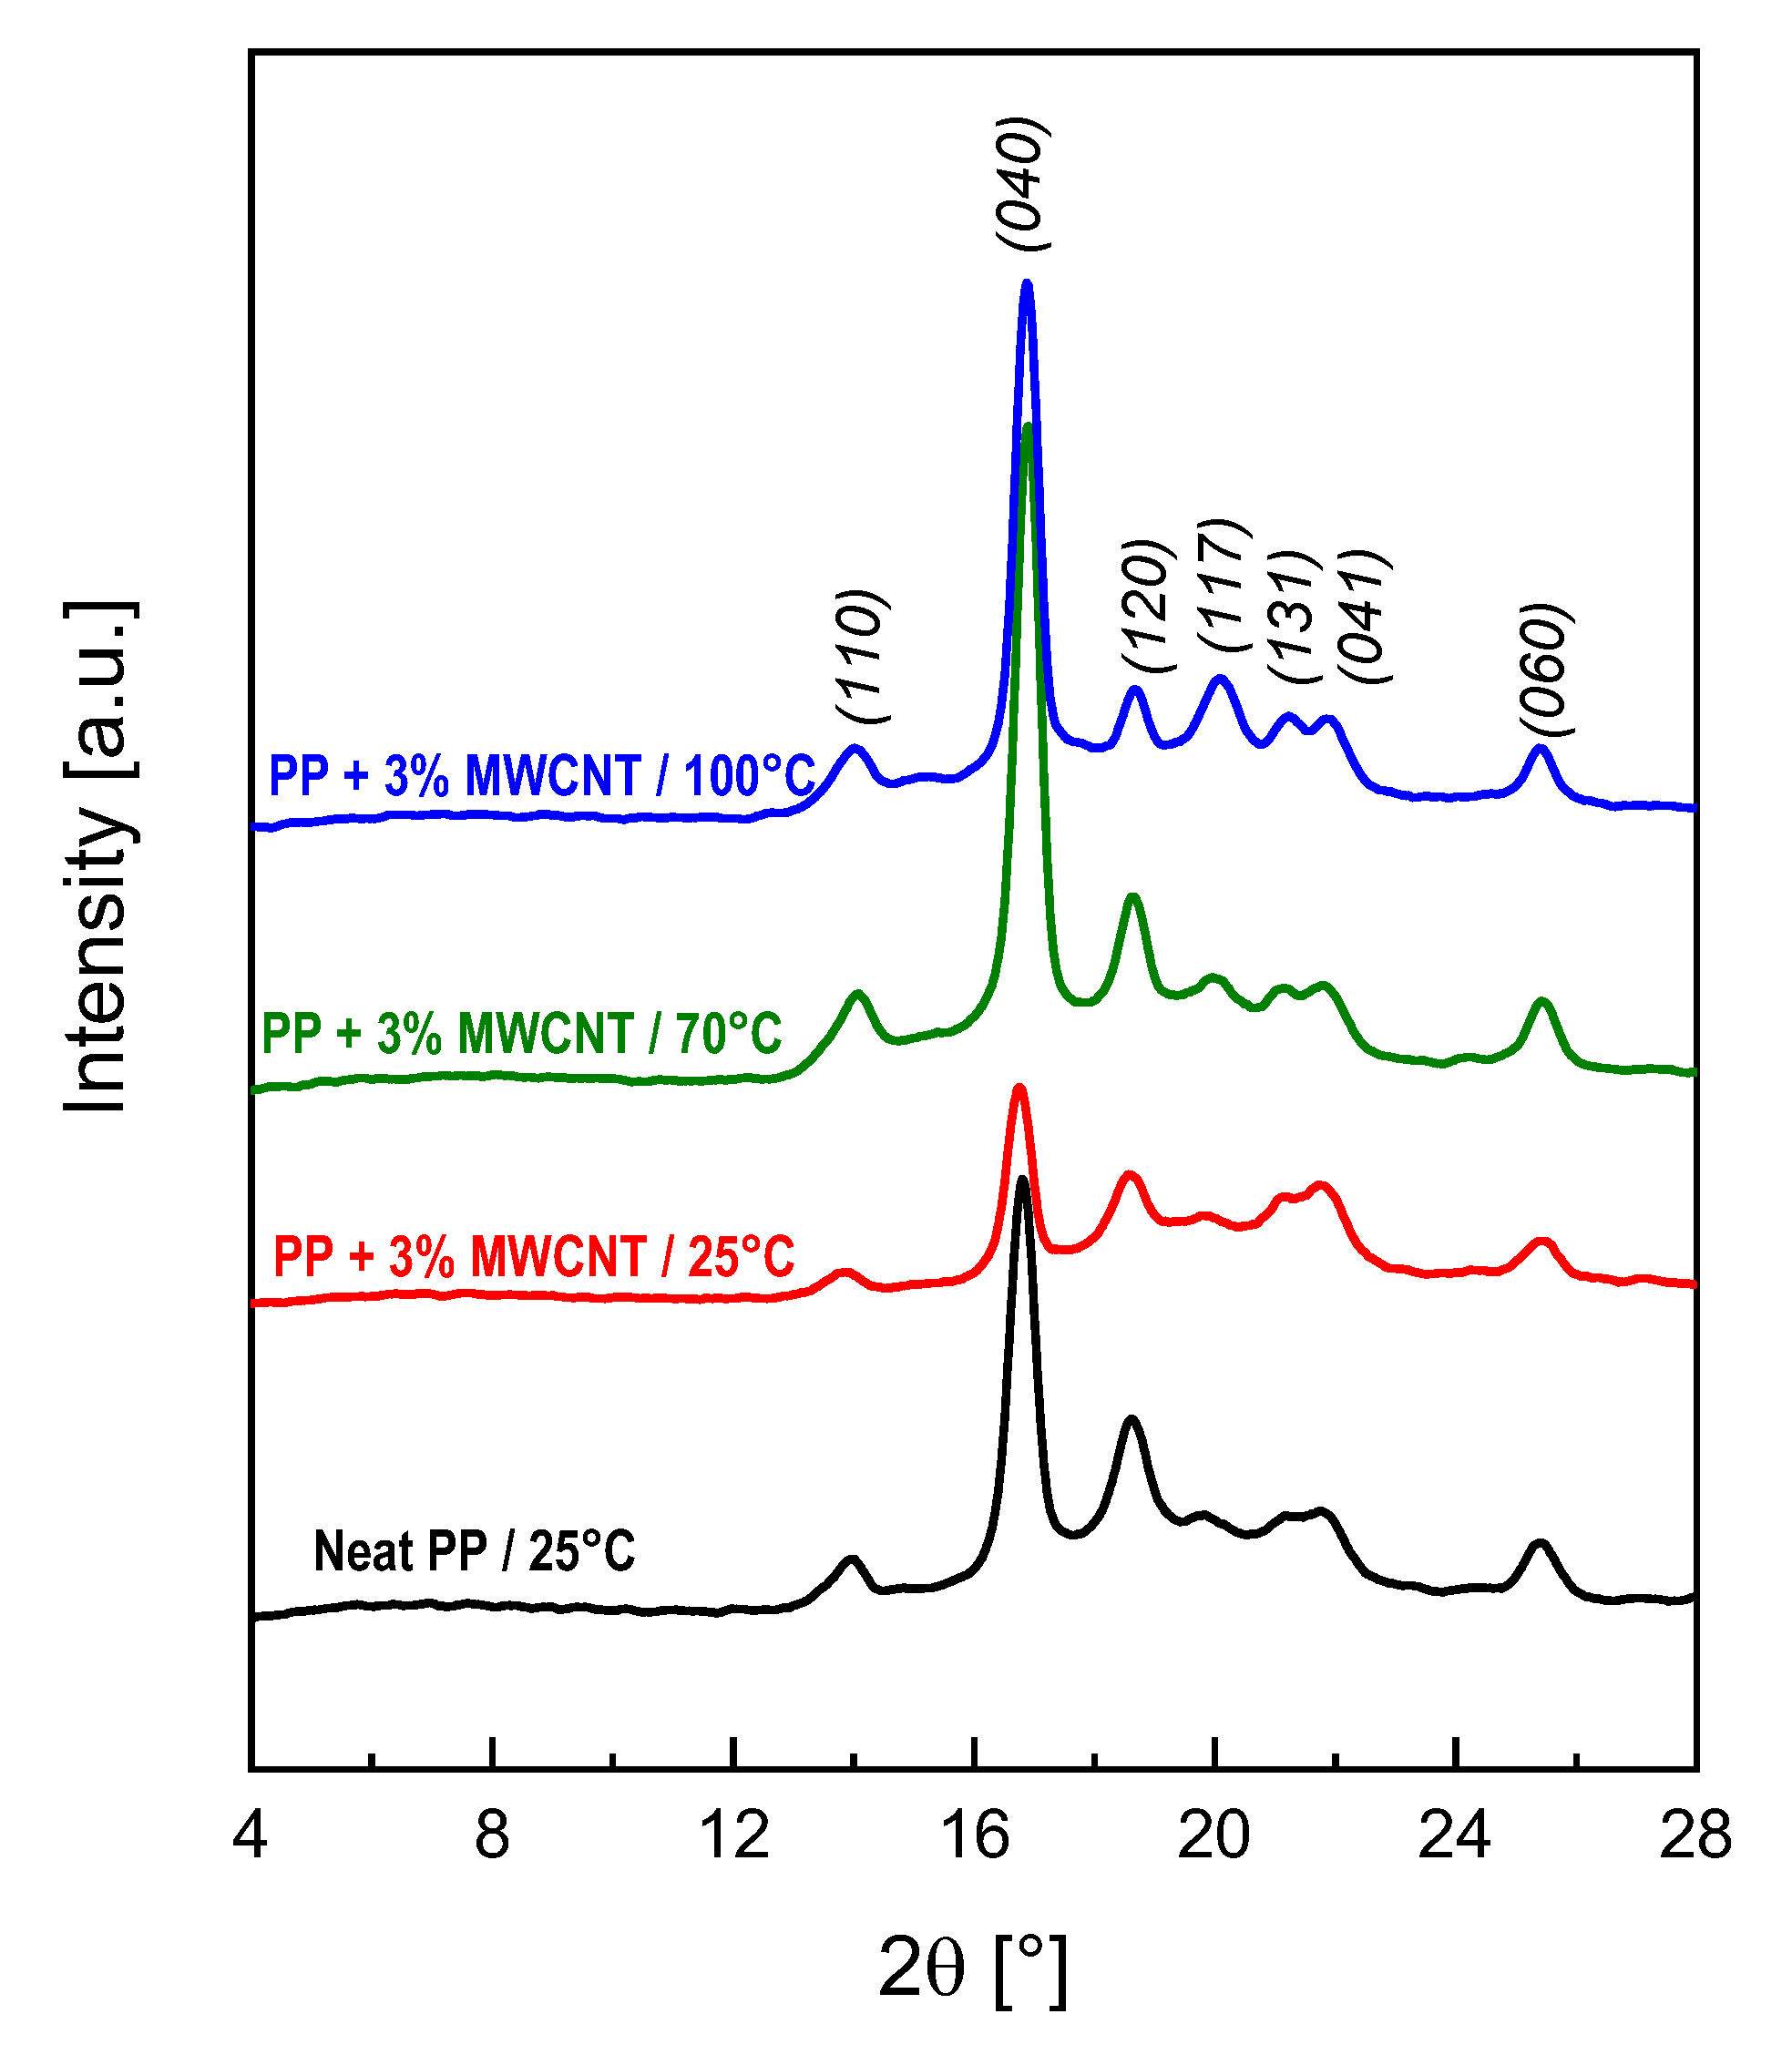
3.3.4. X-ray Diffraction (XRD)
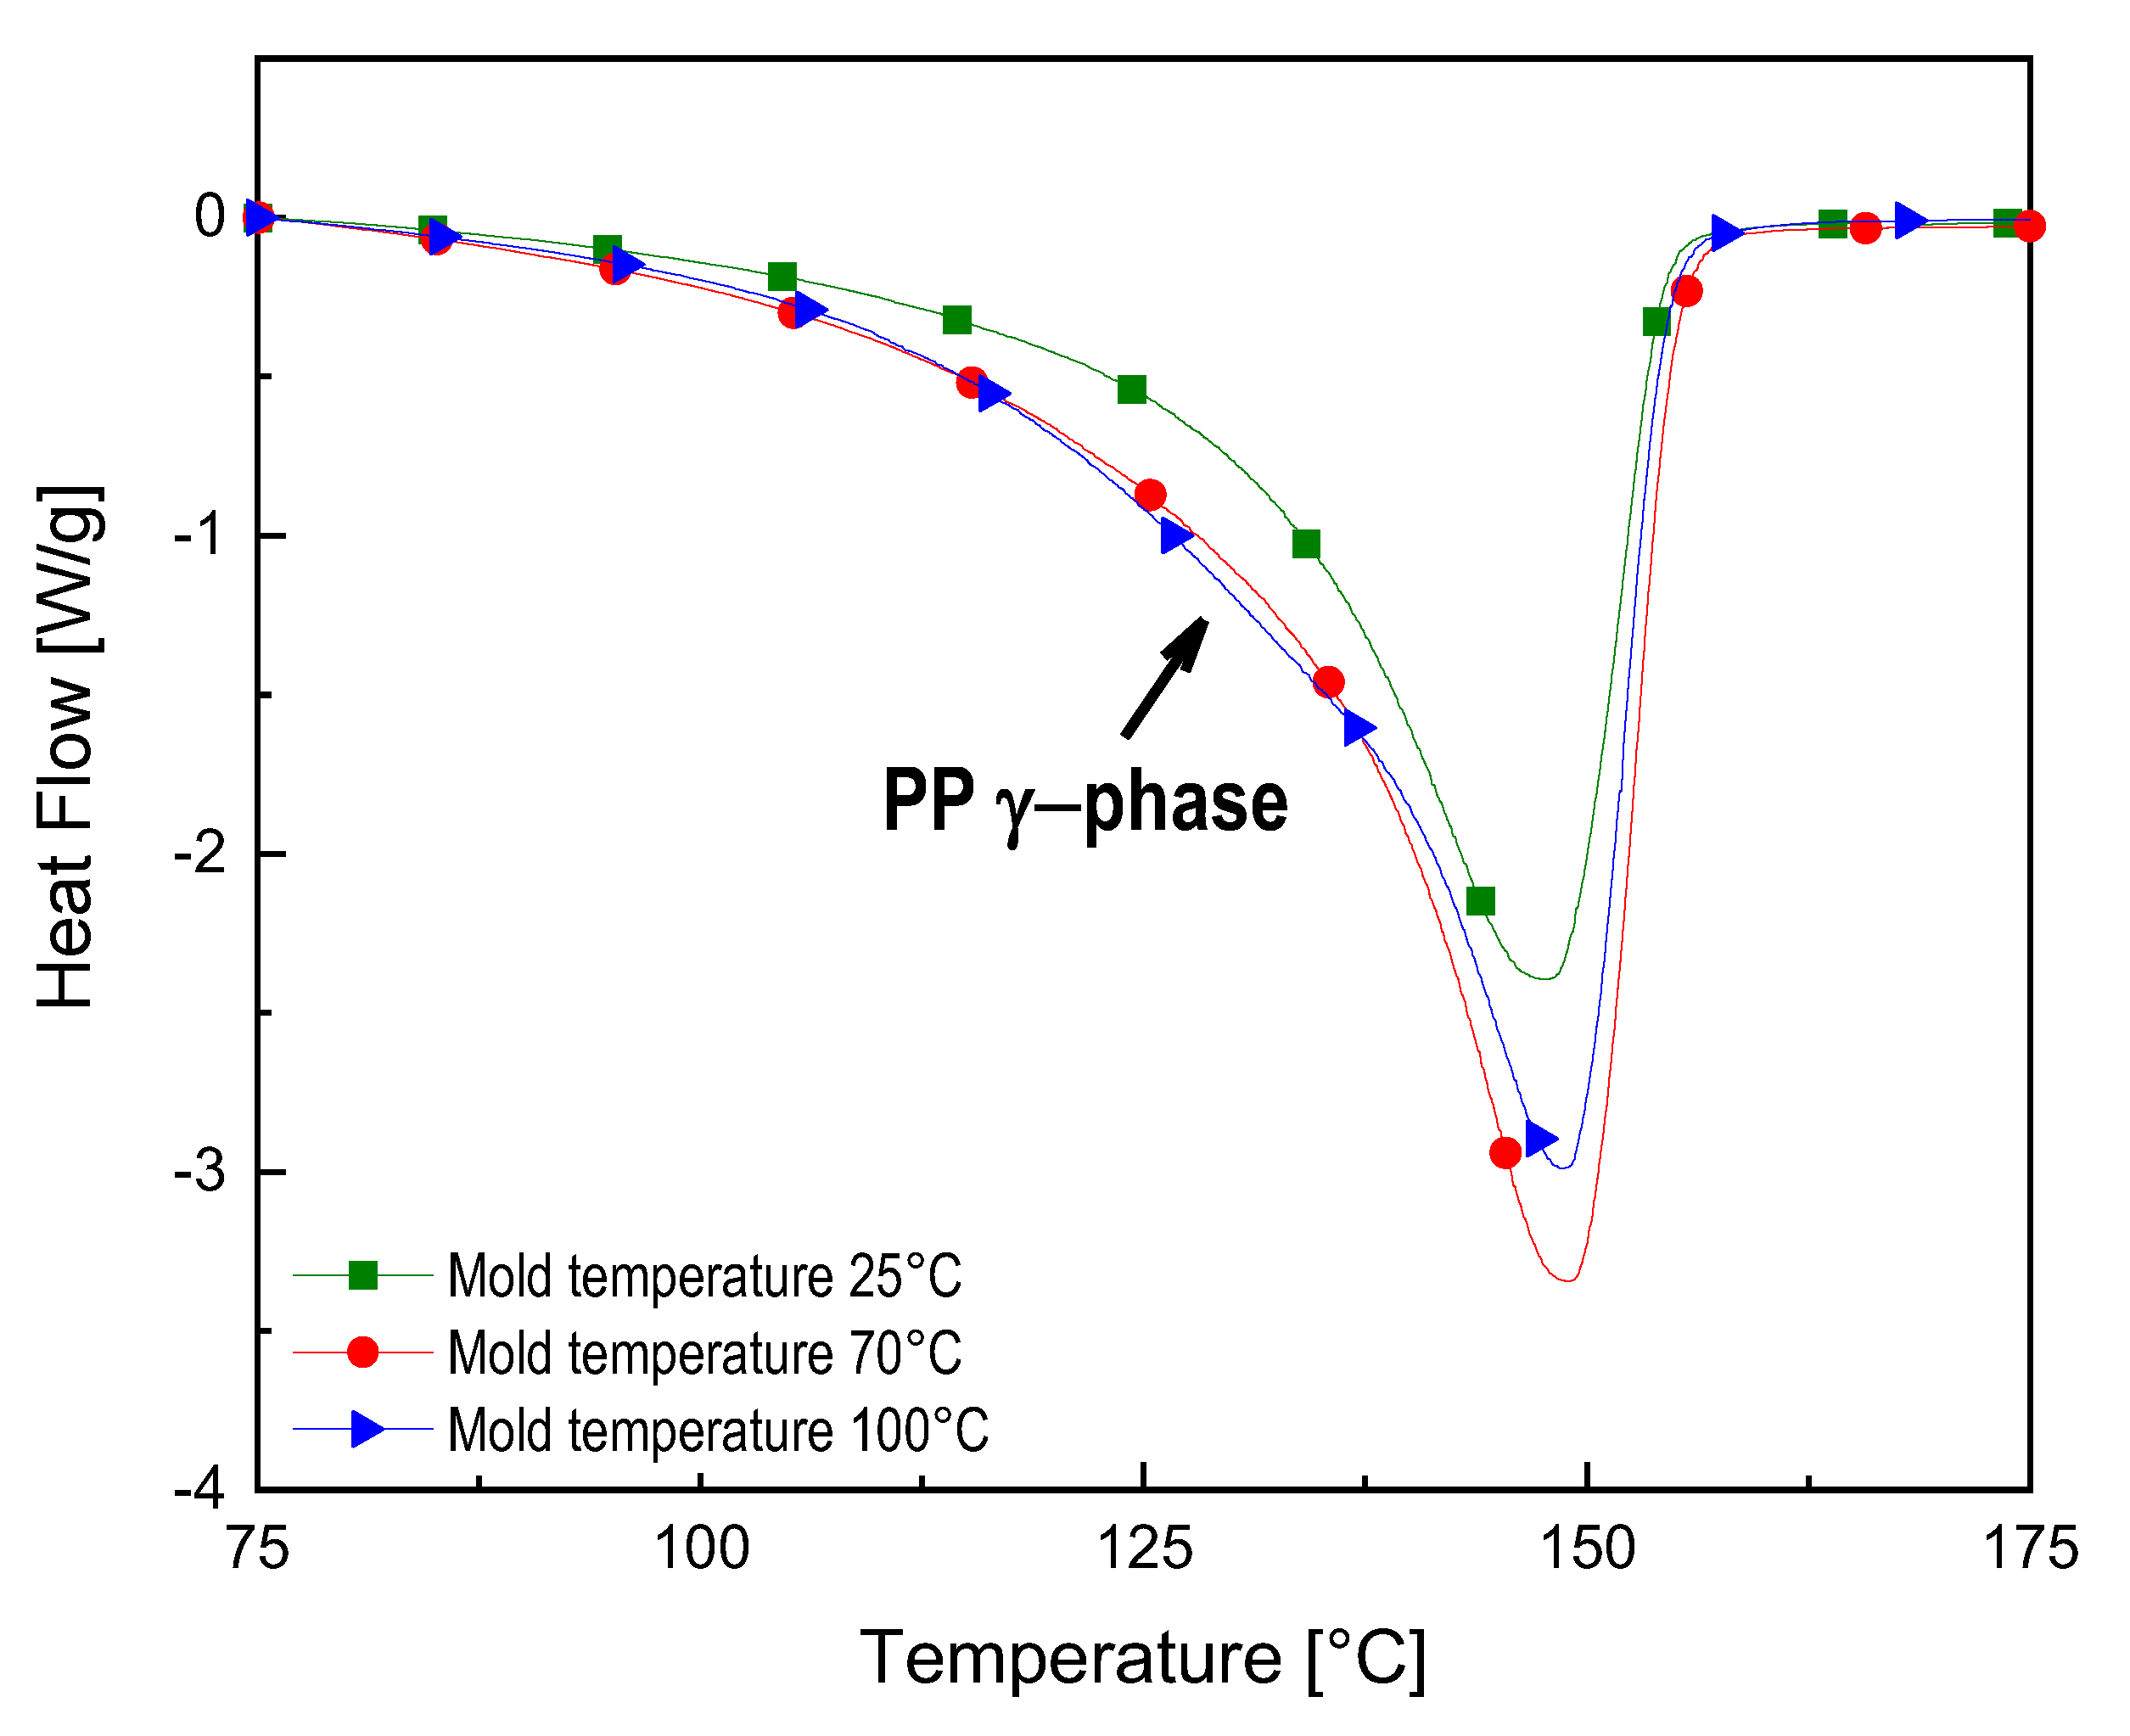
3.3.5. Differential Scanning Calorimetry (DSC)
4. Conclusions
Author Contributions
Funding
Conflicts of Interest
References
- Khan, A.; Jawaid, M.; Khan, A.A.P.; Asiri, A.M. (Eds.) Electrically Conductive Polymer and Polymer Composites: From Synthesis to Biomedical Applications; Wiley: New York, NY, USA, 2018. [Google Scholar]
- Tiwari, S.K.; Mishra, J.; Hatui, G.; Nayak, G.C. Conductive Polymer Composites Based on Carbon Nanomaterials. In Conducting Polymer Hybrids; Kumar, V., Kalia, S., Swart, H., Eds.; Springer International Publishing: Berlin, Germany, 2017; pp. 117–142. [Google Scholar]
- Mittal, G.; Dhand, V.; Rhee, K.Y.; Park, S.J.; Lee, W.R. Review: A review on carbon nanotubes and graphene as fillers in reinforced polymer nanocomposites. J. Ind. Eng. Chem. 2015, 21, 11–25. [Google Scholar] [CrossRef]
- Haznedar, G.; Cravanzola, S.; Zanetti, M.; Scarano, D.; Zecchina, A.; Cesano, F. Graphite nanoplatelets and carbon nanotubes based polyethylene composites: Electrical conductivity and morphology. Mater. Chem. Phys. 2013, 143, 47–52. [Google Scholar] [CrossRef]
- Wei, Z.; Dehghani, S.A.; Blackburn, R. Carbon based conductive polymer composites. J. Mater. Sci. 2007, 42, 3408–3418. [Google Scholar]
- Zaccone, M.; Armentano, I.; Torre, L.; Cesano, F.; Cravanzola, S.; Scarano, D.; Frache, A.; Monti, M. Morphology and electrical properties of injection-molded PP carbon-based nanocomposites. AIP Conf. Proc. 2017, 1914, 140006. [Google Scholar]
- Sanjinés, R.; Abad, M.D.; Vâju, C.; Smajda, R.; Mionić, M.; Magrez, A. Electrical properties and applications of carbon based nanocomposite materials: An overview. Surf. Coat. Technol. 2011, 206, 727–733. [Google Scholar]
- Fortunati, E.; D’Angelo, F.; Martino, S.; Orlacchio, A.; Kenny, J.M.; Armentano, I. Carbon nanotubes and silver nanoparticles for multifunctional conductive biopolymer composites. Carbon 2011, 49, 2370–2379. [Google Scholar] [CrossRef]
- Pande, S.; Chaudhary, A.; Patel, D.; Singh, B.P.; Mathur, R.B. Mechanical and electrical properties of multiwall carbon nanotube/polycarbonate composites for electrostatic discharge and electromagnetic interference shielding applications. RSC Adv. 2014, 4, 13839–13849. [Google Scholar] [CrossRef] [Green Version]
- Monti, M.; Natali, M.; Petrucci, R.; Kenny, J.M.; Torre, L. Carbon nanofibers for strain and impact damage sensing in glass fiber reinforced composites based on an unsaturated polyester resin. Polym. Compos. 2011, 32, 766–775. [Google Scholar] [CrossRef]
- Ma, L.-F.; Bao, R.-Y.; Dou, R.; Zheng, S.-D.; Liu, Z.-Y.; Zhang, R.-Y.; Yang, M.-B.; Yang, W. Conductive thermoplastic vulcanizates (TPVs) based on polypropylene (PP)/ethylene-propylene-diene rubber (EPDM) blend: From strain sensor to highly stretchable conductor. Compos. Sci. Technol. 2016, 128, 176–184. [Google Scholar] [CrossRef]
- Carbon Nanotubes (CNT) Market by Type (Single, Multi Walled), Method (Chemical Vapor Deposition, Catalytic Chemical Vapor Deposition, High Pressure Carbon Monoxide), Application (Electronics, Chemical, Batteries, Energy, Medical)—Global Forecast to 2023. In Carbon Nanotubes (CNT) Market Report; MarketsandMarkets: Pune, India, 2018; Available online: https://www.marketsandmarkets.com/Market-Reports/carbon-nanotubes-139.html (accessed on 28 June 2020).
- Sahoo, N.G.; Rana, S.; Cho, J.W.; Li, L.; Chan, S.H. Polymer nanocomposites based on functionalized carbon nanotubes. Prog. Polym. Sci. 2010, 35, 837–867. [Google Scholar] [CrossRef]
- Varela-Rizo, H.; Montes de Oca, G.; Rodriguez-Pastor, I.; Monti, M.; Terenzi, A.; Martin-Gullon, I. Analysis of the electrical and rheological behavior of different processed CNF/PMMA nanocomposites. Compos. Sci. Technol. 2012, 72, 218–224. [Google Scholar] [CrossRef]
- Müller, M.T.; Krause, B.; Kretzschmar, B.; Pötschke, P. Influence of feeding conditions in twin-screw extrusion of PP/MWCNT composites on electrical and mechanical properties. Compos. Sci. Technol. 2011, 71, 1535–1542. [Google Scholar] [CrossRef]
- Pegel, S.; Pötschke, P.; Petzold, G.; Alig, I.; Dudkin, S.M.; Lellinger, D. Dispersion, agglomeration, and network formation of multiwalled carbon nanotubes in polycarbonate melts. Polymer 2008, 49, 974–984. [Google Scholar] [CrossRef]
- Kasaliwal, G.; Göldel, A.; Pötschke, P. Influence of processing conditions in small-scale melt mixing and compression molding on the resistivity and morphology of polycarbonate—MWNT composites. J. Appl. Polym. Sci. 2009, 112, 3494–3509. [Google Scholar] [CrossRef]
- Wegrzyn, M.; Juan, S.; Benedito, A.; Gimenez, E. The influence of injection molding parameters on electrical properties of PC/ABS-MWCNT nanocomposites. J. Appl. Polym. Sci. 2013, 130, 2152–2158. [Google Scholar] [CrossRef]
- Hamanaka, S.; Yamashita, K.; Nonomura, C.; Nguyen Thi, T.B.; Wakano, T.; Yokoyama, A. Measurement of fiber orientation distribution in injection-molded composites with high filler content. AIP Conf. Proc. 2017, 1914, 140011. [Google Scholar]
- Li, Z.; Luo, G.; Zhou, W.; Wei, F. Skin-core microstructure and surface orientation of carbon nanotube composites by injection molding process. Solid State Phenom. 2008, 136, 51–56. [Google Scholar] [CrossRef]
- Cesano, F.; Zaccone, M.; Armentano, I.; Cravanzola, S.; Muscuso, L.; Torre, L.; Kenny, J.M.; Monti, M.; Scarano, D. Relationship between morphology and electrical properties in PP/MWCNT composites: Processing-induced anisotropic percolation threshold. Mater. Chem. Phys. 2016, 180, 284–290. [Google Scholar] [CrossRef]
- Tiusanen, J.; Vlasveld, D.; Vuorinen, J. Review on the effects of injection moulding parameters on the electrical resistivity of carbon nanotube filled polymer parts. Compos. Sci. Technol. 2012, 72, 1741–1752. [Google Scholar] [CrossRef]
- Villmow, T.; Pegel, S.; Pötschke, P.; Wagenknecht, U. Influence of injection molding parameters on the electrical resistivity of polycarbonate filled with multi-walled carbon nanotubes. Compos. Sci. Technol. 2008, 68, 777–789. [Google Scholar] [CrossRef]
- Chandra, A.; Kramschuster, A.J.; Hu, X.; Turng, L.-S. Effect of injection molding parameters on the electrical conductivity of polycarbonate/carbon nanotube nanocomposites. In Proceedings of the Annual Technical Conference: Plastics Encounter ANTEC, Cincinnati, OH, USA, 6–11 May 2007. [Google Scholar]
- Ameli, A.; Kazemi, Y.; Wang, S.; Park, C.B.; Pötschke, P. Process-microstructure-electrical conductivity relationships in injection-molded polypropylene/carbon nanotube nanocomposite foams. Compos. Part A 2017, 96, 28–36. [Google Scholar] [CrossRef]
- Versavaud, S.; Regnier, G.; Gouadec, G.; Vincent, M. Influence of injection molding on the electrical properties of polyamide 12 filled with multi-walled carbon nanotubes. Polymer 2014, 55, 6811–6818. [Google Scholar] [CrossRef] [Green Version]
- Von Baeckmann, C.; Wilhelm, H.; Spieckermann, F.; Strobel, S.; Polt, G.; Sowinski, P.; Piorkowska, E.; Bismarck, A.; Zehetbauer, M. The influence of crystallization conditions on the macromolecular structure and strength of γ-polypropylene. Thermochim. Acta 2019, 677, 131–138. [Google Scholar] [CrossRef]
- Thomann, R.; Wang, C.; Kressler, J.; Mulhaupt, R. On the γ-Phase of Isotactic Polypropylene. Macromolecules 1996, 29, 8425–8434. [Google Scholar] [CrossRef]
- Wang, S.-W.; Yang, W.; Bao, R.-Y.; Wang, B.; Xie, B.-H.; Yang, M.-B. The enhanced nucleating ability of carbon nanotube-supported β-nucleating agent in isotactic polypropylene. Colloid Polym. Sci. 2010, 288, 681–688. [Google Scholar] [CrossRef]
- Xu, D.; Wang, Z. Role of multi-wall carbon nanotube network in composites to crystallization of isotactic polypropylene matrix. Polymer 2008, 49, 330–338. [Google Scholar] [CrossRef]
- Kazemi, Y.; Ramezani Kakroodi, A.; Wang, S.; Ameli, A.; Filleter, T.; Potschke, P.; Park, C.B. Conductive network formation and destruction in polypropylene/carbon nanotube composites via crystal control using supercritical carbon dioxide. Polymer 2017, 129, 179–188. [Google Scholar] [CrossRef]
- Kalaitzidou, K.; Fukushima, H.; Askeland, P.; Drzal, L.T. The nucleating effect of exfoliated graphite nanoplatelets and their influence on the crystal structure and electrical conductivity of polypropylene nanocomposites. J. Mater. Sci. 2008, 43, 2895–2907. [Google Scholar] [CrossRef]
- Zhu, J.; Wei, S.; Li, Y.; Sun, L.; Haldolaarachchige, N.; Young, D.P.; Southworth, C.; Khasanov, A.; Luo, Z.; Guo, Z. Surfactant-Free Synthesized Magnetic Polypropylene Nanocomposites: Rheological, Electrical, Magnetic, and Thermal Properties. Macromolecules 2011, 44, 4382–4391. [Google Scholar] [CrossRef]
- Sui, G.; Jana, S.; Zhong, W.H.; Fuqua, M.A.; Ulven, C.A. Dielectric properties and conductivity of carbon nanofiber/semi-crystalline polymer composites. Acta Mater. 2008, 56, 2381–2388. [Google Scholar] [CrossRef]
- Wang, J.; Kazemi, Y.; Wang, S.; Hamidinejad, M.; Mahmud, M.B.; Pötschke, P.; Park, C.B. Enhancing the electrical conductivity of PP/CNT nanocomposites through crystal-induced volume exclusion effect with a slow cooling rate. Compos. Part. B 2020, 183, 107663. [Google Scholar] [CrossRef]
- Stauffer, D. Introduction of Percolation Theory; Taylor and Francis: London, UK, 1985. [Google Scholar]
- Kalaitzidou, K.; Fukushima, H.; Drzal, L.T. A Route for Polymer Nanocomposites with Engineered Electrical Conductivity and Percolation Threshold. Materials 2010, 3, 1089–1103. [Google Scholar] [CrossRef]
- Bauhofer, W.; Kovacs, J.Z. A review and analysis of electrical percolation in carbon nanotube polymer composites. Compos. Sci. Technol. 2009, 69, 1486–1498. [Google Scholar] [CrossRef]
- Monti, M.; Armentano, I.; Faiella, G.; Antonucci, V.; Kenny, J.M.; Torre, L.; Giordano, M. Toward the microstructure–properties relationship in MWCNT/epoxy composites: Percolation behavior and dielectric spectroscopy. Compos. Sci. Technol. 2014, 96, 38–46. [Google Scholar] [CrossRef]
- Chang, J.; Liang, G.; Gu, A.; Cai, S.; Yuan, L. The production of carbon nanotube/epoxy composites with a very high dielectric constant and low dielectric loss by microwave curing. Carbon 2012, 50, 689–698. [Google Scholar] [CrossRef]
- Elliott, S.R. A.c. conduction in amorphous chalcogenide and pnictide semiconductors. Adv. Phys. 1987, 2, 135. [Google Scholar] [CrossRef]
- Deng, H.; Lin, L.; Mizhi, J.; Zhang, S.; Yang, M.; Fu, Q. Review: Progress on the morphological control of conductive network in conductive polymer composites and the use as electroactive multifunctional materials. Prog. Polym. Sci. 2014, 39, 627–655. [Google Scholar] [CrossRef]
- Sherman, R.D.; Middleman, L.M.; Jacobs, S.M. Electron transport processes in conductor-filled polymers. Polym. Eng. Sci. 1983, 23, 36–46. [Google Scholar] [CrossRef]
- Vincent, M.; Giroud, T.; Clarke, A.; Eberhardt, C. Description and modeling of fiber orientation in injection molding of fiber reinforced thermoplastics. Polymer 2005, 46, 6719–6725. [Google Scholar] [CrossRef]
- Papathanasiou, T.D. Flow-Induced Alignment in Composite Materials; Papathanasiou, T.D., Guell, D.C., Eds.; Woodhead Publishing Ltd: Cambridge, UK, 1997; pp. 113–165. [Google Scholar]
- Sivanjineyulu, V.; Chang, Y.-H.; Chiu, F.-C. Characterization of carbon nanotube- and organoclay-filled polypropylene/poly(butylene succinate) blend-based nanocomposites with enhanced rigidity and electrical conductivity. J. Polym. Res. 2017, 24, 130. [Google Scholar] [CrossRef]
- Li, D.; Zhai, T.; Gong, Q.; Fei, G.; Xia, H. Effect of processing temperature on structure and properties of microinjection moulded thermoplastic polyurethane/multiwalled carbon nanotube composites. Plast. Rubber Compos. 2015, 44, 197. [Google Scholar] [CrossRef] [Green Version]
- Chrissafisa, K.; Bikiaris, D. Review: Can nanoparticles really enhance thermal stability of polymers? Part I: An overview on thermal decomposition of addition polymers. Thermochim. Acta 2011, 523, 1–24. [Google Scholar] [CrossRef]
- Seo, M.-K.; Park, S.-J. Electrical resistivity and rheological behaviors of carbon nanotubes-filled polypropylene composites. Chem. Phys. Lett. 2004, 395, 44–48. [Google Scholar] [CrossRef]
- Monti, M.; Terenzi, A.; Natali, M.; Gaztelumendi, I.; Markaide, N.; Kenny, J.M.; Torre, L. Development of unsaturated polyester matrix-carbon nanofibers nanocomposites with improved electrical properties. J. Appl. Polym. Sci. 2010, 117, 1658–1666. [Google Scholar] [CrossRef]
- Pötschke, P.; Mothes, F.; Krause, B.; Voit, B. Melt-Mixed PP/MWCNT Composites: Influence of CNT Incorporation Strategy and Matrix Viscosity on Filler Dispersion and Electrical Resistivity. Polymers 2019, 11, 189. [Google Scholar] [CrossRef] [PubMed] [Green Version]
- Cravanzola, S.; Haznedar, G.; Scarano, D.; Zecchina, A.; Cesano, F. Carbon-based piezoresistive polymer composites: Structure and electrical properties. Carbon 2013, 62, 270–277. [Google Scholar] [CrossRef]
- Sterzynski, T.; Lambla, M.; Crozier, H. Structure and properties of nucleated random and block copolymers of propylene. Adv. Polym. Technol. 1994, 13, 25–36. [Google Scholar] [CrossRef]
- Zhang, X.; Yan, X.; He, Q.; Wei, H.; Long, J.; Guo, J.; Gu, H.; Yu, J.; Liu, J.; Ding, D.; et al. Electrically Conductive Polypropylene Nanocomposites With Negative Permittivity at Low Carbon Nanotube Loading Levels. ACS Appl. Mater. Interfaces 2015, 7, 6125–6138. [Google Scholar] [CrossRef]
- Mezghani, K.; Phillips, P. The γ-phase of high molecular weight isotactic polypropylene: III. The equilibrium melting point and the phase diagram. J. Polymer 1998, 39, 3735–3744. [Google Scholar] [CrossRef]


| Mold Temperature | Xγ (%) |
|---|---|
| 25 °C | 14 |
| 70 °C | 18 |
| 100 °C | 54 |
| Mold Temperature | Xγ |
|---|---|
| 25 °C | 35.2 ± 1.3 |
| 70 °C | 34.8 ± 0.9 |
| 100 °C | 39.8 ± 1.1 |
© 2020 by the authors. Licensee MDPI, Basel, Switzerland. This article is an open access article distributed under the terms and conditions of the Creative Commons Attribution (CC BY) license (http://creativecommons.org/licenses/by/4.0/).
Share and Cite
Zaccone, M.; Armentano, I.; Cesano, F.; Scarano, D.; Frache, A.; Torre, L.; Monti, M. Effect of Injection Molding Conditions on Crystalline Structure and Electrical Resistivity of PP/MWCNT Nanocomposites. Polymers 2020, 12, 1685. https://doi.org/10.3390/polym12081685
Zaccone M, Armentano I, Cesano F, Scarano D, Frache A, Torre L, Monti M. Effect of Injection Molding Conditions on Crystalline Structure and Electrical Resistivity of PP/MWCNT Nanocomposites. Polymers. 2020; 12(8):1685. https://doi.org/10.3390/polym12081685
Chicago/Turabian StyleZaccone, Marta, Ilaria Armentano, Federico Cesano, Domenica Scarano, Alberto Frache, Luigi Torre, and Marco Monti. 2020. "Effect of Injection Molding Conditions on Crystalline Structure and Electrical Resistivity of PP/MWCNT Nanocomposites" Polymers 12, no. 8: 1685. https://doi.org/10.3390/polym12081685