Proceeding Paper

Fluorinated and Platinized Titania for Glycerol Oxidation †

1
Centro Conjunto de Investigación en Química Sustentable UAEM-UNAM, Carr. Toluca-Atlacomulco Km 14.5, Unidad San Cayetano, Toluca 50200, Mexico
2
Grupo de Catálisis, Escuela de Ciencias Químicas, Universidad Pedagógica y Tecnológica de Colombia UPTC, Avenida Central del Norte, Tunja 150003, Boyacá, Colombia
3
Grupo de Fisicoquímica Molecular y Modelamiento Computacional, Escuela de Ciencias Químicas, Universidad Pedagógica y Tecnológica de Colombia, Tunja 150003, Boyacá, Colombia
4
Instituto de Ciencia de Materiales de Sevilla (ICMS), Consejo Superior de Investigaciones Científicas CSIC—Universidad de Sevilla, Calle Américo Vespucio 49, 41092 Seville, Spain
*
Author to whom correspondence should be addressed.
Presented at the 2nd International Online-Conference on Nanomaterials, 15–30 November 2020; Available online: https://iocn2020.sciforum.net/.
Mater. Proc. 2021, 4(1), 37; https://doi.org/10.3390/IOCN2020-07792
Published: 10 November 2020
(This article belongs to the Proceedings of The 2nd International Online-Conference on Nanomaterials)

Abstract

:
In this work, catalysts based on TiO2 modified by fluorination and platinum addition were prepared and evaluated in glycerol oxidation. The materials were characterized by TEM, N2 physisorption, XRD, UV–Vis DRS, XRF and XPS. It was found that fluorination led to an increase in the surface area of TiO2, and by platinization treatment, it was possible to obtain a high absorption in the visible region of the electromagnetic spectrum. From these improved properties, 0.5 wt.% Pt-F-TiO2 was prepared as the best catalyst for the obtention of the highest yield and selectivity towards glyceraldehyde (GAL). It was also observed that the increase in Pt content had a detrimental effect on the effectiveness of fluorinated titania in the glycerol conversion. The fluorination and platinum addition modify some physicochemical properties of TiO2, thus also modifying the reaction mechanism and selectivity during glycerol oxidation.

1. Introduction

Glycerol is the structural component of many lipids and is also the main by-product in the biodiesel industry. Due to the rapid growth of worldwide biodiesel production, high amounts of glycerol are generated, and therefore, it is necessary to develop innovative applications to utilize the excess of glycerol.
The chemical structure of glycerol, composed of two primary hydroxyl groups and one secondary hydroxyl group, makes glycerol a versatile platform for the preparation of value-added compounds. Pagliaro et al. described several studies on this topic, reporting the successful production of 1,3-dihydroxyacetone and hydroxypyruvic acid via glycerol oxidation and the enhancement of the performance of cement by bioglycerol addition [1,2]. Kenar [3] reported that glycerol oxidation is a promising reaction for obtaining different organic compounds; however, it is rather difficult to control the partial oxidation of glycerol. In order to improve that reaction, a number of metallic catalysts have been evaluated, and currently, the main catalysts of interest appear to focus on carbon-supported platinum, palladium or gold; bimetallic catalysts such as Au-Pd and Au-Pt have also been studied [4]. As a result, a wide range of activities and selectivities to glyceric acid, dihydroxyacetone, tartronic acid and hydroxypyruvic acid have been reported, mainly using aqueous glycerol solutions as raw material [5]. These results depend on catalytic particle size and on the experimental conditions. Many reports have shown that Au-based catalysts are selective towards the primary hydroxyls, and the highest selectivity towards glyceric acid was found by using a 1 wt.% Au (5–50 nm)/graphite catalyst [6].
For several decades, photocatalysis has been widely recognized and used in different fields as an eco-friendly process. In this sense, TiO2 is a well-known photocatalyst because of its chemical and photochemical stability, biological inertness, strong oxidizing power and low cost [7,8,9,10]; however, TiO2 has several drawbacks in terms of electron–hole recombination, visible light inactivity and limited surface area [11]. Thus, in order to improve the photocatalytic and physicochemical properties of titania, some modifications of this semiconductor are very necessary. Among such modifications, metal doping is an effective approach, and Pt, Au, Pd, Ni, Cu and Ag are able to act as electron trappers to prevent electron–hole recombination, thus enhancing TiO2 photocatalytic efficiency. Moreover, fluorination and sulfation are suitable treatments for the improvement of the physicochemical properties of TiO2. These treatments lead to increases in the specific surface area and the absorption of TiO2 in the visible region of the electromagnetic spectrum [7,12,13].
On the other hand, another important drawback of titania is its difficult recovery after heterogeneous photocatalytic reactions, which is mainly due to the small particle size of this oxide [14]. Many researchers focused on the study of different alternatives for the photocatalytic material recovery, and some of the most commonly employed methods to solve this problem are filtration and TiO2 immobilization over glass, Raschig rings, silica, stainless steel plates and clay minerals [14,15,16].
The aim of the present study was to improve the strong oxidizing power of TiO2 via fluorination and incorporation of platinum for the glycerol oxidation reaction. The catalysts were characterized in terms of physical properties and in operational conditions.

2. Materials and Methods

2.1. Catalyst Preparation

Different series of catalysts were prepared by TiO2 modification, and the typical procedure employed is described in the subsections below.

2.1.1. Lab-Prepared TiO2

TiO2 was prepared by hydrolysis of 200 mL of titanium tetraisopropoxide (Aldrich, 97%) in isopropanol solution (1.6 M) by the slow addition of distilled water (isopropanol/water 1:1, v/v). The powder obtained by sol–gel method was labeled as sg-TiO2 and was recovered by filtration, drying at 110 °C overnight and calcination at 650 °C for 2 h at a 4 °C/min heating rate.
Commercial TiO2 P25 Evonik (TiO2 (C)) was used as the reference material with no additional pretreatment.

2.1.2. Fluorinated TiO2

sg-TiO2 material was pretreated by fluorination procedure to obtain fluorinated TiO2 (F-TiO2), and this material was prepared by using an aqueous suspension of fresh sg-TiO2 (2 g) in 1 L of 10 mM NaF. In order to maximize the fluoride adsorption, the pH was adjusted to 3 by using a 1 M HCl solution [12,13]; this suspension was stirred for 1 h in the dark. After fluorination, the powders were recovered by filtration, dried and calcined at 650 °C for 2 h at a 4 °C/min heating rate.

2.1.3. Platinum Nanoparticle Photodeposition

Platinum (Pt) photodeposition over the calcined F-TiO2 powders was carried out by using hexachloroplatinic acid (H2PtCl6, Aldrich 99.9%) as a metal source. Firstly, a suspension of the F-TiO2 sample in distilled water containing 0.3 M of isopropanol (Merck 99.8%) as electron donor was prepared. This suspension also contained the appropriate amount of metal precursor to obtain nominal platinum loading of 0.5 and 2 wt.% total of TiO2. Pt photodeposition was then performed under continuous N2 flux (0.90 L/h) by illuminating the suspension for 120 min. Light intensity on the suspensions was 60 W/m2, as determined by a Delta OHM HD2102.1 photo-radiometer. An Osram Ultra-Vitalux lamp (300 W), which possesses a sun-like radiation spectrum with a main emission line in the UVA range at 365 nm, was used as the light source. After photodeposition, the powders were recovered by filtration and dried at 110 °C for 12 h. The catalysts thus obtained were labeled as 0.5 Pt-F-TiO2 and 2 Pt-F-TiO2.

2.2. Catalyst Characterization

Platinum particle sizes and morphology were evaluated by transmission electron microscopy (TEM) in a Philips CM 200 microscope. For these analyses, the samples were dispersed by sonication in ethanol and dropped on a carbon grid. The metal particle average diameter (d) was determined by counting particles in a high number of TEM images from different places of the samples. The following equation was used:
( d ¯   nm ) = di × fi
where di is the diameter of the ni counted particles and fi is the particle size distribution estimated by
fi = ni/(∑ni)
where ni is the number of particles of diameter di.
Specific surface area (SBET) measurements were carried out by using low-temperature nitrogen adsorption in a Micromeritics ASAP2010 instrument. For this analysis, the degasification of the samples was performed at 150 °C.
XRD analyses were performed on a Siemens D-501 diffractometer with a Ni filter and graphite monochromator using Cu Kα radiation. Anatase crystallite sizes were calculated from the line broadening of the main anatase XRD peak (101) by using the Scherrer equation. Peaks were fitted by using a Voigt function.
In order to analyze the light absorption properties of the catalysts, these materials were evaluated by UV–Vis spectrophotometry. The UV–Vis DR spectra were recorded on a Varian spectrometer model Cary 100 equipped with an integrating sphere, using BaSO4 as reference. Band-gap values of the samples were calculated by using the Kubelka–Munk functions, F(R∞), which are proportional to the absorption of radiation by plotting (F(R∞) × hv)1/2 against hv [17].
The total Pt content and chemical composition of the catalysts synthesized were determined by X-ray fluorescence (XRF) in a PANalytical Axios sequential spectrophotometer equipped with a rhodium tube as the source of radiation. XRF measurements were performed on pressed pellets (sample included in 10 wt.% of wax).
X-ray photoelectron spectroscopy (XPS) studies were also carried out by using a Leybold–Heraeus LHS-10 spectrometer, working with a constant pass energy of 50 eV. The spectrometer main chamber worked at <2 × 10⁻⁹ torr; this instrument includes an EA-200MCD hemispherical electron analyzer with a dual X-ray source working with Al Kα (hv = 1486.6 eV) at 120 W and 30 mA. Before the XPS analyses, the samples were outgassed in the prechamber of the instrument at 150 °C up to a pressure <2 × 10⁻⁸ torr to remove chemisorbed water. C 1s signal (284.6 eV) was used as internal energy reference in all the experiments.

2.3. Catalytic Tests

All catalysts were tested in glycerol oxidation by using an experimental setup consisting of an open glass cylindrical reactor (2 cm id, 20 cm height) fitted with a cooling jacket. An 8 W lamp provided the UV light with the main emission at 254 nm, which was set inside the reactor; the energy source was a UVP PS-1 of 115 V/60 Hz and 40 A. In order to guarantee the continuous stirring and the homogeneity of the reaction mixture, a stirrer plate (Thermo Scientific) was set under the reactor. All these trials were carried out in batch mode. The bare and modified catalysts assessed, namely TiO2(C), sg-TiO2, F-TiO2, 0.5 Pt-F-TiO2 and 2 Pt-F-TiO2, were immersed in 100 mL of an aqueous glycerol (J.T. Baker, 99.7%) solution (100 mM). For the glycerol oxidation reaction, natural room oxygen was employed, and the operational parameters evaluated were as follows: platinum loading (0.5 and 2 wt.%) and catalyst amount (10, 30 and 40 mg). Catalytic reactions were carried out at outside room temperature with an average value of 19 °C and at starting pH value of 7.8. Blank tests without catalyst powders were also performed. In order to ensure the reproducibility of the results, all the reactions were performed in duplicate.
At the end of the reaction cycle, the catalytic materials were recovered by filtration (0.45 µm filter); this procedure allowed us to recover 90% of the catalyst employed at the starting time of the glycerol oxidation reaction.

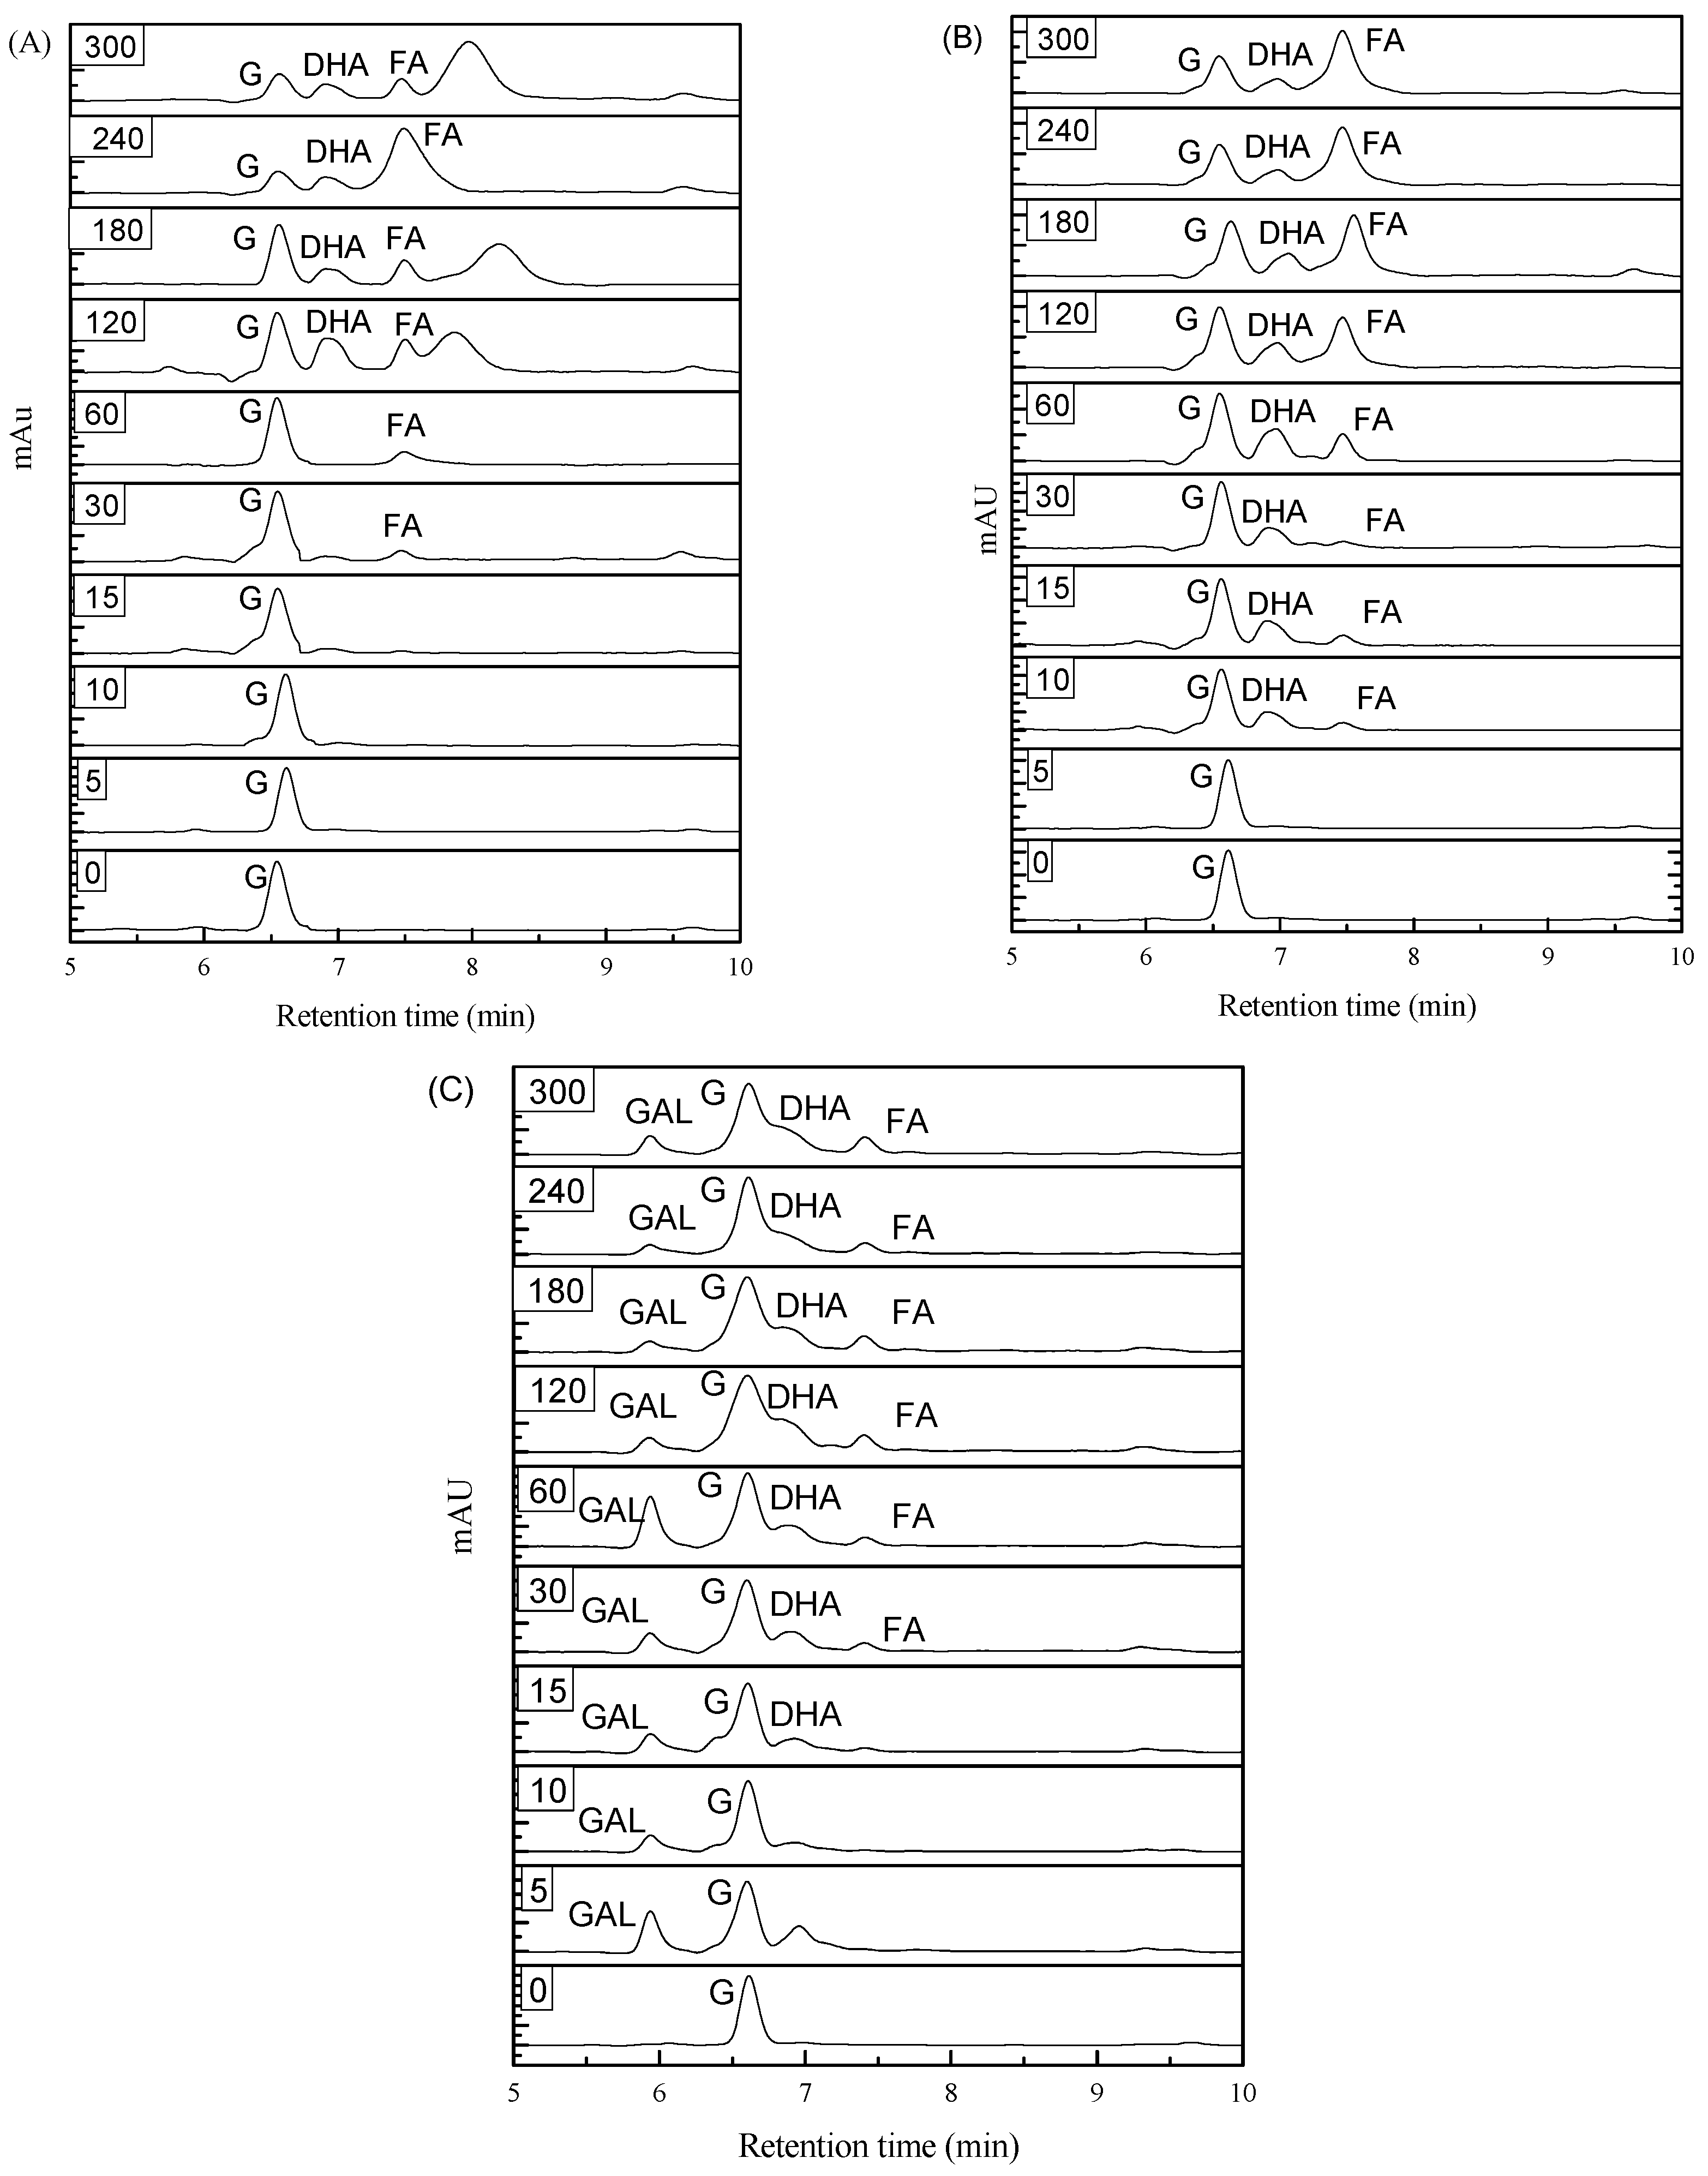
2.4. Oxidation Product Analysis

At selected times (0, 5, 10, 15, 30, 60, 120, 180, 240 and 300 min), 1.5 mL of sample was withdrawn from the liquid phase. In order to recover the catalytic materials, these samples were firstly filtered by using Sartorius Biolab filters with a pore size of 0.45 µm and further analyzed by high-performance liquid chromatography (HPLC) and in terms of total organic carbon (TOC). For HPLC analysis, 20 L of samples filtered by using Nylon Acrodisc Syringe Filters (diameter 25 mm and pore size of 45 μm) was injected and then measured in a SHIMADZU Model LC-2030 chromatograph. For these analyses, the following experimental conditions were employed: UV 210 nm detector, SiliaChrom SB C18 column (250 mm length × 5 mm internal diameter × 5 μm film thickness), 45 °C, H2SO4 (aq) 0.01 mM as mobile phase, total flow of 0.5 mL/min and total elution time of 10 min.
Aqueous solutions of glycerol (G) (J.T. Baker, 99.7%), glyceraldehyde (GAL) (Sigma-Aldrich, >90%), dihydroxyacetone (DHA) (Sigma-Aldrich, 97%), glycolic acid (GA) (Sigma-Aldrich, 70 wt.% in water) and formic acid (FA) (Honeywell, >98%) were employed as HPLC standards. In order to determine the concentration of these compounds, integration of the data was performed by using Prominence I SHIMADZU LabSolutions software. Robustness, precision and accuracy studies were also carried out. From these studies, it was possible to calculate a coefficient of variation of lower than 2%, showing the reliability of the measurements. Other parameters such as conversion, yield and selectivity were also determined by using the following equations:
Conversion (%) = (Initial concentration of Glycerol − Final concentration of Glycerol)/(Initial concentration of Glycerol) × 100
Yield (%) = (Product concentration)/(Initial concentration of Glycerol) × 100
Selectivity (%) = Yield/(Glycerol conversion) × 100
For TOC analysis, 100 L of filtered samples was measured in an Analytikjena Multi N/C 2100/1 instrument, using a furnace temperature of 750 °C. Three measurements were performed for each sample and the average value was considered. Catalyst recycling experiments were not performed, mainly due to the low catalyst loading employed in our work (10, 30 or 40 mg); the loss of almost 10% of catalytic material in each test makes such experiments nonviable. However, this analysis would be an interesting area for further research.

3. Results and Discussion

The present work describes an attempt to improve the catalytic activity of TiO2 via combined fluorination and platinization for the selective oxidation of glycerol. The main results obtained from catalyst characterization and catalytic activity measurement are described in this section.

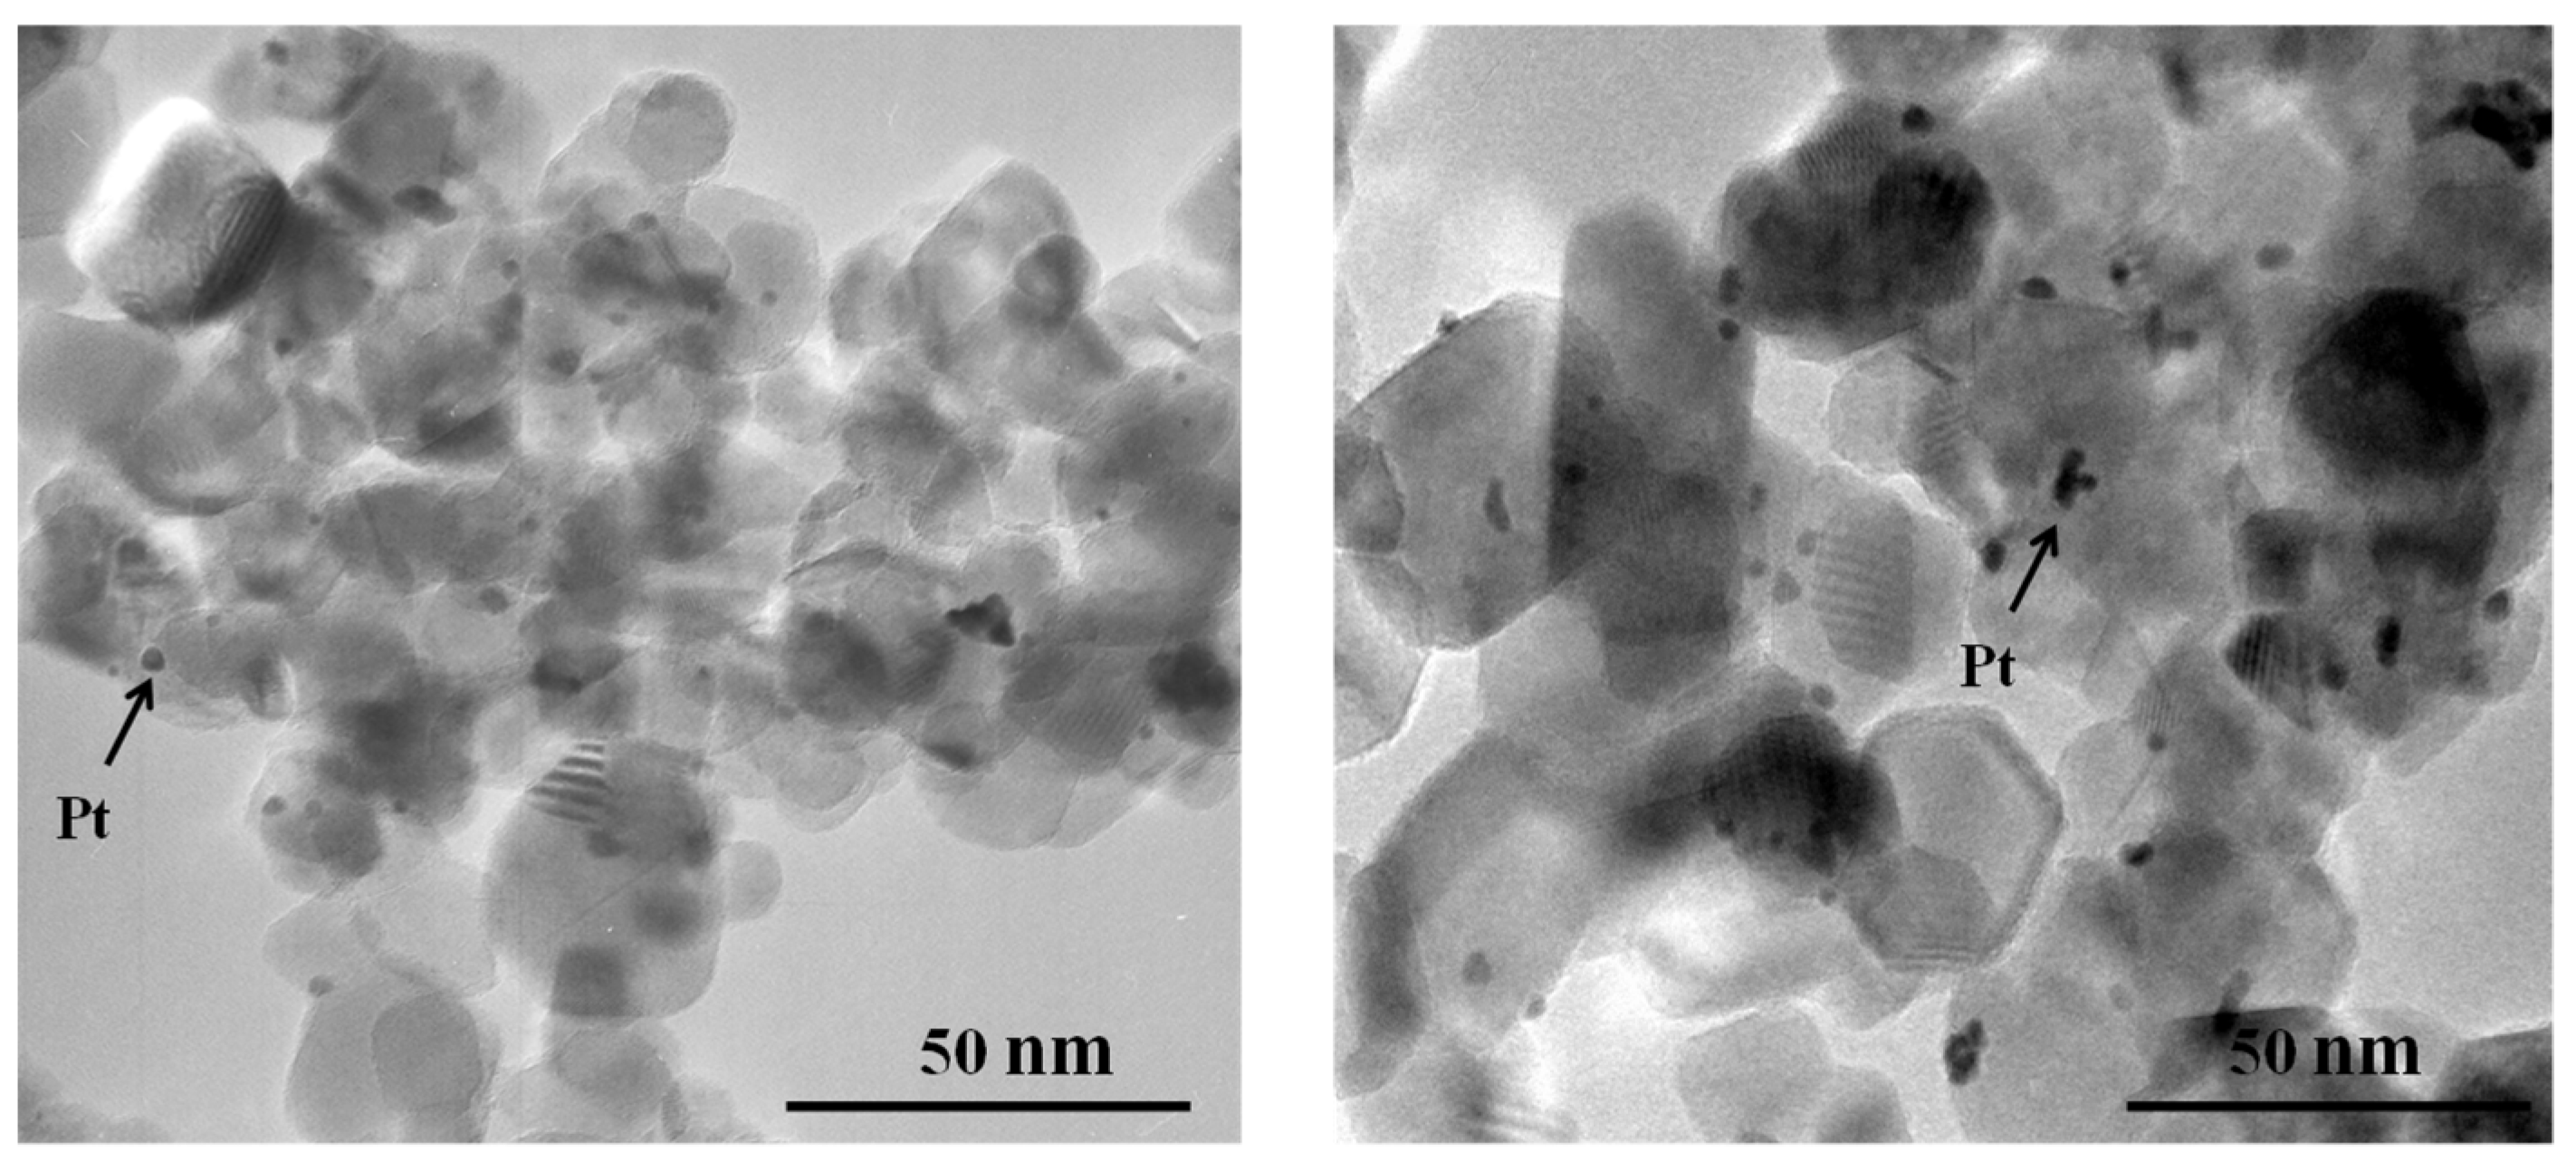
3.1. Platinum Particle Size

The morphology and Pt particle size distribution of the Pt-F-TiO2 catalysts were analyzed by TEM, and selected images are presented in Figure 1. As can be observed, the platinum particles (small black spots) appear heterogeneously distributed on the titania surface, with an average particle size of 6 nm for 0.5 Pt-F-TiO2. The Pt particle size slightly increased with the platinum loading; thus, for the 2 Pt-F-TiO2 photocatalyst, Pt particles over 7 nm were observed. As can also be observed in Figure 1, the Pt nanoparticles in the 2 Pt-F-TiO2 sample presented a higher degree of aggregation when compared to the 0.5 Pt-F-TiO2 counterpart.

3.2. Specific Surface Area

Table 1 summarizes the main physical characterization results for the commercial and lab-prepared catalysts. Firstly, it is possible to observe an important difference between the specific surface area (SBET) values in all the catalysts. The lowest value corresponds to 11 m2/g in the sg-TiO2 sample; this is mainly due to the titania particles sintering during the calcination process used in the preparation of this material at the lab. After fluorination, the SBET value considerably increased, reaching almost the same SBET value when compared to the commercial titania (i.e., 51 m2/g). This result shows the protective effect of the fluorine ions over the surface area of TiO2 at high temperature [8]. After platinum addition, it was observed that the specific surface area of fluorinated titania (F-TiO2) slightly decreased, which can be attributed to the obstruction of titania surface as a result of the presence of platinum nanoparticles; this effect was less pronounced in the material prepared with the highest Pt loading, which can be explained by taking into account that, as was observed by TEM analyses previously described, the Pt particles present high size and high agglomeration degree, thus leading to less obstruction of F-TiO2 surface in comparison with the material prepared with low Pt content where a major number of metal nanoparticles of low size are covering the fluorinated titania.

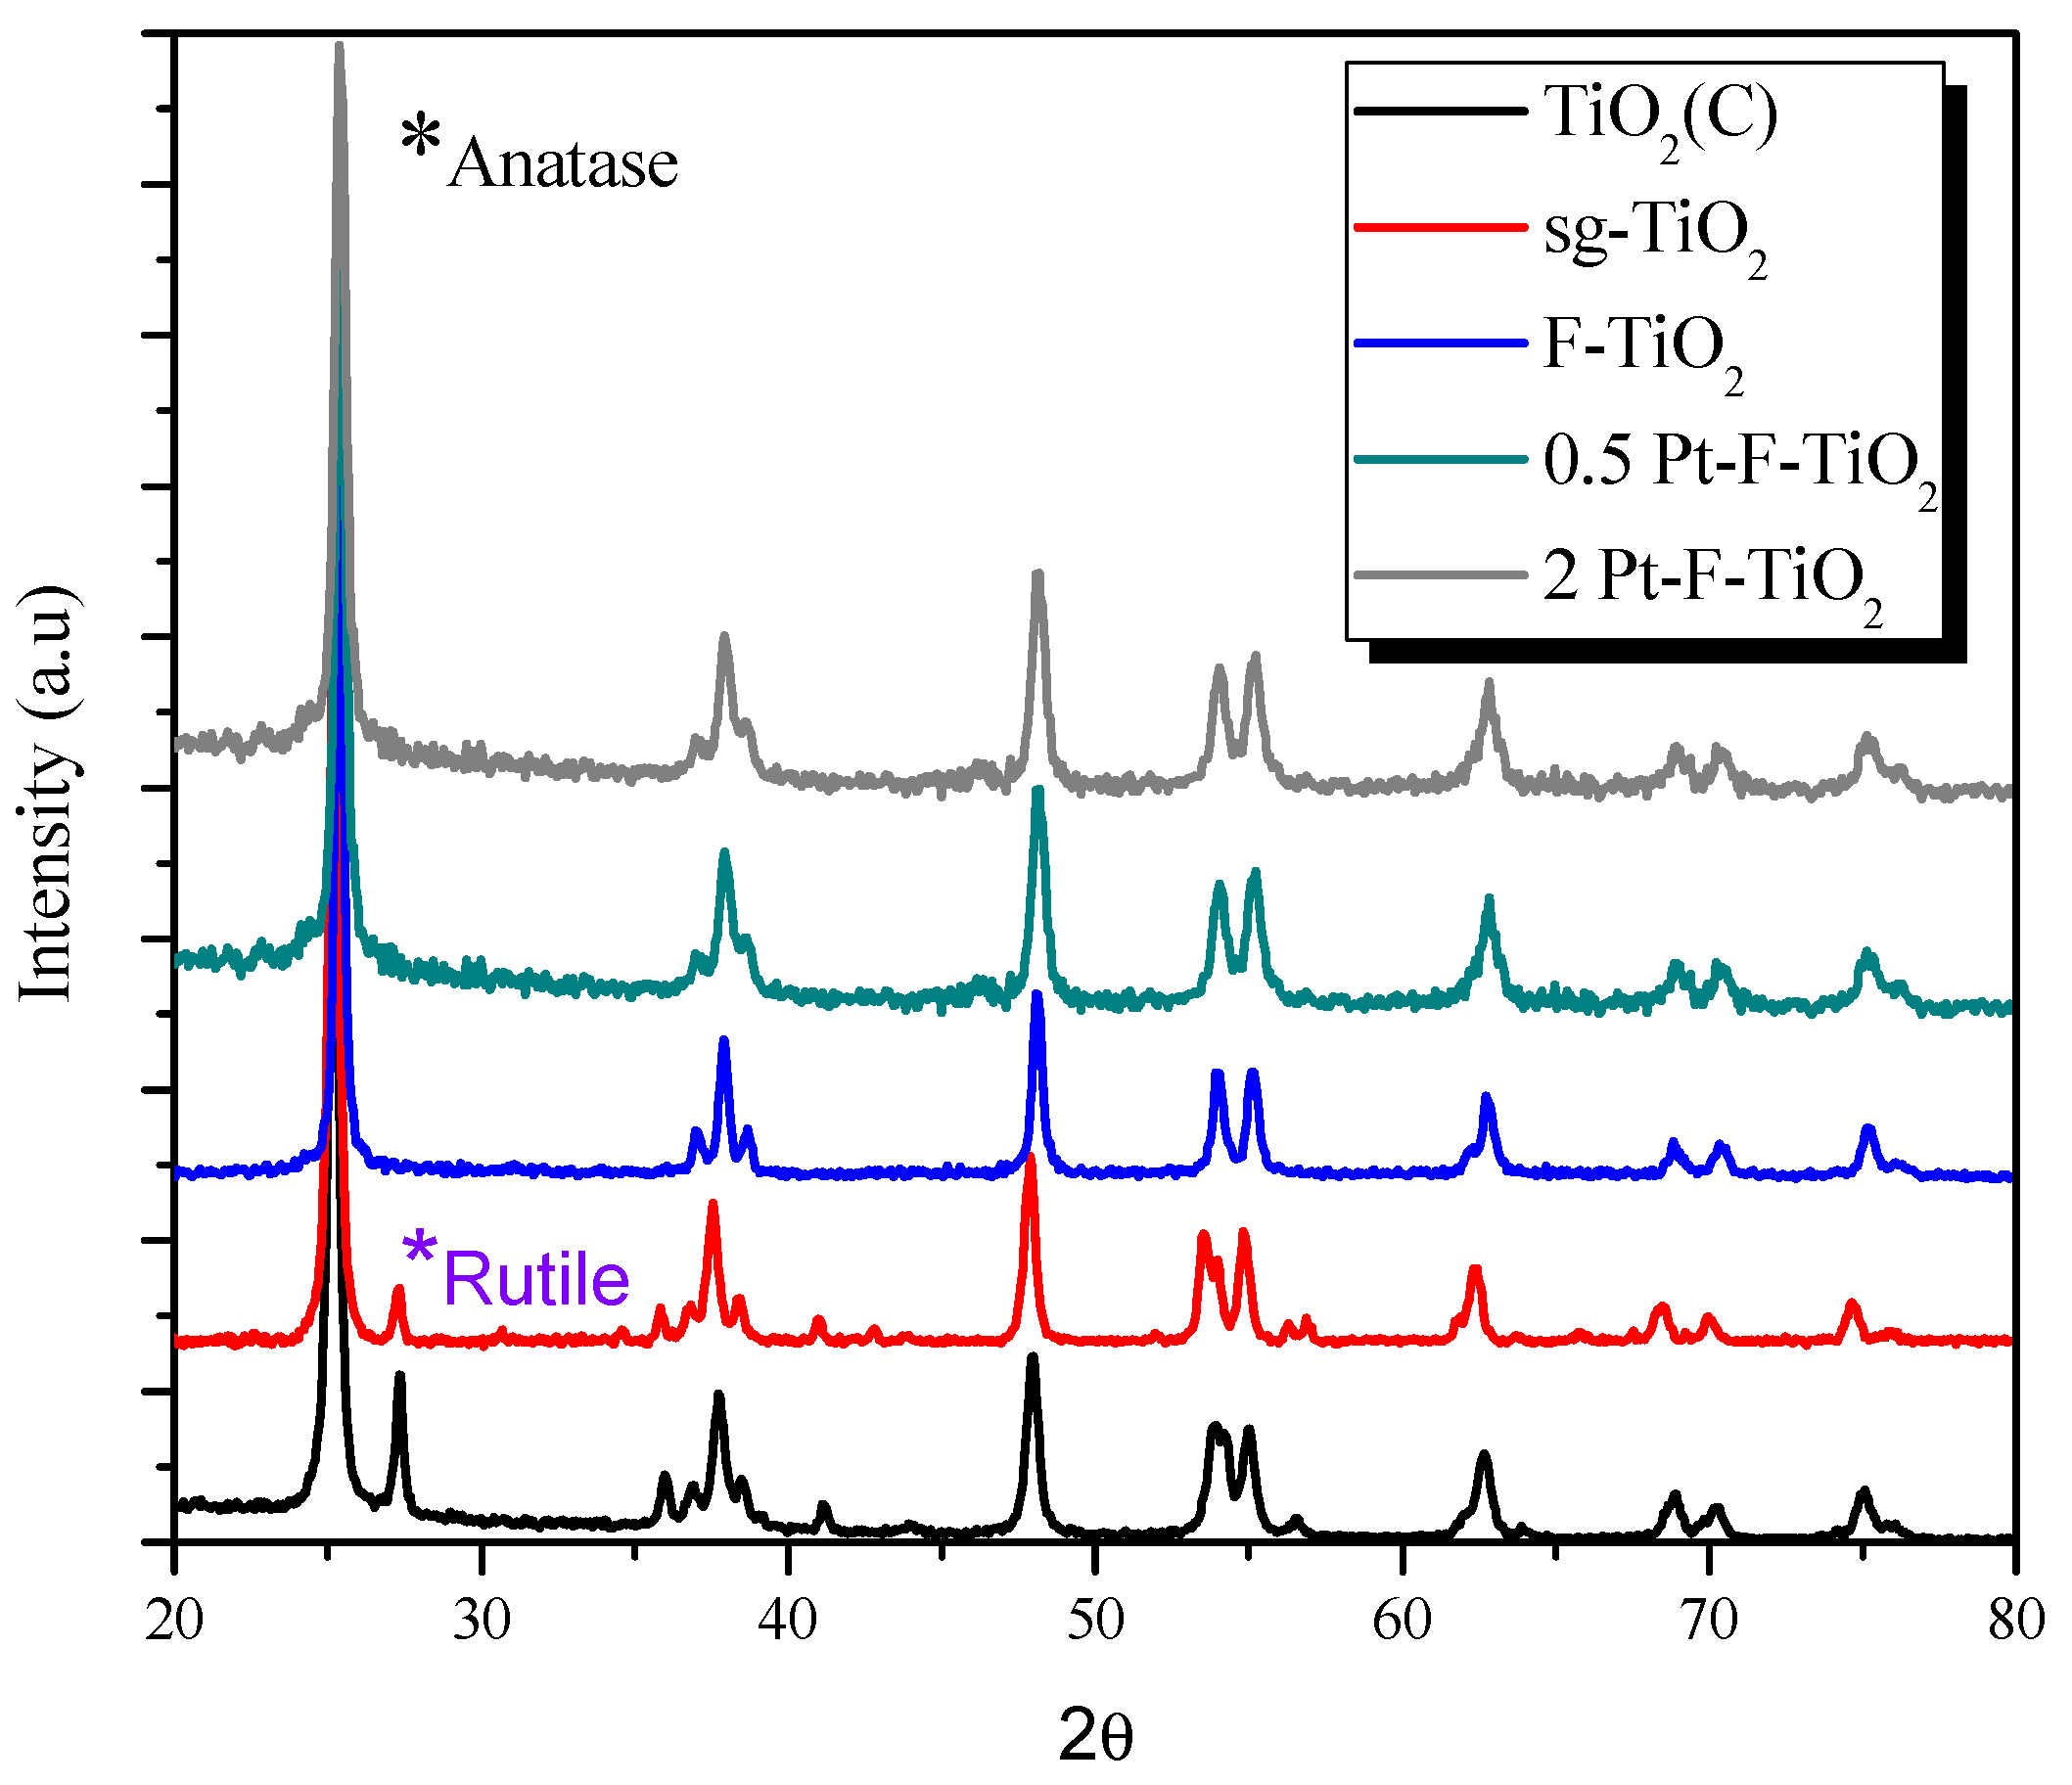
3.3. Crystalline Phase Composition

The catalysts were also analyzed by XRD, and it was found that both rutile and anatase crystalline phases were present in the TiO2 (C) and sg-TiO2 samples, identified by the main XRD peaks located at 25.25° (JCPDS card No. 21-1272) and 27.44° (JCPDS card No. 21-1276), respectively (see Figure 2). Crystalline phase ratio was calculated from the intensity of the XRD peaks by using the method reported by H. Zhang et al. [15]; from these calculations, the anatase/rutile ratio was found to be 90/10.
The presence of rutile in the sg-TiO2 may be associated with the sintering of titania particles during the calcination at high temperature leading to the rutilization and, therefore, to the lowest specific surface area observed in this sample. Only the anatase phase of TiO2 was identified in the fluorinated and platinized samples, which is in agreement with previous results reported by different authors [11,18]; these authors found that the addition of fluorine ions on the titania surface before calcination reduces the sintering of the particles, thus inhibiting the formation of the rutile phase. The anatase crystallite size was also determined from the XRD spectra, and the obtained values are reported in Table 1. As can be seen, the sg-TiO2 sample presented the lowest value, corresponding to 17 nm. This could be related to the particle sintering coming from the formation of the rutile phase in this catalyst during the calcination process [12,13]. The highest anatase crystallite size was observed in the fluorinated TiO2; it has been reported that fluoride enhances the crystallization of the anatase phase and promotes the growth of anatase crystallites [11,18]. In the platinized sample, the anatase crystallite size was very similar, and no significant changes with the Pt addition were observed in this parameter.

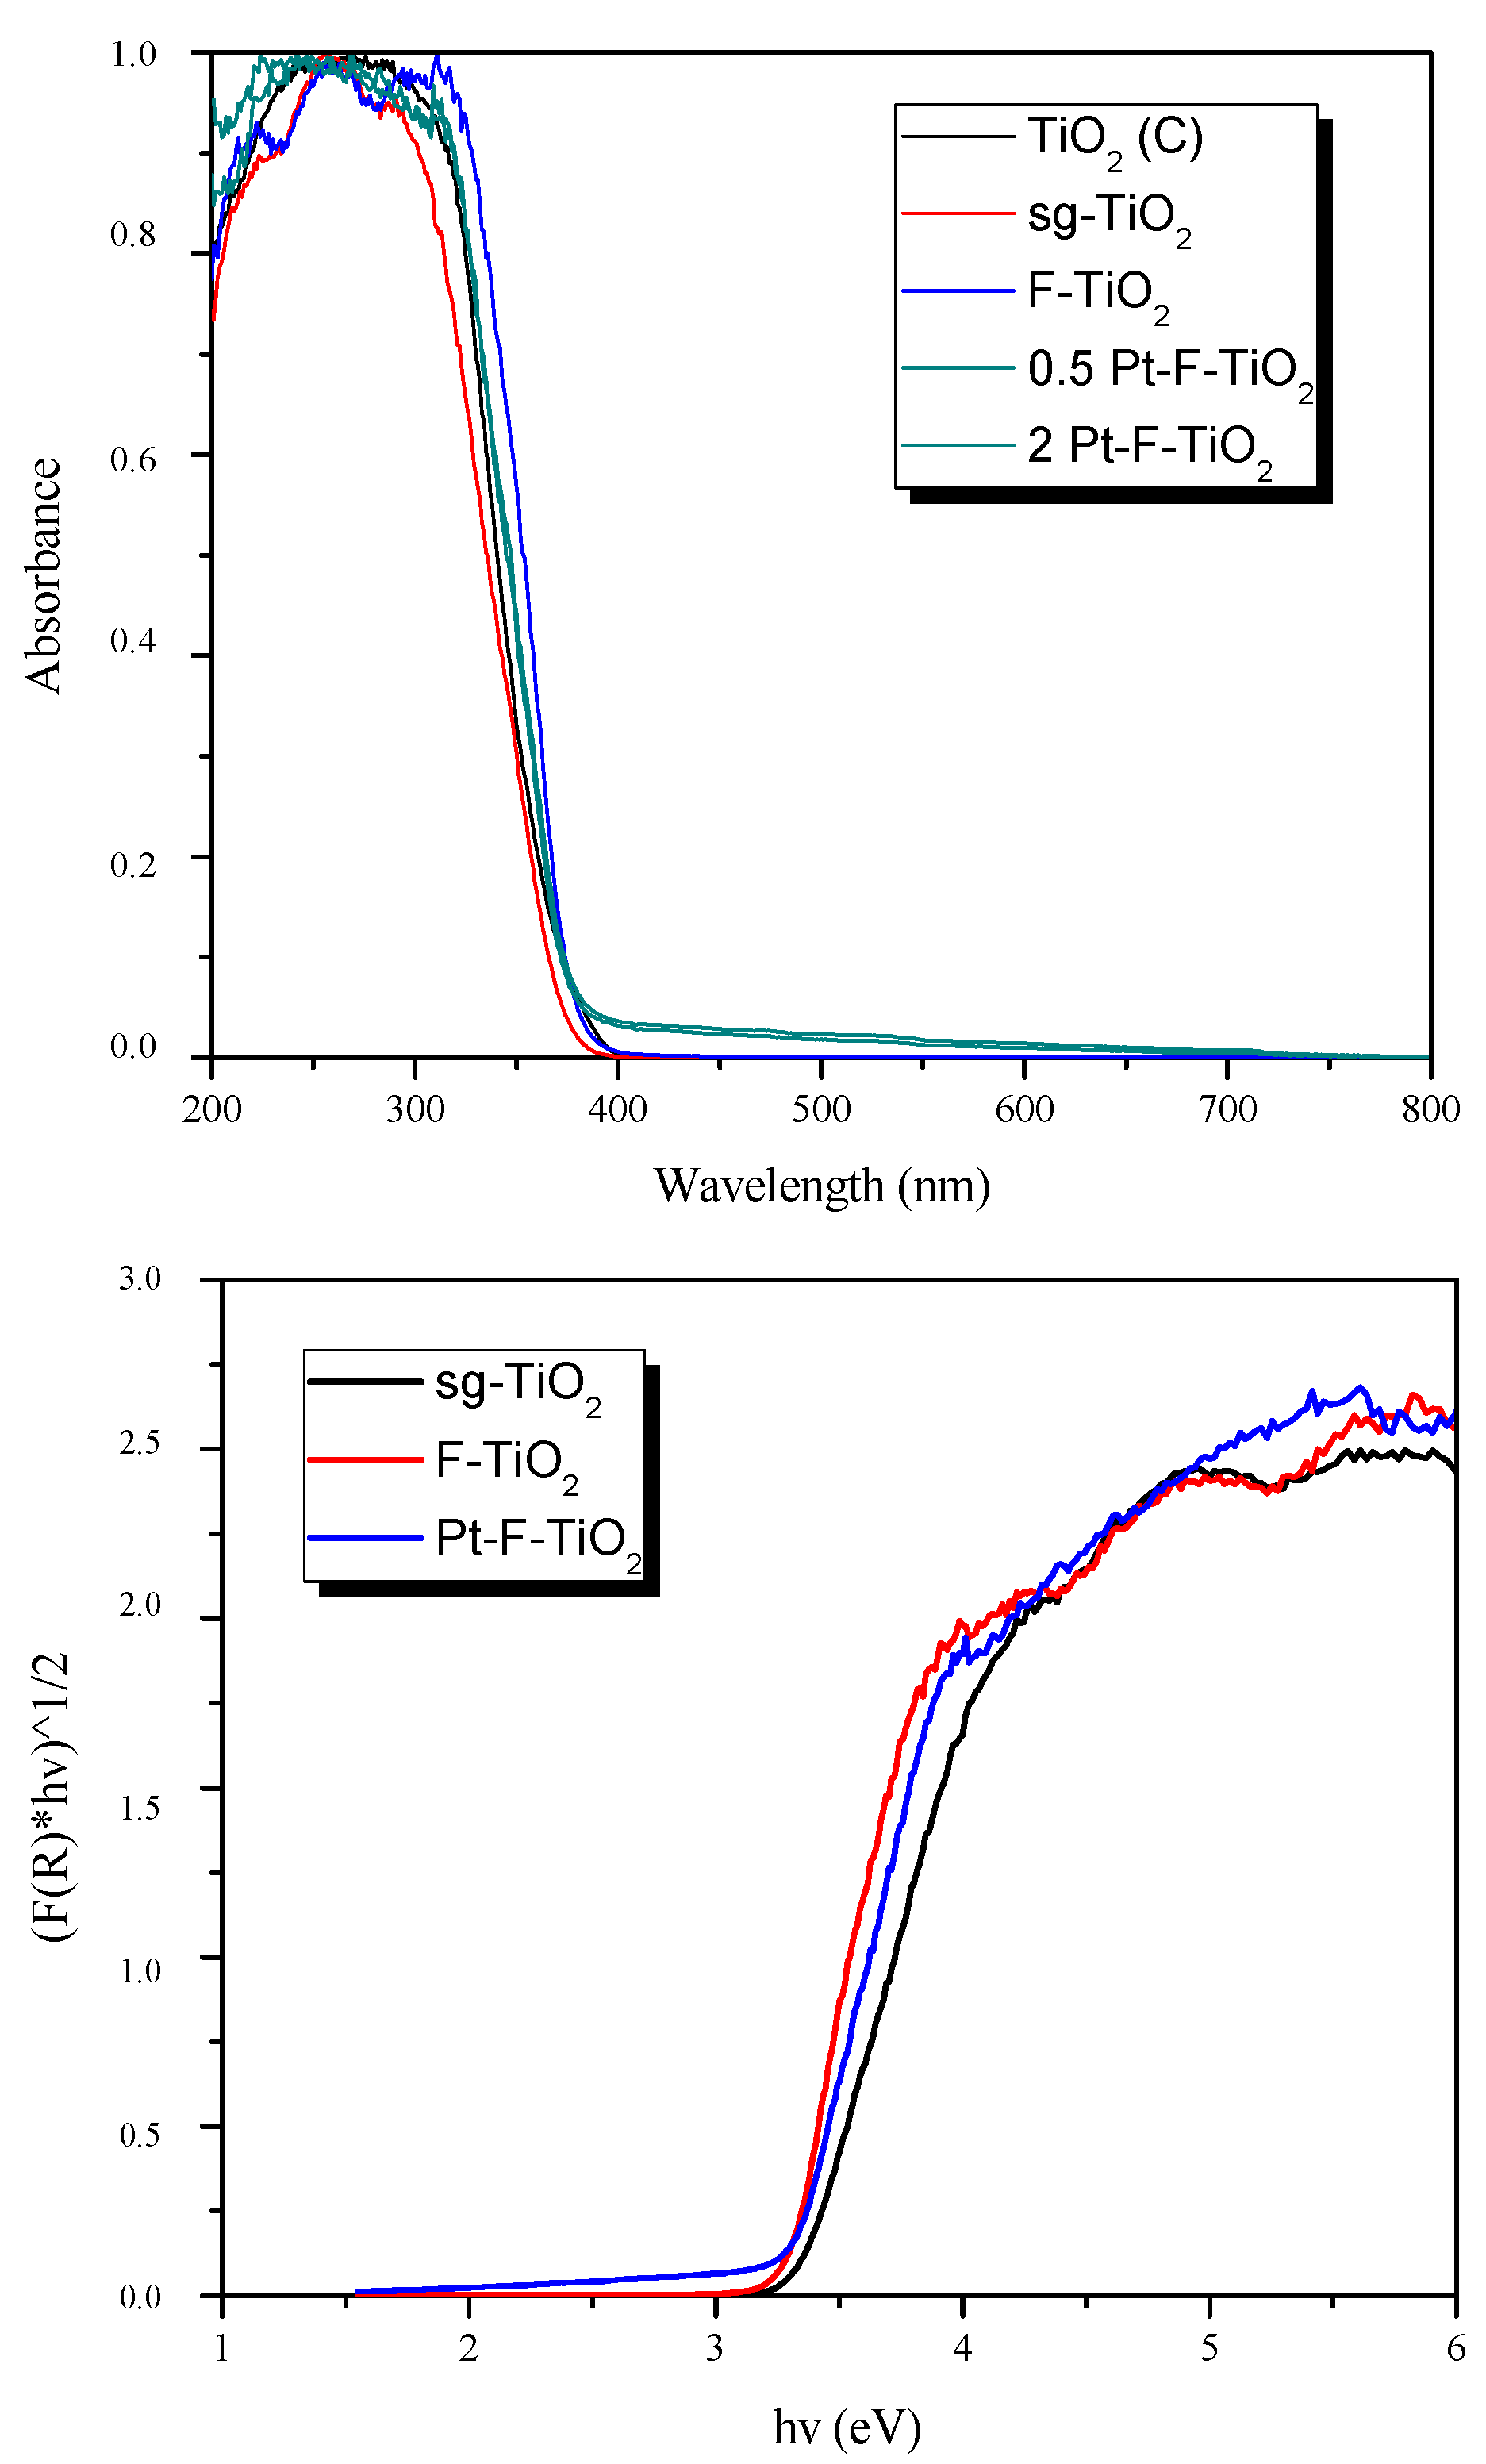
3.4. Optical Properties

The optical properties of the catalysts were analyzed by UV–Vis DRS, and the spectra obtained are shown in Figure 3. The typical absorption band edge of the TiO2 semiconductor was observed around 400 nm for all the samples. As can be seen, the UV–Vis absorption of the fluorinated TiO2 samples was slightly higher than that of the sg-TiO2 sample, which could be due to the presence of fluoride species (Ti≡F) on the TiO2 surface. It can be also concluded that metallization did not substantially alter the absorption properties of the samples; however, an increase in absorption throughout the visible range of the spectrum was observed in Pt-F-TiO2 samples, which is in concordance with the grey color of these materials.
From the UV–Vis DR spectra, band-gap energies were also calculated and the obtained results are reported in Figure 3 and Table 1. The band-gap energy was 3.3 eV for the sg-TiO2, and a slight narrowing of the TiO2 band gap was observed after fluorination and/or platinization treatments. The estimated band-gap energies for the samples analyzed were between 3.21 and 3.26 eV, very close to the band-gap energy of anatase TiO2 (3.20 eV).

3.5. Chemical Composition
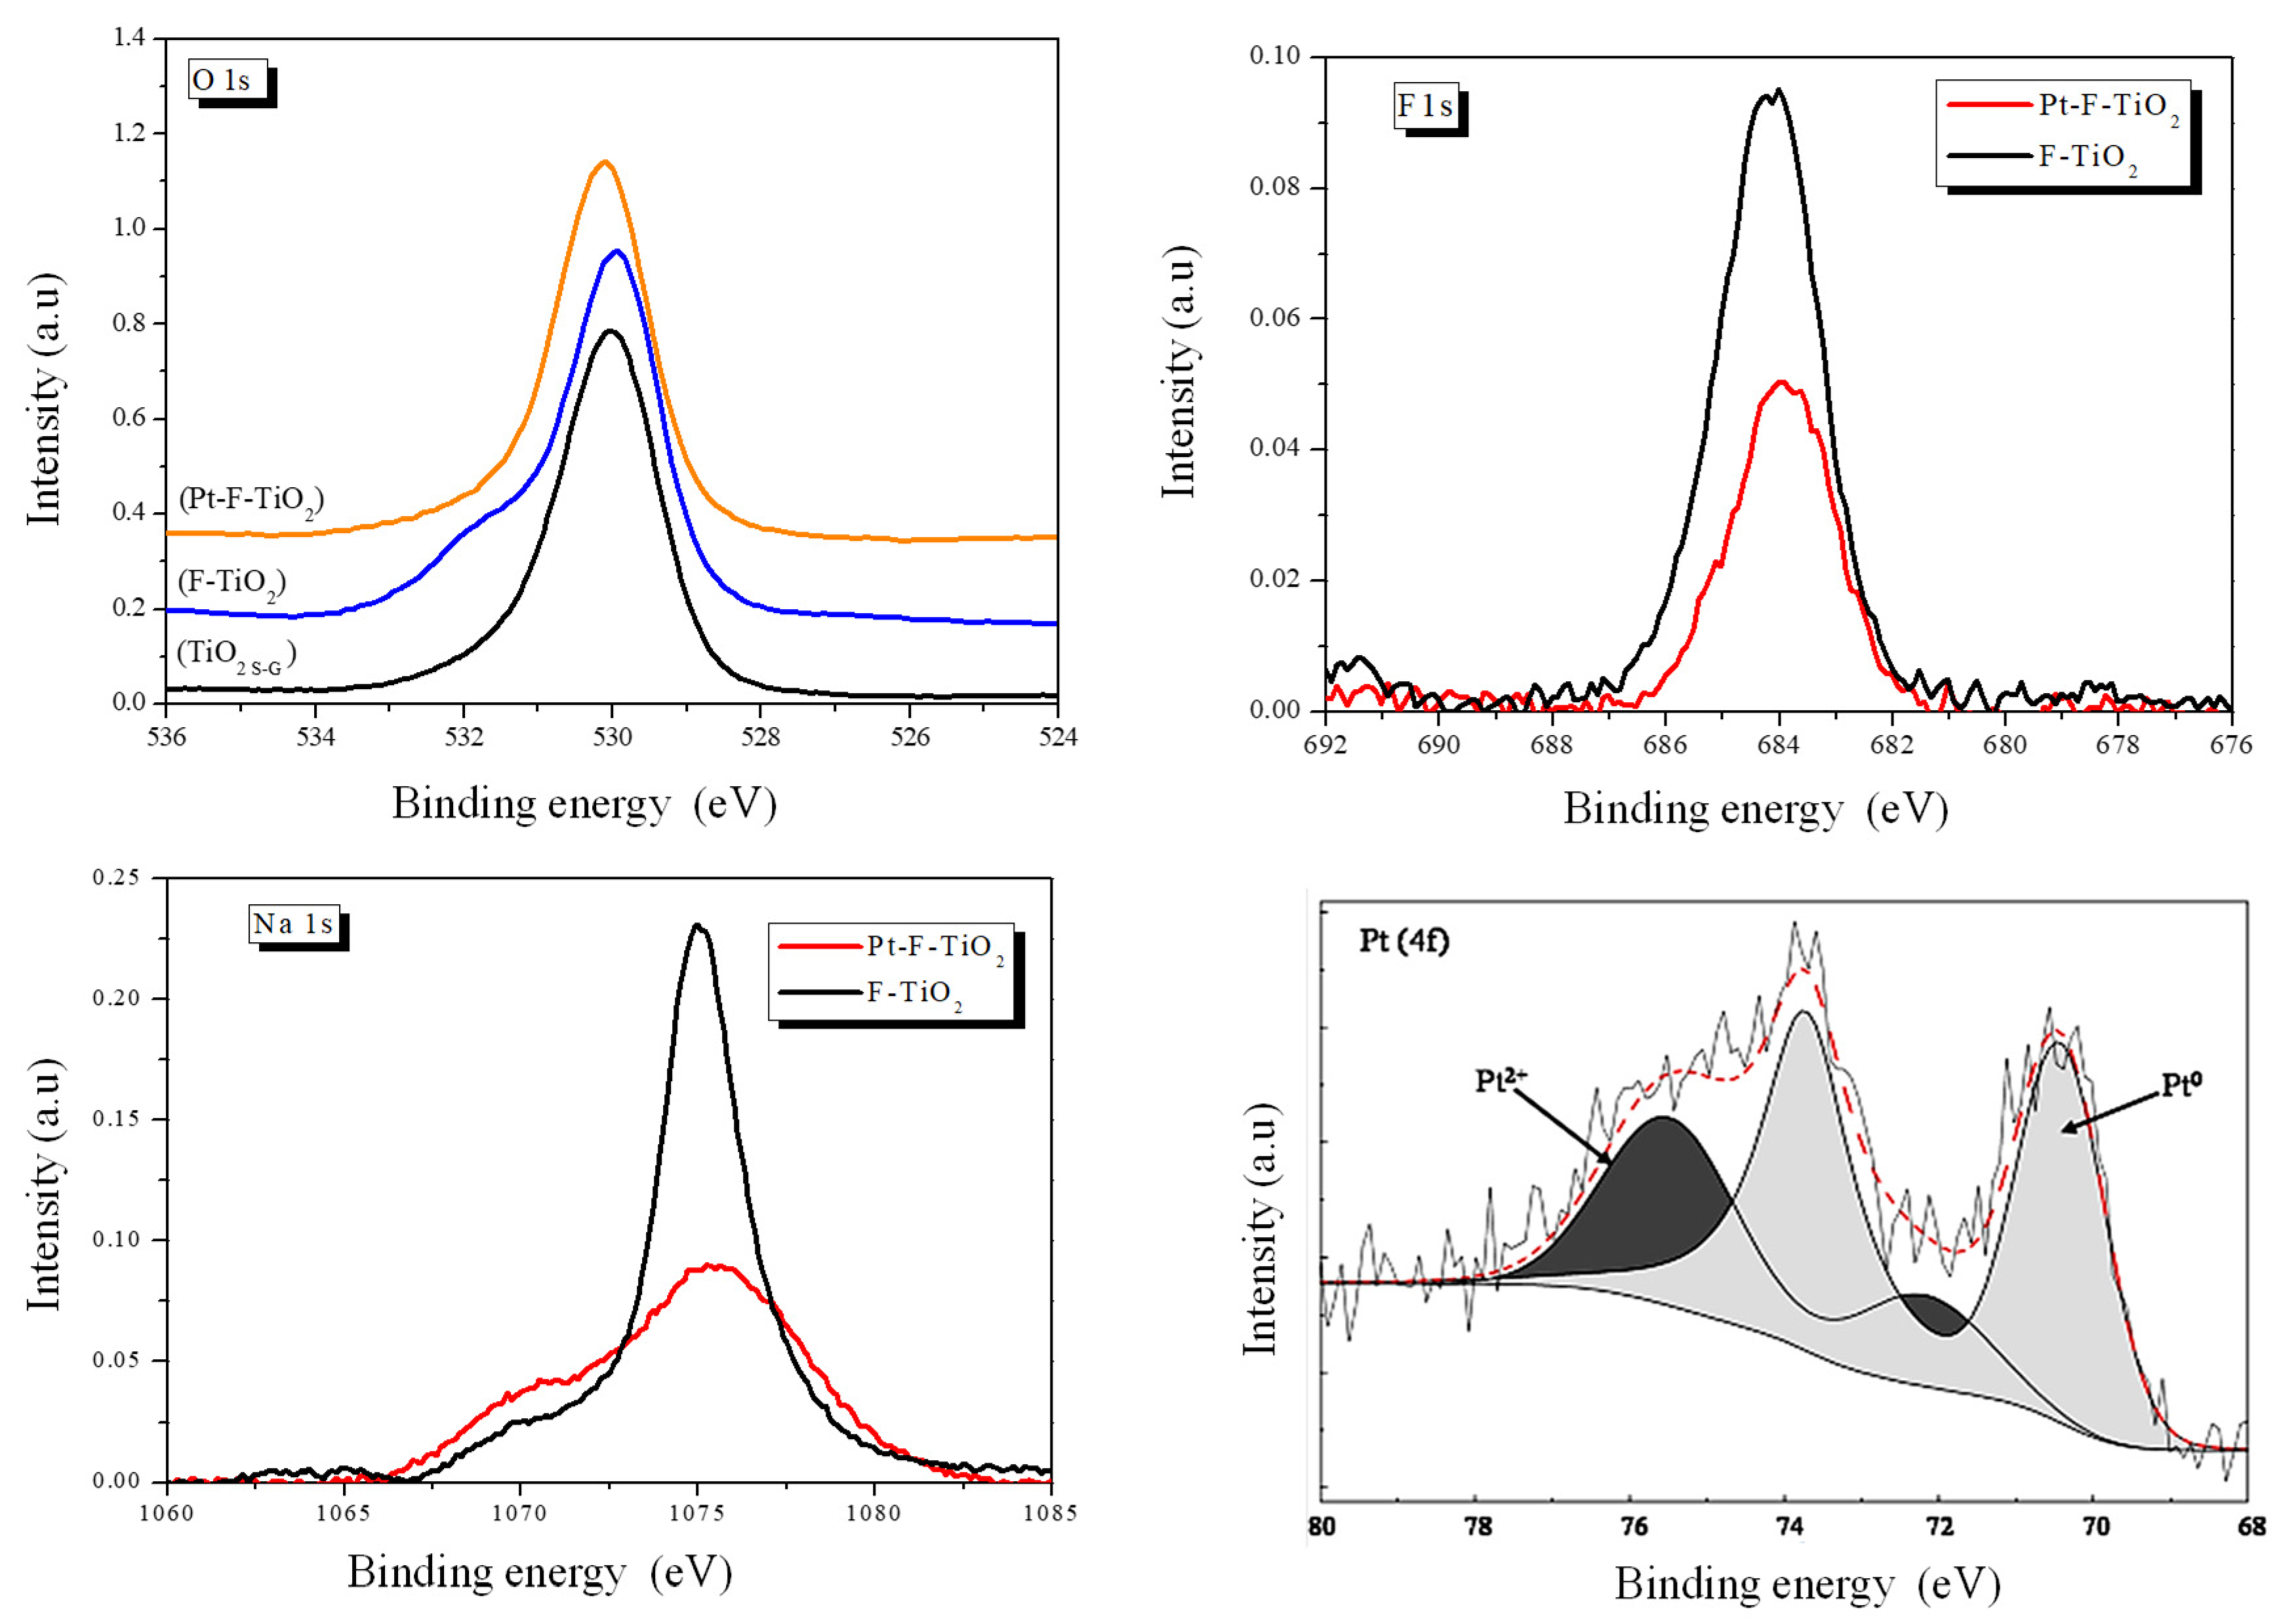
The chemical composition of the catalysts was determined by XRF. With this technique, it was possible to detect traces of Cl species that remained from the metal precursor used in the preparation of the catalysts in any case in which the chloride content exceeded 0.02%. Moreover, the real platinum loading in the platinized samples was calculated by XRF, and the obtained values were lower than the nominal metal content used to prepare the catalysts, thus indicating an incomplete reduction of the metal on the TiO2 surface during the photodeposition process. The amount of deposited Pt was close to 0.39 and 1.25 wt.% in the 0.5 Pt-F-TiO2 and 2 Pt-F-TiO2 samples, respectively.

3.6. XPS Analyses

The results obtained by XPS are summarized in Table 1. The Ti 2p core peaks exhibit a main component at around 458.5 ± 0.1 eV (Ti 2p3/2) for all the catalysts, which is typical of the Ti4+ ions in the TiO2 lattice. The addition of platinum did not modify the chemical environment of titanium atoms at the TiO2 surface. In the O 1s region, a peak located at 529.8 ± 0.2 eV can be observed for all the samples, assigned to oxygen atoms in the TiO2 lattice. This peak is asymmetric, with a shoulder at higher binding energies that can be ascribed to surface OH groups. By XPS analysis, the presence of Na and fluoride species on the surface of the fluorinated samples was also detected, indicating that ≡TiOH2 species could have been substituted by ≡TiF [13,18]. By XPS, it was also possible to observe that the Pt species had different oxidation states in the platinized samples; thus, reduced and oxidized species were detected in these samples, showing the incomplete metal reduction during the synthesis of the catalysts, as was also confirmed previously by XRF. Selected XPS spectra of the O 1s, Na 1s, F 1s and Pt 4f regions in the catalysts analyzed are shown in Figure 4.

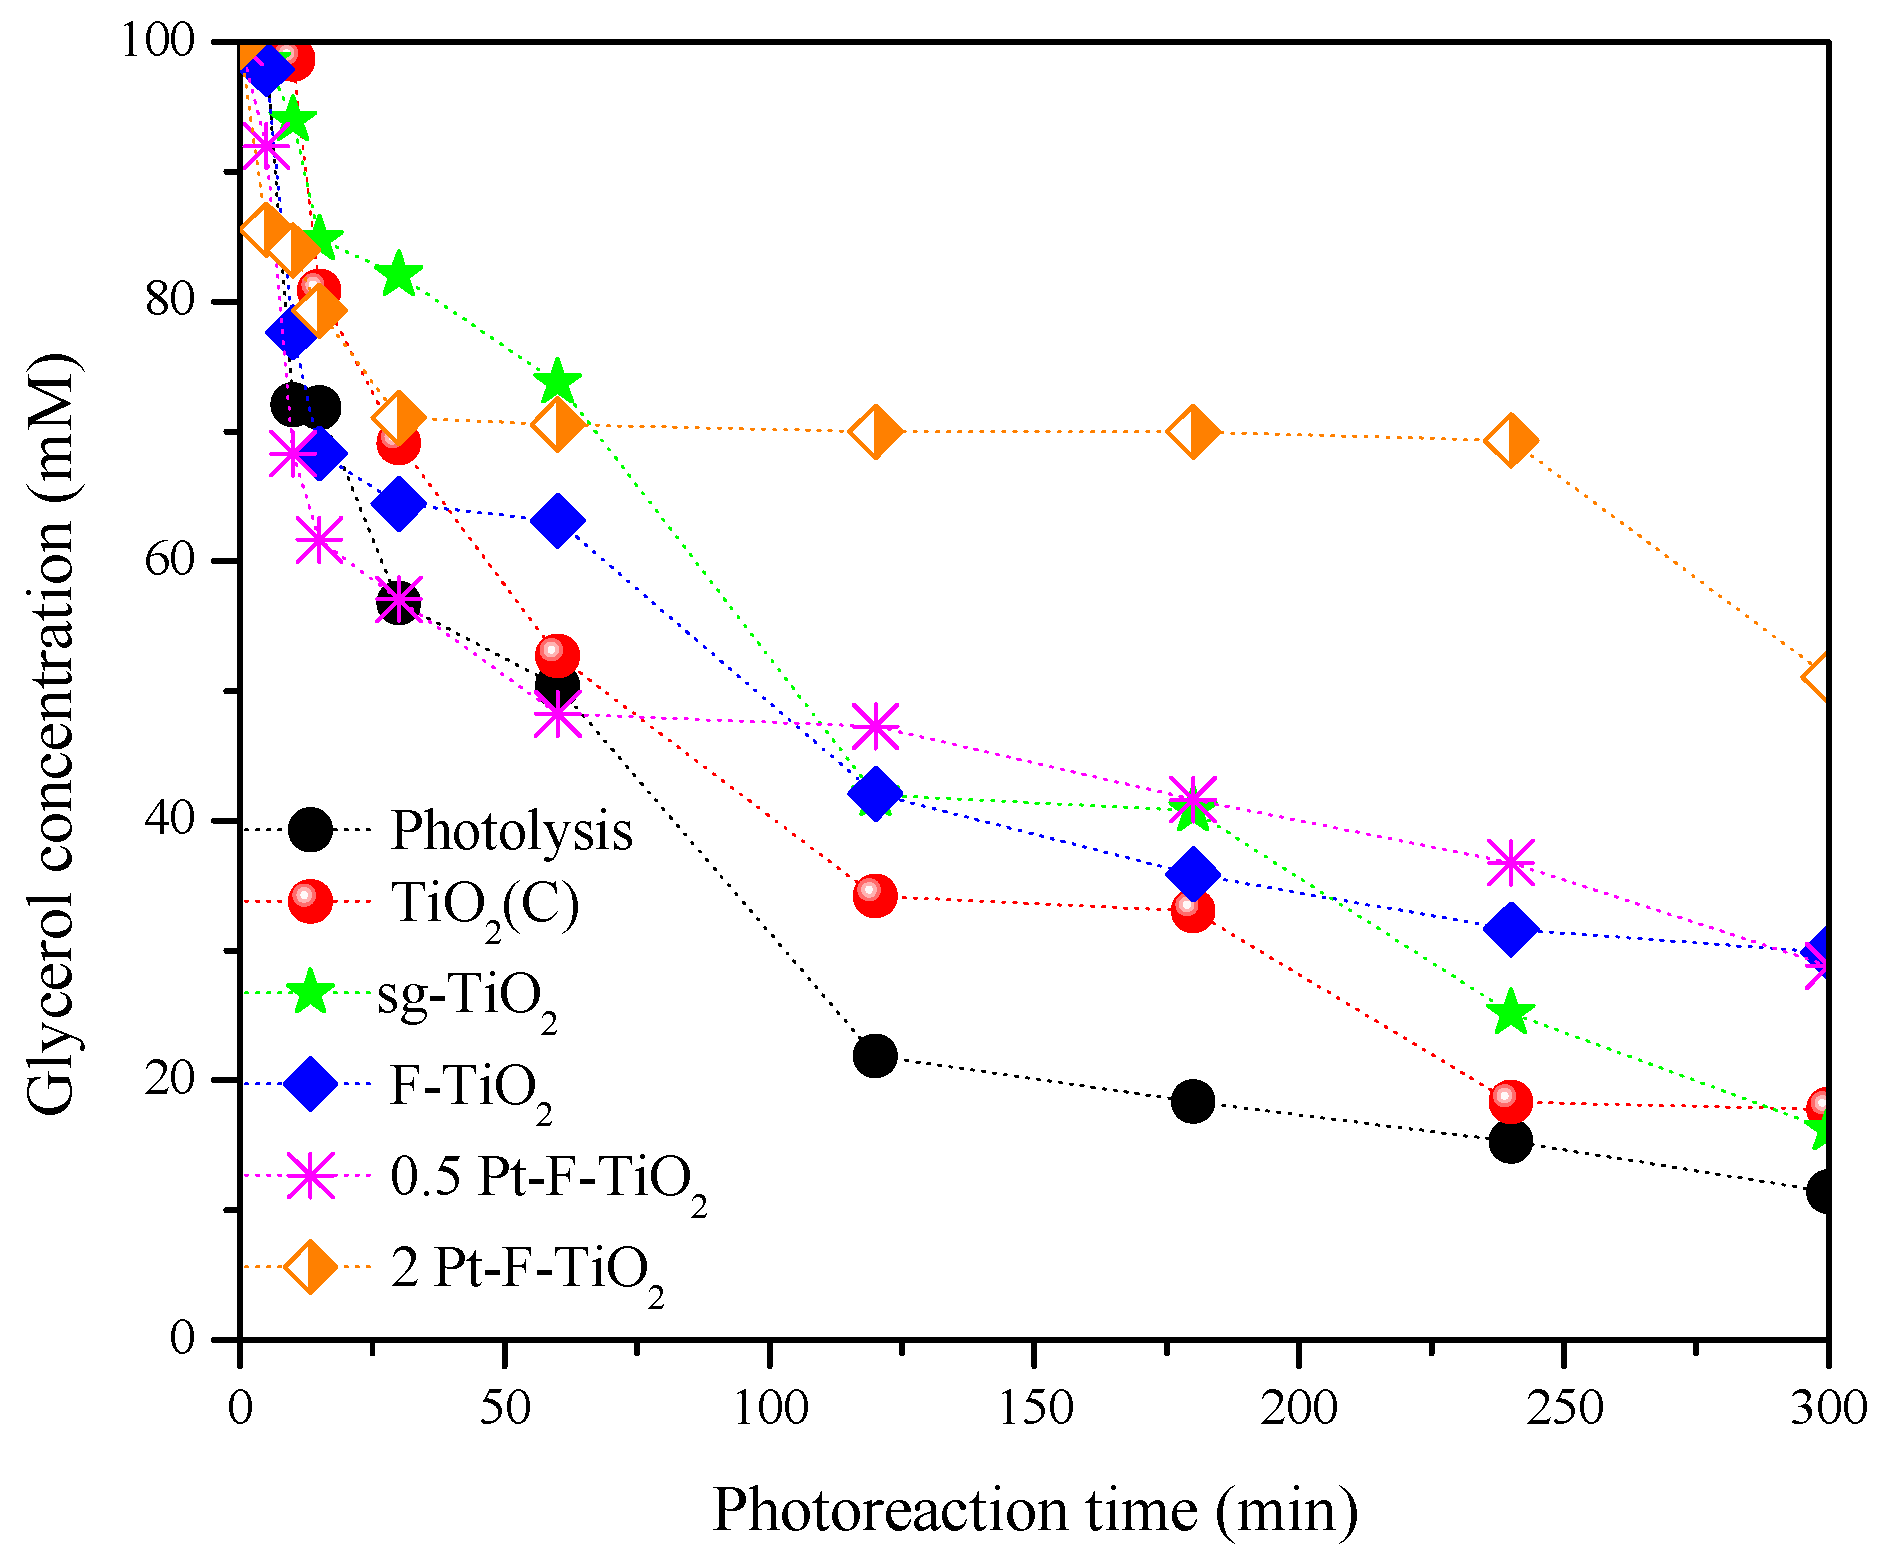
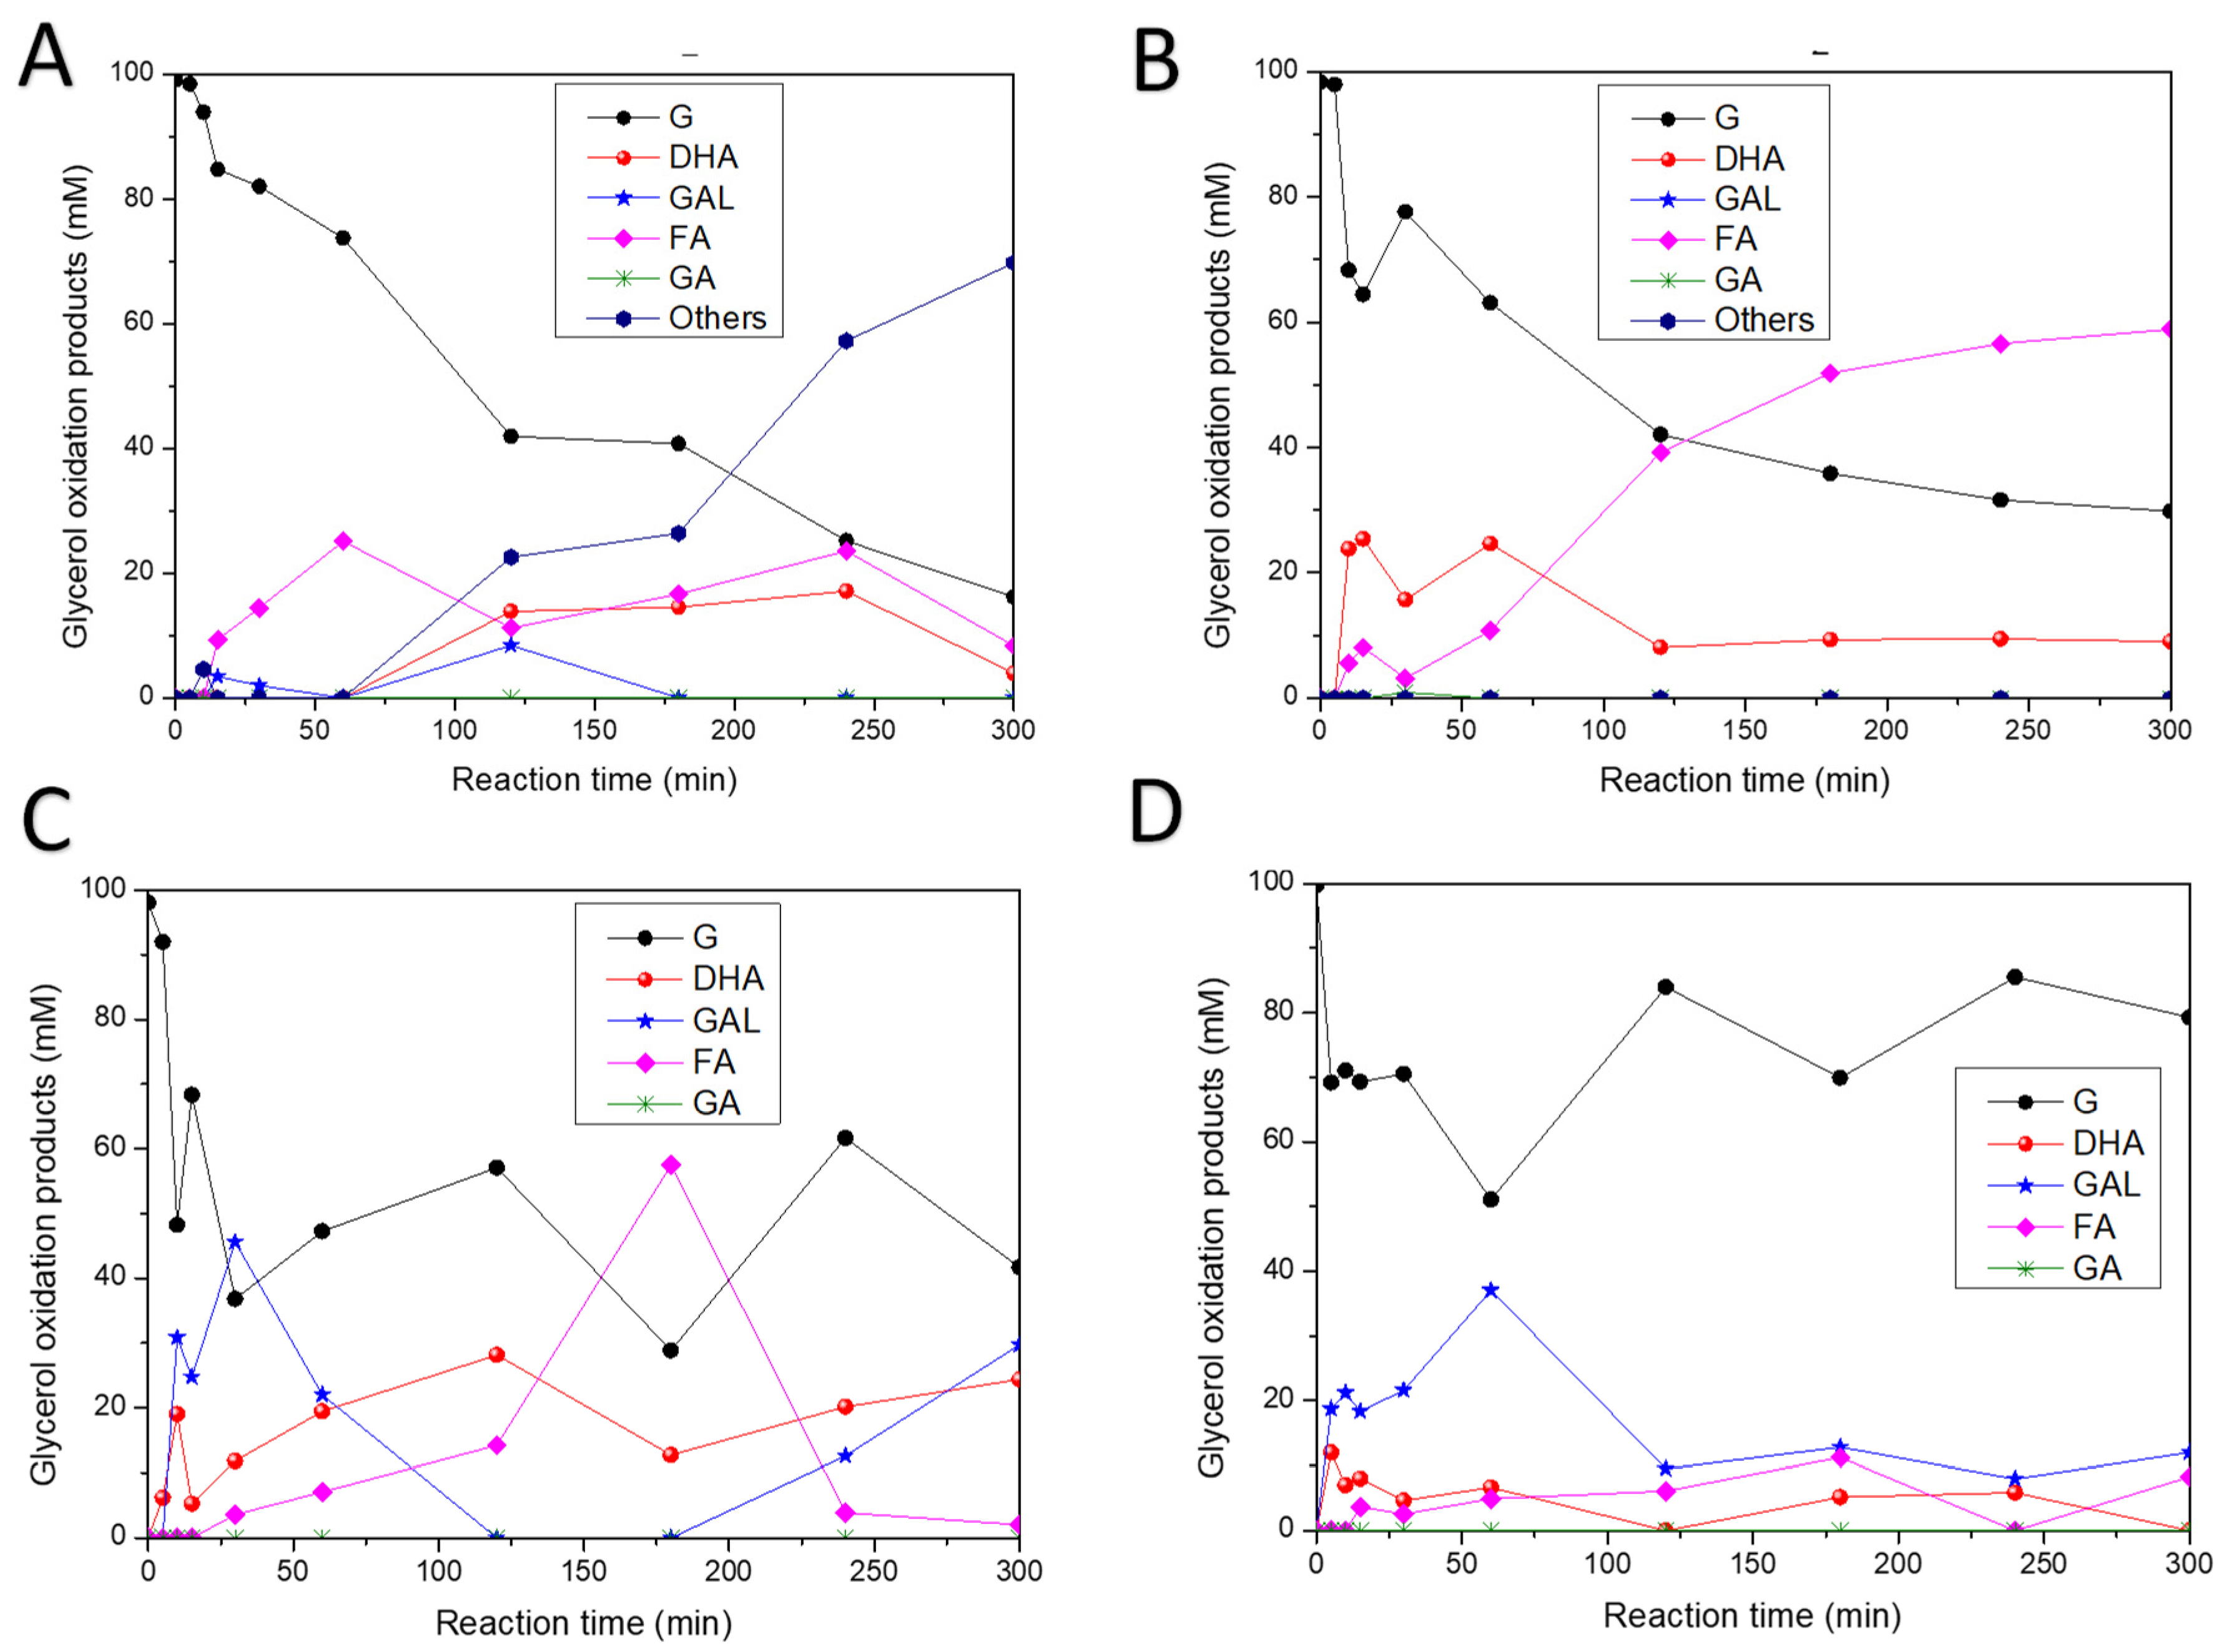
3.7. Catalytic Efficiency

As described in Section 2, glycerol concentration and formation of reaction products were evaluated by HPLC. Figure 5 shows glycerol concentration as a function of the reaction time over each catalyst evaluated. As can be noticed in this figure, the highest glycerol transformation was obtained in the blank test performed without catalyst powder, resulting in a final glycerol concentration of 11.4 mM after 300 min of reaction. The lowest glycerol transformation was obtained by using 2 Pt-F-TiO2 as the catalyst, which resulted in a final glycerol concentration of 79.3 mM at the end of the reaction time.
As previously indicated, glycerol blank test was carried out; from the results obtained, it was noticed that glycerol is highly sensitive to UV–Vis light, which transforms it into different compounds. It was also observed that the glycerol degradation increases with the illumination time, thus leading to a complex reaction mechanism where almost eight intermediary compounds were identified. The catalytic performance was followed by measuring G, DHA, GAL and FA concentrations and calculating glycerol conversion and the yields and selectivities of the products (see Table 2).
Different tests without illumination and in presence of a catalyst were also performed; no glycerol transformation was observed, and only a slight reduction of this substrate concentration was detected, which was mainly due to the glycerol adsorption on catalyst surface.
On the other hand, all the catalysts synthesized were tested in glycerol oxidation (carried out under illumination), and it was found that the presence of a catalyst in the reaction medium highly modified the reaction mechanism, thus resulting in different values of glycerol conversion and selectivity towards FA and DHA. The presence of the catalyst in the irradiated suspension reduces the number of photons absorbed by the glycerol, thus changing the sequence of chemical transformations occurring in this reaction. Hence, one should consider the kinetic aspect in the formation of certain chemicals. The reaction rate is reduced; hence, certain reaction pathways start to prevail over the others, leading to different distributions of reaction products.
The HPLC results obtained in the glycerol oxidation over some of the catalysts evaluated are represented in Figure 6. As can be seen in this figure, by using lab-prepared TiO2 (Figure 6A) as a catalyst, the glycerol starts to be transformed into FA in the first 15 min of reaction, and then DHA and other compounds are produced; a similar behavior was observed when using commercial titania. In the case of the lab-prepared fluorinated titania (F-TiO2), DHA and FA production was observed; however, in this case, no other compounds were detected (Figure 6B). Moreover, platinization of F-TiO2 led to obtaining GAL (Figure 6C).
Table 2 includes a summary of the glycerol conversion, yield and selectivity results obtained during the glycerol oxidation after 300 min of reaction by using all the experimental parameters evaluated in the present work. As can be seen, the highest glycerol conversion (88.4%) occurred during the blank test, which was due to the high number of intermediary compounds formed as a consequence of the illumination. It was also observed that commercial TiO2 presented similar catalytic performance when compared with its lab-prepared titania counterpart.
With respect to the compounds of interest, GAL and DHA, the highest yields were achieved with the modified 0.5 Pt-F-TiO2, indicating the potential of the prepared catalyst. Regarding selectivity, it was also noted that 0.5 Pt-F-TiO2 catalyst allowed the formation of GAL. That can also be attributed to the reaction mechanism occurring during glycerol oxidation.
It is interesting to note that, as can be clearly observed in Figure 6, over platinized and fluorinated titania, a decrease in Glycerol concentration first occurred, but after 50 min of reaction, the concentration of this substrate slightly increased; the same intermittent behavior was observed until the end of 300 min of total reaction time. These results indicate that the platinized catalysts present a highly reactive surface; thus, over these materials, glycerol oxidation can be a reversible reaction, where GLY can be transformed into other compounds but can also form glycerol again from these new compounds. These results can be explained taking into account that Pt nanoparticles can act as active sites on the catalyst surface; in these sites, glycerol oxidation can occur, but this substrate can also be efficiently adsorbed on positive Pt species. Therefore, in the equilibrium of the reaction, oxidative and reducing species will coexist and define the course of the reaction according to the conditions in which it is produced.

3.7.1. Effect of the Platinum Loading

After Pt addition over F-TiO2, a different behavior was observed when compared with that obtained by using the bare fluorinated titania in the glycerol oxidation; thus, the formation of GAL was detected only after platinization. It can also be observed in Figure 6 that fluorination treatment and platinum addition inhibit the production of other compounds different from GAL, DHA and FA. Figure 7 shows the evolution of the glycerol oxidation products as a function of reaction time over sg-TiO2 (Figure 7A), F-TiO2 (Figure 7B), 0.5 Pt-F-TiO2 (Figure 7C) and 2 Pt-F-TiO2 (Figure 7D) catalysts.
It was also determined that the fluorination and the presence of Pt nanoparticles on F-TiO2 decreased glycerol conversion; however, the Pt addition significantly increased the yield of GAL and DHA (Table 2). This is a relevant result, given the importance of these two compounds in different industrial activities compared with FA. DHA, for example, is used in the cosmetics industry as a tanning substance [2] and is also useful as a monomer in polymeric biomaterials [19]. GAL is an intermediate of the carbohydrate metabolism and is also a standard by which chiral molecules of the D- or L-series are compared [20].
However, it appears that the Pt loading had an important impact on the effectiveness of the F-TiO2 in the glycerol oxidation; thus, with 0.5 Pt-F-TiO2 catalyst, a glycerol conversion value of 57.40% and yields of 30.40%, 24.91% and 2.1% for GAL, DHA and FA, respectively, were obtained. However, when using the material prepared with 2 wt.% of Pt (2 Pt-F-TiO2), the conversion and the yields of the mentioned products significantly decreased. This can be related to the glycerol adsorption on the catalyst surface; thus, it is possible that Pt nanoparticles act as adsorption centers for glycerol, mainly taking into account that Ptδ+ species were identified by XPS analyses in the platinized samples. These species can favor the adsorption of the strongly electronegative glycerol molecule. This hypothesis can be corroborated if it is observed that in the case of the 0.5 Pt-F-TiO2 catalyst, there are a high number of metal particles on the surface compared with the 2 Pt-F-TiO2 material, which can favor the substrate adsorption and thus lead to a better oxidation. It was also determined that there were Pt particles with the largest size >7 nm in the 2 Pt-F-TiO2. Different authors have reported that larger Pt particle size is related to restricted absorption of the substrate. Liang et al. [21] found that larger-sized Pt particles (>10 nm) were less active and that smaller-sized ones (<6 nm) exhibited higher glycerol conversion and stable selectivity. Similar behavior was observed in the present work, where the catalyst presenting the larger Pt nanoparticles led to the lowest performance in glycerol oxidation.

3.7.2. Effect of the Catalyst Amount
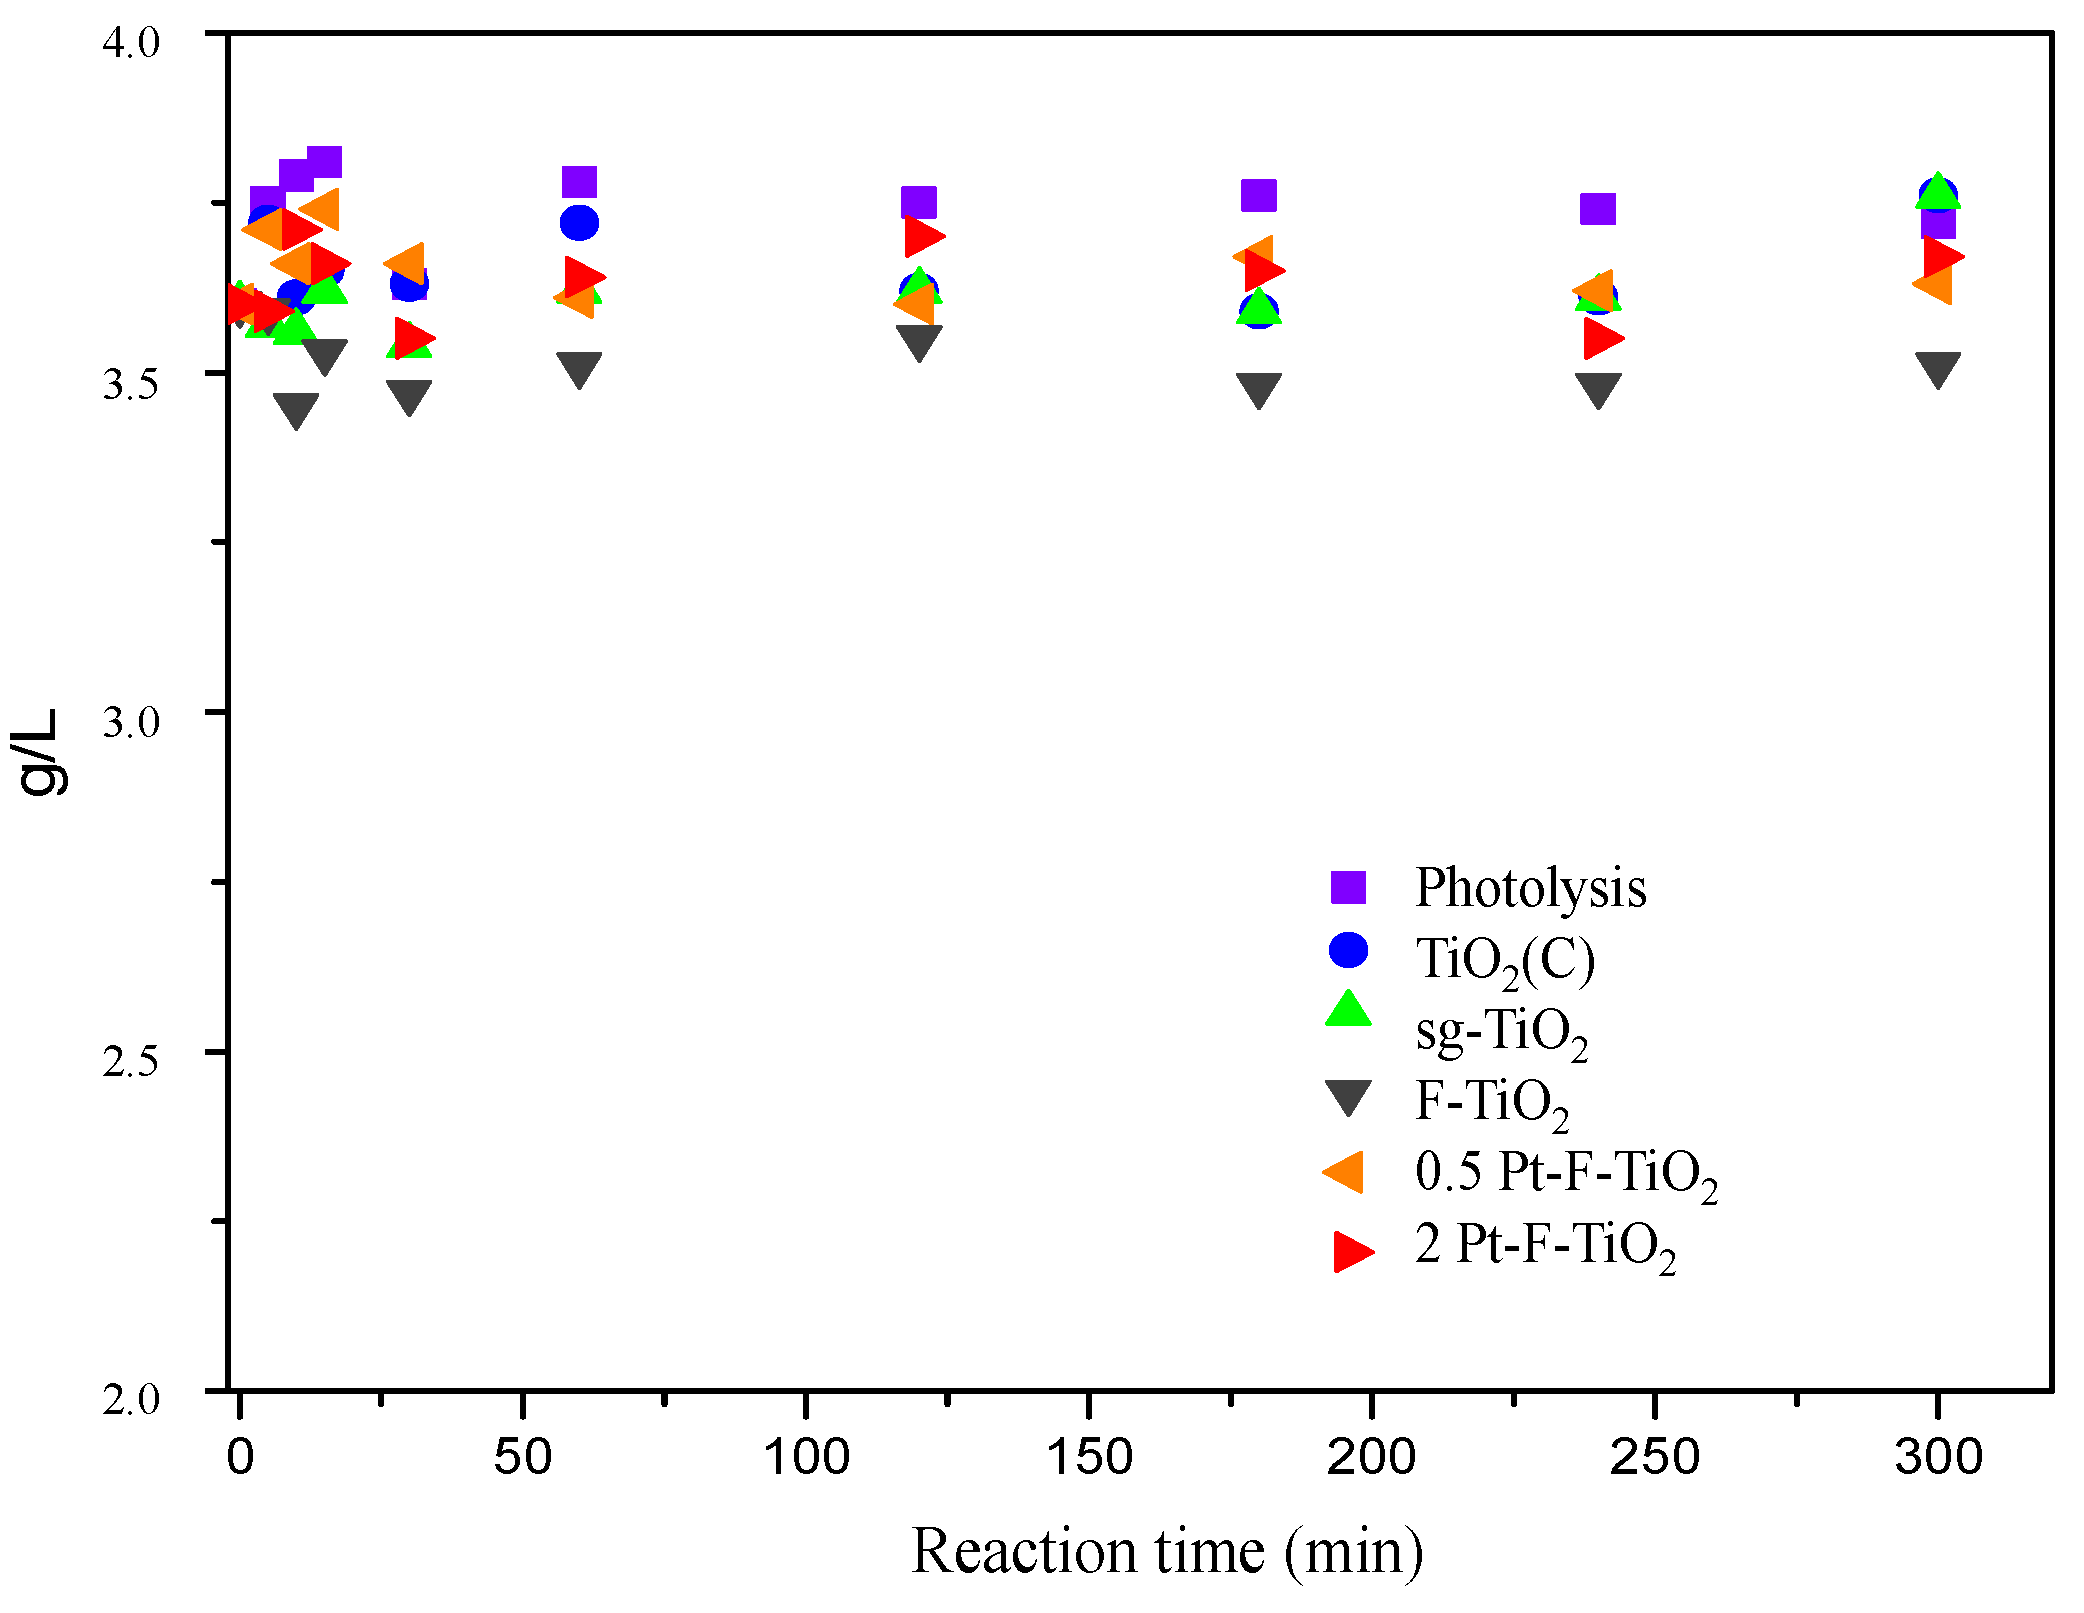
Taking into account that the 0.5 Pt-F-TiO2 catalyst showed the better performance and the highest GAL yield, this material was selected for testing in the glycerol oxidation reaction carried out by using different catalyst amounts (i.e., 10, 30 and 40 mg). The results obtained are summarized in Table 2. As can be seen, conversion and yields of the GAL, DHA and FA decreased as the catalyst amount increased. This could be due to the greater amounts of catalyst causing an increase in the solution opacity, and screening effects of particles could also have occurred, masking part of the photosensitive area and thus leading reduced activity of the materials tested in the glycerol oxidation.
A preliminary study of the glycerol oxidation (evaluated by UV–Vis spectrophotometry) was also attempted by using 10, 20 and 30 mg/L of 2% Pt-F-TiO2. The results obtained showed similar behavior to that observed when using the 0.5 Pt-F-TiO2 catalyst, and the best performance was observed when using 10 to 20 mg of catalyst loading per liter of glycerol solution.

3.8. Mineralization

In order to monitor the extent of the reaction, samples withdrawn from the fluid phase were analyzed by the total organic carbon (TOC) method, and the results obtained are presented in Figure 8. TOC results allow the conclusion that mineralization was never reached. In the results obtained during the glycerol oxidation over Pt-F-TiO2, using different catalyst loadings, slight changes can be observed for all the trials, but glycerol was not completely oxidized or mineralized in any case. This implies that CO2 or H2 were not produced. This effect was also observed when different catalyst amounts were tested with the other assessed materials.

4. Conclusions

Glycerol is sensitive to UV–Vis light; thus, it was observed that this molecule can be transformed under illumination, giving rise to the formation of eight different compounds during the blank experiments, while the number of products significantly decreased in the presence of a catalyst in the reaction medium.
Fluorination and platinization lead to the modification of the optical and morphological properties of TiO2 prepared by sol–gel method, thus leading to high absorption in the visible region and high surface area being obtained. It was observed that these treatments clearly modify the reaction mechanism and selectivity during glycerol oxidation reaction. Firstly, over commercial or lab-prepared TiO2, almost three intermediaries were produced after 60 min of reaction; after fluorine addition on TiO2 surface, only the formation of DHA and FA was detected. Moreover, GAL, DHA and FA were observed when Pt was added.
Pt content and catalyst loading are key points influencing glycerol transformation effectiveness; thus, by increasing the Pt content from 0.5 to 2 wt.%, glycerol conversion and, therefore, the intermediary product yields were decreased. This could be related to the glycerol adsorption on the surface of Pt-F-TiO2, which is better on the 0.5 wt.% Pt-F-TiO2 catalyst. The best loading for glycerol oxidation over 0.5 wt.% Pt-F-TiO2 was found to be 10 mg. This amount is enough to allow the correct interaction between the catalyst and the substrate, avoiding the screening effect and low yields.
According to the results obtained, it is worth noting that platinization is a suitable method for improving the efficiency of F-TiO2 in the glycerol transformation into GCA, and the highest GAL production was obtained over the 0.5 wt.% Pt-F-TiO2 catalyst.

Author Contributions

J.J.M., R.B.-J.; R.N. and R.R., conceived and designed the experiments and looked for funding. J.J.M., J.S.H., O.C., E.G.Á.-M. and E.B. performed the experiments. J.J.M., J.S.H. and R.B.-J. analyzed the data and wrote the paper. H.R. and J.C. contributed reagents, materials and analysis tools. M.C.H. and J.A.N. performed the characterization analysis experiments. All authors have read and agreed to the published version of the manuscript.

Funding

This research was funded by Universidad Autónoma del Estado de México (UAEM), grant number 3892/2015 FS; Fondo Nacional de Financiamiento para la Ciencia, la Tecnología y la Innovación Francisco José de Caldas—Colciencias, Project 279-2016; and Universidad Pedagógica y Tecnológica de Colombia grant SGI 2006.

Institutional Review Board Statement

Not applicable.

Informed Consent Statement

Not applicable.

Data Availability Statement

Not applicable.

Acknowledgments

The authors thank Universidad Autónoma del Estado de México (UAEM) for funding (grant number 3892/2015 FS); this work was also financed by Fondo Nacional de Financiamiento para la Ciencia, la Tecnología y la Innovación Francisco José de Caldas—Colciencias, Project 279-2016, and Universidad Pedagógica y Tecnológica de Colombia.

Conflicts of Interest

The authors declare no conflict of interest.

References

  1. Rossi, M.; Della Pina, C.; Pagliaro, M.; Ciriminna, R.; Forni, P. Greening the Construction Industry: Enhancing the Performance of Cements by Adding Bioglycerol. ChemSusChem 2008, 1, 809–812. [Google Scholar] [CrossRef]
  2. Ciriminna, R.; Palmisano, G.; Della Pina, C.; Rossi, M.; Pagliaro, M. One-pot electrocatalytic oxidation of glycerol to DHA. Tetrahedron Lett. 2006, 47, 6993–6995. [Google Scholar] [CrossRef]
  3. Kenar, J.A. Glycerol as a platform chemical: Sweet opportunities on the horizon? Lipid Technol. 2007, 19, 249–253. [Google Scholar] [CrossRef]
  4. Bowker, M.; Morton, C.; Kennedy, J.; Bahruji, H.; Greves, J.; Jones, W.; Davies, P.; Brookes, C.; Wells, P.; Dimitratos, N. Hydrogen production by photoreforming of biofuels using Au, Pd and Au–Pd/TiO2 photocatalysts. J. Catal. 2014, 310, 10–15. [Google Scholar] [CrossRef]
  5. Demirel-Gülen, S.; Lucas, M.; Claus, P. Liquid phase oxidation of glycerol over carbon supported gold catalysts. Catal. Today 2005, 102, 166–172. [Google Scholar] [CrossRef]
  6. Ketchie, W.C.; Murayama, M.; Davis, R.J. Selective oxidation of glycerol over carbon-supported AuPd catalysts. J. Catal. 2007, 250, 264–273. [Google Scholar] [CrossRef]
  7. Maicu, M.; Hidalgo, M.; Colón, G.; Navío, J.A. Comparative study of the photodeposition of Pt, Au and Pd on pre-sulphated TiO2 for the photocatalytic decomposition of phenol. J. Photochem. Photobiol. A Chem. 2011, 217, 275–283. [Google Scholar] [CrossRef]
  8. Li, D.; Haneda, H.; Hishita, S.; Ohashi, N.; Labhsetwar, N.K. Fluorine-doped TiO2 powders prepared by spray pyrolysis and their improved photocatalytic activity for decomposition of gas-phase acetaldehyde. J. Fluor. Chem. 2005, 126, 69–77. [Google Scholar] [CrossRef]
  9. Okazaki, K.; Morikawa, Y.; Tanaka, S.; Tanaka, K.; Kohyama, M. Effects of stoichiometry on electronic states of Au and Pt supported on TiO2 (110). J. Mater. Sci. 2005, 40, 3075–3080. [Google Scholar] [CrossRef]
  10. Mesa, J.J.M.; Romero, J.R.G.; Macías, Ángela, C.C.; Sarmiento, H.A.R.; Lobo, J.A.C.; Santos, J.A.N.; López, M.D.C.H. Methylene blue degradation over M-TiO2 photocatalysts (M = Au or Pt). Cienc. Desarro. 2017, 8, 109–117. [Google Scholar] [CrossRef]
  11. Yu, J.; Xiang, Q.; Ran, J.; Mann, S. One-step hydrothermal fabrication and photocatalytic activity of surface-fluorinated TiO2 hollow microspheres and tabular anatase single micro-crystals with high-energy facets. Cryst. Eng. Commun. 2010, 12, 872–879. [Google Scholar] [CrossRef]
  12. Murcia, J.; Hidalgo, M.; Navío, J.; Araña, J.; Doña-Rodríguez, J. Study of the phenol photocatalytic degradation over TiO2 modified by sulfation, fluorination, and platinum nanoparticles photodeposition. Appl. Catal. B Environ. 2015, 179, 305–312. [Google Scholar] [CrossRef]
  13. Iervolino, G.; Vaiano, V.; Murcia, J.; Rizzo, L.; Ventre, G.; Pepe, G.; Campiglia, P.; Hidalgo, M.; Navio, J.A.; Sannino, D.; et al. Photocatalytic hydrogen production from degradation of glucose over fluorinated and platinized TiO2 catalysts. J. Catal. 2016, 339, 47–56. [Google Scholar] [CrossRef]
  14. Chong, M.N.; Vimonses, V.; Lei, S.; Jin, B.; Chow, C.W.; Saint, C. Synthesis and characterisation of novel titania impregnated kaolinite nano-photocatalyst. Microporous Mesoporous Mater. 2009, 117, 233–242. [Google Scholar] [CrossRef]
  15. Fernandez, J.M.; Kiwi, J.; Baeza, J.; Freer, J.; Lizama, C.; Mansilla, H.D. Orange II photocatalysis on immobilised TiO2. Appl. Catal. B Environ. 2004, 48, 205–211. [Google Scholar] [CrossRef]
  16. Molinari, R.; Pirillo, F.; Falco, M.; Loddo, V.; Palmisano, L. Photocatalytic degradation of dyes by using a membrane reactor. Chem. Eng. Process. 2004, 43, 1103–1114. [Google Scholar] [CrossRef]
  17. Tandon, S.P.; Gupta, J.P. Measurement of Forbidden Energy Gap of Semiconductors by Diffuse Reflectance Technique. Phys. Status Solidi B 1970, 38, 363–367. [Google Scholar] [CrossRef]
  18. Vohra, M.S.; Kim, S.; Choi, W. Effects of surface fluorination of TiO2 on the photocatalytic degradation of tetramethylammonium. J. Photochem. Photobiol. A Chem. 2003, 160, 55–60. [Google Scholar] [CrossRef]
  19. Behr, A.; Eilting, J.; Irawadi, K.; Leschinski, J.; Lindner, F. Improved utilisation of renewable resources: New important derivatives of glycerol. Green Chem. 2008, 10, 13–30. [Google Scholar] [CrossRef]
  20. Augugliaro, V.; El Nazer, H.H.; Loddo, V.; Mele, A.; Palmisano, G.; Palmisano, L.; Yurdakal, S.; El-Nazer, H.A. Partial photocatalytic oxidation of glycerol in TiO2 water suspensions. Catal. Today 2010, 151, 21–28. [Google Scholar] [CrossRef]
  21. Liang, D.; Gao, J.; Wang, J.; Chen, P.; Hou, Z.; Zheng, X. Selective oxidation of glycerol in a base-free aqueous solution over different sized Pt catalysts. Catal. Commun. 2009, 10, 1586–1590. [Google Scholar] [CrossRef]
Figure 1. Selected TEM images of Pt-F-TiO2 photocatalysts: (Left) 0.5 Pt-F-TiO2; (Right) 2 Pt-F-TiO2.
Materproc 04 00037 g001
Figure 2. XRD patterns for bare and modified TiO2 samples. (*) Anatase and rutile main diffraction patterns.
Materproc 04 00037 g002
Figure 3. (Top) UV–Vis DR spectra of photocatalysts prepared and (Bottom) band-gap calculation from Kubelka–Munk function.
Materproc 04 00037 g003
Figure 4. XPS spectra of the O 1s, Na 1s, F 1s and Pt 4f regions in the photocatalysts analyzed.
Materproc 04 00037 g004
Figure 5. Glycerol concentration as a function of the reaction time over each photocatalyst evaluated.
Materproc 04 00037 g005
Figure 6. Glycerol photooxidation over the photocatalysts evaluated: (A) sg-TiO2; (B) F-TiO2; (C) 2 Pt-F-TiO2.
Materproc 04 00037 g006
Figure 7. Glycerol and oxidation product concentrations as a function of the photocatalytic oxidation time: (A) sg-TiO2; (B) F-TiO2; (C) 0.5 Pt-F-TiO2; (D) 2 Pt-F-TiO2.
Materproc 04 00037 g007
Figure 8. Total organic carbon (TOC) results as a function of the reaction time during glycerol oxidation over the photocatalysts analyzed.
Materproc 04 00037 g008
Table 1. Physical properties determined for N2 physisorption, XRD, UV–Vis DRS and XPS for the photocatalysts assayed.
PhotocatalystsSBET (m2/g)DAnatase (nm)Band Gap (eV)Binding Energy (eV)
Ti 2p3/2O 1s
TiO2 (C)51223.23458.5529.8
sg-TiO211173.30458.5529.8
F-TiO251243.21458.4529.6
0.5 Pt-F-TiO242233.24458.3529.6
2 Pt-F-TiO250223.26461.3531.2
Table 2. Conversion and yield calculated for glycerol oxidation after 300 min of reaction. (*) 10 mg Glycerol.
PhotocatalystGlycerol
Conversion (%)
GAL Yield (%)DHA Yield (%)FA
Yield (%)
Other Products’ Yield (%)GAL
Selectivity (%)
DHA
Selectivity (%)
FA
Selectivity (%)
Other Products’ Selectivity (%)
Photolysis88.400.126.6012.8068.900.137.5114.5077.90
TiO2 (C) *82.200.0015.2012.9054.00018.5015.8065.70
sg-TiO2 *83.500.0015.1621.2454.7016.6423.3149.87
F-TiO2 *69.400.009.2360.200013.30 87.00 0
0.5 Pt-F-TiO2 *57.4030.4024.912.10052.9843.39 3.630
2 Pt-F-TiO2 *20.4012.0308.33059.10040.830
0.5 Pt-F-TiO2 (30 mg)34.1115.458.6010.10045.3225.1629.510
0.5 Pt-F-TiO2 (40 mg)14.8314.830000000
Publisher’s Note: MDPI stays neutral with regard to jurisdictional claims in published maps and institutional affiliations.

