1. Introduction
Stone pine (
Pinus pinea L.) is a Mediterranean species, distributed in coastal areas from the western area of the Iberian Peninsula to Turkey [
1]. Stone pine is a valuable species for its pine nuts or pine kernels, which are a delicious and highly nutritious edible seeds, providing a good source of fat, proteins and vitamins, among other phytochemical characteristics [
2,
3,
4]. In addition, the species is also well known for the economics of its timber and resins. Between 2010 and 2015, the Portuguese stone pine area increased by 20,700 ha, reaching 193,600 ha in 2015 [
5], representing the second largest area of stone pine of the world.
Advances in sequencing and assembly technologies have allowed rapid progress in the characterization of the genomes of angiosperms, whereas for gymnosperms, such as conifers, the same has not occurred due to the complexity and higher size of their genomes. For instance, the mean size of genomes in the
Pinus genus and subgenus are 28.3 Gbs and 26.4 Gbs, respectively [
6]. The recent advances in the third generation of high-throughput sequencing technologies and the reduction in their cost allowed the sequencing of two pine genomes from the genus Pinus,
P. labertiana (GCA_001447015.2) and
P. taeda [
7].
Despite the scarce genomic information available for the stone pine, the characterization of the transcriptome even for species with no reference genome available can be performed using RNA-Seq. Transcriptome differences between different plant tissues have been well studied so far, providing a comprehensive characterization of the species transcriptome. Here, in order to explore the differences in the transcriptome between different tissues of stone pine, a transcriptome characterization of needles, xylem, stem bark, terminal bud, first and second year pine cones, and pine nuts, was performed using a de novo transcriptome assembly. This study provides, for the first time, transcriptome resources for seven different tissues of the stone pine, providing a valuable resource for further studies.
2. Materials and Methods
2.1. Sample Preparation, RNA Extraction, and Sequencing
Samples of different tissues (needles, xylem, stem bark, terminal bud, first and second year pine cones, and pine nuts) were collected from five trees located in Coruche (Portugal). Samples were immediately frozen in liquid nitrogen and stored at −80 °C until being processed. The RNA extraction was performed according to the method of Le Provost [
8] with minor modifications. The extracted RNA was sequenced in two different Illumina platforms, NextSeq 550 and HiSeq 4000, producing paired-end (PE) reads of 75 bp and 100 bp in length, respectively.
2.2. Sequencing Data, Transcriptome Assembly, and Annotation
The raw reads were pre-processed with Trimmomatic v.0.38 [
9], keeping reads with a minimum quality of 20, over a screen size window of 10% of the read length, and a minimum length of 80% of the read length. Then, the
de novo transcriptome assembly was performed using Mira v.4.0.2 [
10], discarding contigs shorter than 200 bp.
Gene prediction and transcriptome annotation was performed using TransDecoder v.5.5 [
11], following its guidelines. BlastP was used to functionally annotate the predicted genes, identifying homologous genes from the SWISS-PROT and nr-NCBI plant databases, and InterProScan was used to obtain protein domains, gene ontology (GO) terms, and KEGG pathways [
12,
13,
14,
15].
2.3. Tissue-Specific Characterization
In order to characterize the transcriptome at the tissue level, the pre-processed reads of all individuals were mapped against the assembled transcriptome with STAR v.2.7.3a [
16], using the two-pass mode according to the manual guidelines. The unique mapped reads were retained and used to estimate the RNA abundance of the predicted genes by means of StringTie (parameter used -e) [
17]. The tissue-specific characterization was performed taking into account only genes with an abundance ≥5 in at least one of the biological replicates in at least one tissue, considering those genes as genes expressed. Then, the BinGO plugin from Cytoscape was used to identify GOs overrepresented over the set of genes expressed in each tissue, performing a (BH) multiple-testing correction with a
p-value ≤ 0.05 [
18].
3. Results
3.1. Transcriptome Assembly and Annotation
A
de novo transcriptome assembly was generated from the sampled tissues. Sequencing of cDNA of all samples from both sequencing platforms generated a total of 2,026,716,380 PE reads. After trimming low-quality bases and removing low-quality reads with Trimmomatic, 1,898,376,282 high-quality reads were kept, representing 93.7% of the raw reads (
Table 1). The transcriptome assembly of stone pine resulted in 165,179 contigs equal or greater than 200 bp, which represented an accumulative assembly size of 81,310 Mb (
Table 2). A total of 55,328 candidate genes were identified by Transdecoder, of which 41,839 found at least one homologous hit against the SWISS-PROT database. The remaining predicted genes with no hits were further blasted against the nr-NCBI plants, with 8322 genes finding at least one homology hit.
Functional categories in terms of GOs and associated KEGG pathways were identified using InterProScan. A total of 28,258 (51.07%) predicted genes were assigned with at least one GO term, covering 2079 different GO terms (BP—biological processes: 41.75%; MF—molecular function: 45.46%; CC—cellular components: 12.94%). Moreover, 4134 predicted genes were successfully assigned to at least one KEGG pathway of the 124 identified, codifying 482 different enzymes.
3.2. Tissue-Specific Characterization
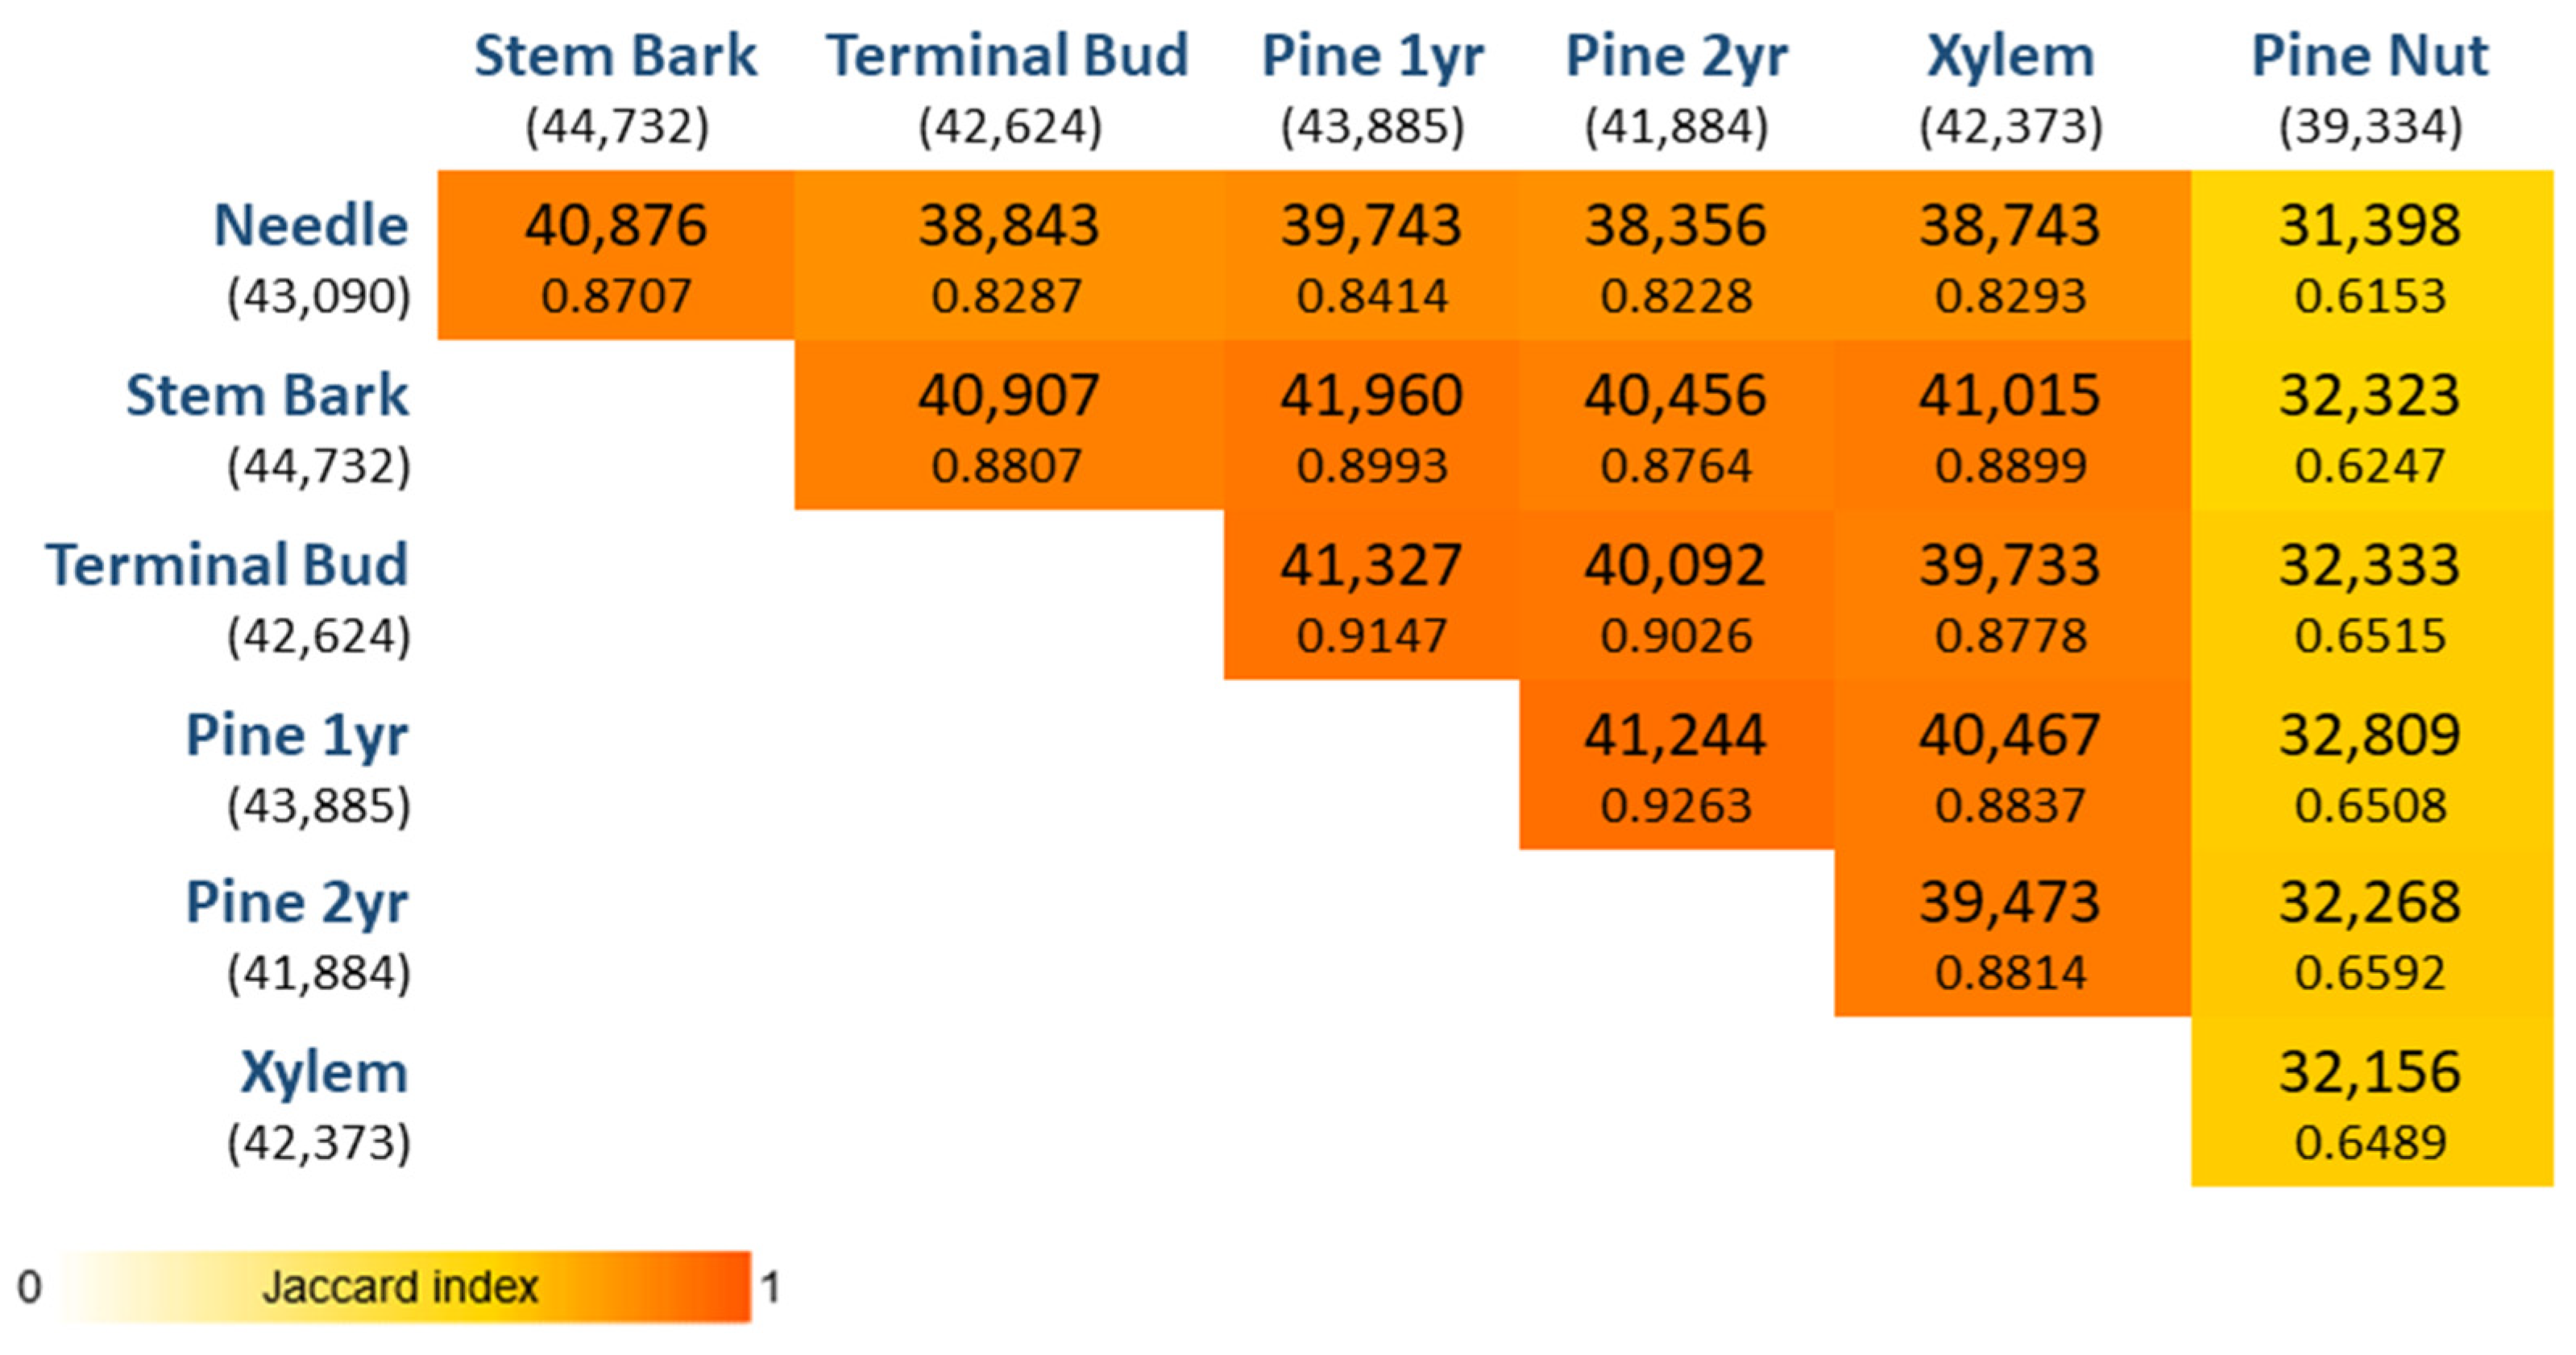
After removing genes with low abundances, the universe of expressed genes considered for the transcriptome characterization was 54,627, of which 30,137 genes were co-expressed in all tissues (
Figure 1). In addition, 5738 genes were found exclusively expressed in pine nuts, whereas in the other tissues the number of exclusively expressed genes was much lower (needles: 1087; stem bark: 212; xylem: 210; terminal bud: 143; first year pine cone: 74; second year pine cone: 21). By performing the pairwise comparisons of genes expressed per tissue, the pine nut tissue is the one with the lowest number of genes expressed in common with the other tissues. For instance, 5862 genes were co-expressed in all tissues but pine nut tissues. On the other hand, the two pine cone tissues, first year and second year, were the ones with the greatest similarity (the highest Jaccard index).
In order to understand the enrichment occurrence of overrepresented GO terms in each tissue, the proportion of genes expressed in each tissue was compared with the genes expressed overall among the transcriptome assembly. The analysis showed that 1170 GOs were found to be overrepresented among all tissues (BP: 683; MF: 284; CC: 203). When looking for exclusive overrepresented GO terms per tissue, a total of 409 overrepresented GO terms were found (
Table 3).
In terms of exclusively overrepresented GOs identified in each tissue, we observed that in pine nut tissue, most of them were related with seed maturation, initiation of transcription, translation and stored nutrient mobilization, cell expansion, root development, and cell division, among others, whereas those in needles were related with photosynthesis and energy metabolism. Additionally, metabolic processes associated with coenzymes and cofactors were related with exclusively overrepresented GOs in stem bark tissue and in terminal buds with the translation of elongation factors, cell structure, and cell wall organization. Finally, catalytic activities were related with exclusively overrepresented GOs in second-year pine cone tissue.
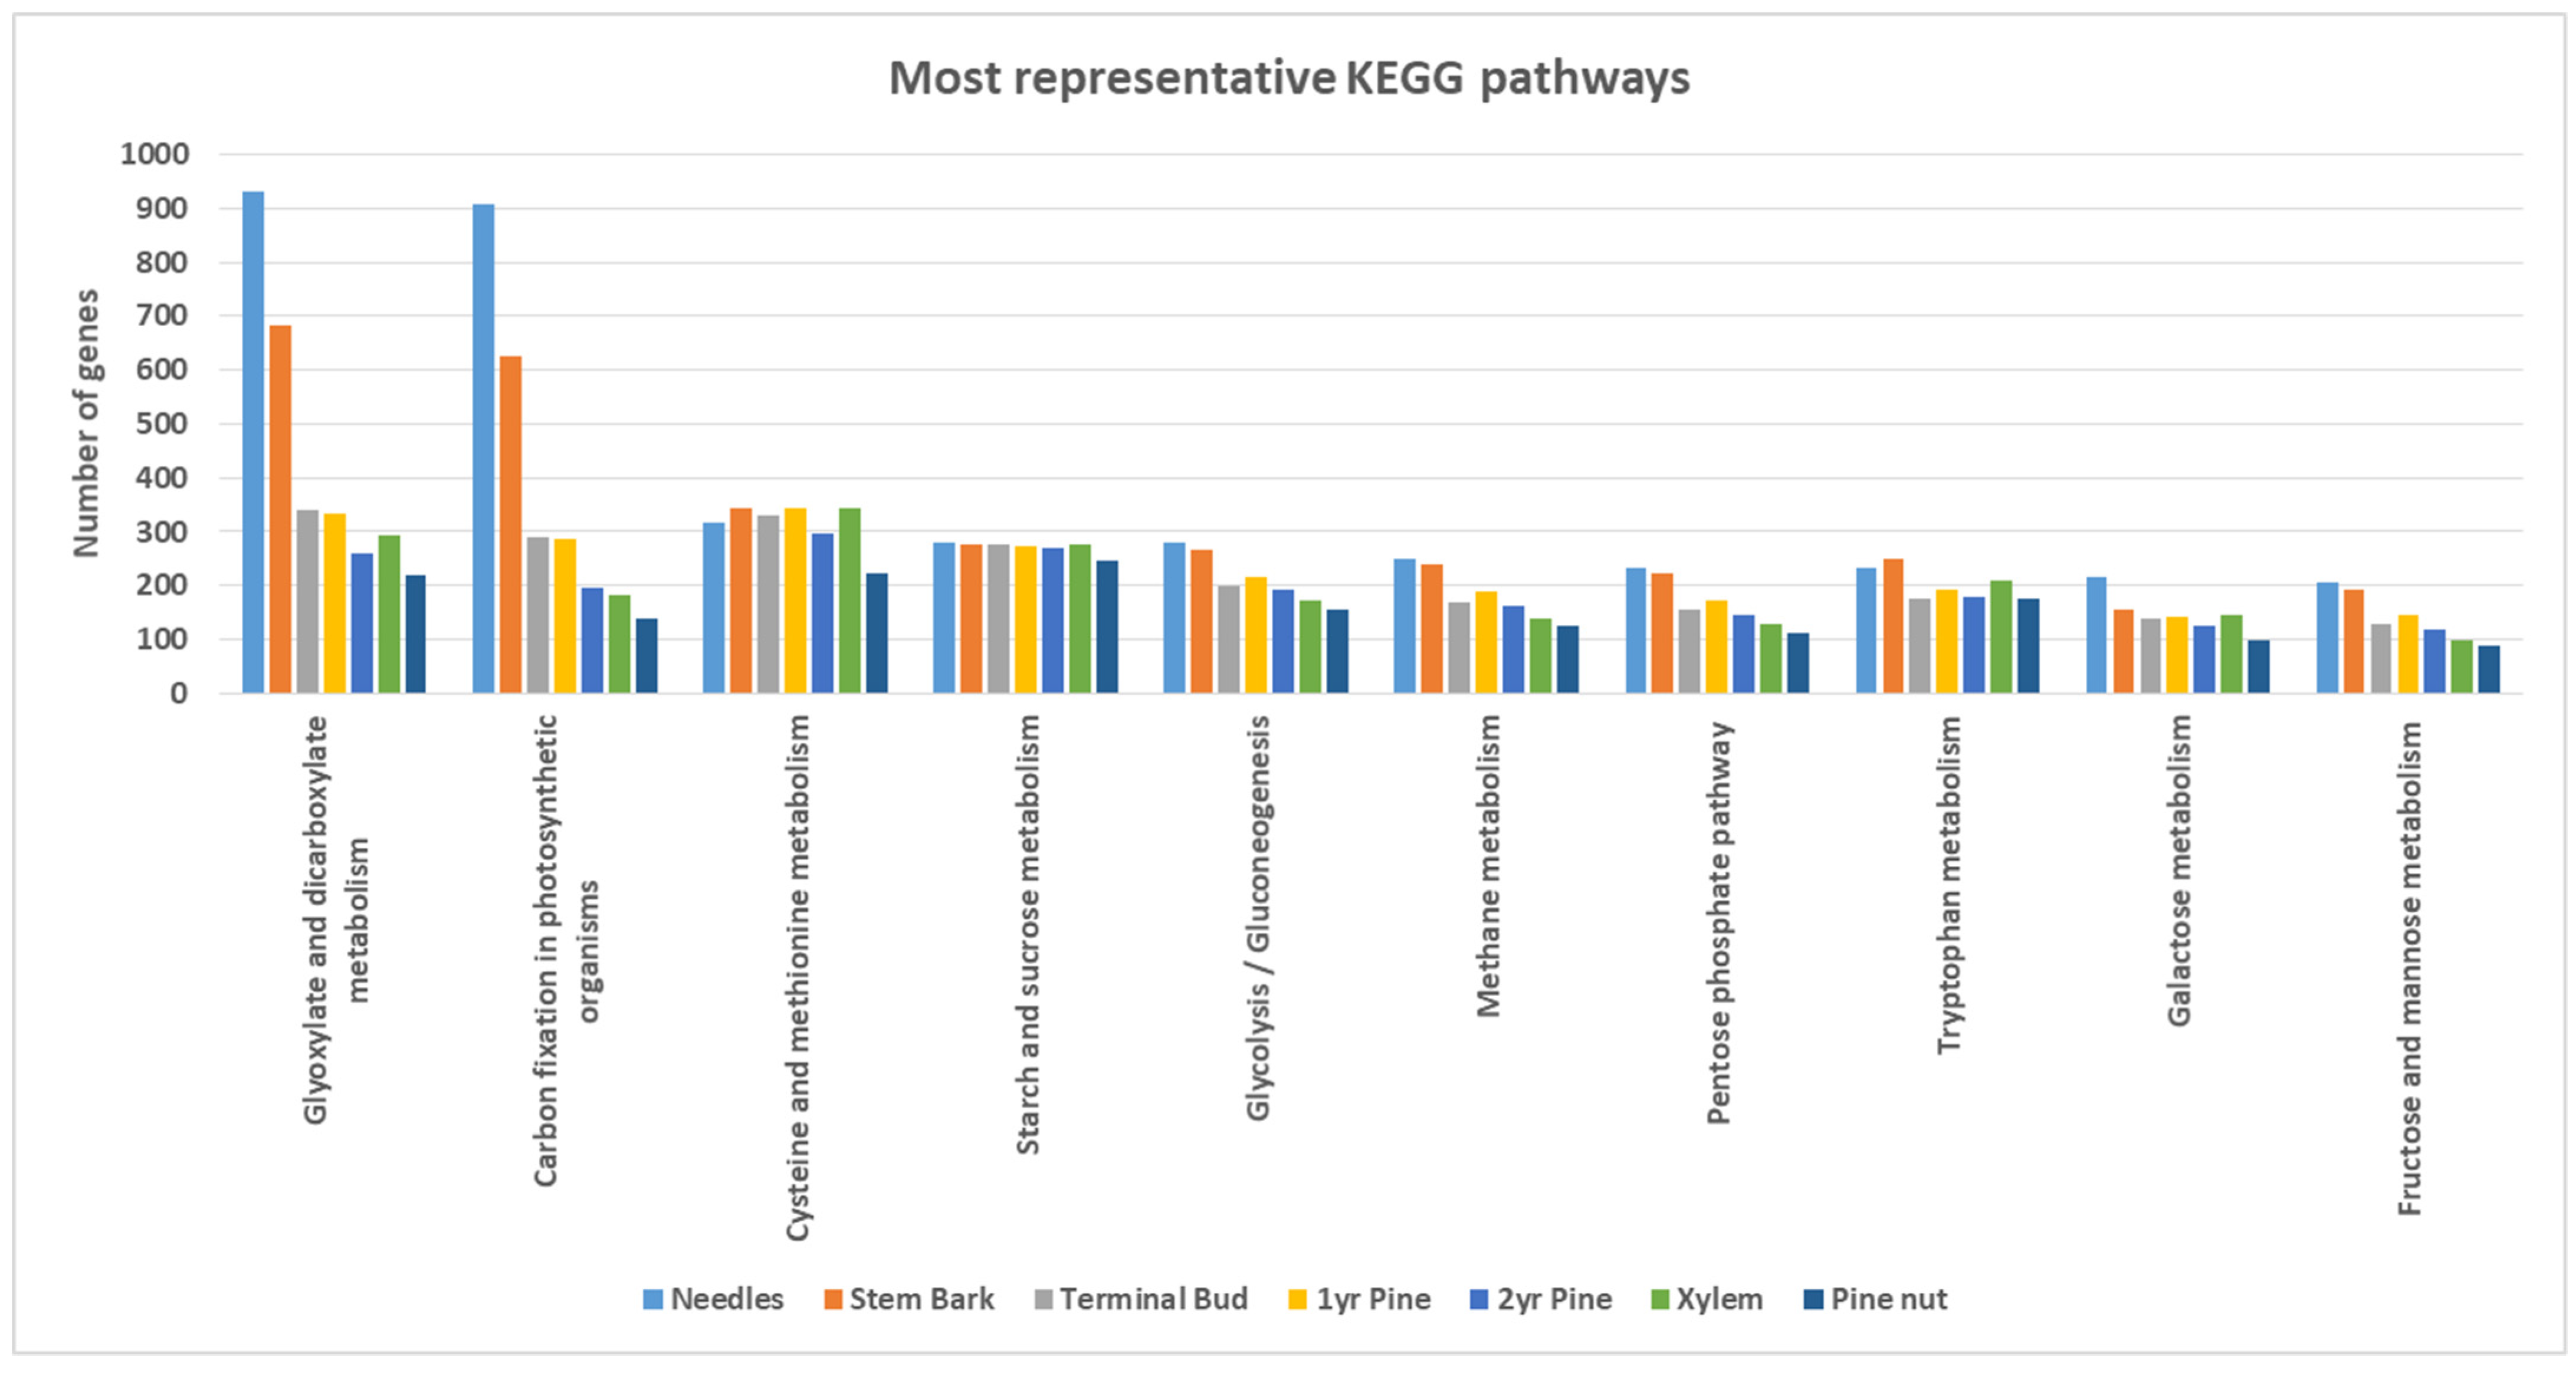
Regarding KEGG pathways, 482 different enzymes were codified by 4057 genes expressed among the whole transcriptome (needles: 3769; stem bark: 3474; terminal bud: 3067; first-year pine: 3114; pine nut: 2909; second-year pine: 2900; xylem: 2400). The most representative KEGG pathways per tissue are represented in
Figure 2. Clear differences were observed between needles and stem bark tissues in comparison with the other tissues. Both contained a higher number of expressed genes that were associated directly with energy metabolism, such as glycolysis; gluconeogenesis, and diverse sugar metabolism (galactose, fructose and mannose). The highest difference was observed in both of these tissues against the others in “Glyoxylate and dicarboxylate” and “Carbon fixation in photosynthetic organisms” metabolisms, which are usually more active in photosynthetic tissues.
4. Conclusions
This is the first time that a large-scale RNA-seq dataset was generated from seven different tissues from stone pines, providing a complete transcriptome characterization. The data produced in this process will be a useful resource for future studies on the species. The generated transcriptome assembly resulted in a total of 55,328 identified genes, of which 50,161 were functionally annotated. More studies are on-going in order to assess differences in gene expression between tissues in stone pine.
Author Contributions
This study was conceived by A.M.R. The collection and identification of field material was performed by A.U., B.M., M.A., C.L. and A.M.R. RNA extraction was performed by C.L. Bioinformatics data analyses were conducted by A.U., B.M. and M.A. Biological interpretation of the results was conducted by A.U., B.M. and L.M. The manuscript was written by A.U. and L.M. All authors have read and agreed to the published version of the manuscript.
Funding
This work was co-financed by Program Alentejo 2020, through the European Fund for Regional Development under the scope of SelectPinea- Development of genetic markers for relevant traits in stone pine (ALT20-03-0145-FEDER-000041). Contrato–Programa to L.M. (CEECINST/00131/2018) and UIDB/05183/2020 were funded by FCT.
Institutional Review Board Statement
Not applicable.
Informed Consent Statement
Not applicable.
Data Availability Statement
Raw read files are available at NCBI Sequence Read Archive under the accession PRJNA827975.
Conflicts of Interest
The authors declare no conflict of interest.
References
- Quézel, P.; Médail, F. Ecologie et Biogéographie des Forêts du Bassin Méditerranéen; Elsevier: Amsterdam, The Netherlands, 2003; p. 574. ISBN 2-84299-451-5. [Google Scholar]
- Nergiz, C.; Dönmez, I. Chemical composition and nutritive value of Pinus pinea L. seeds. Food Chem. 2004, 86, 365–368. [Google Scholar] [CrossRef]
- Bolling, B.W.; Chen, C.Y.; McKay, D.L.; Blumberg, J.B. Tree nut phytochemicals: Composition, antioxidant capacity, bioactivity, impact factors. A systematic review of almonds, Brazils, cashews, hazelnuts, macadamias, pecans, pine nuts, pistachios and walnuts. Nutr. Res. Rev. 2011, 24, 244–275. [Google Scholar] [CrossRef] [PubMed] [Green Version]
- Evaristo, I.; Batista, D.; Correia, I.; Correia, P.; Costa, R. Chemical profiling of Portuguese Pinus pinea L. nuts. J. Sci. Food Agric. 2010, 90, 1041–1049. [Google Scholar] [CrossRef] [PubMed]
- ICNF. 2019. Available online: http://www2.icnf.pt/portal/florestas/ifn/resource/doc/ifn/ifn6/IFN6_Relatorio_completo-2019-11-28.pdf (accessed on 28 August 2021).
- Grotkopp, E.; Marcel, R.; Sanderson, M.J.; Rost, T.L. Evolution of genome size in pines (Pinus) and its life-history correlates: Supertree analyses. Evolution 2004, 58, 1705–1729. [Google Scholar] [CrossRef]
- Zimin, A.V.; Stevens , K.A.; Crepeau, M.W.; Puiu, D.; Wegrzyn, J.L.; Yorke, J.A.; Langley, C.H.; Neale, D.B.; Salzberg, S.L. An improved assembly of the loblolly pine mega-genome using long-read single-molecule sequencing. Gigascience 2017, 6, 1–4. [Google Scholar] [CrossRef] [PubMed]
- Le Provost, G.; Herrera, R.; Paiva, J.A.P.; Chaumeil, P.; Salin, F.; Plomion, C. A micromethod for high throughput RNA extraction in forest trees. Biol. Res. 2007, 40, 291–297. [Google Scholar] [CrossRef] [PubMed] [Green Version]
- Bolger, A.M.; Lohse, M.; Usadel, B. Trimmomatic: A flexible trimmer for Illumina sequence data. Bioinformatics 2014, 30, 2114–2120. [Google Scholar] [CrossRef] [PubMed] [Green Version]
- Chevreux, B.; Suhai, S. Genome Sequence Assembly Using Trace Signals and Additional Sequence Information. Ger. Conf. Bioinform. 1999, 99, 45–56. [Google Scholar]
- Haas, B.; Papanicolaou, A.J.G.S. TransDecoder (Find Coding Regions within Transcripts) Version 5.5.0. Available online: http://transdecoder.github.io (accessed on 28 August 2021).
- Camacho, C.; Coulouris, G.; Avagyan, V.; Ma, N.; Papadopoulos, J.; Bealer, K.; Madden, T.L. BLAST+: Architecture and applications. BMC Bioinform. 2009, 10, 421. [Google Scholar] [CrossRef] [PubMed] [Green Version]
- Boeckmann, B.; Bairoch, A.; Apweiler, R.; Blatter, M.C.; Estreicher, A.; Gasteiger, E.; Martin, M.J.; Michoud, K.; O’Donovan, C.; Phan, I.; et al. The SWISS-PROT protein knowledgebase and its supplement TrEMBL in 2003. Nucleic Acids Res. 2003, 31, 365–370. [Google Scholar] [CrossRef]
- Wheeler, D.L.; Barrett, T.; Benson, D.A.; Bryant, S.H.; Canese, K.; Chetvernin, V.; Church, D.M.; DiCuccio, M.; Edgar, R.; Federhen, S.; et al. Database resources of the National Center for Biotechnology Information. Nucleic Acids Res. 2018, 46, D8–D13. [Google Scholar] [CrossRef] [Green Version]
- Jones, P.; Binns, D.; Chang, H.Y.; Fraser, M.; Li, W.; McAnulla, C.; McWilliam, H.; Maslen, J.; Mitchell, A.; Nuka, G.; et al. InterProScan 5: Genome-scale protein function classification. Bioinformatics 2014, 30, 1236–1240. [Google Scholar] [CrossRef] [PubMed] [Green Version]
- Dobin, A.; Davis, C.A.; Schlesinger, F.; Drenkow, J.; Zaleski, C.; Jha, S.; Batut, P.; Chaisson, M.; Gingeras, T.R. STAR: Ultrafast universal RNA-seq aligner. Bioinformatics 2013, 29, 15–21. [Google Scholar] [CrossRef]
- Pertea, M.; Pertea, G.M.; Antonescu, C.M.; Chang, T.C.; Mendell, J.T.; Salzberg, S.L. StringTie enables improved reconstruction of a transcriptome from RNA-seq reads. Nat. Biotechnol. 2015, 33, 290–295. [Google Scholar] [CrossRef] [Green Version]
- Maere, S.; Heymans, K.; Kuiper, M. BiNGO: A Cytoscape plugin to assess overrepresentation of Gene Ontology categories in Biological Networks. Bioinformatics 2005, 21, 3448–3449. [Google Scholar] [CrossRef] [PubMed] [Green Version]
| Publisher’s Note: MDPI stays neutral with regard to jurisdictional claims in published maps and institutional affiliations. |
© 2022 by the authors. Licensee MDPI, Basel, Switzerland. This article is an open access article distributed under the terms and conditions of the Creative Commons Attribution (CC BY) license (https://creativecommons.org/licenses/by/4.0/).


 ,
, 

