Proceeding Paper

Tomato Fruit Development in Response to Different Irrigation Practices: Developmental Study of Pericarp Cell Layers †

1
Faculty of Agriculture, University of Belgrade, Nemanjina 6, 11080 Belgrade-Zemun, Serbia
2
INRA, UR1115, Plantes et Systèmes de Culture Horticoles, Site Agroparc Domaine St Paul, CS40509, CEDEX 9, 84914 Avignon, France
3
Faculty of Biofarming, Megatrend University, Bulevar Maršala Tolbuhina 8, 11070 Belgrade, Serbia
*
Author to whom correspondence should be addressed.
Presented at the 1st International Electronic Conference on Plant Science, 1–15 December 2020; Available online: https://iecps2020.sciforum.net/.
Biol. Life Sci. Forum 2021, 4(1), 105; https://doi.org/10.3390/IECPS2020-08855
Published: 2 December 2020
(This article belongs to the Proceedings of The 1st International Electronic Conference on Plant Science)

Abstract

:
Many vegetable crop plants, including tomato, have high water needs and one of the options to overcome the negative effects of water reduction on yield is the use of deficit irrigation methods. Detailed knowledge on the effects of different irrigation methods on fruit developmental processes could be a critical factor in the analysis of the effect on final yield. It is well known that water reduction limits the fruit growth rate and final fruit size in tomato, as a consequence of impact on cell division and expansion processes. This paper reviews roles of cellular traits in the responses of tomato fruit growth to deficit irrigation (DI) which were assessed using the wild-type (WT) and its flacca mutant deficient in plant hormone abscisic acid (ABA). We specifically addressed how the cell number, cell size and setup of pericarp cell layers were affected by water deficit during development. Fruits of flacca in optimal irrigation are smaller as a consequence of smaller-sized cells in the pericarp. DI induced a stronger negative effect on cell division and expansion in flacca than in WT at an early stage. However, the effects of DI were similar in flacca and WT in ripe fruits. The main difference between flacca and WT responses to water restriction was a stronger negative impact during the early cell division in flacca, which is consistent with the involvement of ABA in the cell division process and water stress-induced ABA synthesis in WT.

1. Introduction

It is of global importance to apply suitable irrigation strategies which could help to save irrigation water while minimizing yield reduction. Deficit irrigation (DI) has been suggested to increase water use efficiency (WUE) with minimal yield reduction. It is well known that water reduction could limit the fruit growth rate and final fruit yield in tomato [1] as well as in other fruit species [2,3,4,5]. Therefore, detailed knowledge on the effects of water deficit on certain fruit developmental processes could be a critical factor in analyzing the effect on the final yield [3]. The different tomato fruit growth stages are not equally sensitive to water deficit. It is known that both the flowering and fruit stages are the most sensitive to water deficits [6]. Chen et al. [7] also underlined the sensitivity of the fruit maturity stage. For example, under DI, the cell number remained unchanged in olive [3,8,9] and pear fruits [2], but the cell size decreased in both fruit types. Both cell division and expansion are the key controlling factors for the tomato fruit size [10,11], but as far as we know there is not sufficient data on the effect of DI on the tomato pericarp cell number [12]. Only a few studies have addressed the impact of the environment, genotype or environment × genotype interactions on tomato fruit growth and the pericarp structure [12,13,14,15]. However, none of these studies analyzed the pericarp histology by combining quantitative (enzymatic digestion) and qualitative (cross-section) methods. In this study, we use the pectinase solution for cell counting per volume as an adequate method for obtaining a precise number of pericarp cells in the whole tomato fruit since the use of the cross-sectional plane of sectioning could not provide this trait. On the other hand, pericarp cross sections could provide the reliable cell size distribution through the cell layer and the overview of the cell size (diameter, area, perimeter) during the fruit development, which could not be obtained by means of the enzymatic digestion method. The combination of these two methods could provide more information in order to determine which process makes the greatest contribution to the final fruit size during the tomato fruit growth, especially under DI conditions.

2. Experiments

2.1. Plant Material, Growing Conditions, and Soil Water Content

Tomato plants, cv. Ailsa Craig (WT) and its mutant flacca were grown. Flacca was partially impaired in different steps of the ABA biosynthesis route, since there is a mutation on the gene which encodes the enzyme for transforming the ABA aldehyde into ABA. Consequently, the ABA concentration in the above-ground parts of the flacca plants amounts to around 23% in WT [16]. The low content of endogenous ABA resulted in more open stomata and increased transpiration at the level of the whole plant. Flacca was lower and had curly and smaller leaves than WT. The shoot–stem ratio in flacca was higher than in WT, which indicated that the root growth was even more reduced than the shoot growth [17].
Then, plants were grown into pots (one plant per pot, volume of the pot was 20 dm3) filled with the substrate Potgrond H-Klasmann (Germany) and grown in a chamber under controlled conditions (photoperiod 14h; light intensity at the plant level 300 μmoL m−2 s−1, day/night temperature 25/18 °C and relative humidity 70%). Ten plants of both genotypes (5 per treatment and per genotype) were subjected to two irrigation treatments: Full Irrigation (FI) and Deficit Irrigation (DI) which were 70% of FI. The volumetric soil water content (θ) of both compartments of each pot was measured daily using TDR probes (Campbell Scientific, Inc., Logan, UT, USA) at 20 cm depth.

2.2. Fruit Growth Parameter Measurements

The age of individual reproductive organs was assessed by noting the dates of full flower opening (anthesis). The fruit fresh weight was measured by sampling fruits throughout the whole period of fruit development from 8 to 55 days after anthesis (daa), regardless of their position on flower trusses. Fruit growth rates were estimated for the whole fruit growth period according to these data. Gompertz functions y = a*exp(−exp(−(x − c)/b)) [18] were fitted to fruit fresh weight measurements. Adjustment was performed on pooled data from five replicate plants per treatment (R2 > 0.95).

2.3. Histological Analyses

For histological analyses, the first five fruit of the third and fifth trusses were harvested at 3, 5, 8, 10, 12, 20, 39, 42, 44, and 55 daa. One half of the fruit pericarp was used for measuring the total cell number and mean cell size using the method of cell separation by pectinase solution described in Bertin et al. [11]. The other pericarp half was used for the histological analysis, and microslides were prepared according to Ruzin [19]. Pericarp sections were observed with a Leica DMLS microscope and images were acquired with a Leica DC300 digital camera. For the mean and individual cell size measurements, we used the public domain Image J software [20]. The individual size of the sections was estimated using the “analyze particles” tool of Image J, after manually adjusting the segmentation threshold.
To further analyze the effects of irrigation on the establishment of the pericarp pattern and cell growth kinetics within the pericarp, we numbered the different cell layers on equatorial cross sections, as illustrated for one developmental stage in Figure 4A. At anthesis, we identified about seven layers, four of them in the external part: E1 (outer epidermis), E2, E3, E4, and three of them in the inner part: I1 (inner epidermis), I2, I3. After fertilization, new cell layers were generated, mainly from periclinal divisions of the outer sub-epidermal layer (E2 successively giving rise to E2a, E2b, E2c, etc.) and, to a lesser extent, from divisions of the inner sub-epidermis (I2 generating I2a, I2b, etc.).

2.4. Statistical Analysis

A two-way repeated-measures ANOVA was used to determine the main effects of fruit age and irrigation treatment on the fruit traits for each genotype separately. For those traits that significantly varied in response to the treatment, comparisons were performed by the Tukey HSD test to detect significant differences from FI at p < 0.05. To obtain more precise insight into the effects on the cell area (cross section), differences between genotypes and treatments observed at 20 daa and 55 daa were analyzed separately by the Unequal HSD test. Statistical analysis was carried out using the statistical package STATISTICA (StatSoft, Tulsa, OK, USA).

3. Results

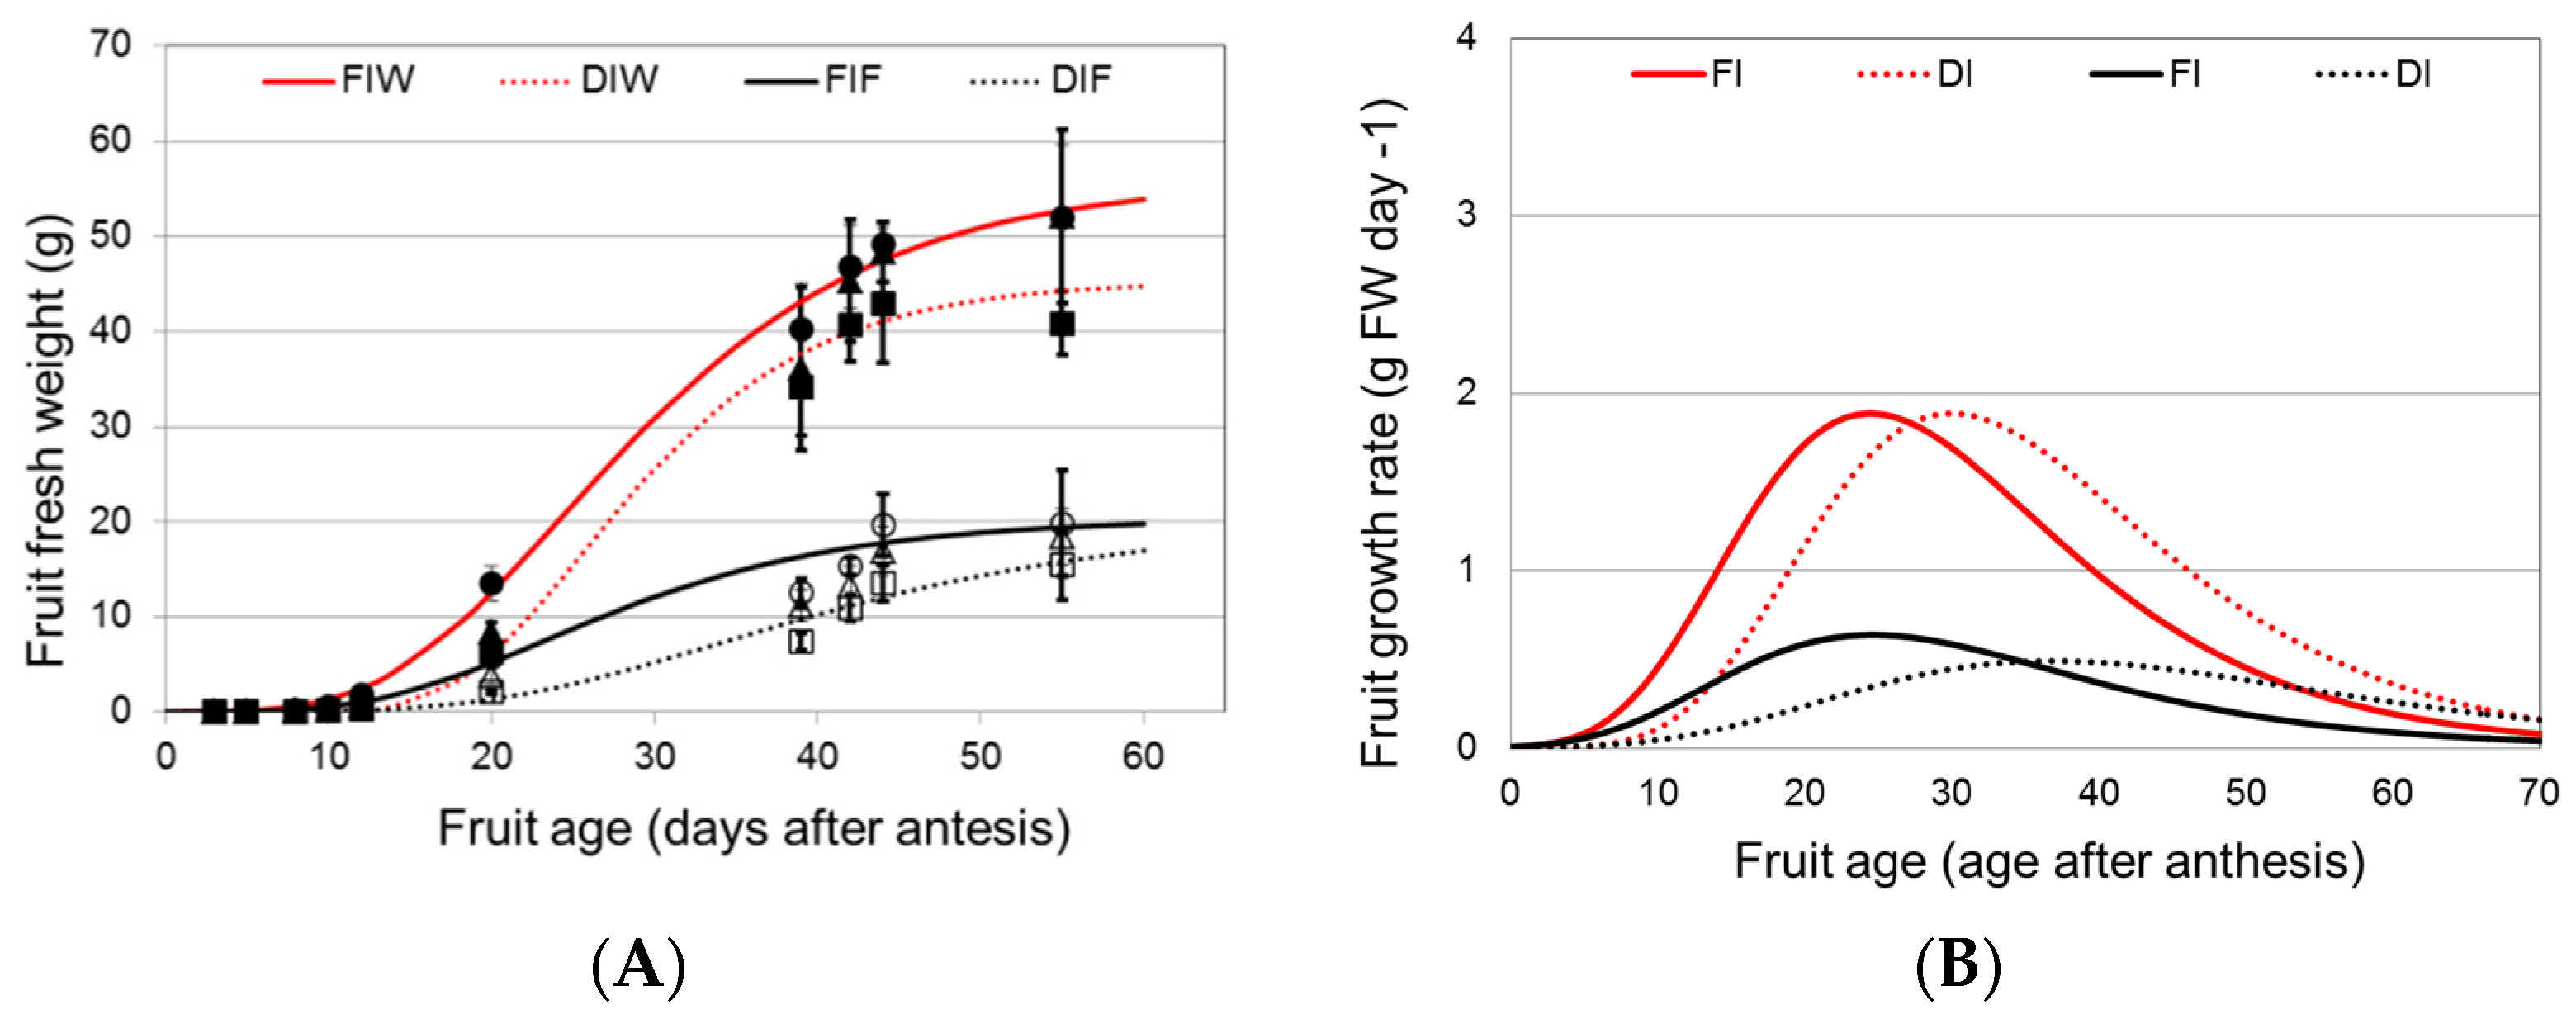
3.1. Effects of DI Treatment on Fruit Growth and Fresh Weight

The fruit fresh weight over time (Figure 1A) and fruit growth rate (Figure 1B) measured under FI were reduced in flacca compared with the WT (19.6 g in flacca and 53.9 g in WT). However, the final fruit fresh weight of both genotypes was lower in DI than in FI (17% and 16% for WT and flacca, respectively) (Figure 1A). In WT, the fruit growth rate (Figure 1B) was similar under both treatments, but the onset of rapid fruit growth was delayed by about 5 days in DI. In flacca, DI also delayed the onset of fruit growth, but the fruit grew over a longer period. The maximum fruit growth rate in flacca was slightly higher under FI than under the DI treatment and occurred earlier (25 daa) than under DI (around 35 daa).

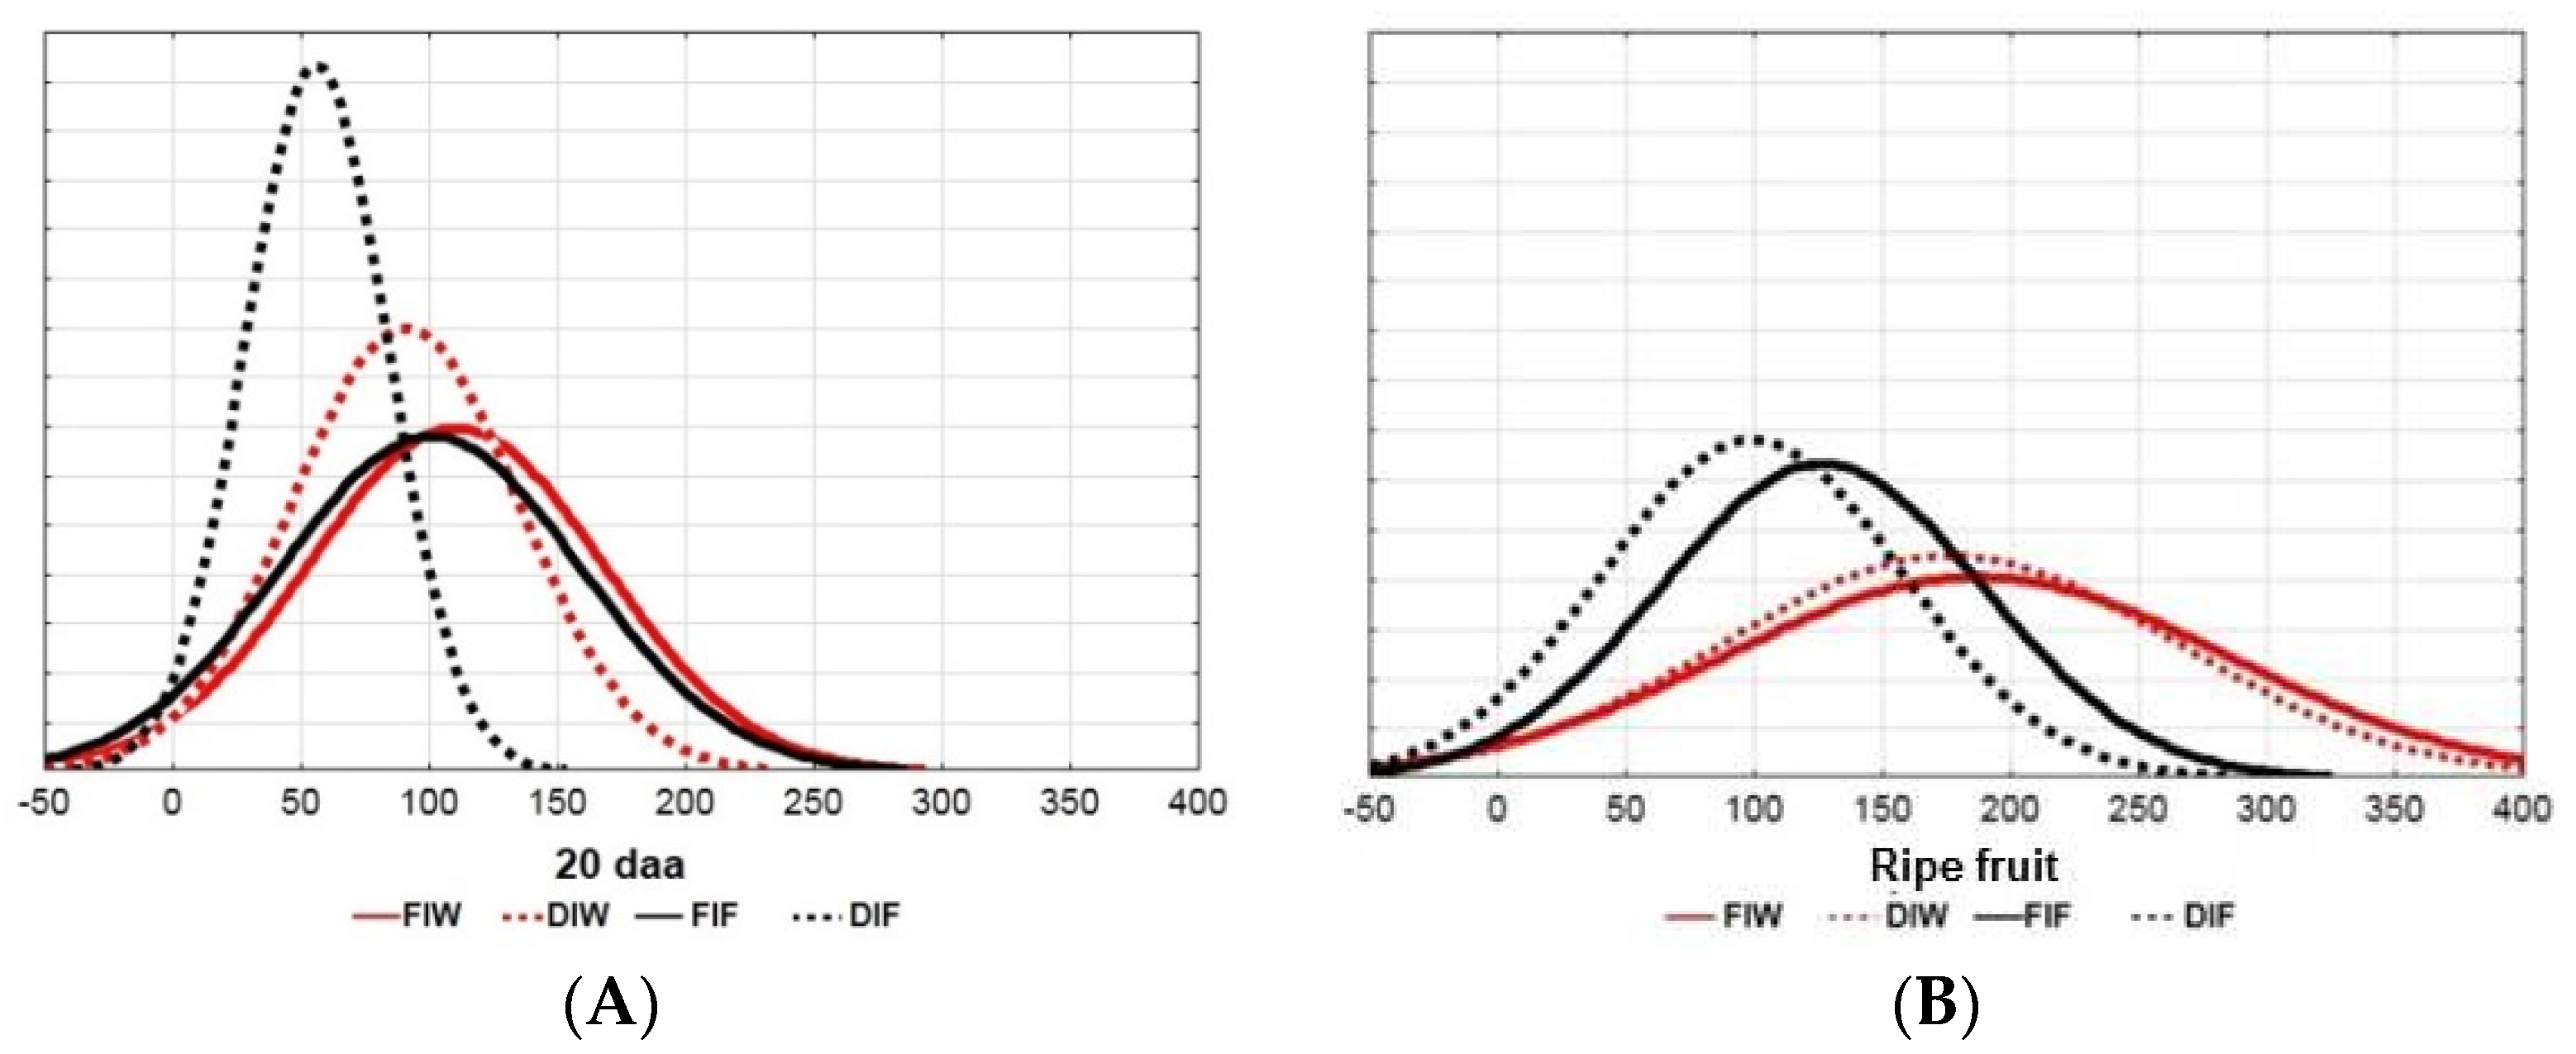
3.2. Effects of DI on the Pericarp Cell Number and Cell Area

The total cell number in the pericarp increased until 20 daa in WT and flacca, suggesting a similar period of cell division in both genotypes. However, the final cell number was 1.6 times higher in WT than in flacca in FI, and this difference was significant (p < 0.001). The first difference among treatments was noted at 8 daa, suggesting a lower division rate in flacca. In WT, the final cell number was, 2.02 × 10⁶, significantly higher (p < 0.05) in FI than in the other treatment (1.76 × 10⁶ for DI). In flacca, the final cell number was 1.27 × 10⁶ in FI and 1.09 × 10⁶ in DI.
Figure 2 shows the fitted distribution of the cell areas measured on the pericarp sections at 20 daa and at the ripe stage. At 20 daa (Figure 2A), the range of cell areas was similar for WT and flacca under FI, while in ripe fruits (Figure 2B), the cell sizes were larger and more heterogeneous in WT than in flacca. At 20 daa, in WT the pericarp cells were smaller and less heterogeneous in DI than in FI, with significant differences between FI and DI (p < 0.01). In flacca, the cell areas were lower (p < 0.01) in DI than in FI and the ranges were very narrow (Figure 2A), indicating a small and homogeneous cell size in the whole pericarp under DI. At the ripe stage (Figure 2B), the cell size distributions were similar between treatments in WT fruits, whereas in flacca, the pericarp cells were significantly smaller in DI than in FI.

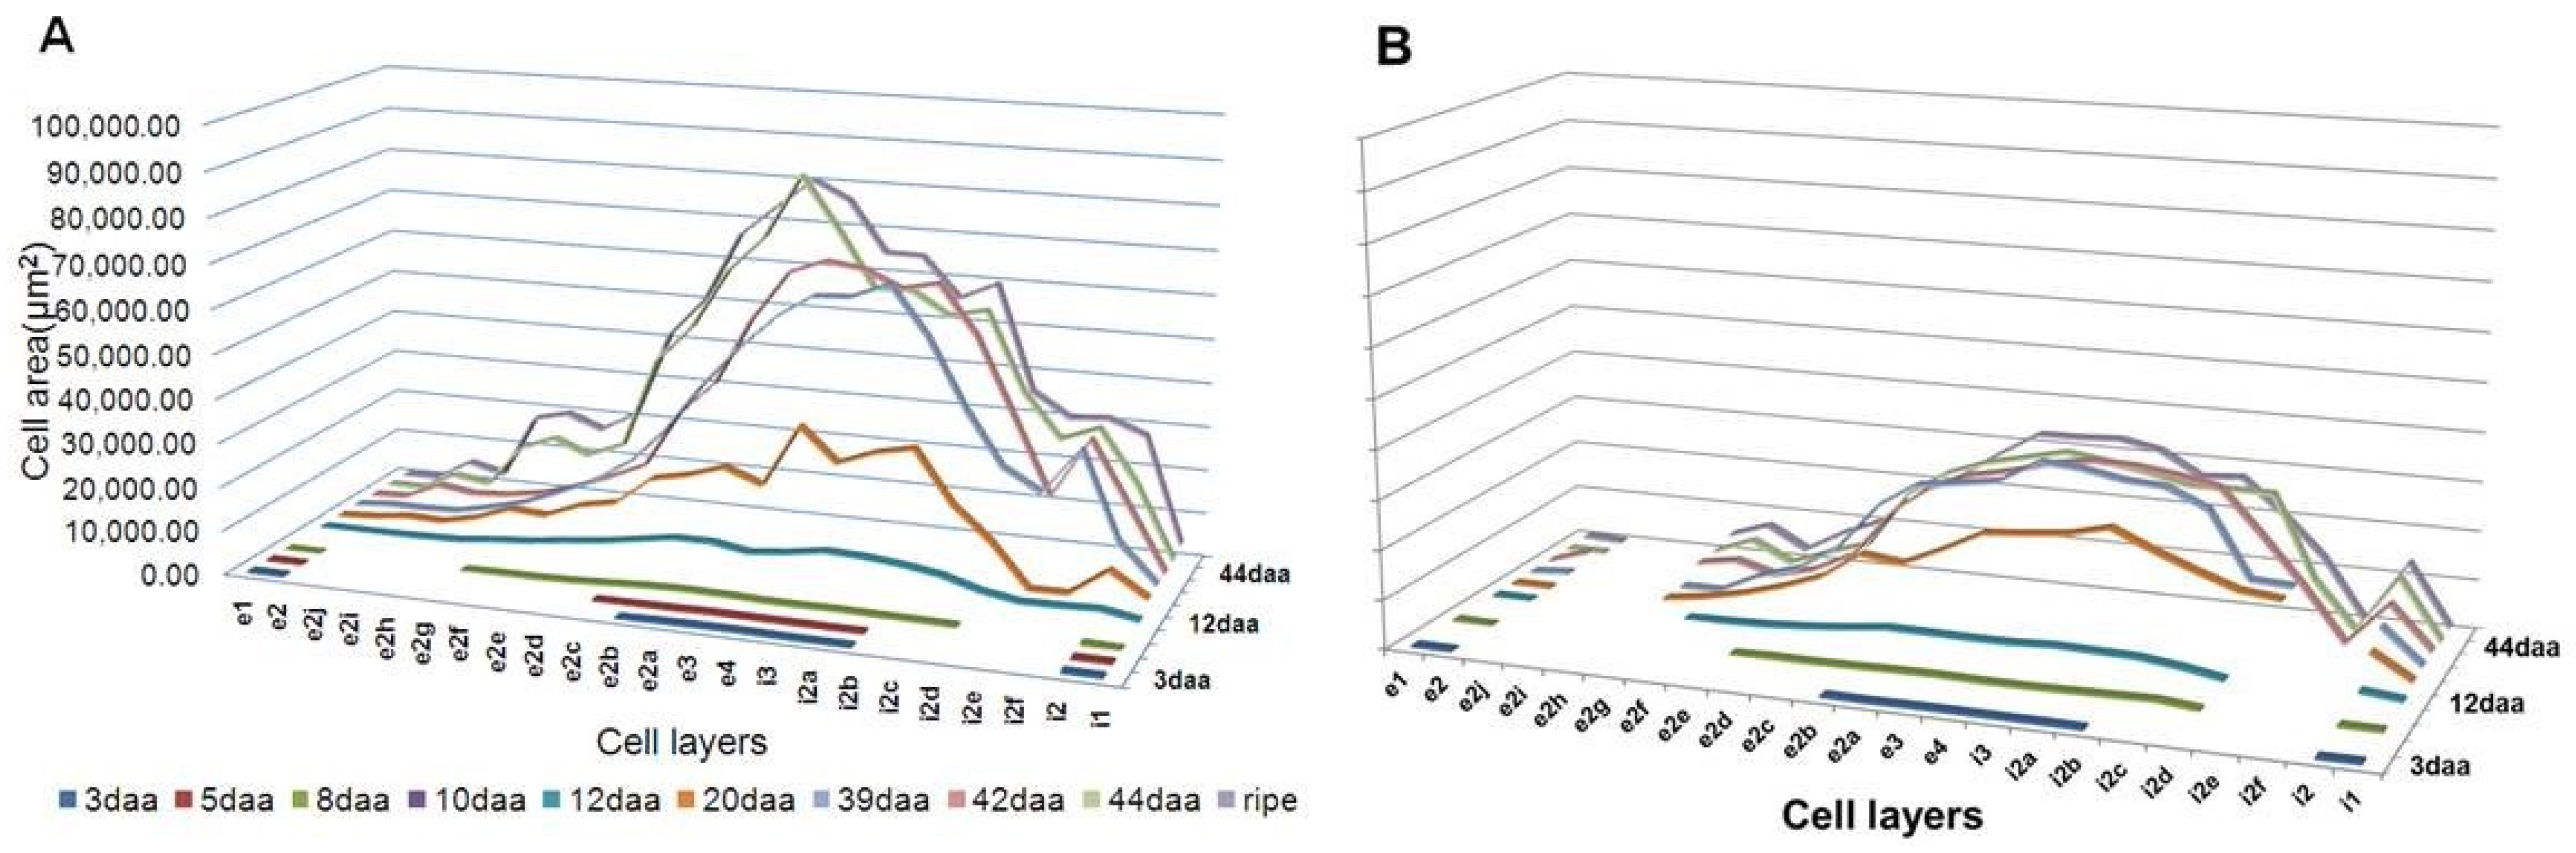
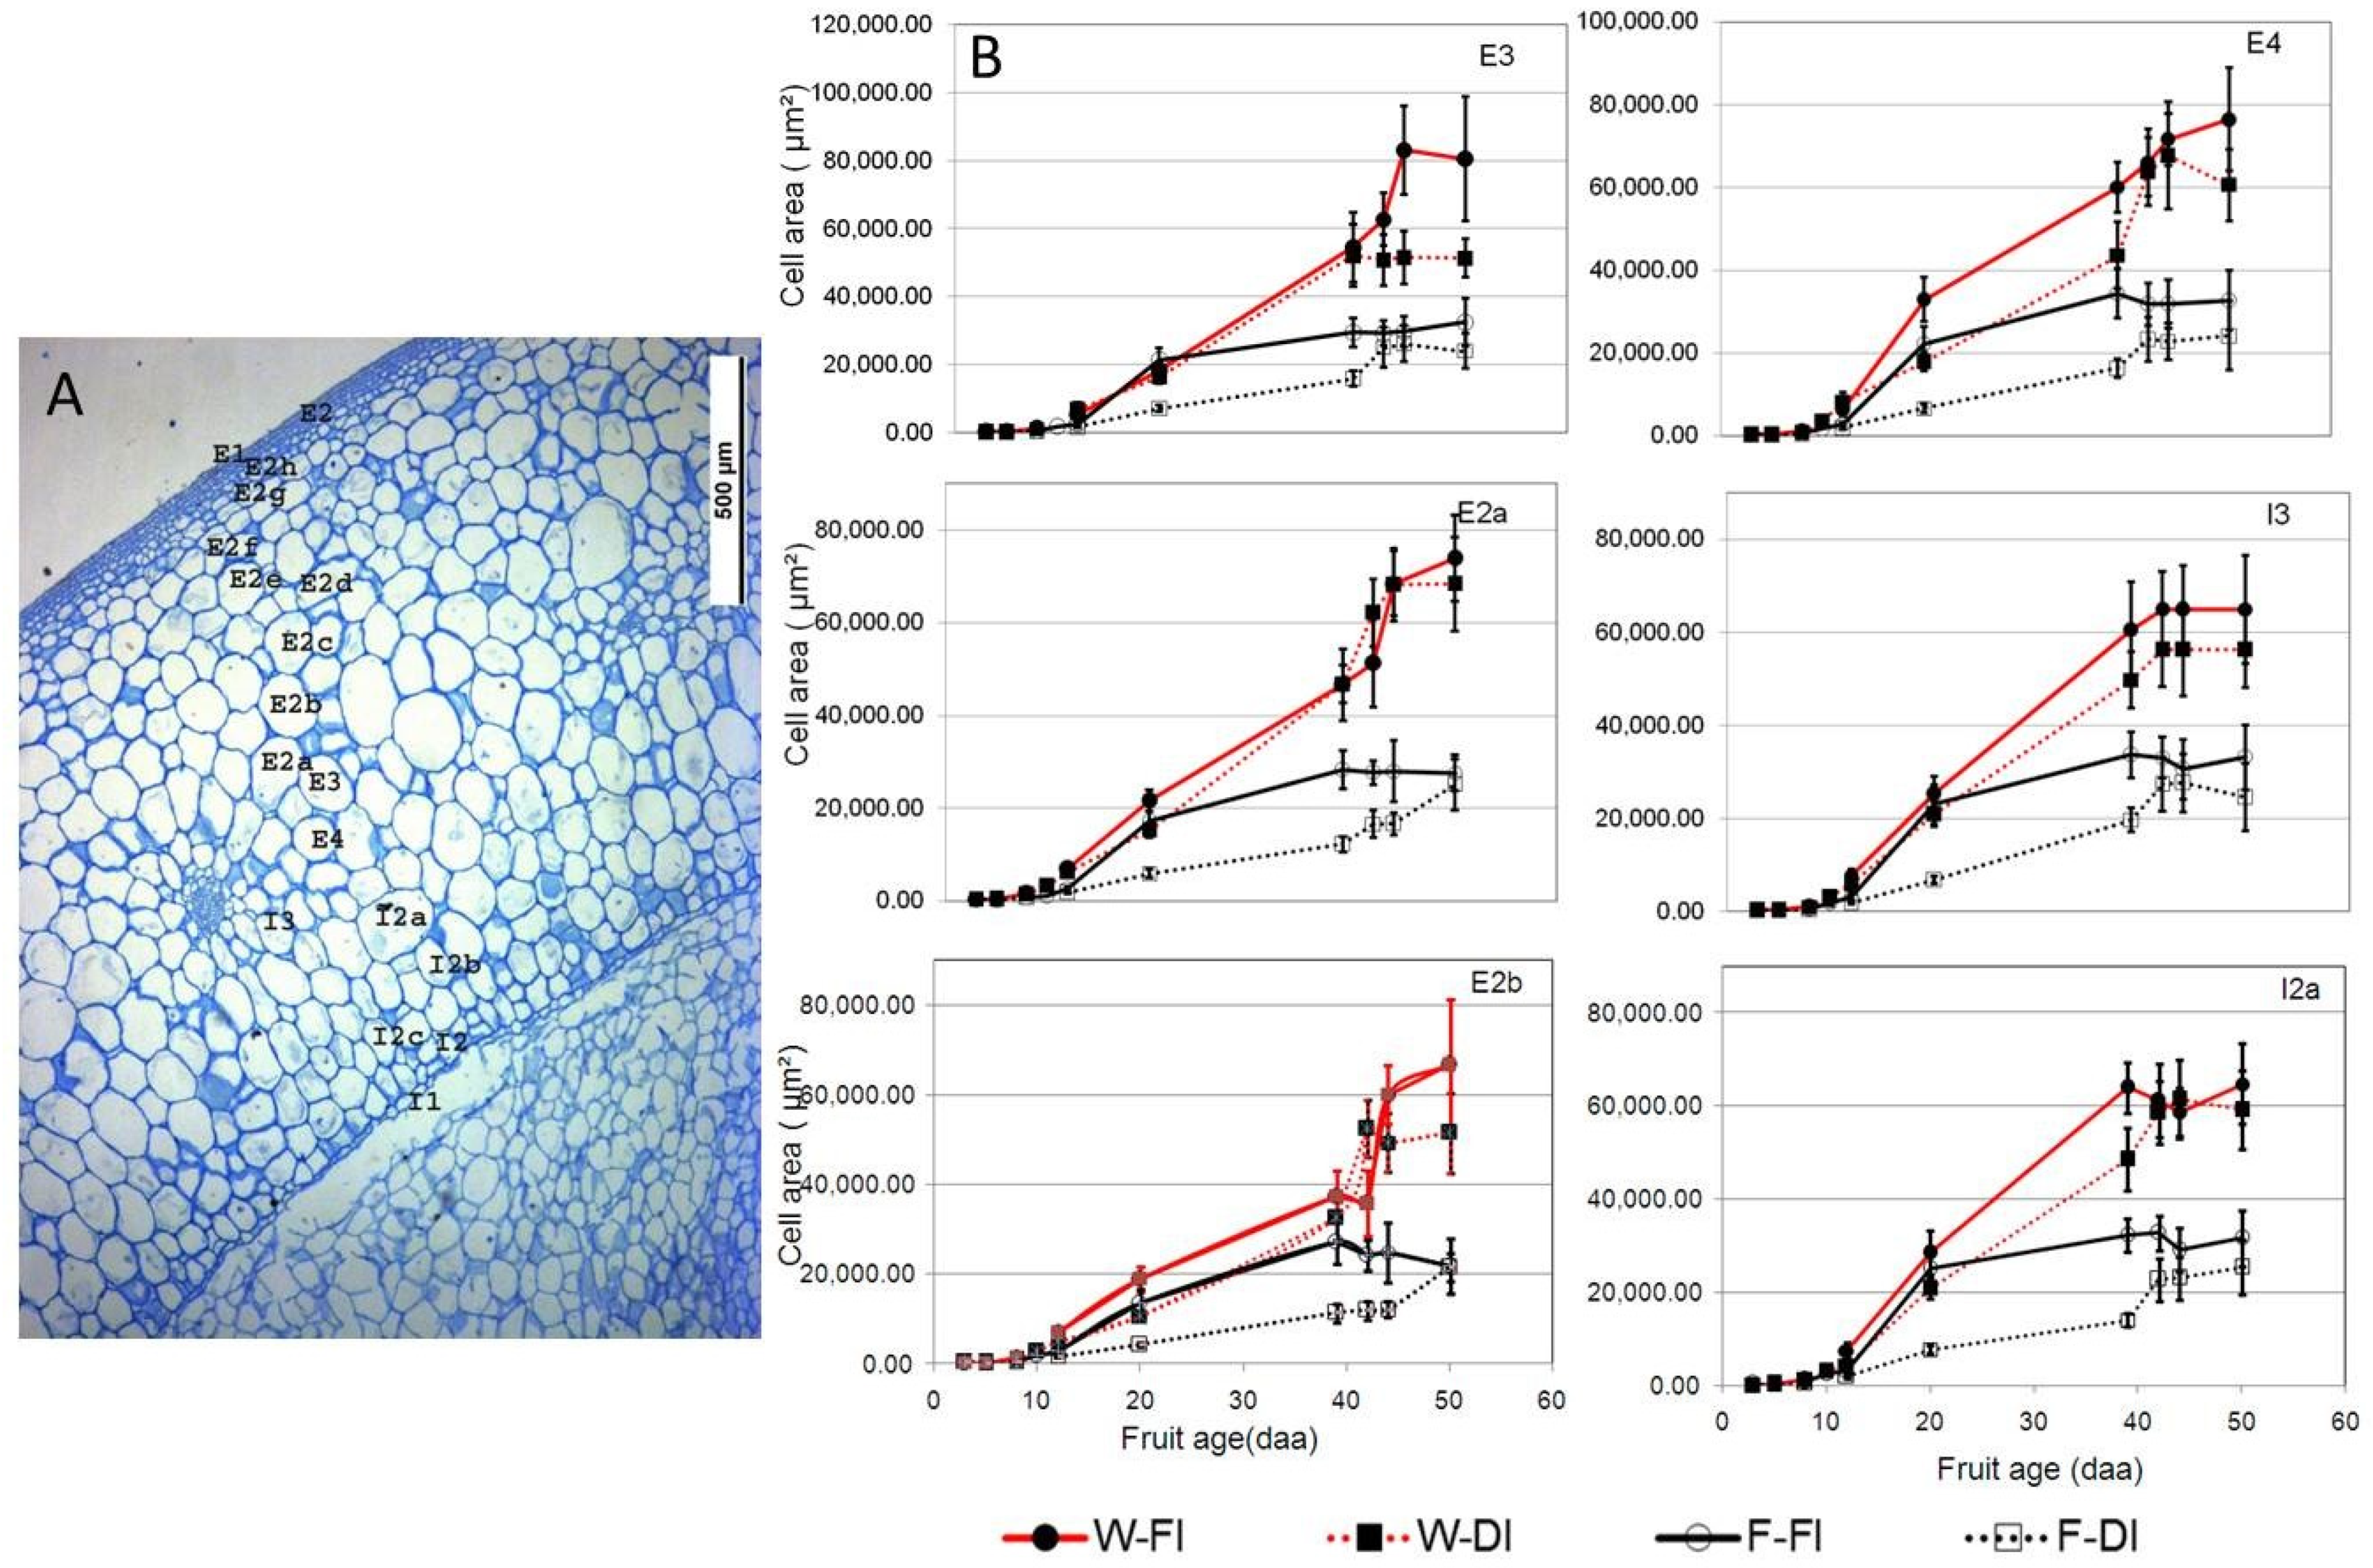
3.3. Effects of DI on Cell Growth Kinetics of Different Pericarp Cell Layers

In situ analysis of the cell size combined with the identification of cell layers allowed us to visualize the spatial distribution of cell sizes (the mean cell size per cell layer) according to their position in the pericarp in FI for WT (Figure 3A) and flacca (Figure 3B).
Cell expansion was more limited in all cell layers and the cell layers were less numerous in flacca than in the WT in control condition. In the early stages (from 3 to 8 daa), the cell size was homogeneous in all cell layers in both genotypes and ranged from 125 to 420 µm2. The cell sizes became heterogeneous from 10 daa, when cells of the most central cell layers underwent a rapid expansion, while the outer and inner epidermis cells remained small. The number of cell layers increased rapidly and then remained stable from about 12 daa in WT, but still increased until 42 daa in flacca as new cell layers were generated later in the inner pericarp. At the ripe stage, 23 and 19 cell layers were observed in WT and flacca, respectively. As regards to the newly formed cell layers, a gradient in the cell size was observed: the first formed cells (E2a, E2b and I2a, I2b) began to grow first and reached a larger size than cells generated later on (E2c to E2j and I2c to I2f).
At 12 daa in WT, fewer cell layers were generated in DI conditions (15) compared with FI (23), and these differences were maintained, to a lesser extent, until the ripe stage. To determine which of the pericarp layers were the most affected by the DI treatment, we compared the kinetics of cell growth in all genotypes and treatments for each of the main layers generated before 5 daa (Figure 4).
In WT and flacca, the largest contribution to the whole pericarp size was provided by the layers E3, E4, and I3, followed by the first generated layers E2a, E2b, I2a, and I2b in both conditions. In optimal conditions (FI), the expansion rate of all cell layers in flacca was similar to that of WT up to 20 daa, but markedly slowed down later and was almost nil after 40 daa. At the ripe stage under FI, significant differences in the cell size between WT and flacca were observed in all main cell layers, three-fold higher in the outer layers (e.g., the mean cell area was, respectively, in WT and flacca 73,838 and 27,609 µm2 in E2a, and 66,754 and 21,869 µm2 in E2b) than in the inner ones (about two-fold). In WT, the negative effects of DI on the cell size appeared late in the later stages of development and were maximum at the ripe stage for most outer cell layers (e.g., E3, E2a, E2b). The opposite was observed in flacca: strong negative effects appeared early and were minimized during ripening, in outer layers (E2a, E2b, and E4) as well as in some inner layers (e.g., I3).

4. Discussion

4.1. Potential Roles of ABA in Fruit Growth in FI

The average fruit weight in flacca was reduced by three times compared with WT (Figure 1A) and the pericarp thickness was reduced by 32%, which is in accordance with the findings of Nitsch et al. [21]. The reduction in the flacca fruit size and pericarp thickness was related to a reduction in both pericarp cell layers and the cell number (involving the process of cell division), and the final cell size (involving cell expansion). A smaller number of cell layers in flacca than in WT ripe fruits (Figure 3) had already been observed [17]. Literature data indicated that the highest ABA concentration in the tomato pericarp was found around 19 daa [22]. In the present study, the role of ABA in cell expansion was supported by the difference in the pericarp cell expansion between flacca and WT which arose after 20 daa. The results of Nitsch et al. [21] indicated that the stimulation of cell enlargement by ABA could be due to a negative effect on ethylene synthesis, delaying the onset of fruit ripening or that the antagonistic ratios of ABA and ethylene were most likely responsible for the smaller fruit size in flacca fruits.
Besides the effect on cell expansion, ABA promoted the phloem influx of assimilates to sink organs especially in response to a water deficit [22,23,24]. Similarly, the phloem transport efficiency was significantly lower in flacca than in WT [25]. On the other hand, fruit growth was also related to leaf area, as the amount of assimilates directed to sinks depends on photosynthesis [26]. In flacca, the plant height, shoot fresh weight, and leaf area were about 50% lower than in WT [25,27], suggesting that ABA is also required for vegetative growth. Fruit size differences between the examined genotypes could also be the result of specific tissue ABA differences or the indirect effect of ABA on leaf growth and development which have an impact on the translocation of assimilates (or source/sink ratio) and fruit growth.

4.2. Implication of Cellular Traits in the Fruit Response to DI

Sensitivity to DI in each developmental phase highly depends on the genotype. In WT fruits, the number of cells was reduced under DI. In flacca fruits, DI induced a reduction in the pericarp cell number and cell size (Figure 4). Cell expansion was differently affected by DI in the outer and inner pericarp in WT. In most outer pericarp cell layers, the negative impact of DI was mainly at the end of fruit development, as cell expansion slowed down earlier than in FI. This effect was particularly noticed in the first cell layers generated in the outer pericarp, which grew almost as much as in the FI treatment until about 42 daa and then stopped expanding. This result suggests that a water deficit represented a limiting factor for further cell expansion at this late stage of development. However, in the inner pericarp, the effects of DI appeared early: the cells grew slower under DI than under FI, but finally reached a similar size. This recovery period during fruit development after a permanent DI supply was recorded by Ripoll et al. [12]. Thus, it is likely that a water deficit in the inner pericarp affected cell expansion only indirectly by slowing the rate of cell division; thus, delaying the generation of new cells and, therefore, the onset of their expansion. Only a few studies have addressed the effects of a water deficit on cell division in fruit tissues and contrasting effects have been reported [12,28]. Under an intensive water deficit, the induced carbon starvation may negatively regulate cell division, as it has been observed in tomato fruit tissues [13,29] and at the gene level [30]. In terms of the expansion process, the reduction in the cell size in fruits grown under a water deficit has been observed in olives [8], pears [2], and grapes [31]. Water deficit may affect tissue expansion via its effects on the biophysical, metabolic, and hormonal factors involved in the regulation of the cell turgor and osmotic pressures and cell-wall extension [28].
All the DI negative effects observed in WT were also observed in flacca. However, WT and flacca responses to DI differed concerning the kinetics of cell expansion. The negative impact on cell expansion was more pronounced in flacca than in WT and it occurred far earlier in the course of fruit development, as soon as the early cell division phase began. Moreover, this effect was the same in the outer and inner pericarp. This earlier effect of DI in flacca could be related to the specific role of ABA during the cell division and expansion phases [32].

5. Conclusions

The study provided new insights on the development of the pericarp layers and, according to our knowledge, represents a novelty in studies of the tomato fruit anatomy. Our study showed that tomato plants grown under DI (70% reduction in full irrigation) reduced fruit fresh weight by reducing the cell number and size in both genotypes. The major difference between flacca and WT responses to water restriction was a stronger negative impact during the early cell division phase in flacca, which was consistent with the involvement of ABA in the cell division process and water stress-induced ABA synthesis in WT. Our results provide new insights into the involvement of cellular traits in the tomato fruit growth in response to DI.

Author Contributions

I.P., R.S. and D.R. conceived and designed the experiments; I.P. and D.R. performed the experiments; S.S. and I.P. analyzed the data and performed statistical analyses; I.P., N.B., D.R., S.P.Q., Z.J., S.S. and R.S. discussed results and wrote the paper. All authors have read and agreed to the published version of the manuscript.

Acknowledgments

This study was supported by the Ministry of Education, Science and Technological Development of the Republic of Serbia (grant 451-03-68/2020-14/200116). Many thanks to Slaviša Đorđević and Radenko Radošević for technical support. We are particularly grateful to the Tomato Genetic Resource Center, University of California, for providing tomato seeds.

Conflicts of Interest

The authors declare no conflict of interest.

References

  1. Nuruddin, M.M.; Madramootoo, C.A.; Dodds, G.T. Effects of water stress at different growth stages on greenhouse tomato yield and quality. HortScience 2003, 38, 1389–1393. [Google Scholar] [CrossRef] [Green Version]
  2. Marsal, J.; Rapoport, H.F.; Manriqueb, T.; Girona, J. Pear fruit growth under regulated deficit irrigation in container-grown trees. Sci. Hortic. 2000, 85, 243–259. [Google Scholar] [CrossRef]
  3. Rapoport, H.F.; Costagli, G.; Gucci, R. The Effect of Water Deficit during Early Fruit Development on Olive Fruit Morphogenesis. J. Am. Soc. Hortic. Sci. 2004, 129, 121–127. [Google Scholar] [CrossRef]
  4. Dorji, K.; Behboudiana, M.H.; Zegbe-Domınguez, J.A. Water relations, growth, yield, and fruit quality of hot pepper under deficit irrigation and partial rootzone drying. Sci. Hortic. 2005, 104, 137–149. [Google Scholar] [CrossRef]
  5. Ruiz-Sanchez, M.C.; Domingo, R.; Castel, J.R. Deficit irrigation in fruit trees and vines in Spain. Span. J. Agric. Res. 2010, 8, 5–20. [Google Scholar] [CrossRef] [Green Version]
  6. Nangare, D.D.; Singh, Y.; Kumar, P.S.; Minhas, P.S. Growth, fruit yield and quality of tomato (Lycopersiconesculentum Mill.) as affected by deficit irrigation regulated on phenological basis. Agric. Water Manag. 2016, 171, 73–79. [Google Scholar] [CrossRef]
  7. Chen, S.; Zhou, Z.J.; Andersen, M.N.; Hu, T.T. Tomato yield and water use efficiency—Coupling effects between growth stage specific soil water deficits. Acta Agric. Scand. B Soil Plant Sci. 2015, 65, 460–469. [Google Scholar] [CrossRef]
  8. Gucci, R.; Lodolini, M.E.; Rapaport, F.H. Water deficit-induced changes in mesocarp cellular processes and the relationship between mesocarp and endocarp during olive fruit development. Tree Physiol. 2009, 29, 1575–1585. [Google Scholar] [CrossRef]
  9. Rosati, A.; Caporalia, S.; Hammami, S.B.M.; Moreno, A.I.; Paoletti, I.; Rapoport, H.F. Differences in ovary size among olive (Oleaeuropaea L.) cultivars are mainly related to cell number, not to cell size. Sci. Hortic. 2011, 130, 185–190. [Google Scholar] [CrossRef] [Green Version]
  10. Atta-Aly, M.A.; Riad, G.S.; Lacheene, Z.E.S.; El-Beltagy, A.S. Early ethrel applications extend tomato fruit cell division and increase fruit size and yield with ripening delay. J. Plant. Growth Regul. 1999, 18, 15–24. [Google Scholar] [CrossRef] [PubMed]
  11. Bertin, N.; Gautier, H.; Roche, C. Number of cells in tomato fruit depending on fruit position and source-sink balance during plant development. J. Plant Growth Regul. 2002, 36, 105–112. [Google Scholar] [CrossRef]
  12. Ripoll, J.; Urban, L.; Brunel, B.; Bertin, N. Water deficit effects on tomato quality depend on fruit developmental stage and genotype. J. Plant Physiol. 2016, 190, 26–35. [Google Scholar] [CrossRef] [PubMed]
  13. Bertin, N. Analysis of the Tomato Fruit Growth Response to Temperature and Plant Fruit Load in Relation to Cell Division, Cell Expansion and DNA Endoreduplication. Ann. Bot. 2005, 95, 439–447. [Google Scholar] [CrossRef] [Green Version]
  14. Cheniclet, C.; Rong, W.Y.; Causse, M.; Frangne, N.; Bolling, L.; Carde, J.P.; Renaudin, J.P. Cell Expansion and Endoreduplication Show a Large Genetic Variability in Pericarp and Contribute Strongly to Tomato Fruit Growth. Plant Physiol. 2005, 139, 1984–1994. [Google Scholar] [CrossRef] [PubMed] [Green Version]
  15. Fanwoua, J.; de Visser, P.; Heuvelink, E.; Angenent, G.; Yin, X.; Marcelis, L.; Struik, P. Response of Cell Division and Cell Expansion to Local Fruit Heating in Tomato Fruit. J. Am. Soc. Hortic. Sci. 2012, 137, 294–301. [Google Scholar] [CrossRef] [Green Version]
  16. Chen, G.; Fu, X.; Lips, S.H.; Sagi, M. Control of plant growth resides in the shoot, and not in the root, in reciprocal grafts of flacca and wild-type tomato (Lysopersiconesculentum), in the presence and absence of salinity stress. Plant Soil 2003, 256, 205–215. [Google Scholar] [CrossRef]
  17. Rancic, D.; Quarrie, S.P.; Pecinar, I. Anatomy of Tomato Fruit and Fruit Pedicel during Fruit Development. In Microscopy: Science, Technology, Applications and Education; Méndez-Vilas, A., Díaz, J., Eds.; Formatex Research Center: Badajoz, Spain, 2010; pp. 851–861. [Google Scholar]
  18. Tjørve, K.M.; Tjørve, E. The use of Gompertz models in growth analyses, and new Gompertz-model approach: An addition to the Unified-Richards family. PLoS ONE 2017, 12, e0178691. [Google Scholar] [CrossRef]
  19. Ruzin, S.E. Plant Microtechnique and Microscopy; Oxford University Press: Oxford, UK, 1999; p. 334. [Google Scholar]
  20. Rasband, W.S. (1997–2009) ImageJ, U.S. National Institutes of Health, Bethesda, Maryland, USA. Available online: http://rsb.info.nih.gov/ij/, (accessed on 14 June 2020).
  21. Nitsch, L.; Kohlenb, W.; Oplaata, C.; Charnikhova, T.; Cristescu, S.; Michieli, P.; Wolters-Arts, M.; Bouwmeester, H.; Mariani, C.; Vriezen, W.H.; et al. ABA-deficiency results in reduced plant and fruit size in tomato. J. Plant Physiol. 2012, 169, 878–883. [Google Scholar] [CrossRef] [PubMed]
  22. Kojima, K. Phytohormones in Shoots and Fruits of Tomato; Apoplast solution and seedless fruit. Jpn. Agric. Res. Q. 2005, 39, 77–81. [Google Scholar] [CrossRef] [Green Version]
  23. Neill, S.J.; Horgan, R. Abscisic Acid Production and Water Relations in Wilty Tomato Mutants Subjected to Water Deficiency. J. Exp. Bot. 1985, 36, 1222–1231. [Google Scholar] [CrossRef]
  24. Davies, W.J.; Bacon, M.A.; Thompson, D.S.; Sobeigh, W.; Rodriguez, L.G. Regulation of leaf and fruit growth in plants in drying soil: Exploitation of the plant’s chemical signaling system and hydraulic architecture to increase the efficiency of water use in agriculture. J. Exp. Bot. 2000, 51, 1617–1626. [Google Scholar] [CrossRef]
  25. Rančić, D. Morpho-Anatomical Analysis of Tomato in Drought Condition. Ph.D. Thesis, Faculty of Agriculture, University of Belgrade, Beograd, Serbia, 24 July 2011. [Google Scholar]
  26. Zhang, L.Y.; Peng, Y.B.; Pelleschi-Travier, S.; Fan, Y.; Lu, Y.F.; Lu, Y.M.; Zhang, D.P. Evidence for Apoplasmic Phloem Unloading in Developing Apple Fruit. Plant Physiol. 2004, 135, 574–586. [Google Scholar] [CrossRef] [PubMed] [Green Version]
  27. Dodd, I.C. Leaf area development of ABA-deficient and wild-type peas at two levels of nitrogen supply. Funct. Plant Bio. 2003, 30, 777–783. [Google Scholar] [CrossRef] [PubMed]
  28. Ripoll, J.; Urban, L.; Staudt, M.; Lopez-Lauri, F.; Bidel, L.P.R.; Bertin, N. Water shortage and quality of fleshy fruits—Making the most of the unavoidable. Rev. J. Exp. Bot. 2014, 65, 4097–4117. [Google Scholar] [CrossRef] [PubMed] [Green Version]
  29. Prudent, M.; Bertin, N.; Génard, M.; Munos, S.; Rolland, S.; Garcia, V.; Causse, M. Genotype-dependent response of growing tomato fruit to carbon availability. Plant Cell Environ. 2010, 33, 1186–1204. [Google Scholar] [CrossRef]
  30. Baldet, P.; Hernould, M.; Laporte, F.; Mounet, F.; Just, D.; Mouras, A.; Rothan, C. Expression of cell proliferation-related genes in early developing flower is affected by fruit load reduction in tomato plants. J. Exp Bot. 2006, 57, 961–970. [Google Scholar] [CrossRef] [Green Version]
  31. Ojeda, H.; Deloire, A.; Carbonneau, A. Influence of water deficit on grape berry growth. Vitis 2001, 40, 141–145. [Google Scholar] [CrossRef]
  32. McAtee, P.; Karim, S.; Schaffer, R.J.; David, K. A dynamic interplay between phytohormones is required for fruit development, maturation, and ripening. Front. Plant Sci. 2013, 4, 79. [Google Scholar] [CrossRef] [Green Version]
Figure 1. Fruit growth under fully irrigated (FI, solid lines, and deficit irrigation (DI, dashed lines) treatments for WT (red lines and closed symbols) and flacca (black lines and open symbols) genotypes. (A) Fruit fresh weight curves. (B) Fruit growth rate curves. FI: circle symbol; DI: square symbol. Vertical bars indicate 95% CIs.
Blsf 04 00105 g001
Figure 2. Frequency distributions of cell areas at 20 daa (A) and ripe fruit (B), measured from sections of at least 1000 measurements per treatment. This modeled distribution was plotted using square root transformed data.
Blsf 04 00105 g002
Figure 3. Mean cell area per pericarp layer in full irrigation treatment (FI) in WT (A) and flacca (B). Each point is the mean of up to 100 cells per cell layer. Cell areas are given in μm2 on the same scale for both genotypes. Each line represents one stage during development, from 3 daa to ripe fruit stage. For identification of cell layers refer to Figure 4A. Breaks in the lines indicate that the respective layers were not yet formed at this stage.
Blsf 04 00105 g003
Figure 4. (A). Tomato pericarp cross section with marked cell layers at 12 daa. The scale bar represents 500 µm. (B). Effects of irrigation treatments (FI: solid lines; DI: dashed lines) on cell growth kinetics in different pericarp cell layers in WT (red curves) and flacca (black curves) genotypes. Each point is the mean of up to 100 cells per cell layer.
Blsf 04 00105 g004
Publisher’s Note: MDPI stays neutral with regard to jurisdictional claims in published maps and institutional affiliations.

