Quantifying the Log Reduction of Pathogenic Microorganisms by Constructed Wetlands: A Review †

KWR Water Research Institute, Groningenhaven 7, 3433 PE Nieuwegein, The Netherlands
*
Author to whom correspondence should be addressed.
†
Presented at the 4th International Electronic Conference on Water Sciences, 13–29 November 2019; Available online: https://ecws-4.sciforum.net/.
Proceedings 2020, 48(1), 9; https://doi.org/10.3390/ECWS-4-06433
Published: 12 November 2019
(This article belongs to the Proceedings of The 4th International Electronic Conference on Water Sciences)
Abstract
:Over the last 30 years, constructed wetlands (CWs) have been used as an alternative, cost-efficient way of treating wastewater, often in combination with conventional wastewater technologies. When CWs are attached at the end of conventional wastewater treatment plants, they treat the effluent and thus provide a polishing step. However, recent studies have shown that when CWs are used as the main wastewater treatment method for the agricultural reuse of effluents, they perform poorly on meeting the accepted limit of microbial contamination. Moreover, CWs are increasingly used within the scope of the circular economy and water reuse applications. Therefore, there is a need for a comprehensive exploration of the performance of CWs on pathogen removal. This paper explores relevant case studies regarding pathogen removal from constructed wetlands to create a comprehensive dataset that provides a complete overview of CWs performance under various conditions. After a systematic literature review, a total of 48 case studies were qualified for both qualitative and quantitative analyses. From the dataset, the general performance, optimal conditions, and knowledge gaps were identified. The review confirmed that constructed wetlands (as a standalone treatment) cannot meet the accepted limits of pathogen removal. However, they can be a credible choice for wastewater polishing when they are combined with conventional wastewater treatment systems. Regarding the most common indicators that were recorded, the removal of Escherichia coli ranged between 0.01–5.6 log; the removal of total and fecal coliforms was 0.2–5.32 log and 0.07–6.08 log, respectively; while the removal of fecal streptococci was 0.2–5.2 log. The great variability of pathogen removal indicates that the complexity of CWs makes it difficult to draw robust conclusions regarding their removal efficiency. Potential correlations were identified between influent and effluent concentrations, as well as between log removal and hydraulic characteristics. Additionally, no correlations between pathogen removal and temperature/climatic zones were found since average pathogen removal per country showed high variation throughout the various climatic zones. The dataset can be used as a benchmark of CWs’ performance as a barrier against the spreading of pathogens in the environment. The knowledge gaps identified in this review can provide direction for further research. Finally, a potential meta-analysis of the dataset using statistical analysis can pave the way for a better understanding of the design and operational parameters of CWs in order to fine-tune and quantify the factors that influence the performance of these systems.
1. Introduction
Constructed wetlands (CWs) are alternative, easily operated, and cost-efficient systems that can be applied to wastewater (WW) purification, municipal sewage [1], or the polishing of a wastewater treatment plant (WWTP) effluent [2]. Moreover, the use of CWs provides additional ecological value as well as social acceptance through the creation of habitats, preservation of wildlife, and recreational added value, making them preferable to conventional engineered systems in terms of ecosystem services [3]. However, CWs can have disadvantages like low nutrient removal efficiency [1] as well as limitations regarding microbiological degradation processes with several factors affecting the process like temperature (T) and seasonal variations [4]. While conventional engineered wastewater treatment has already proven to be efficient in the removal of the majority of pollutants, this comes with the disadvantage of environmental degradation and high energy consumption, amongst others [5]. Therefore, a potential combination of these natural systems with engineered treatments like oxidation, membrane bio-reactor (MBR), or anaerobic reactors as a pre- or post-treatment can overcome these disadvantages and even enhance the efficiency of these combined systems, as they combine the removal mechanisms of both types [6].
Constructed wetlands can be classified into three main categories depending on their water flow regime. These are:
- Free water surface (FWS) constructed wetlands that have areas of open water and behave similarly to natural wetlands.
- Subsurface horizontal flow constructed wetlands (SSHFCW), which typically consist of a gravel bed covered with wetland vegetation. The water flows constantly below the surface of the bed in a horizontal direction.
- Vertical flow constructed wetlands (VFCW), where the main difference compared with SSHFCWs is that water percolates vertically through sand or a gravel bed planted with vegetation. The influent enters through perforated pipes which are distributed over the surface in the form of a grid.
Each of these categories demonstrates different layouts, media, efficiency, and flow patterns [7]. When the end product of wastewater treatment is destined for water reuse applications like drinking water or irrigation, the effective removal of pathogenic bacteria that can be found in the effluents, is of great importance. CWs can remove the remaining micropollutants of conventional WW treatments adequately when they are used as a polishing step. However, recent studies have shown that when they are used as the main wastewater treatment method for agricultural reuse of effluents, they perform poorly on meeting the accepted limit of microbial contamination [8,9]. Moreover, the frequency of their usage (mainly in combination with conventional treatment) is increasing under the scope of the circular economy and water reuse applications that continuously come to light [10]. Therefore, the need for a comprehensive exploration of the performance of CWs on pathogen removal as a standalone wastewater treatment method or as a combined treatment is imperative.
During the last 30 years, a great number of scientific papers and books have been published regarding the characteristics of CWs and their pathogen removal performance [7,11,12]. What is common among these publications is the complexity and heterogeneity that characterizes these natural systems, having rightfully earned the title “black box”. That is because there are various processes of pathogen removal that take place simultaneously and sometimes act in combination. These processes include physical (sedimentation, filtration, adsorption), chemical (UV radiation, oxidation), and biological (predation, natural die-off) processes, and it can be quite challenging to specify the main factors that are responsible for the removal of pathogens [13]. The focal point regarding pathogenic microorganisms will include viruses, bacteria, and protozoa with Escherichia coli, total and fecal coliforms, and fecal streptococci drawing the most attention since they are the most common indicators.
This paper aims to explore relevant studies regarding pathogen removal from constructed wetlands and their respective characteristics. To do that, a systematic literature review will be performed to create a comprehensive dataset that provides a complete overview of CWs’ performance under various conditions and highlights potential knowledge gaps and opportunities for meta-analysis.
2. Materials and Methods
2.1. Systematic Literature Review
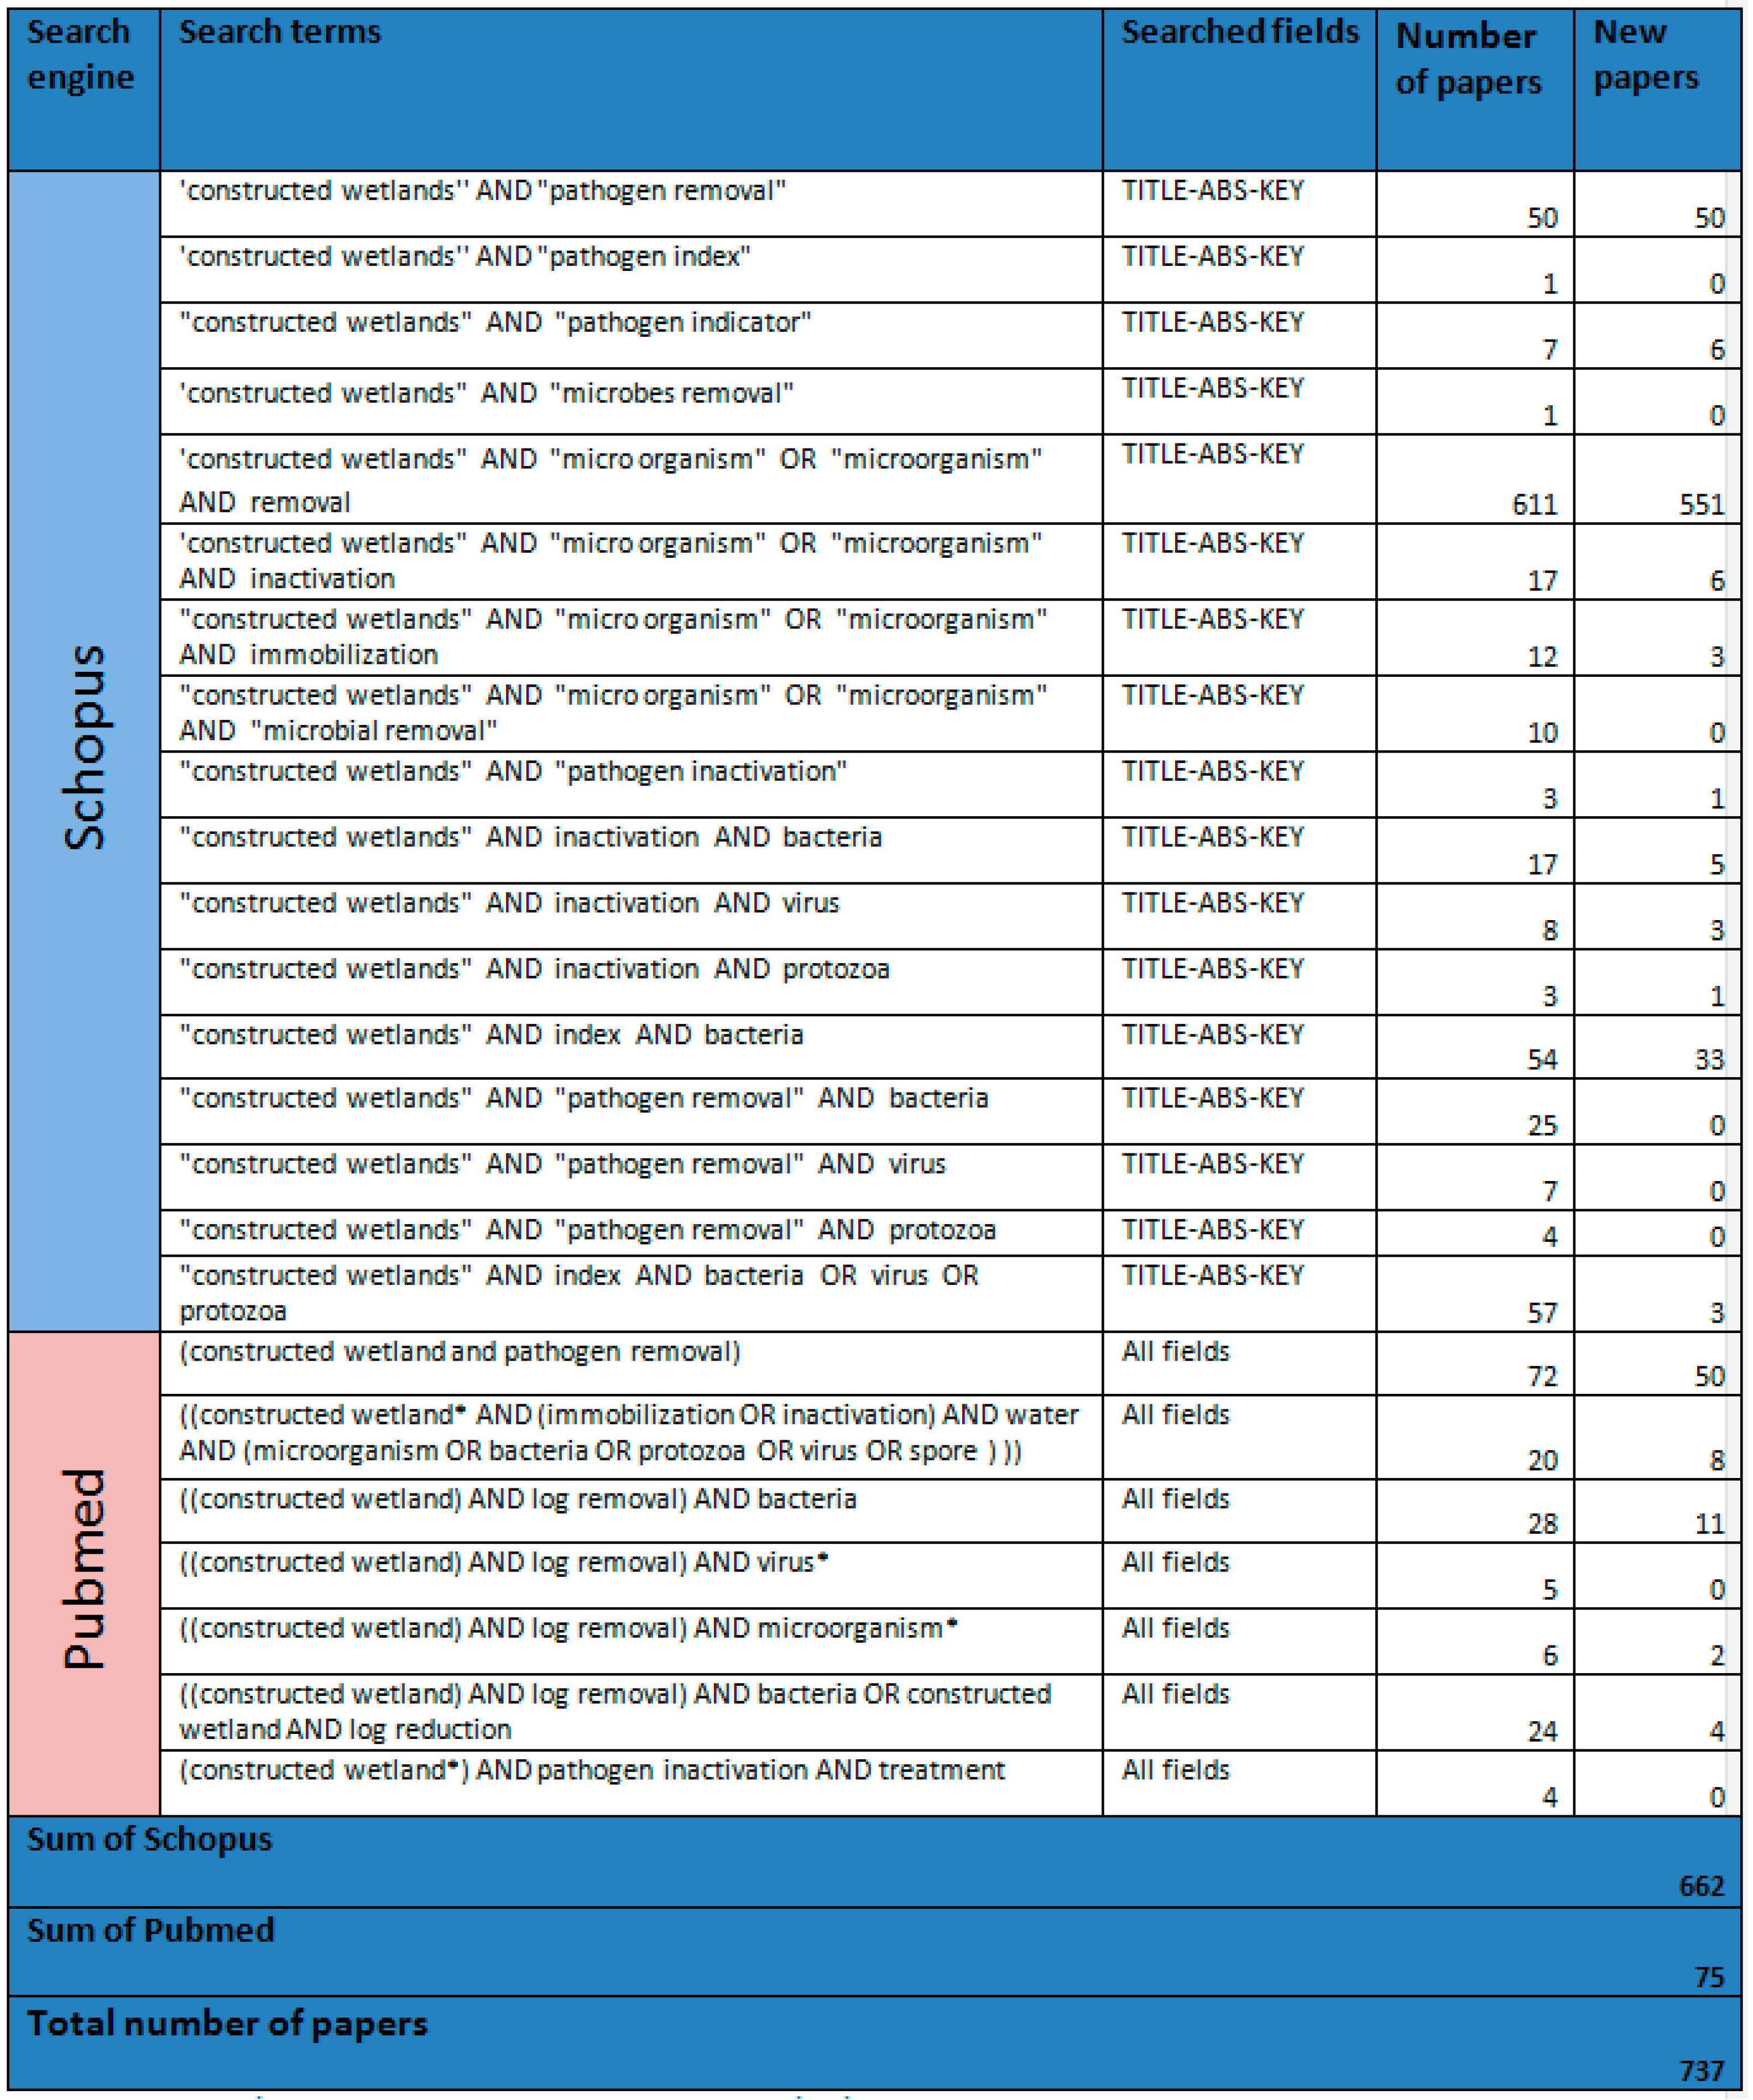
The systematic review of the literature was performed, adopting the Preferred Reporting Items for Systematic Reviews and Meta-Analyses (PRISMA) guidelines [14]. The preferred search engines “Scopus’’ and “PubMed’’ were used. The combination of keywords, as well as the results from the databases regarding the total number of papers, are shown in Appendix A.
2.1.1. Inclusion Criteria
The primary objective of this systematic literature review was to record of case studies, not scientific reviews, as well as the extraction of results associated with the removal of pathogens, such as viruses, bacteria, and protozoa. Furthermore, the inclusive criteria were about the optimal availability and quality of the technical features such as:
- The dimensions of the constructed wetland;
- The Hydraulic Loading Rate (HLR);
- The Hydraulic Retention Time (HRT);
- The porosity (n) of the media grains;
- A detailed description of CWs.
From the above criteria, the included studies contained at least the hydraulic characteristics. Additionally, it was preferred to include studies that described at least part of the experimental conditions (if not all), such as:
- Temperature (T);
- The type of influent wastewater;
- The method of enumeration, such as Colony Forming Units (CFU/100 ml) and Most Probable Number (MPN);
- Physicochemical parameters like:
- ○
- Biological Oxygen Demand (BOD);
- ○
- Chemical Oxygen Demand (COD);
- ○
- Total Suspended Solids (TSS).
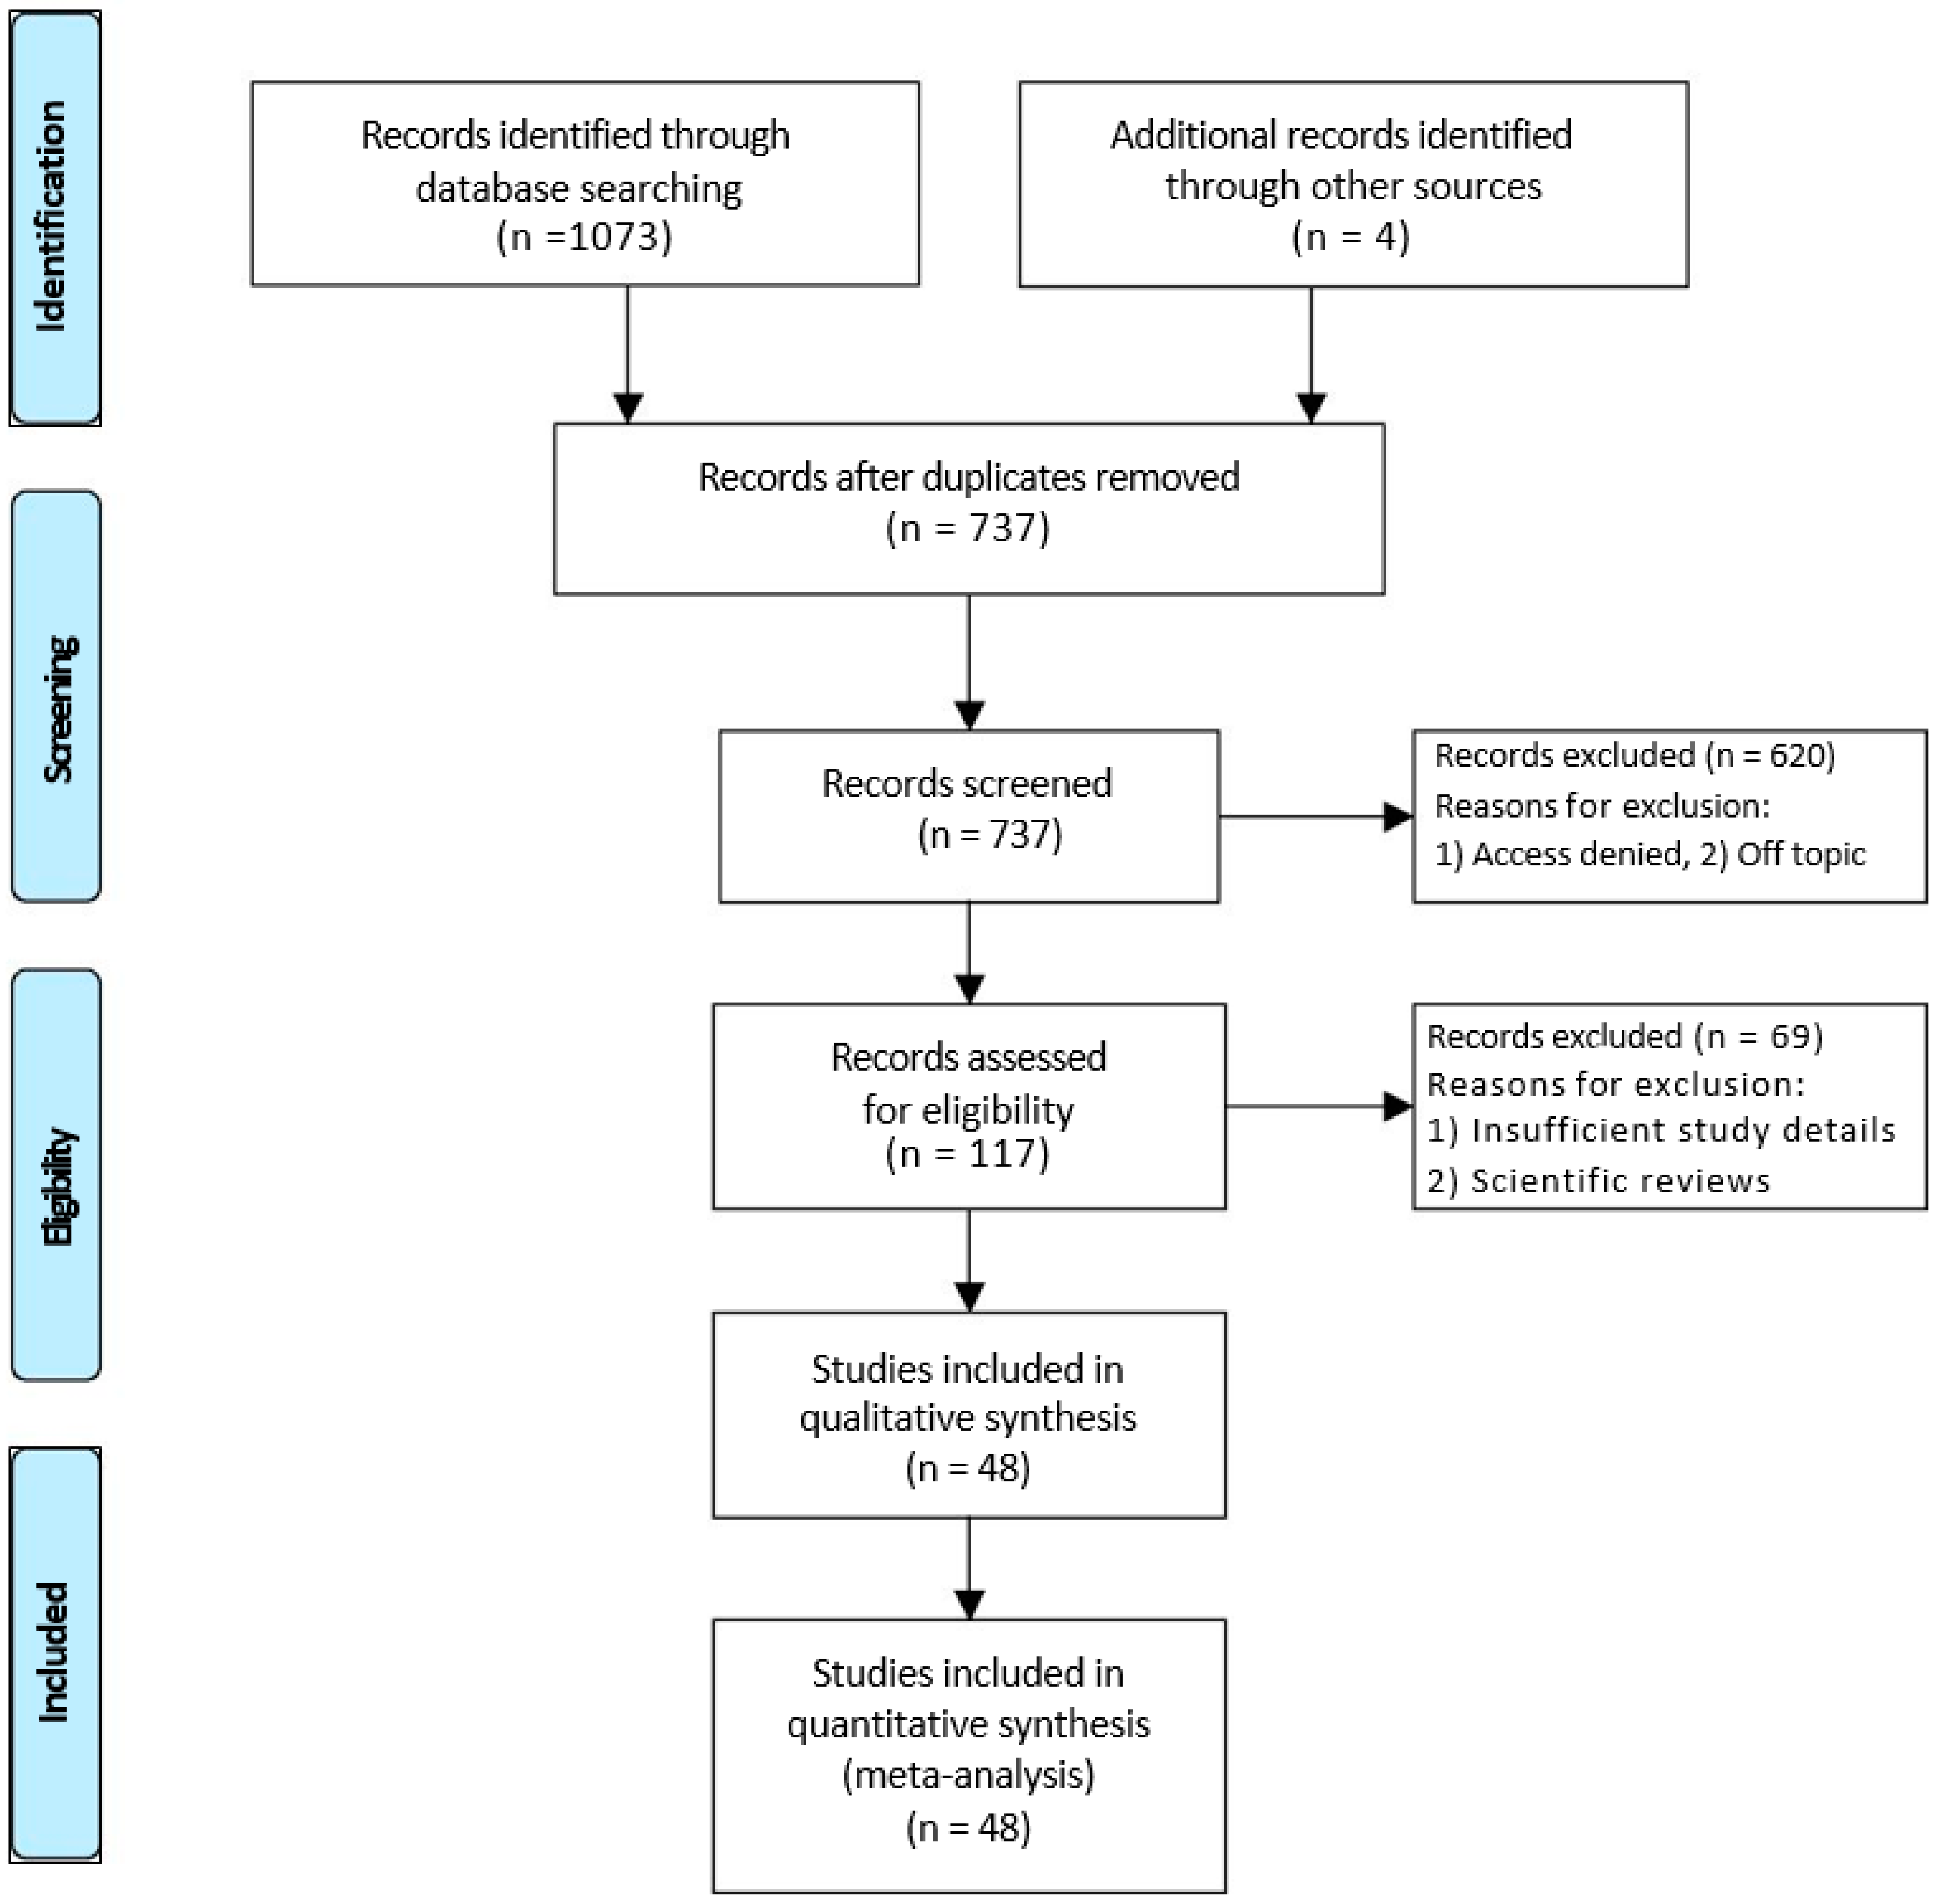
Figure 1 demonstrates the search process of the systematic review, the reasons for excluding papers, as well as the number of case studies. After two series of screening, a total of 48 case studies qualified for both qualitative and quantitative analyses.
2.1.2. Spatial Distribution of Case Studies
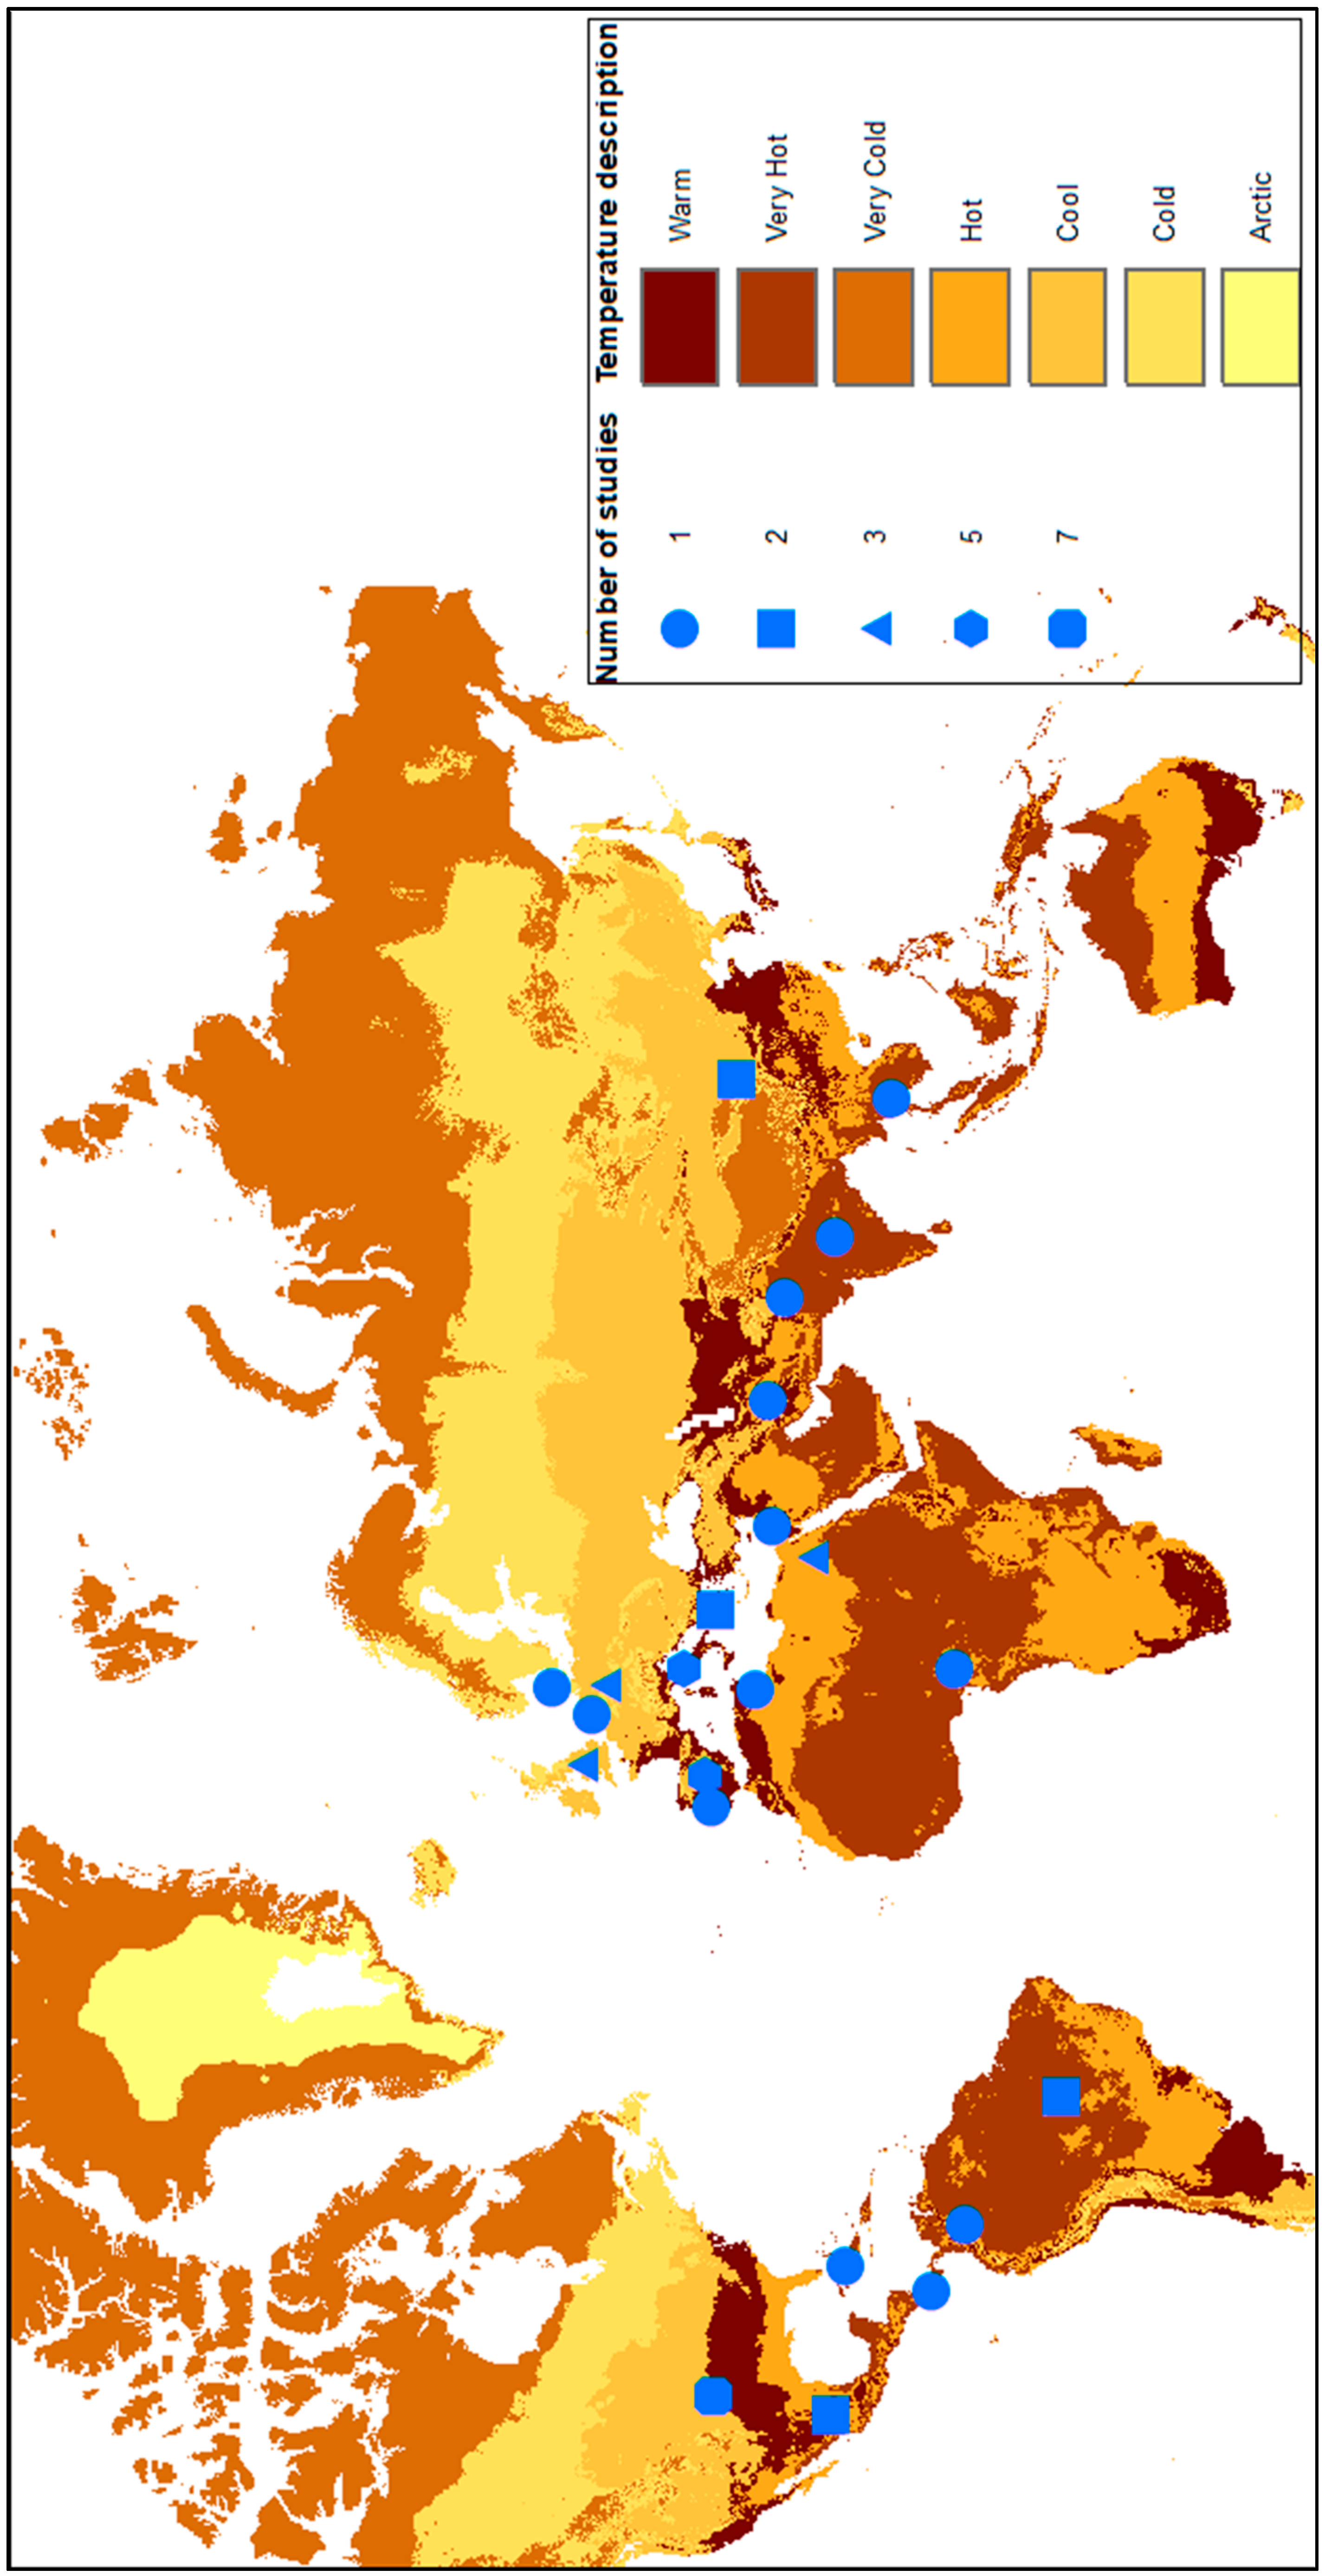
After the selection of the case studies, a spatial distribution map was created to show the dispersion and the number of studies on a national level throughout the world. Figure 2 shows that the selected studies came from various regions of the world with different temperature/climatic zones (More information about the climatic zones can be found in: https://www.arcgis.com/home/item.html?id=5826b14592ab4ebc99574919165bd860), which strengthens the validity of the database as it was expected that there would be variability on the performance of different CW types between different climatic zones. A relationship between temperature/climatic zones and log removal was examined by looking at potential correlations.
2.2. Data Extraction Process
During the extraction process, a classification between the case studies under consideration was made to ease the process of data extraction. The classes “Include 1” and “Include 2” were created, with the numbering system indicating the degree of difficulty in extracting data as well as the quantity of descriptive information of case studies. The second class was decided to be incorporated only after realizing that the first class did not provide enough information. Moreover, in cases where important information was missing, it was decided to calculate these using many times default values. Briefly, in studies where the HRT value was missing, it was decided that for the calculation of this value, the addition of porosity had to be included to the numerator to obtain a more representative value for the retention time. In times were the porosity value was not indicated, a default value of 0.35 for sand and 0.4 for clay was used [15].
2.3. Creation of Dataset and Classification of Pathogens
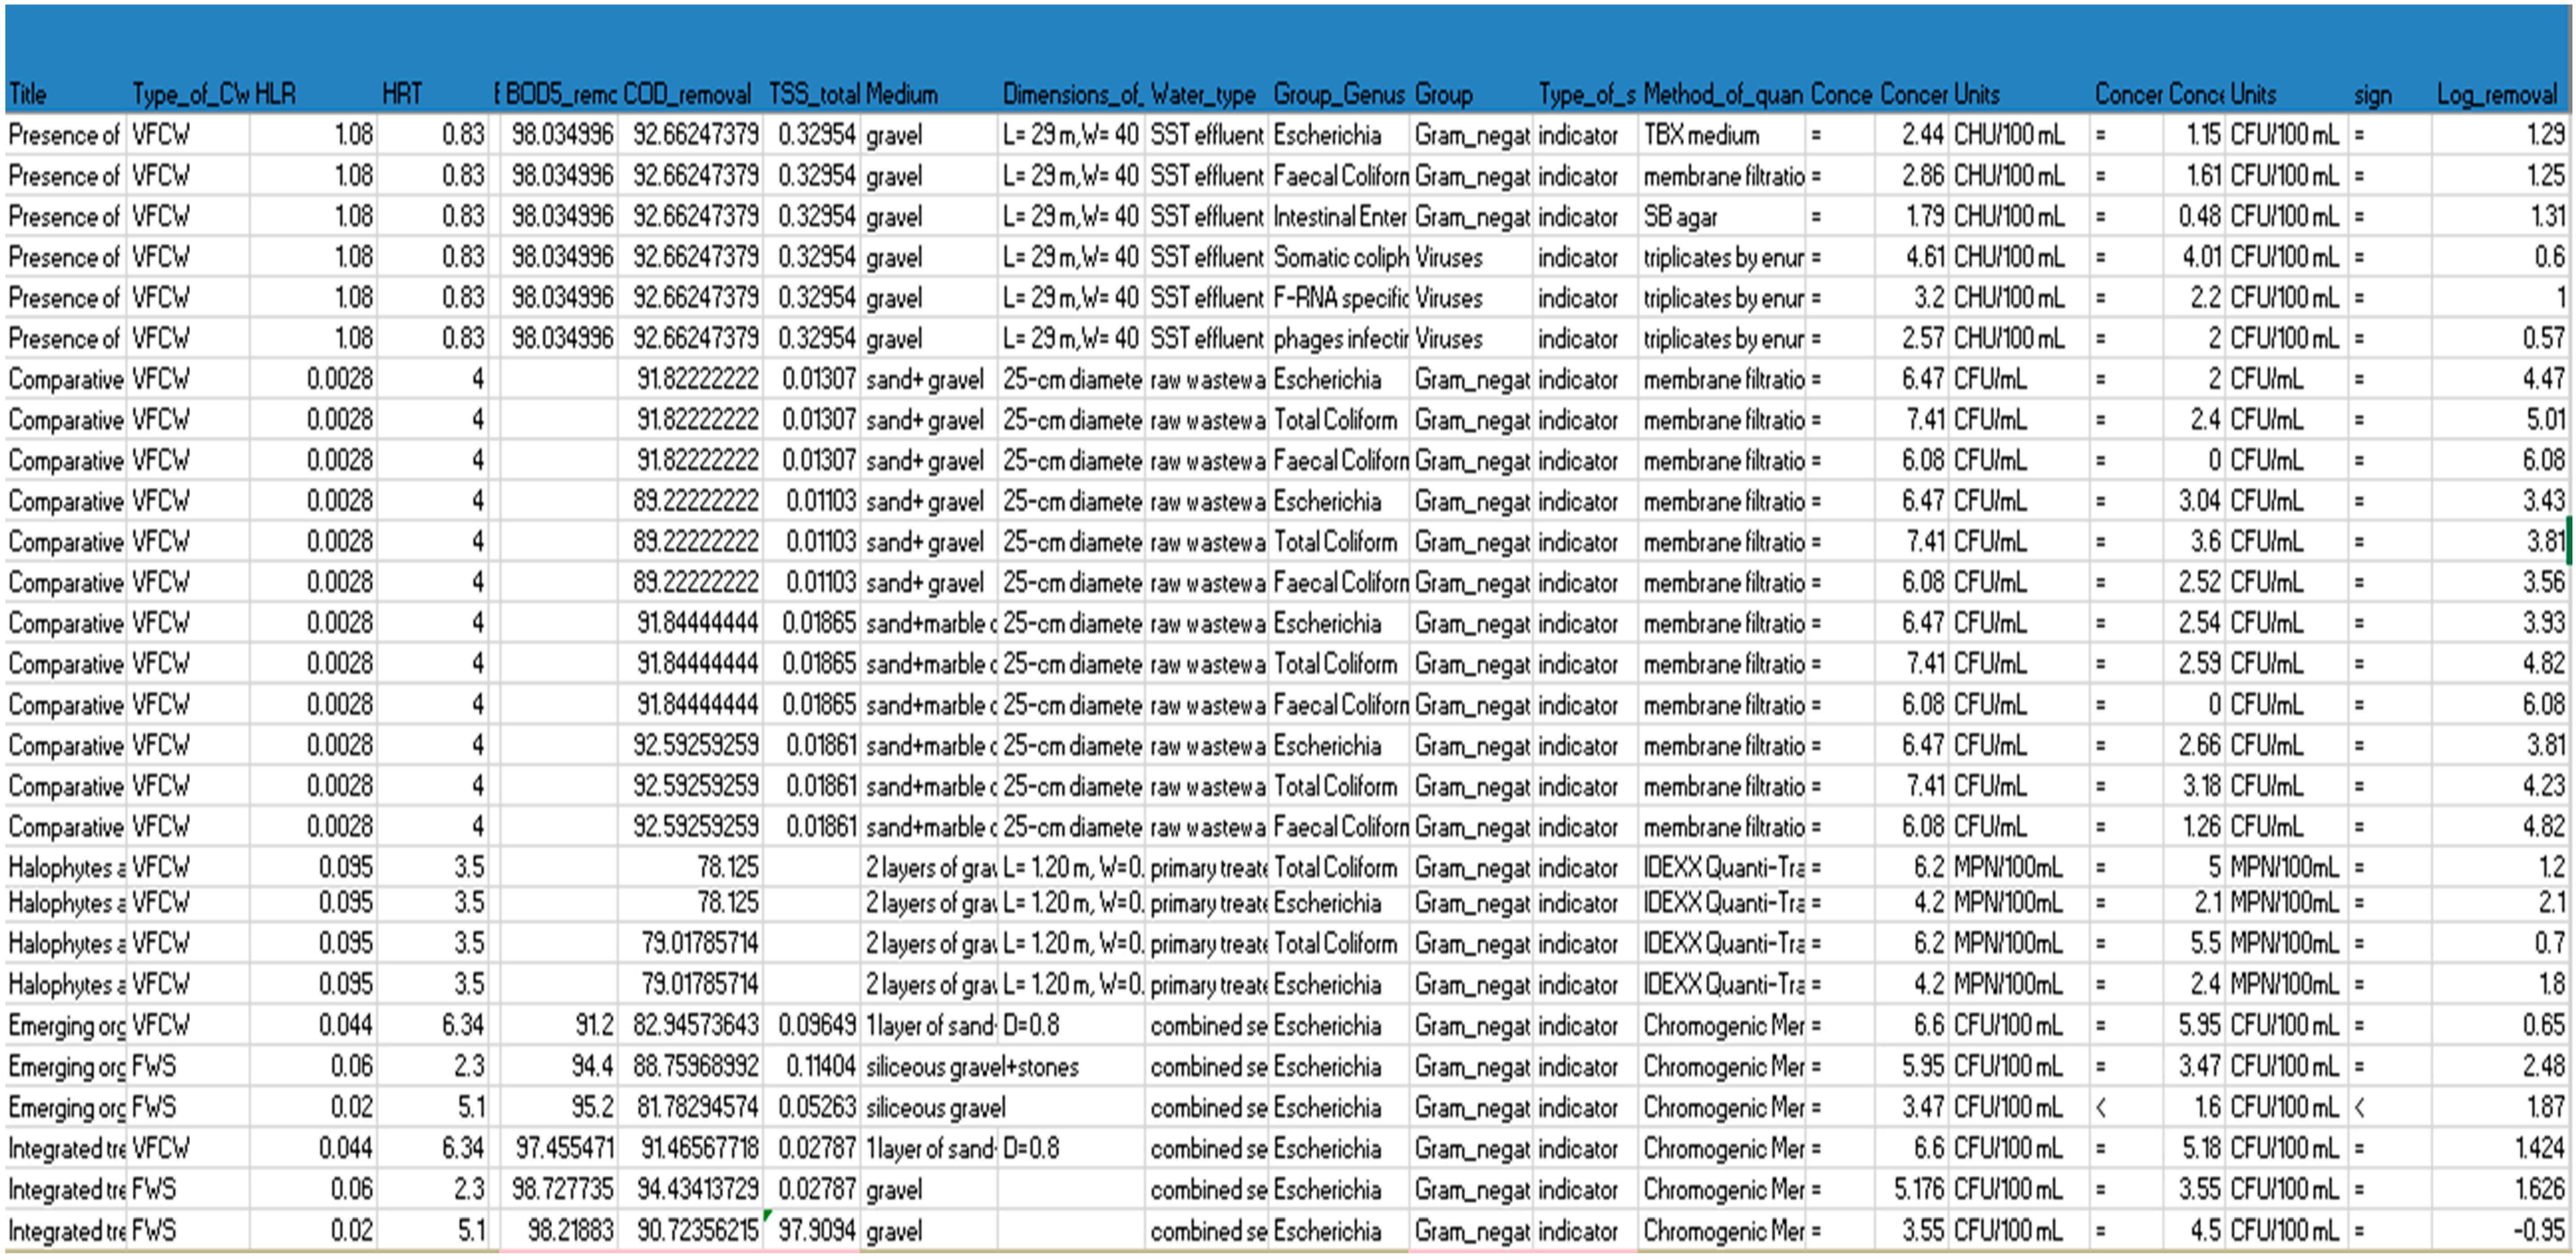
After the data extraction was completed, a comprehensive dataset with all the necessary values was created, as can be seen in Appendix B. This dataset includes information about HRT, HLR, type of CW, temperature, and concentration of influent (Cin) and effluent (Cout), for various pathogens. This information helped to create a complete, up-to-date overview of the performance of constructed wetlands.
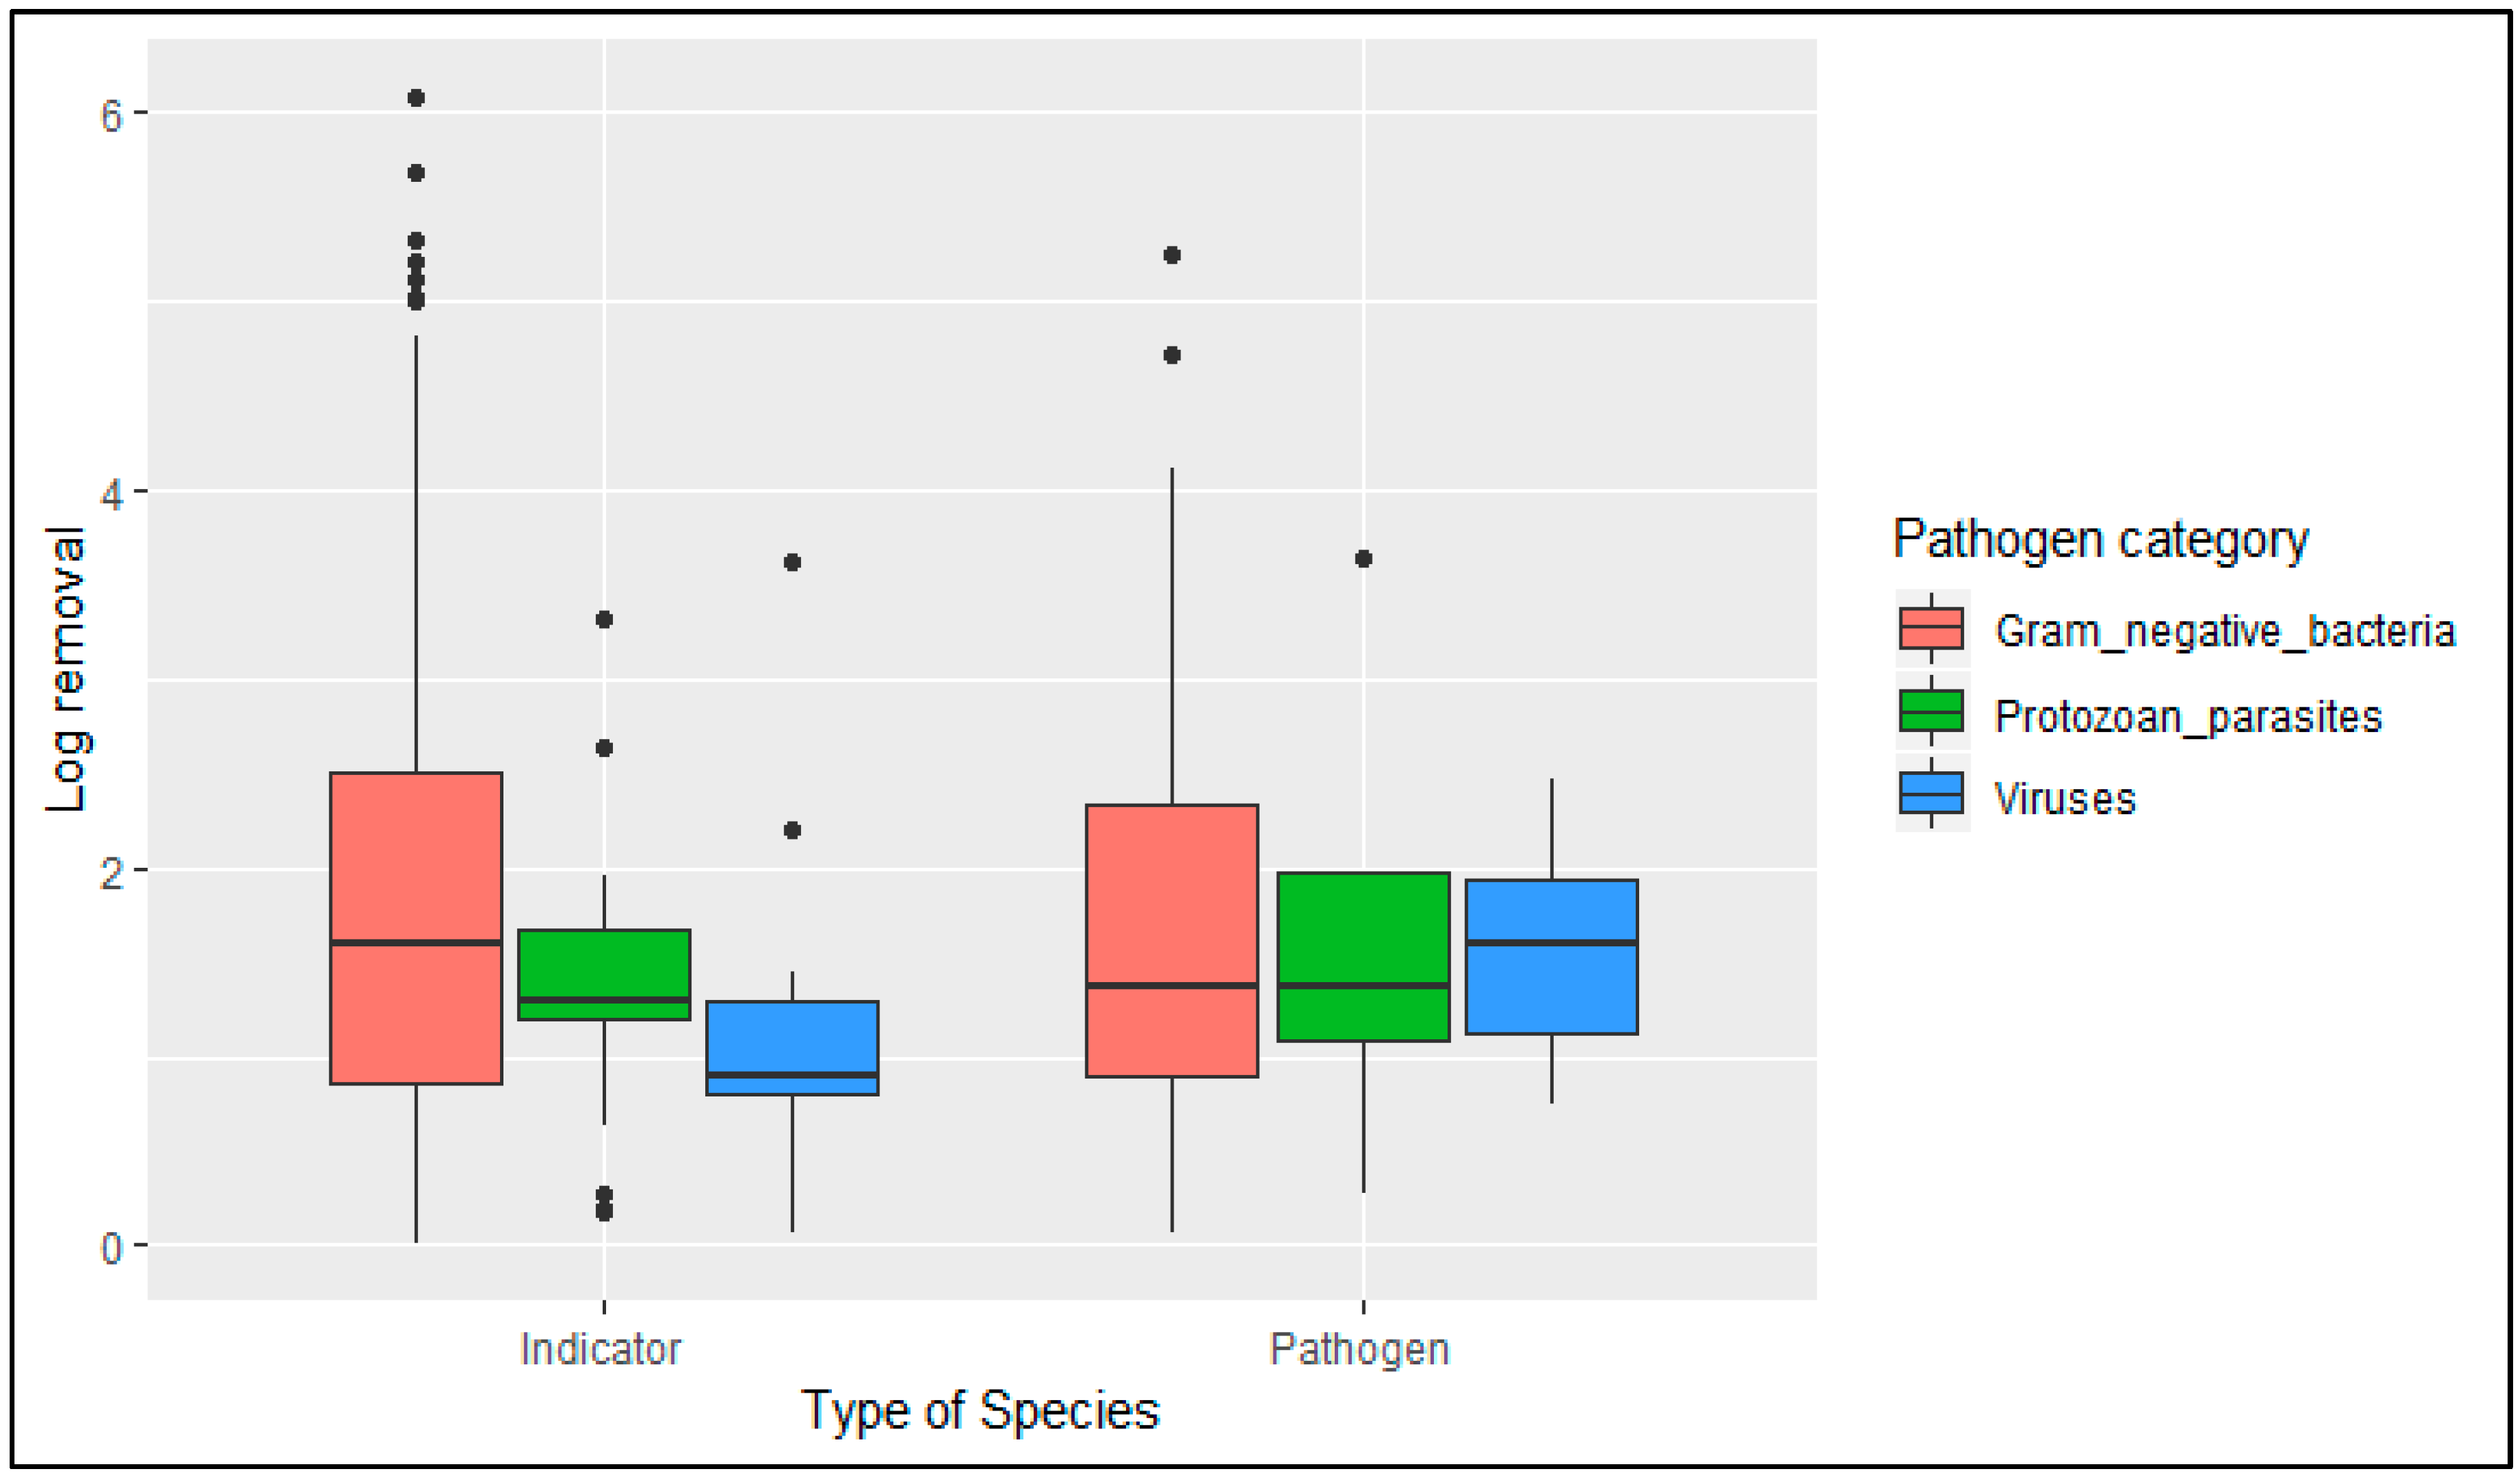
The next step was the classification of pathogenic microorganisms into three main categories: gram-negative bacteria (GNB), viruses, and protozoan parasites (Table 1). As can be seen, the systematic literature review identified various microorganisms, both indicators and pathogens for each category, but not on the same frequency. Briefly, although E. coli (which is a common indicator) was found in 33 of the 48 papers, other indicators such as fecal coliforms, total coliforms, and fecal streptococci did not have the same frequency (23, 25, and 9, respectively). Furthermore, from the viruses’ category, coliphages were found in only 5 papers in total; whereas, from the protozoan parasites category, Giardia had considerably less information, with only 3 papers. Therefore, the grouping between indicators and pathogens for every category was necessary, to have a better understanding of their removal from CWs, since it was expected to observe the largest differences in removal between categories and rather smaller differences within categories.
Figure 3 demonstrates the range and average log removal for each category between indicators and pathogens. It can be seen (for GNB and protozoa) that indicators and pathogenic microorganisms have relatively similar levels of removal, which increases the reliability of the decision to group indicators with pathogens. For viruses, the indicators appear to be removed to a lesser extent, therefore they should be regarded as conservative indicators.
2.4. Preliminary Exploration between Parameters
The goal of this preliminary exploration was to identify potential patterns between parameters by plotting them to each other regarding either different types of wetlands or different pathogen categories. Regarding parameters, the Cin, Cout, HRT, and HLR were assessed, since those were the only parameters that were consistently reported in the literature review. The reason behind this preliminary plotting was the fact that multiple studies have been conducted for the removal of pollutants and pathogens from CWs where they perform regression analysis and try to determine if there are significant relationships between the aforementioned parameters [16,17,18,19,20,21,22]. These studies found that there seems to be a linear/nonlinear relationship that is expressed through an equation that uses the Cout as a function of Cin and/or HRT, HLR. Having the above information in mind, a simplified expression of these relationships was performed.
3. Results
3.1. Log Removal and Temperature/Climatic Zones
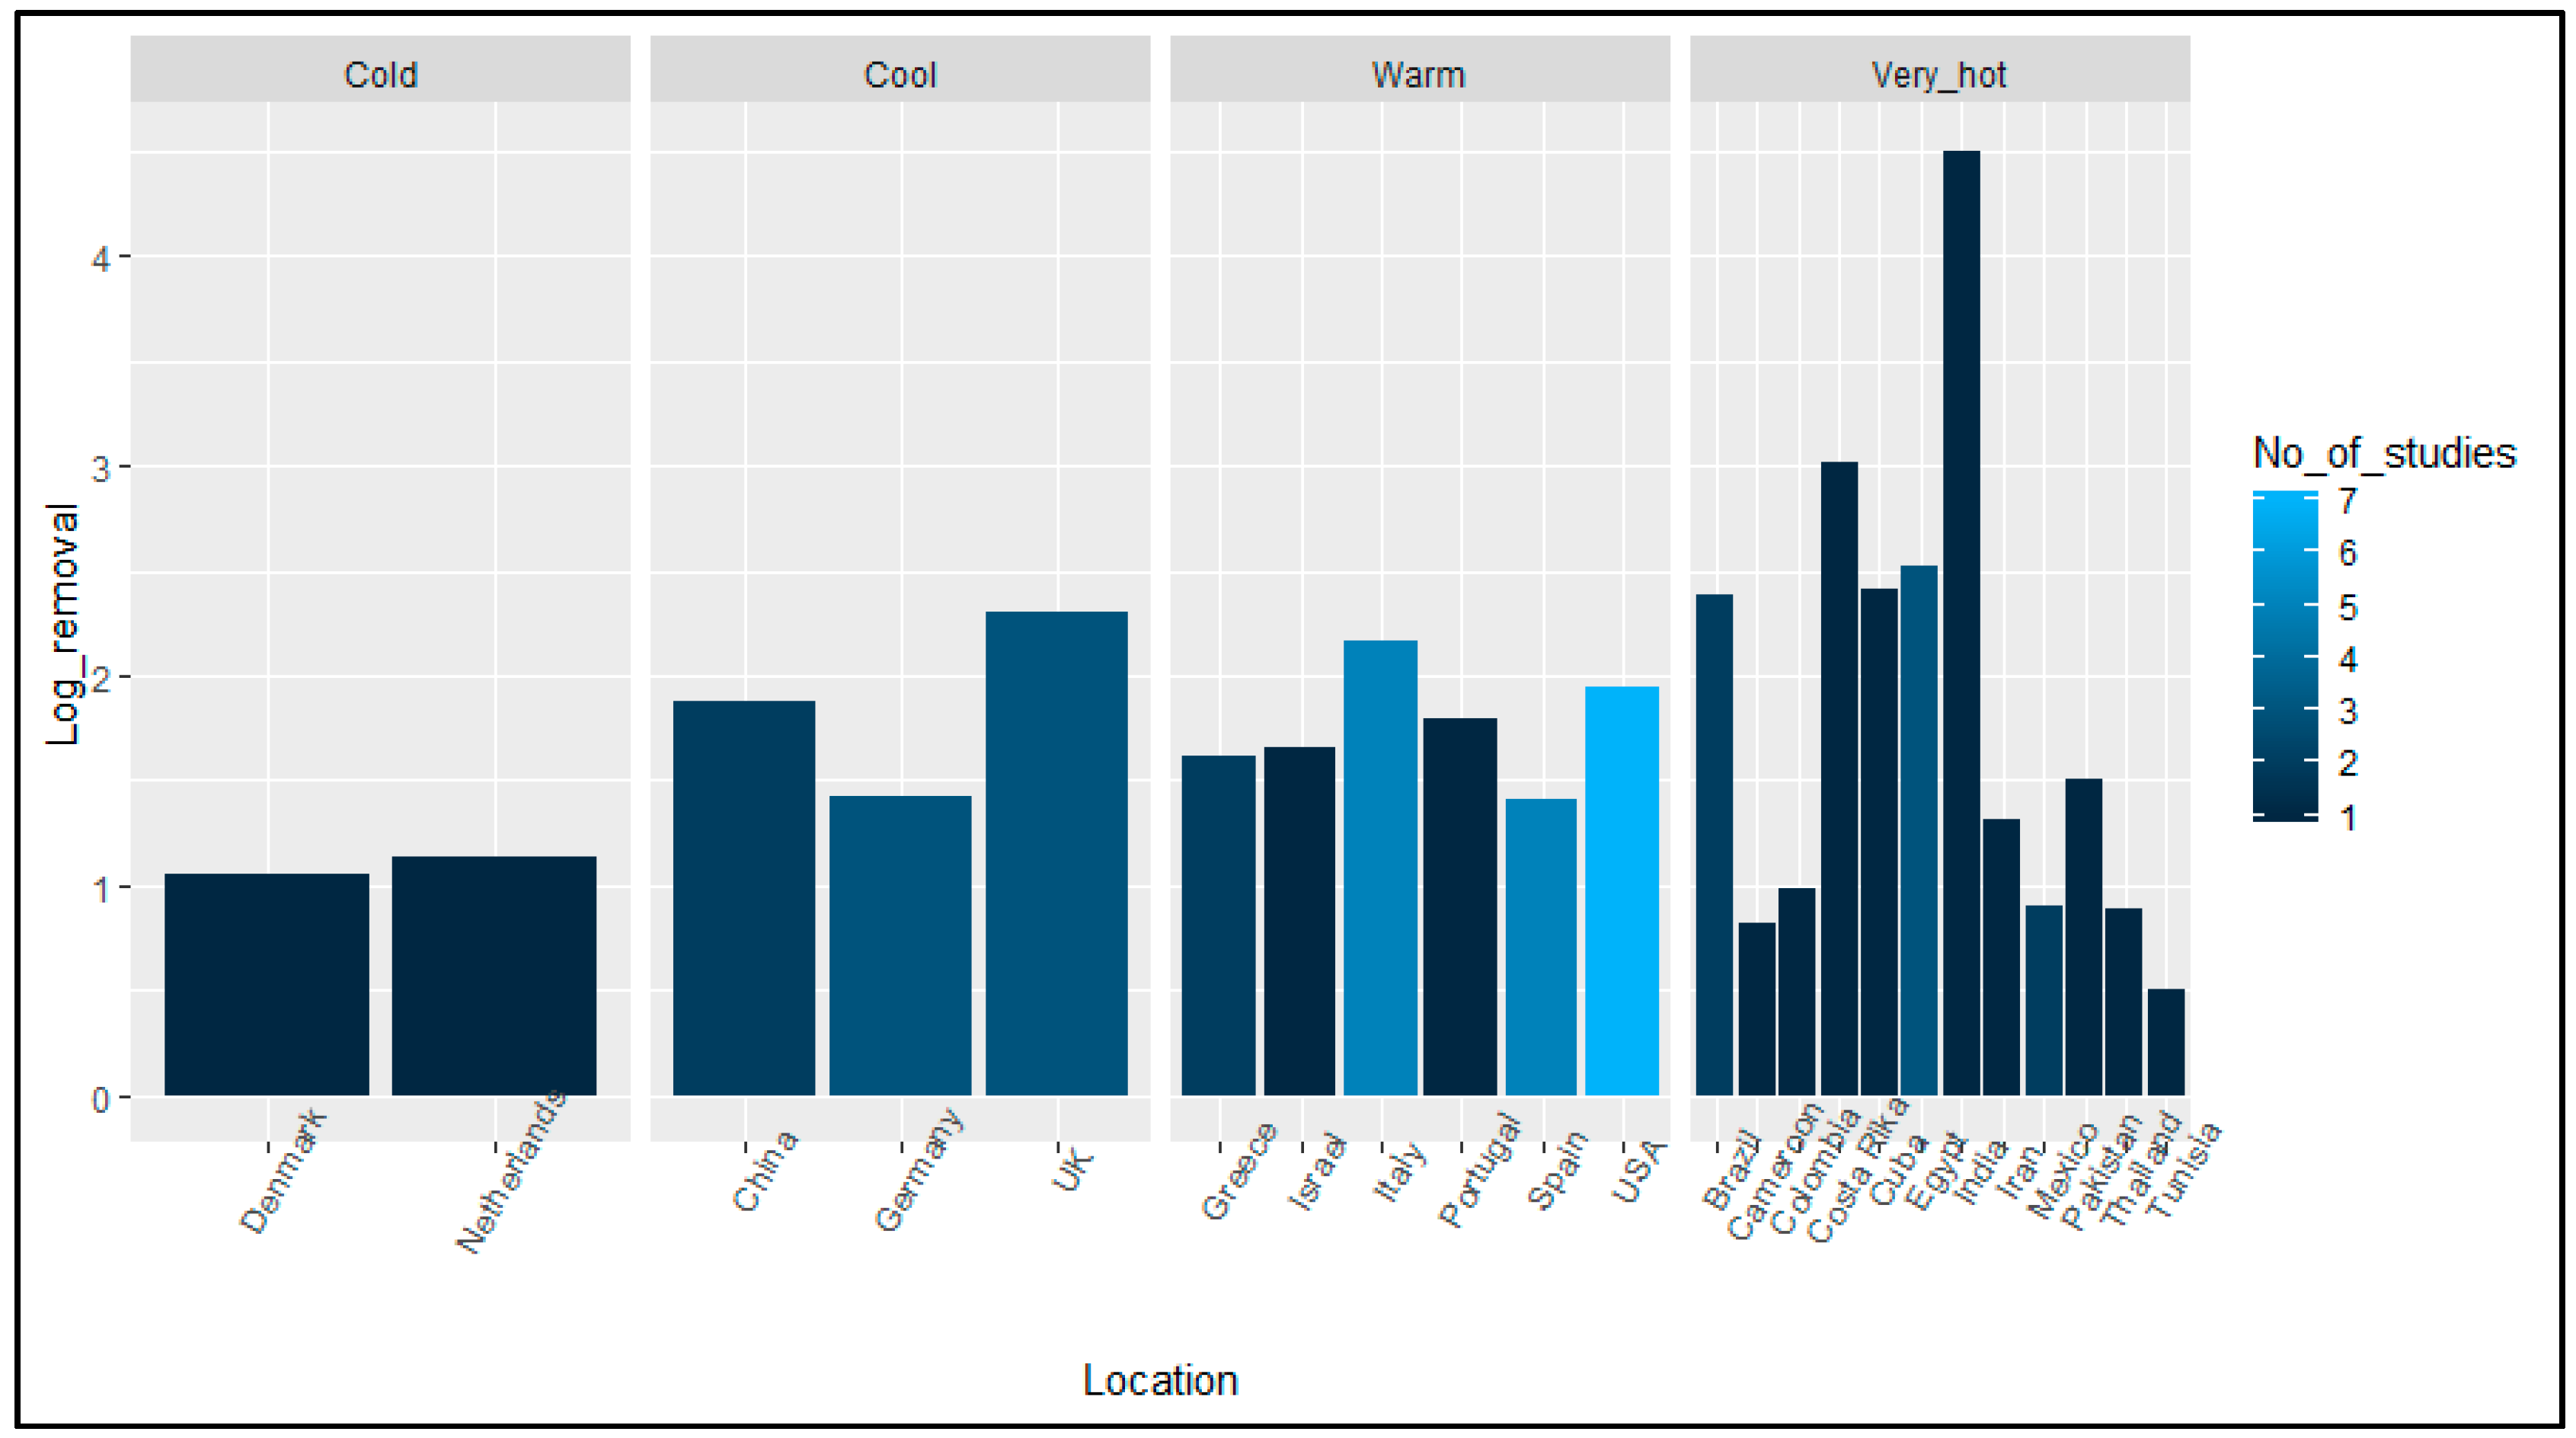
Figure 4 demonstrates the average log removal for case studies per country and the respective temperature/climatic zones throughout the world. Although there seems to be a trend in which higher removal values can be found in hot temperature zones, and rather low removal values can be found in cold and cool zones, a clear correlation was not found, since there is a significant variation within different zones. Additionally, the log removal values are averaged per country and in many cases, there is only one case study per country.
3.2. Overall Performance of CW Types
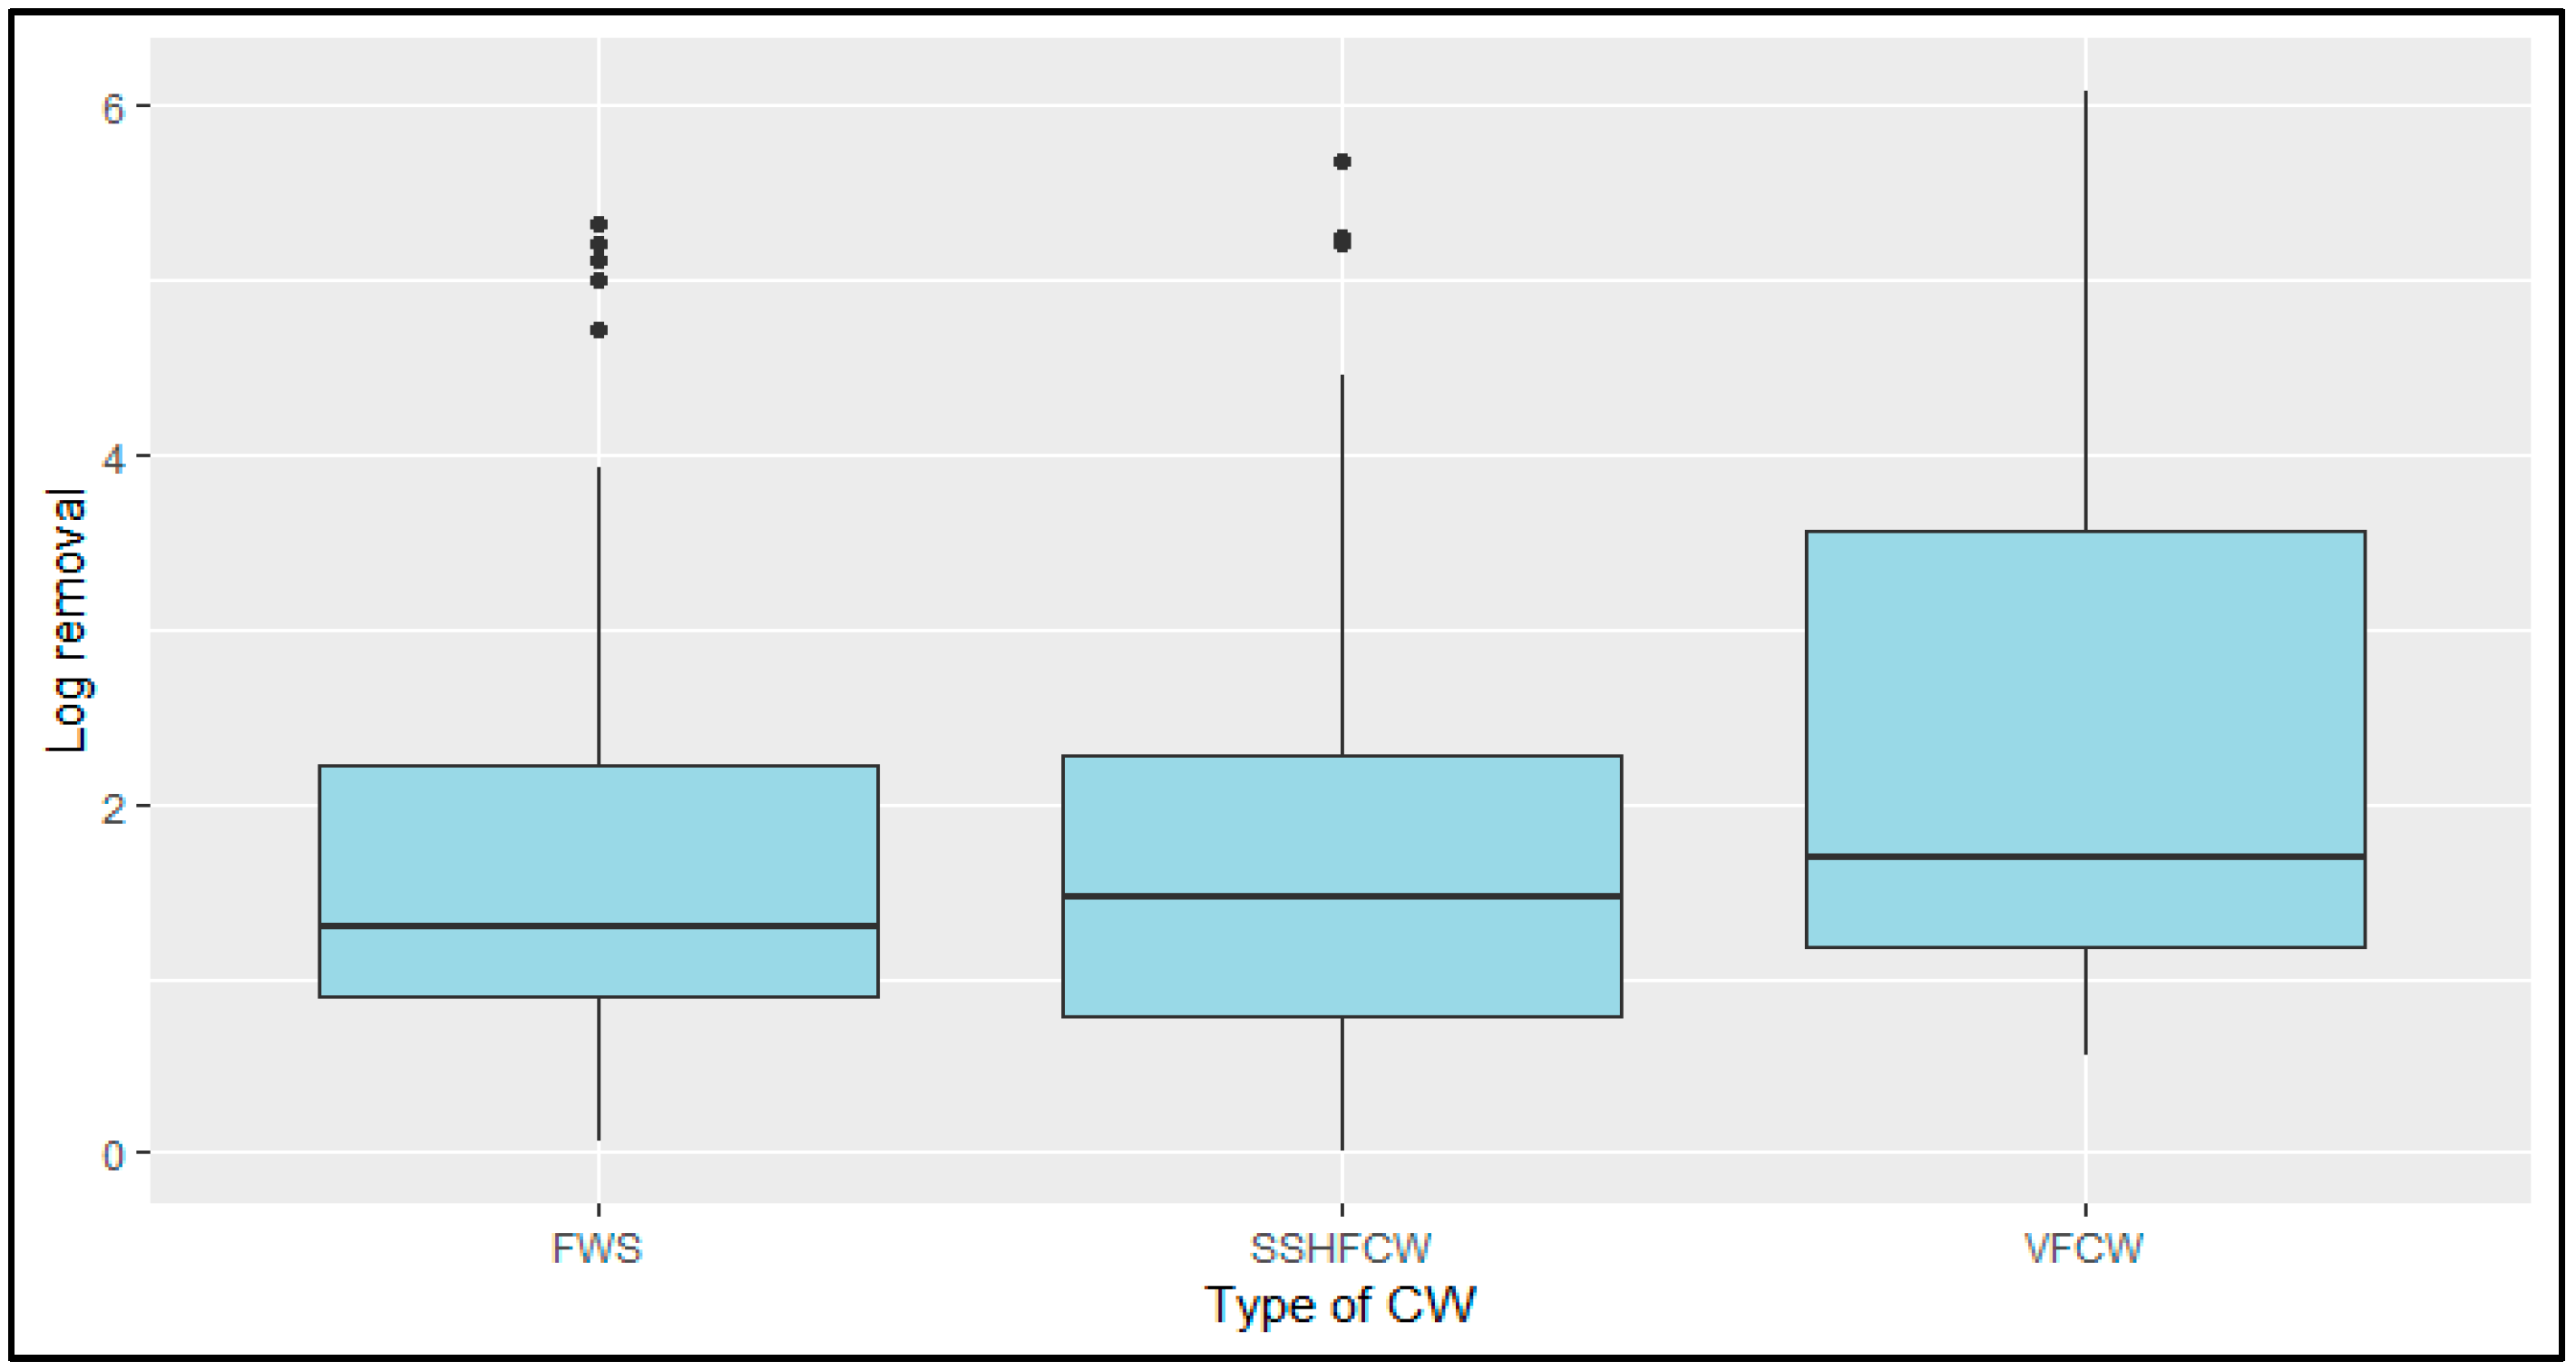
Figure 5 shows that the log removal for the three types of CWs ranges between 1 and 6 log, whereas the average value ranges between 1 and 2 log. Table 2 demonstrates the overall performance of CWs. The majority of the papers in the systematic literature review used SSHFCW for the removal of pathogens, whereas all types seem to have a potential of pathogen removal to a certain level. Briefly, the FWS types have log removal values ranging from 0.07 to 5.3 log, the SSHFCW from 0.01 to 5.68 log, and finally the VFCW type from 0.35 to 6.08 log.
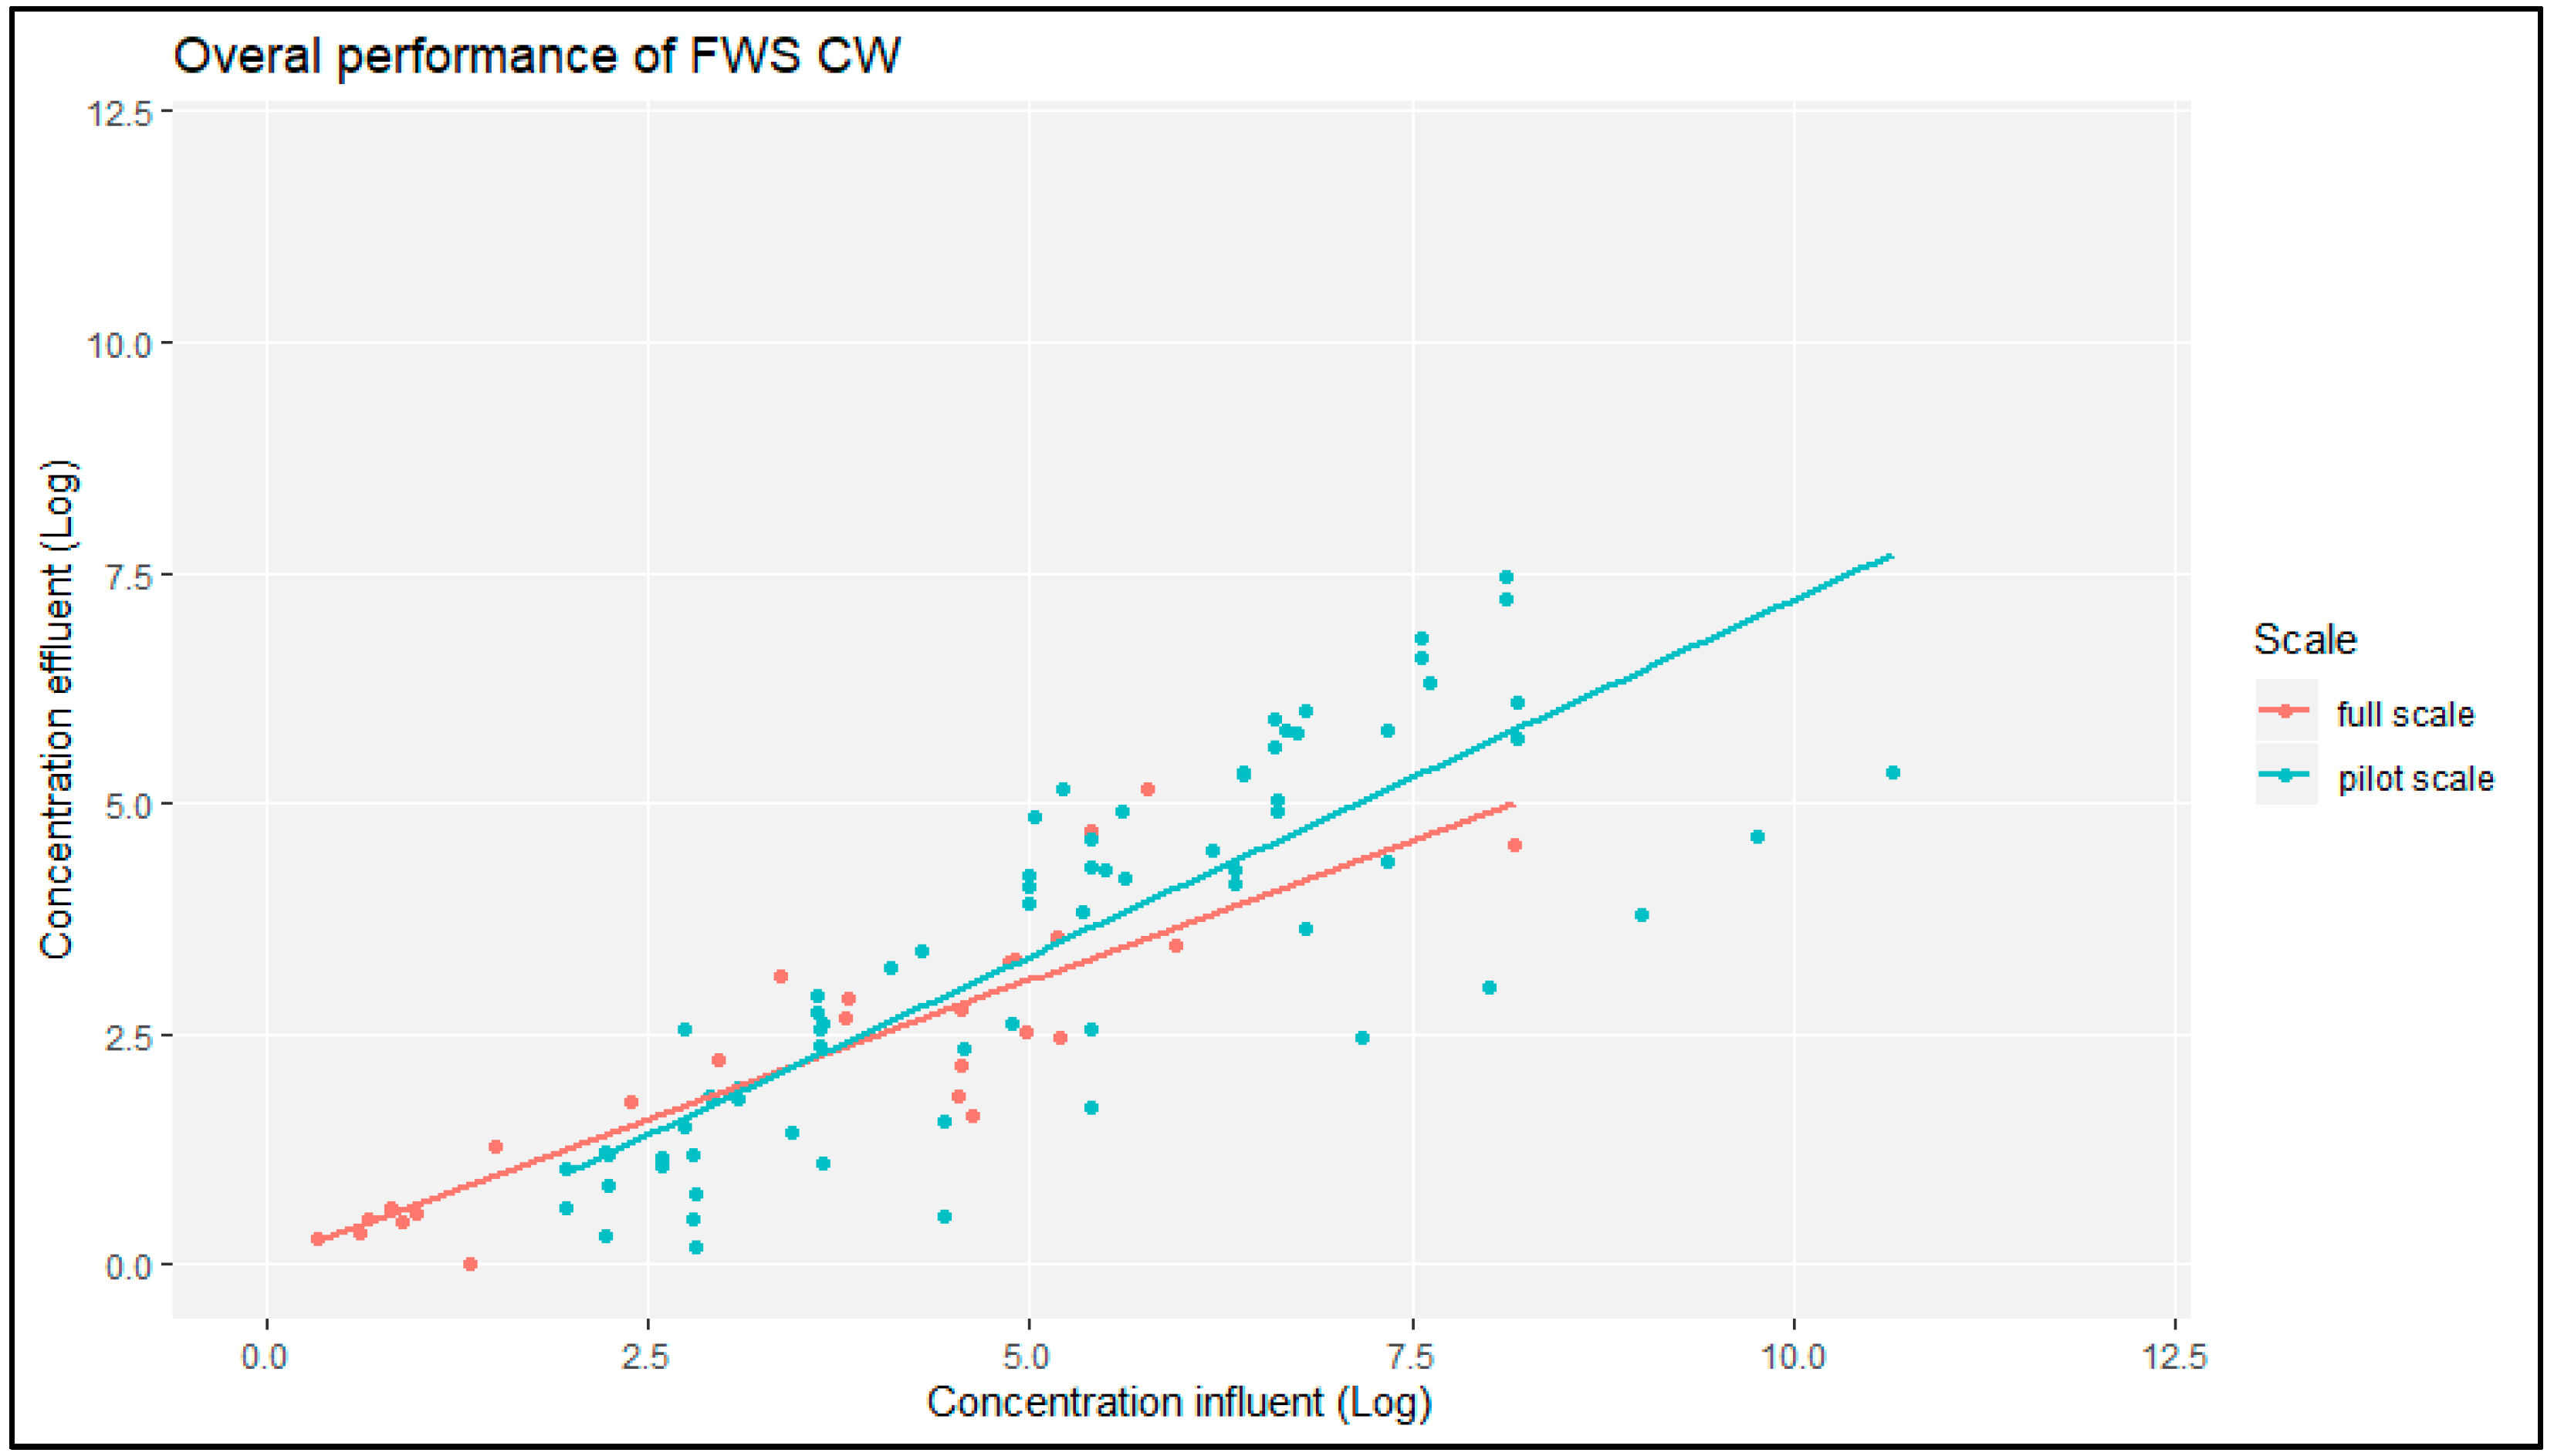
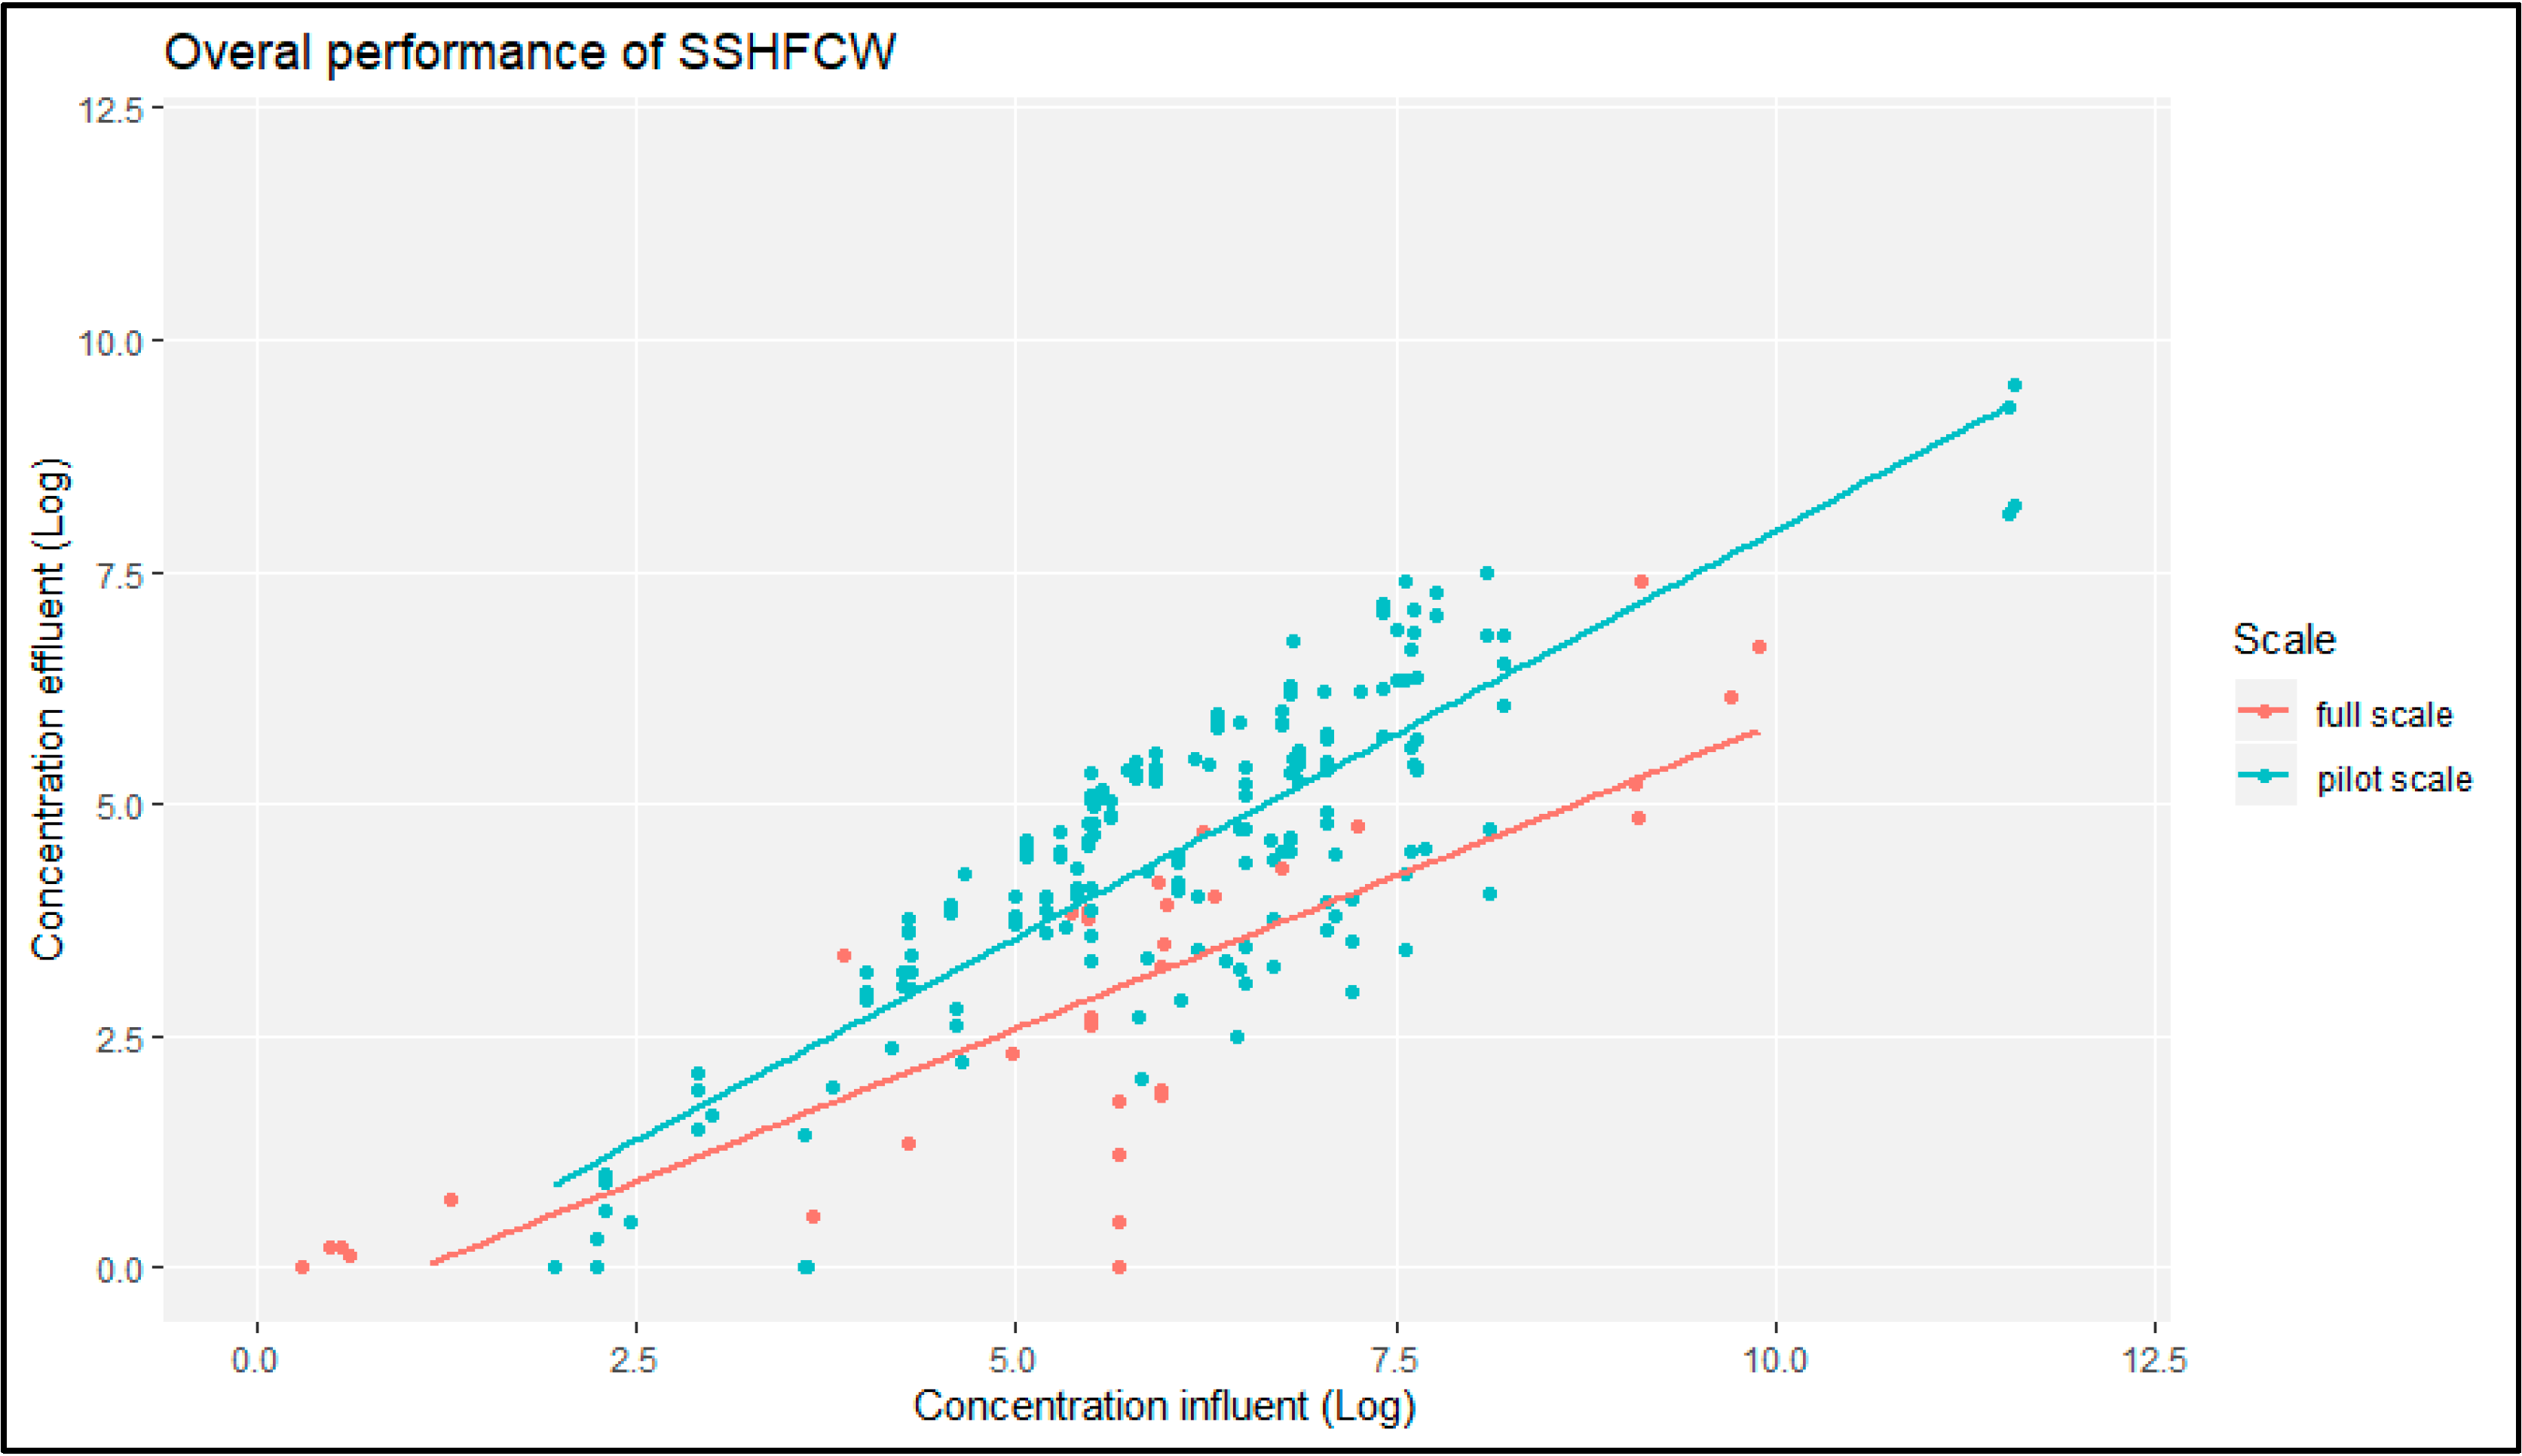
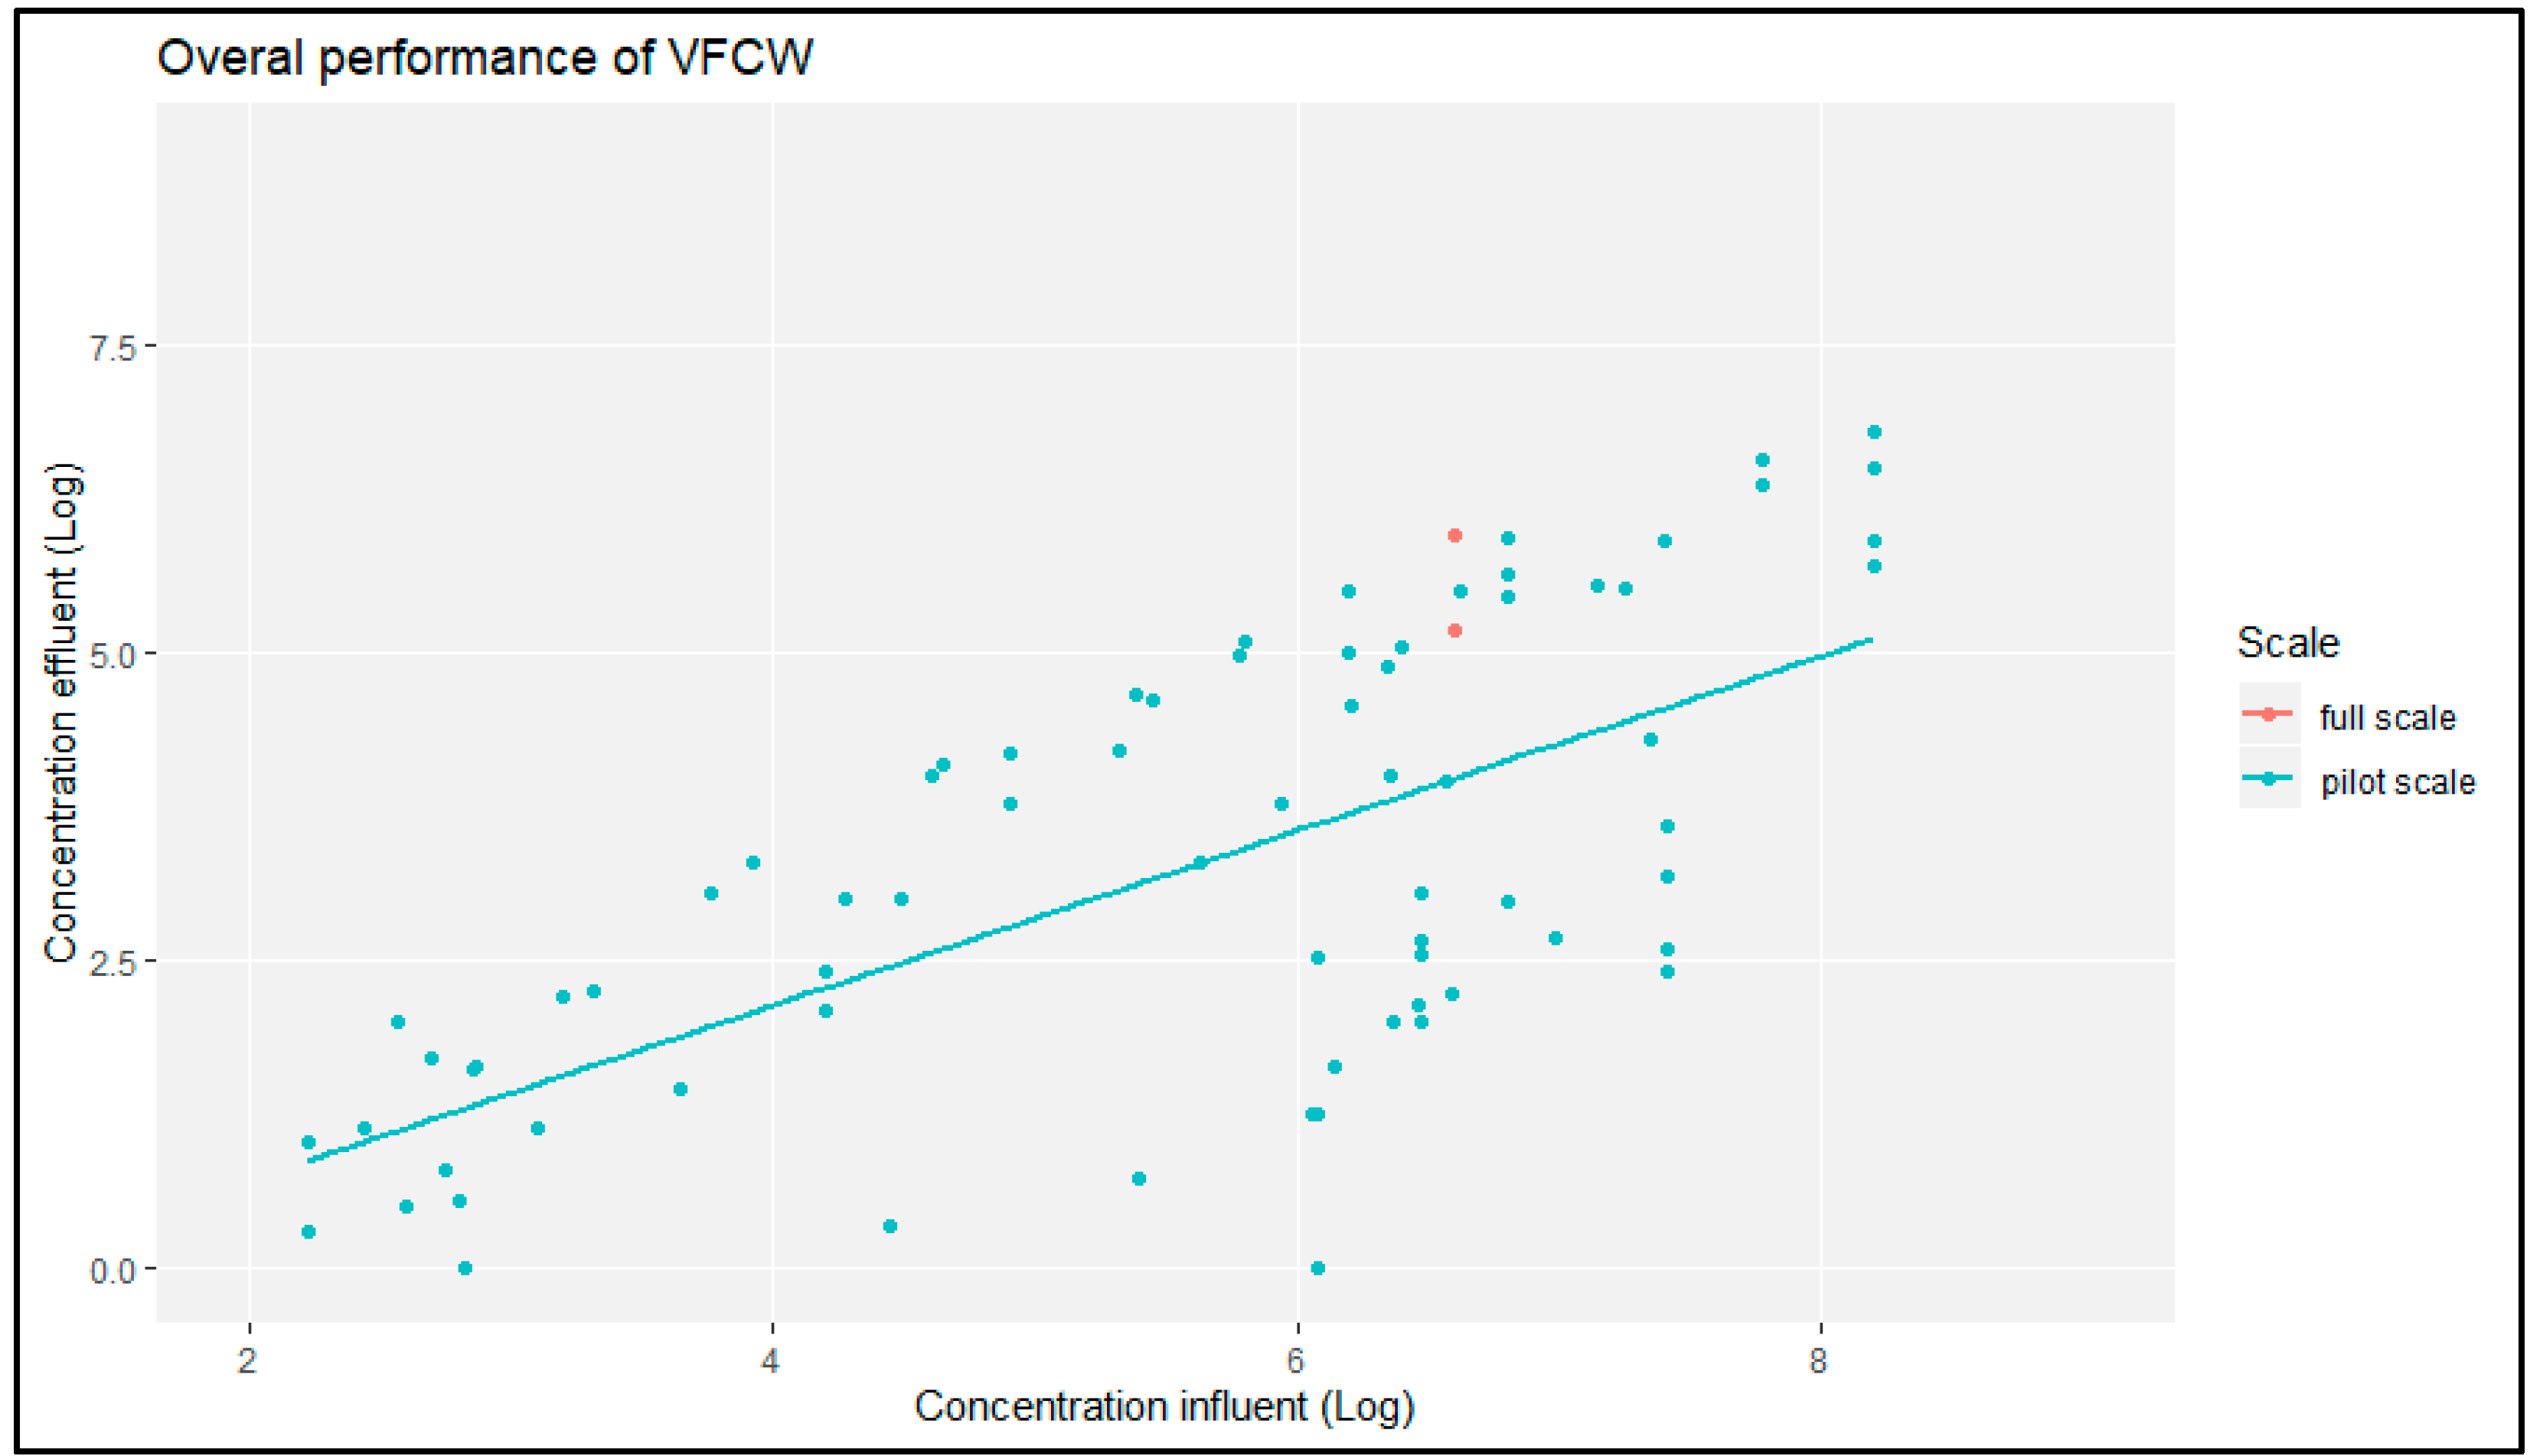
Moreover, by plotting the influent versus the effluent concentrations of pathogens, there seems to be a positive correlation and potentially a non-linear relationship between the two parameters (the example of FWS is shown in Figure 6 whilst the rest can be found in Appendix C). That means that other parameters (HRL and/or HRT) also influence the removal of pathogens.
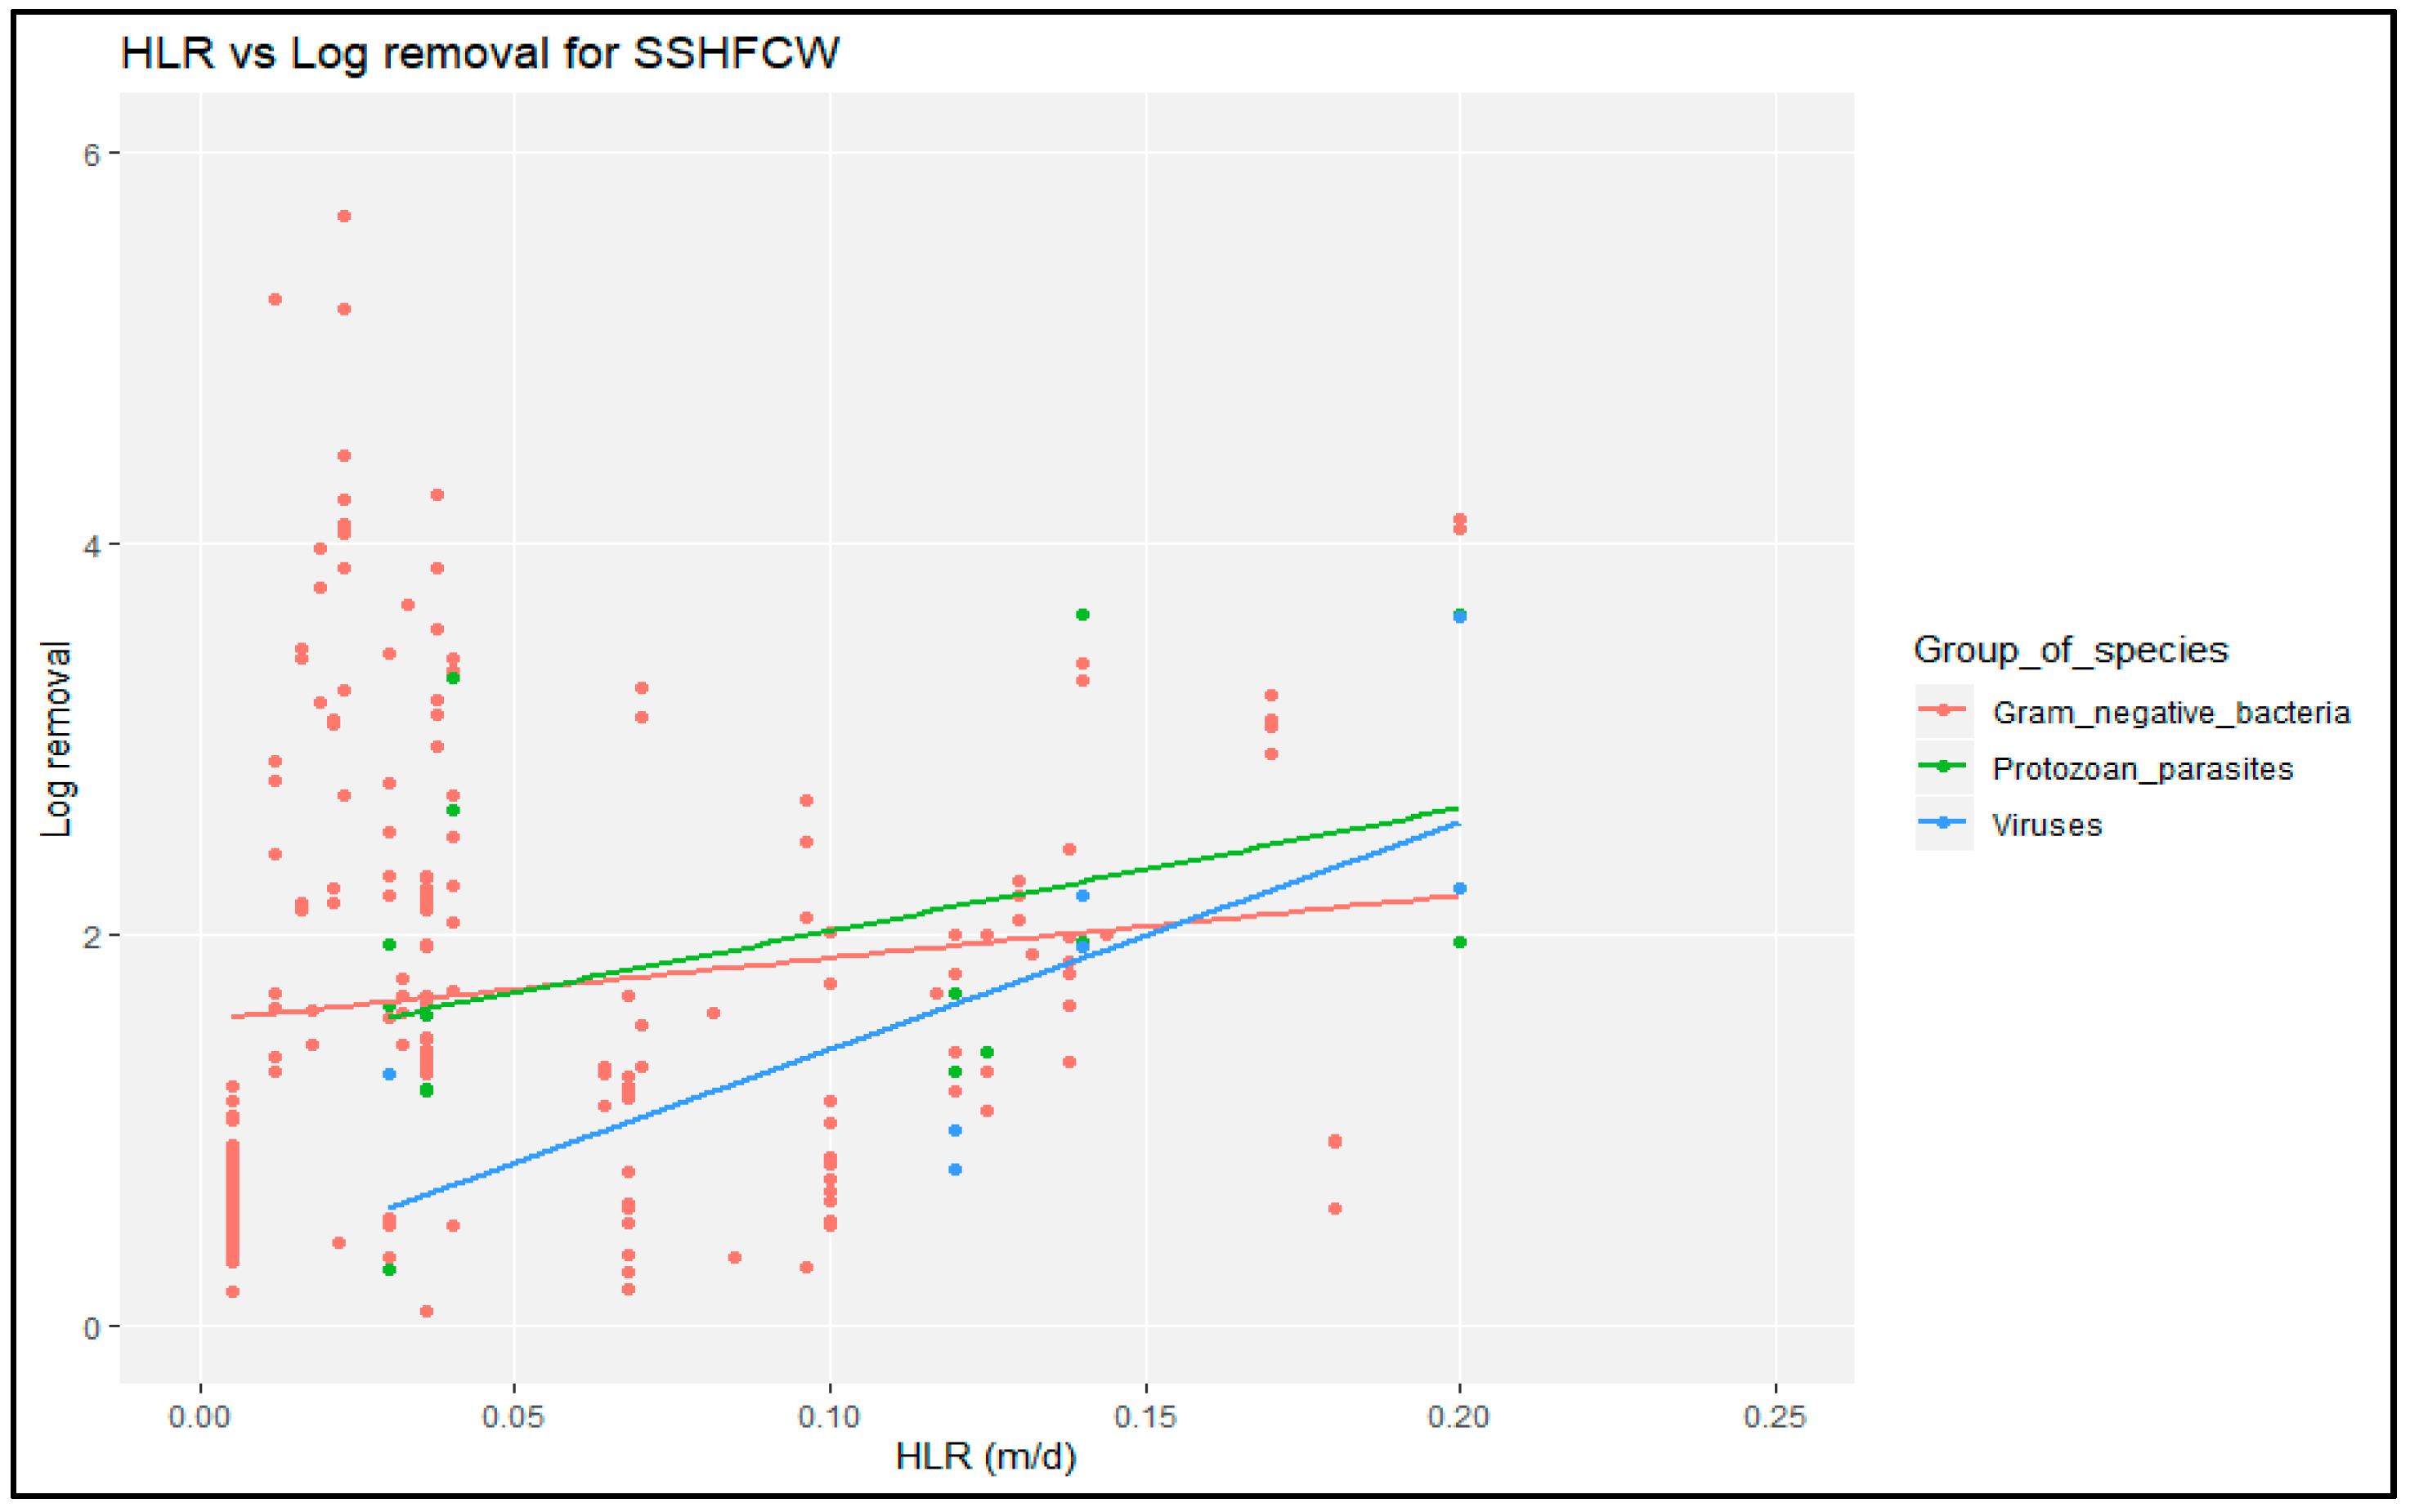
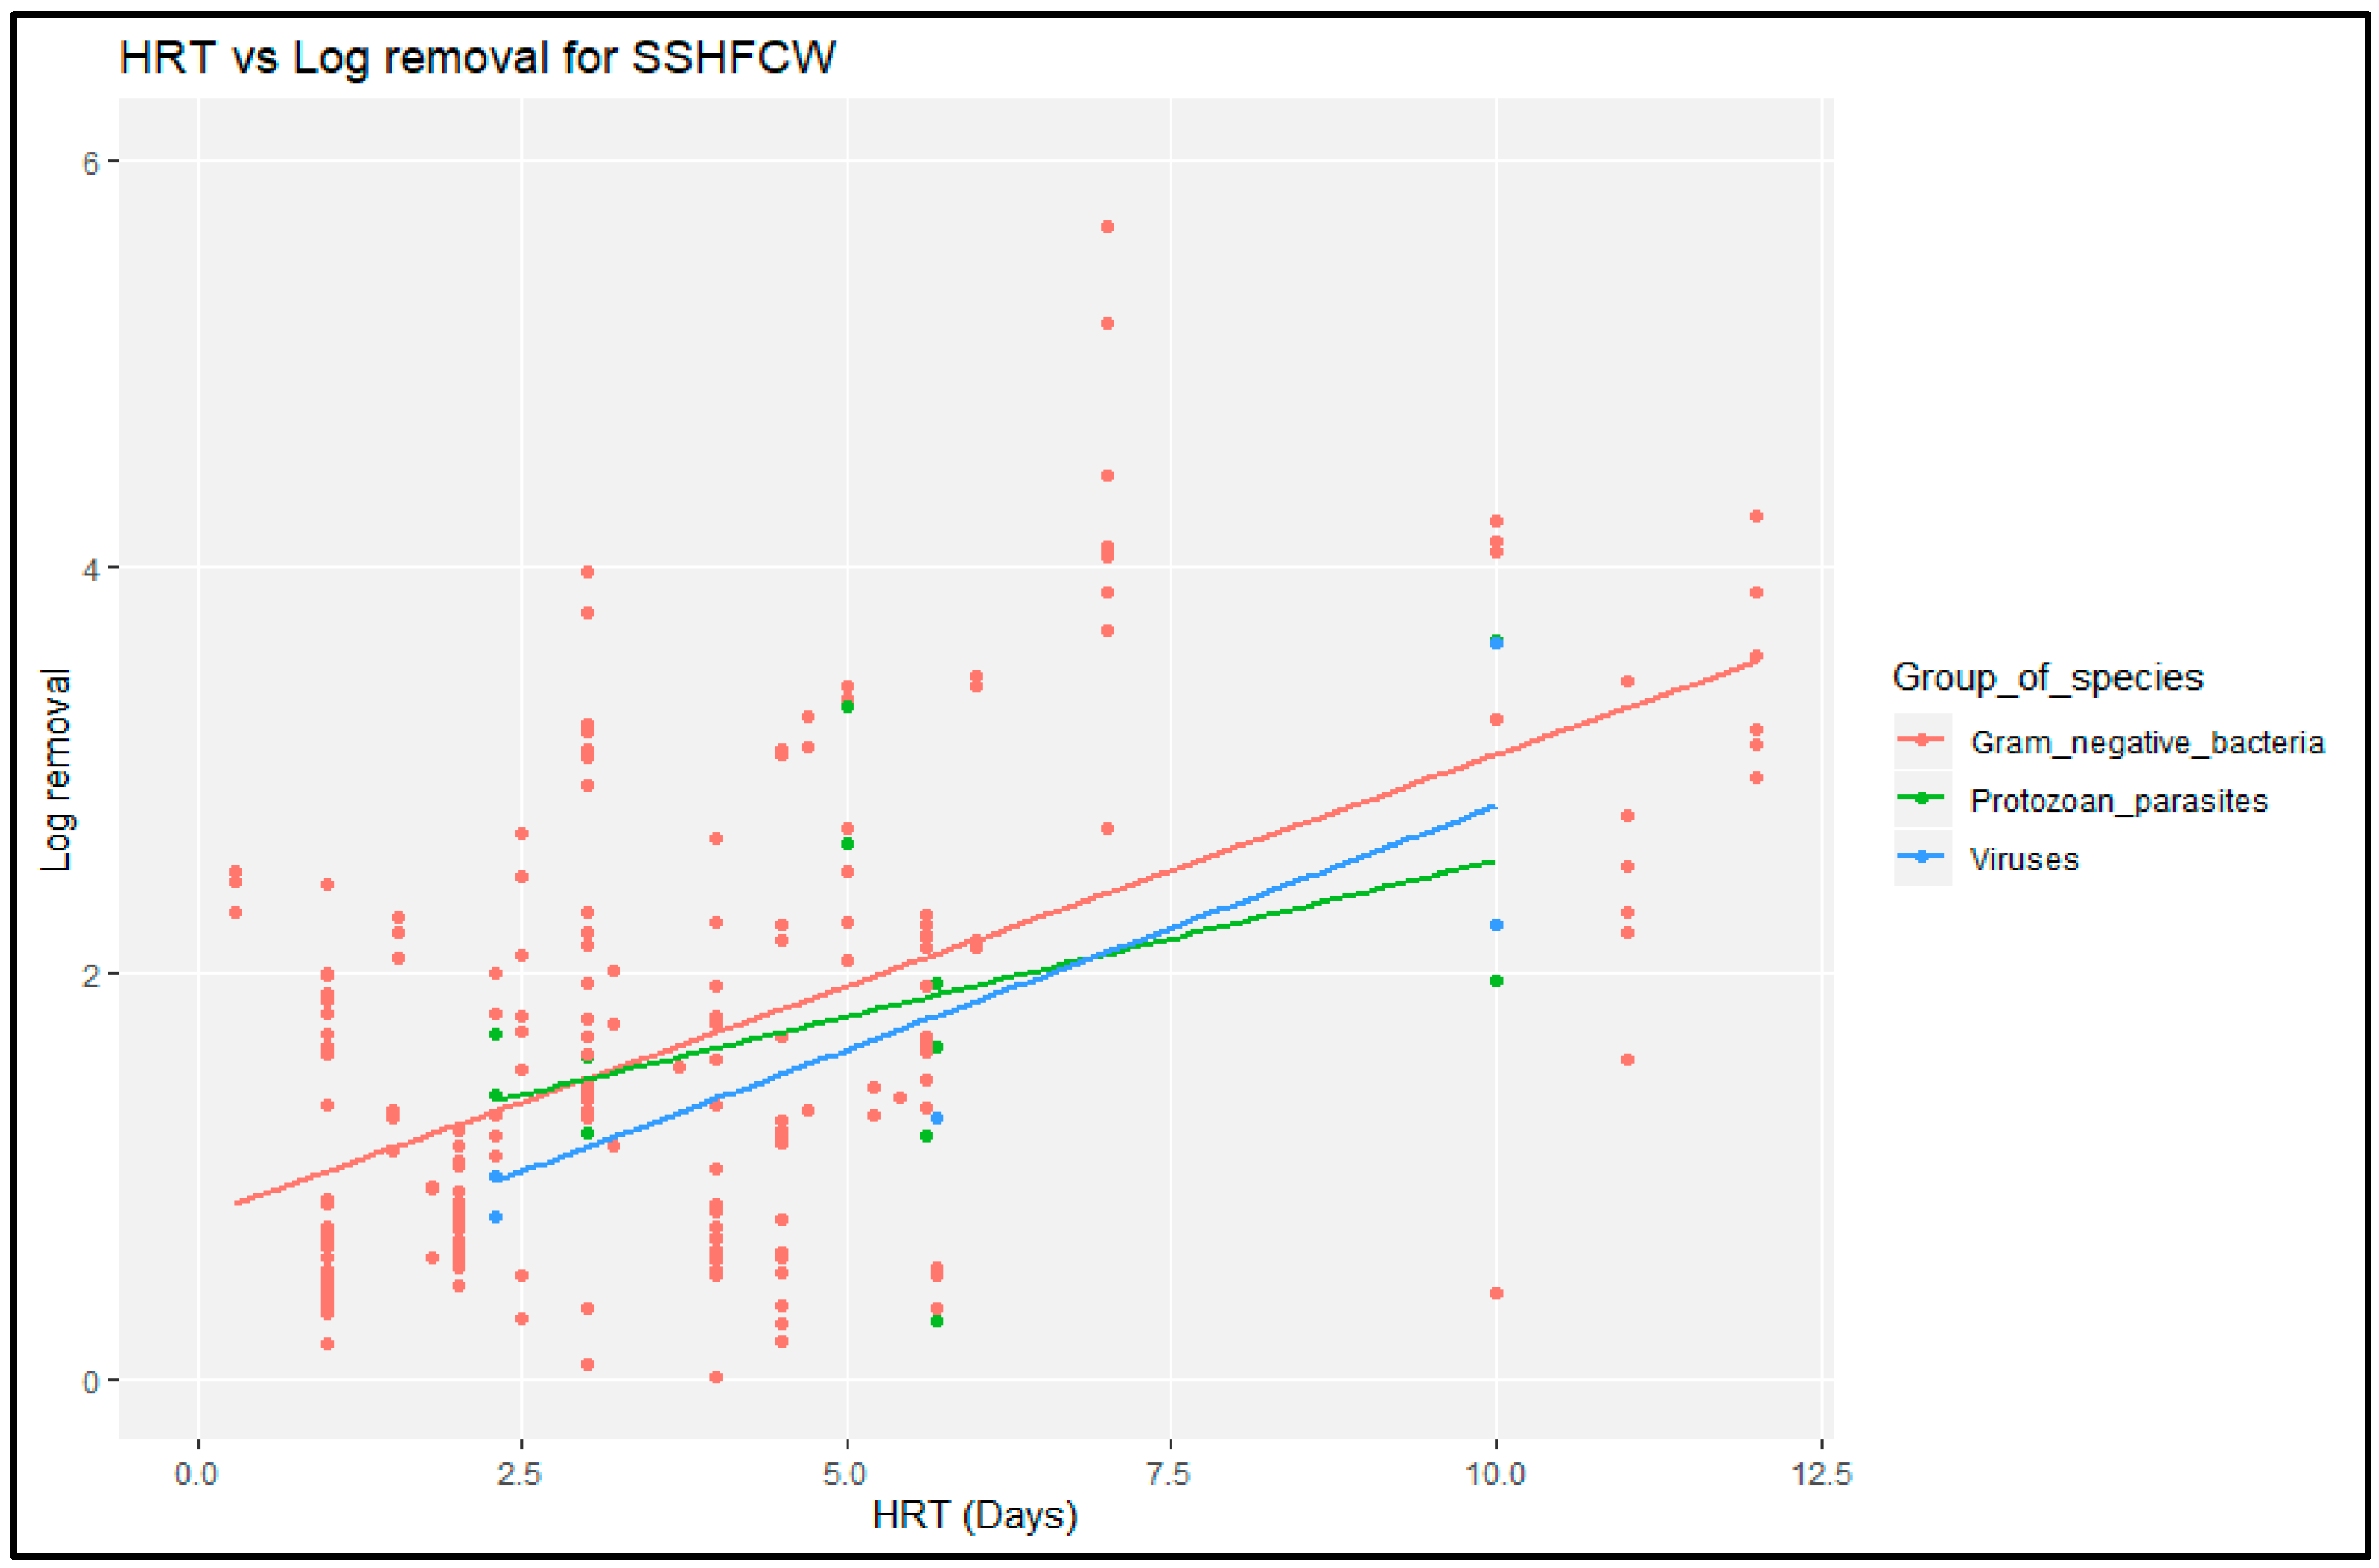
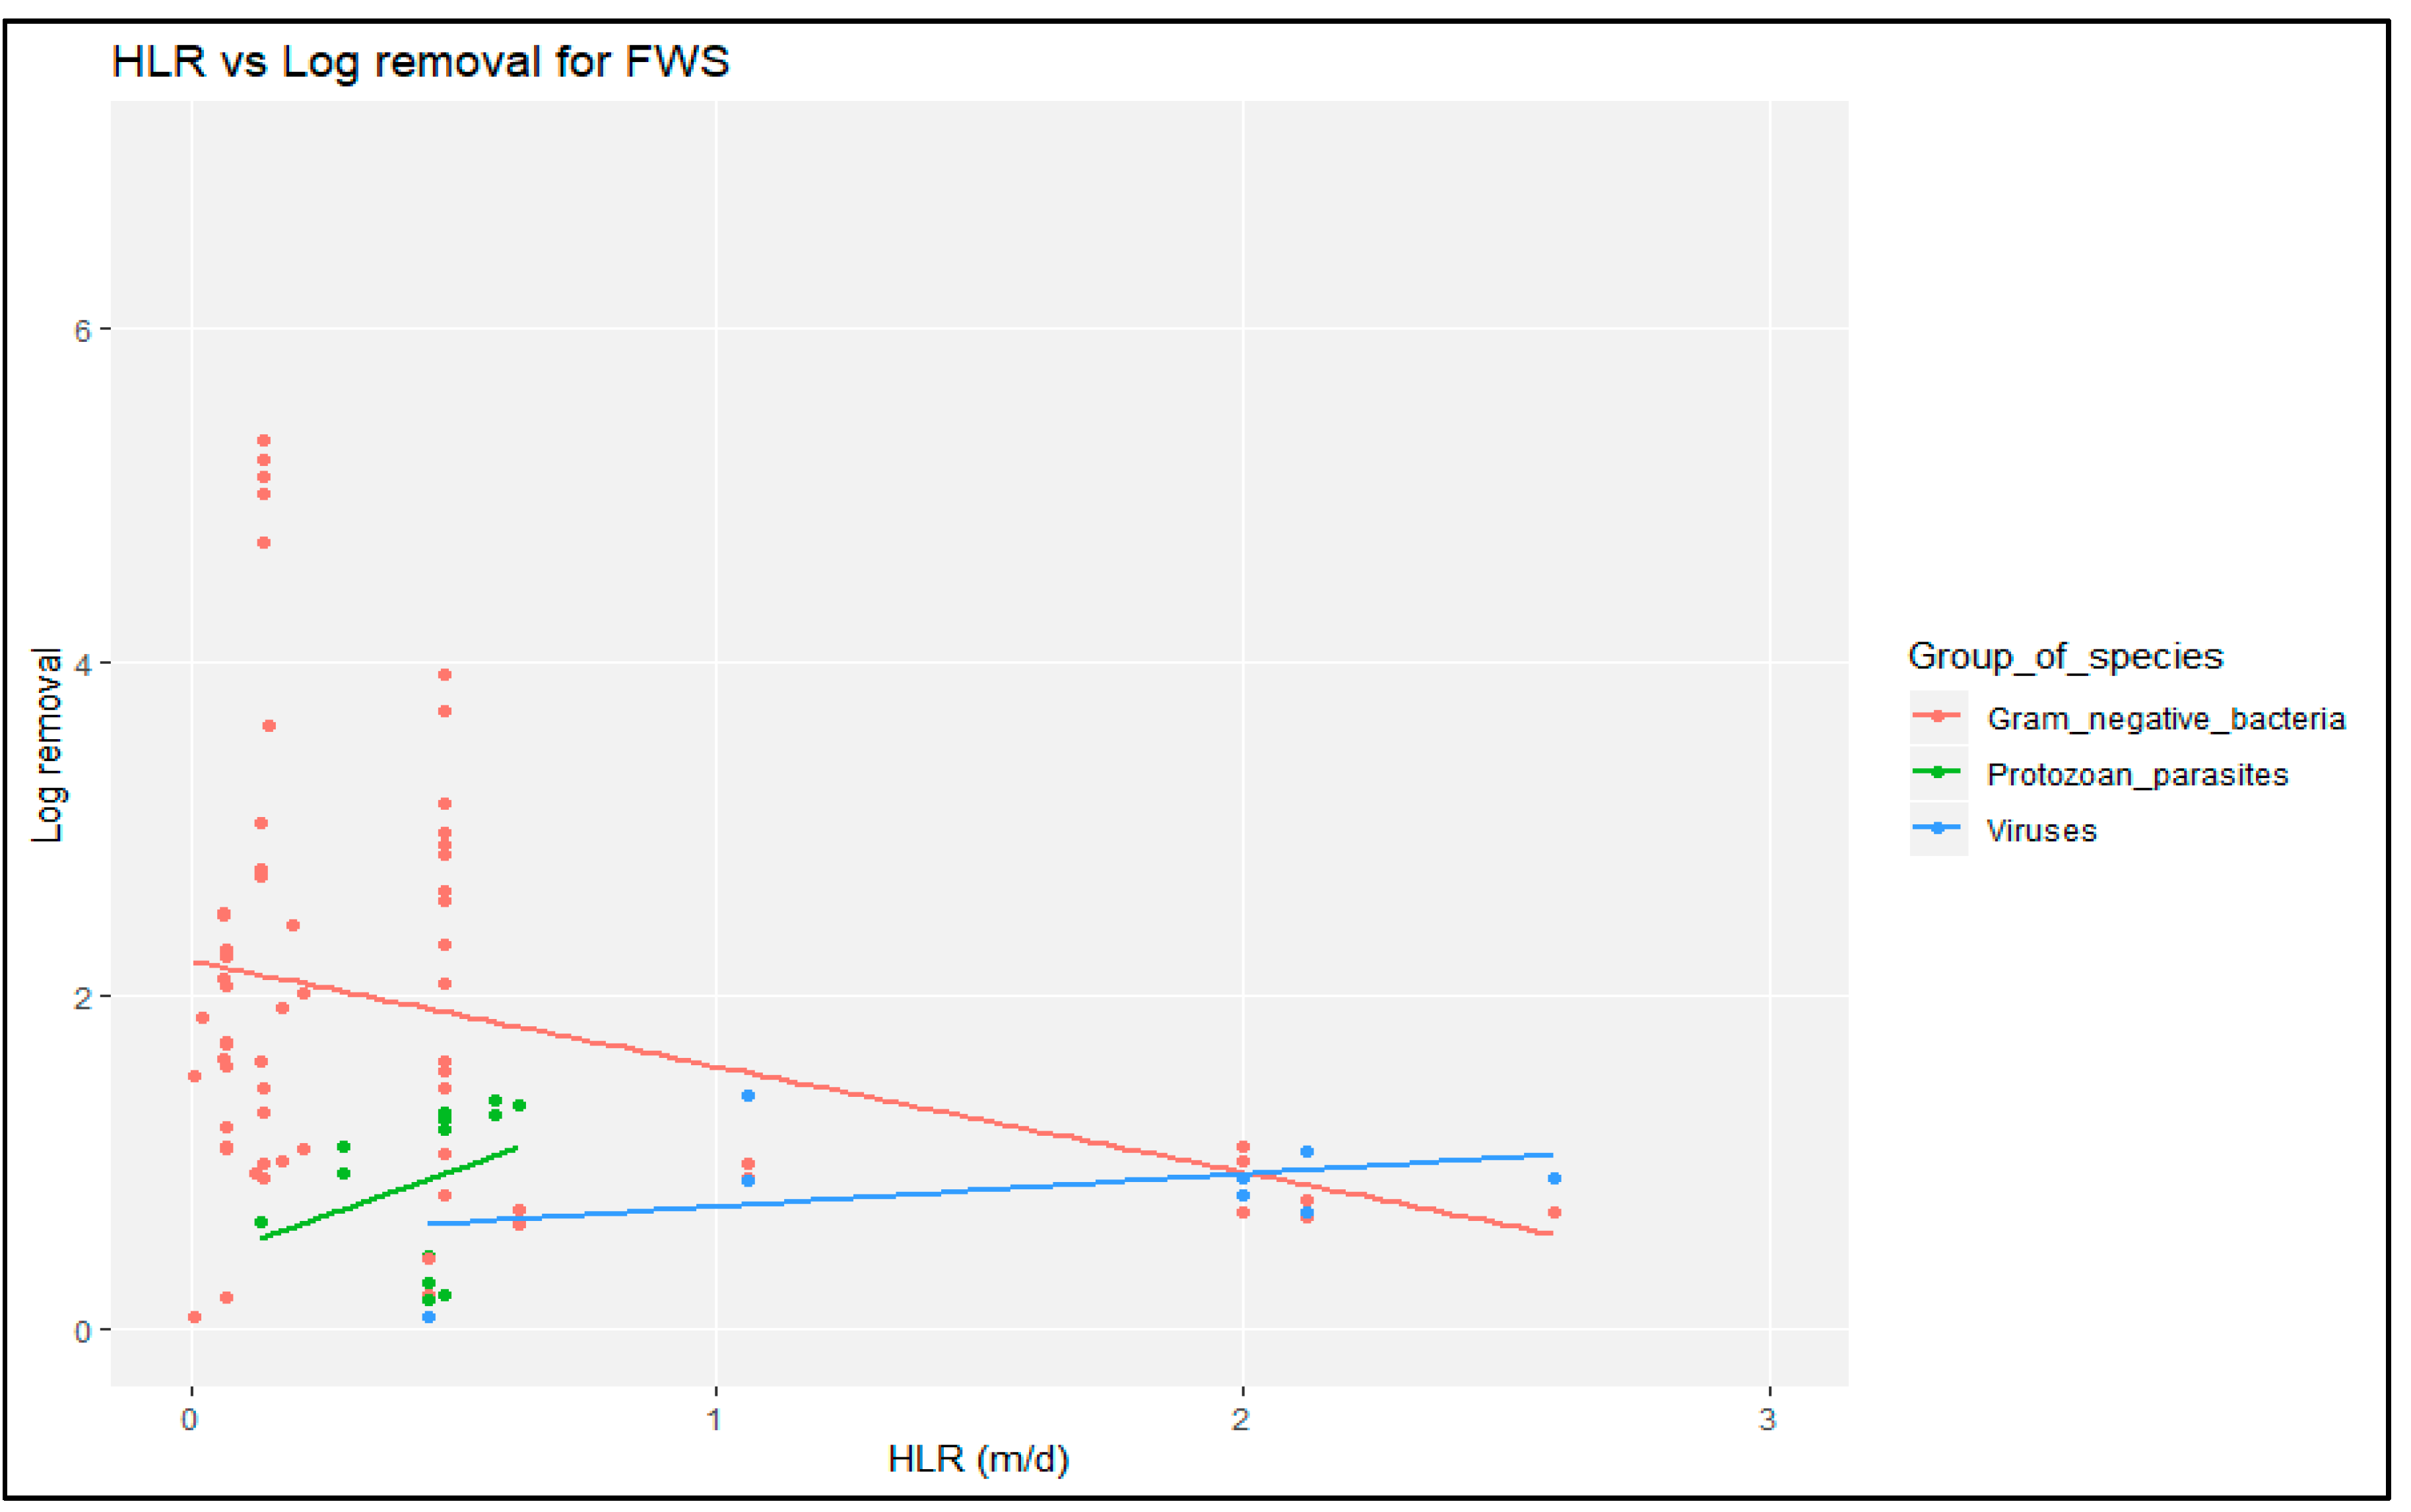
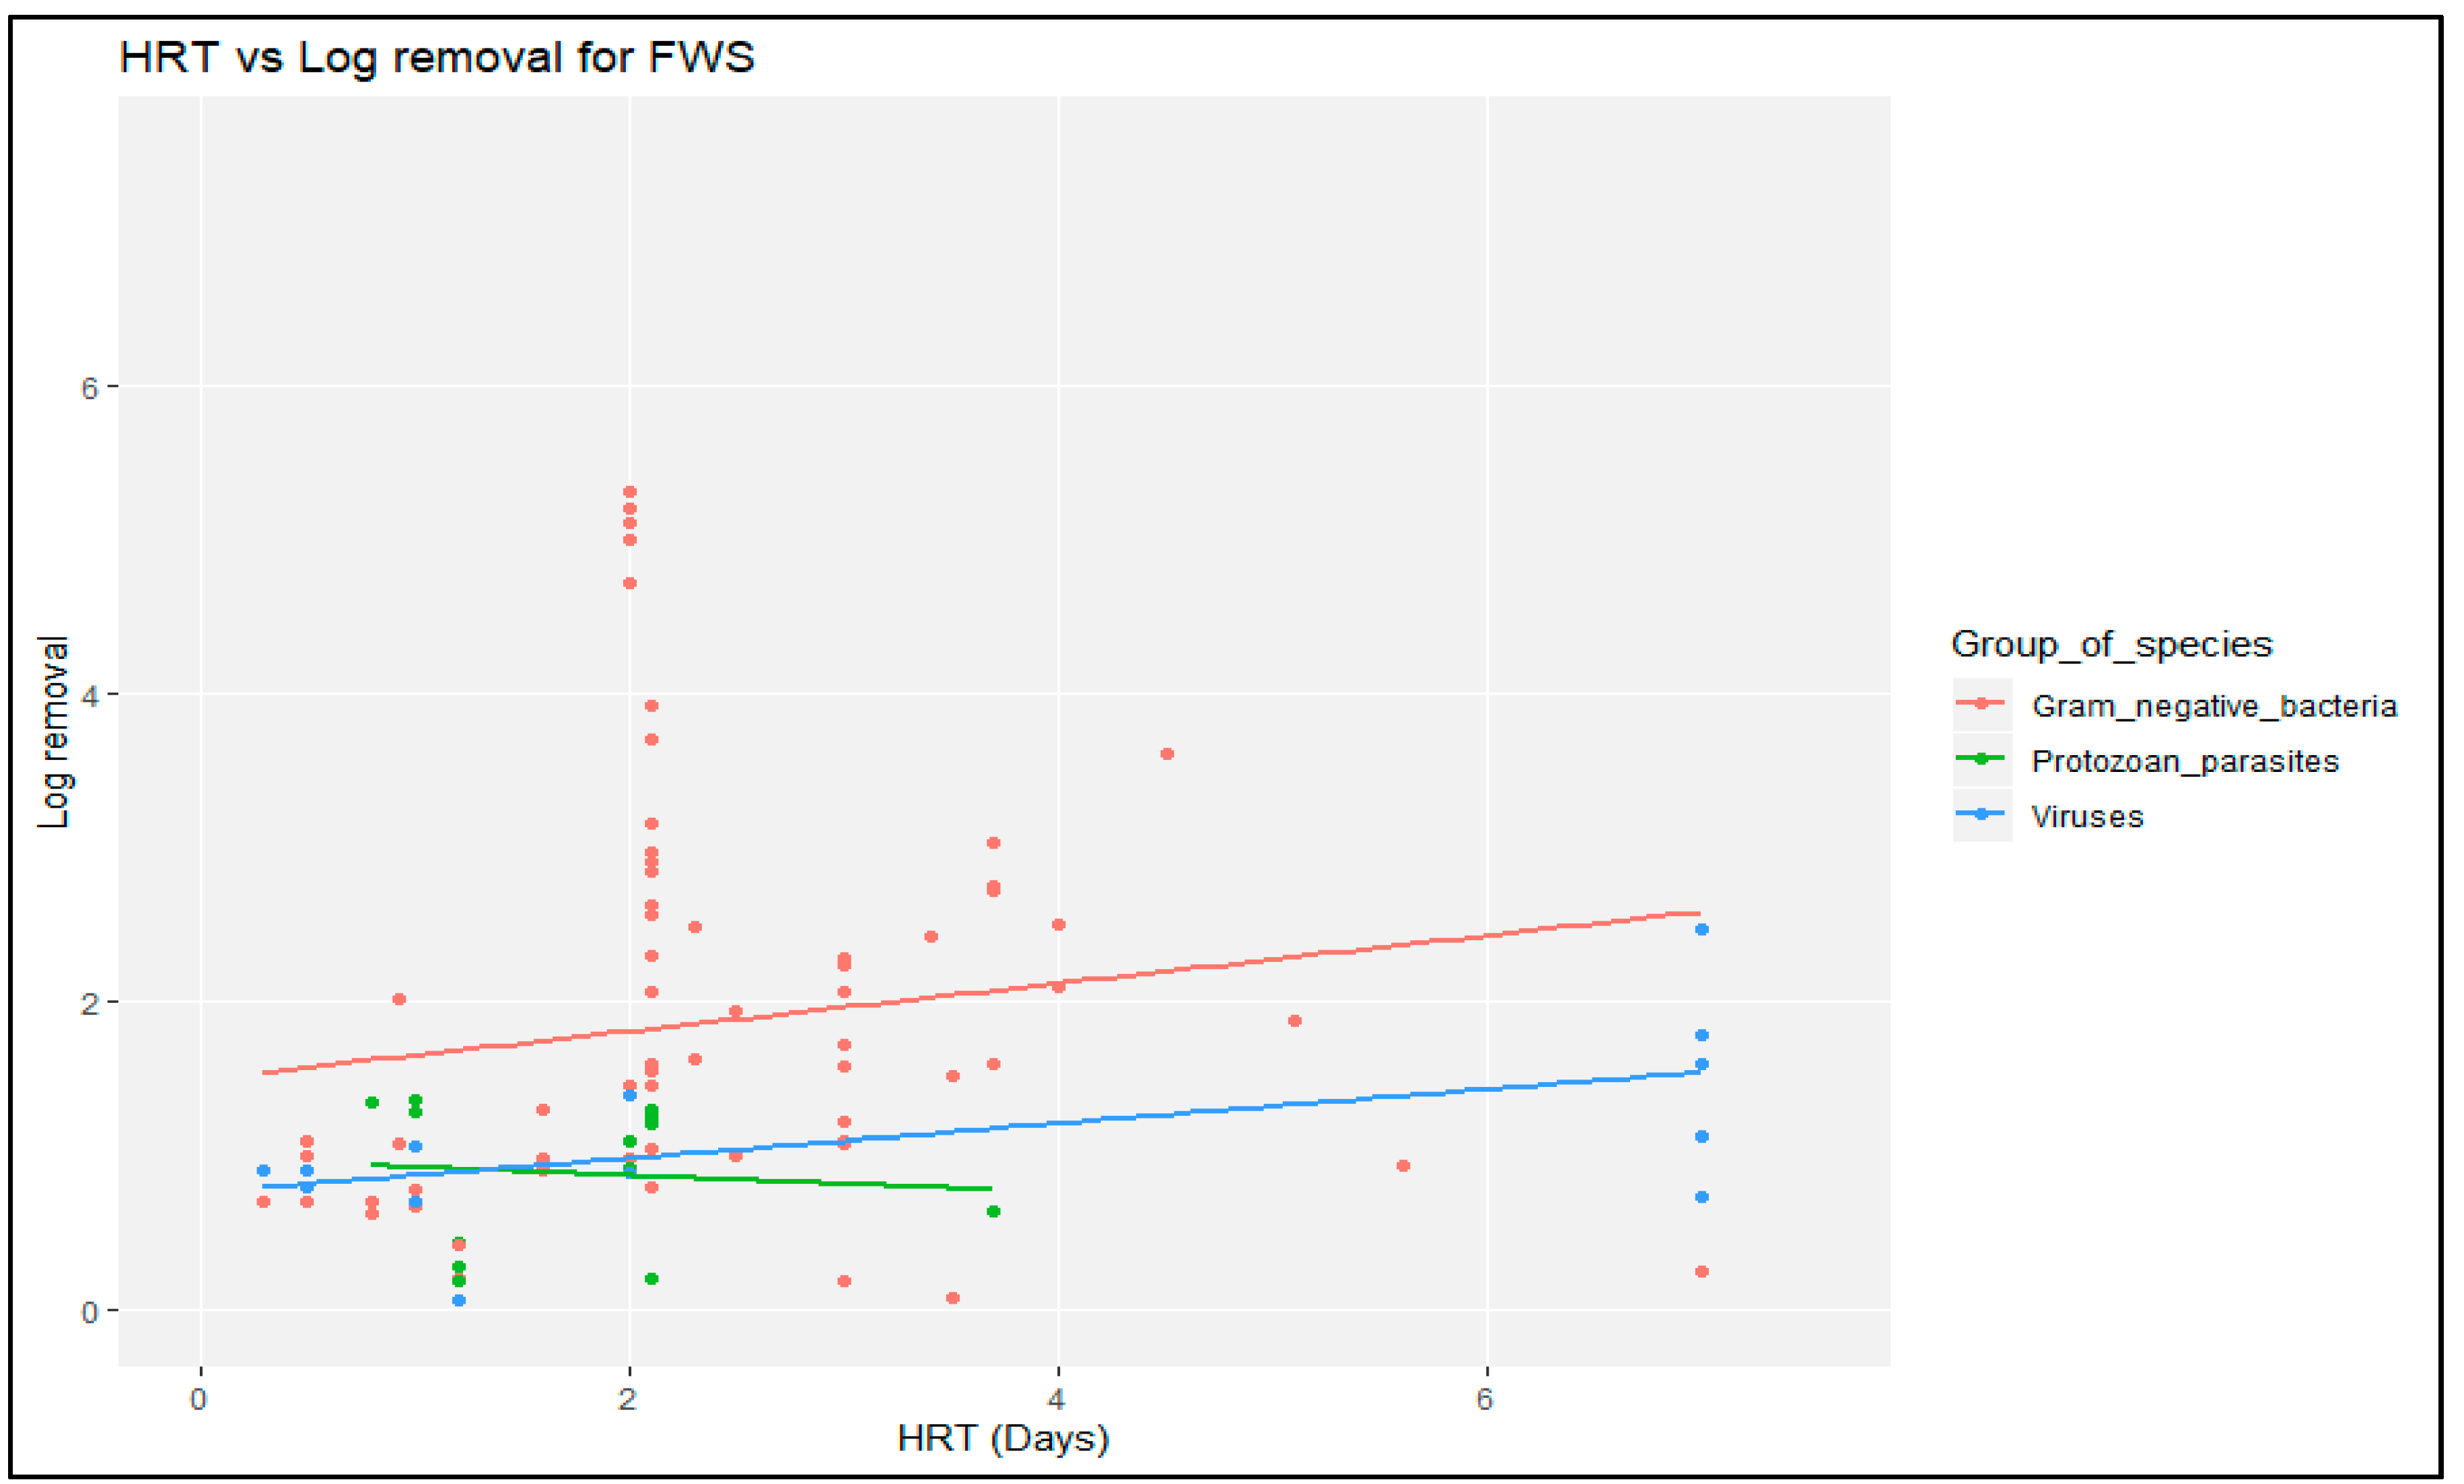
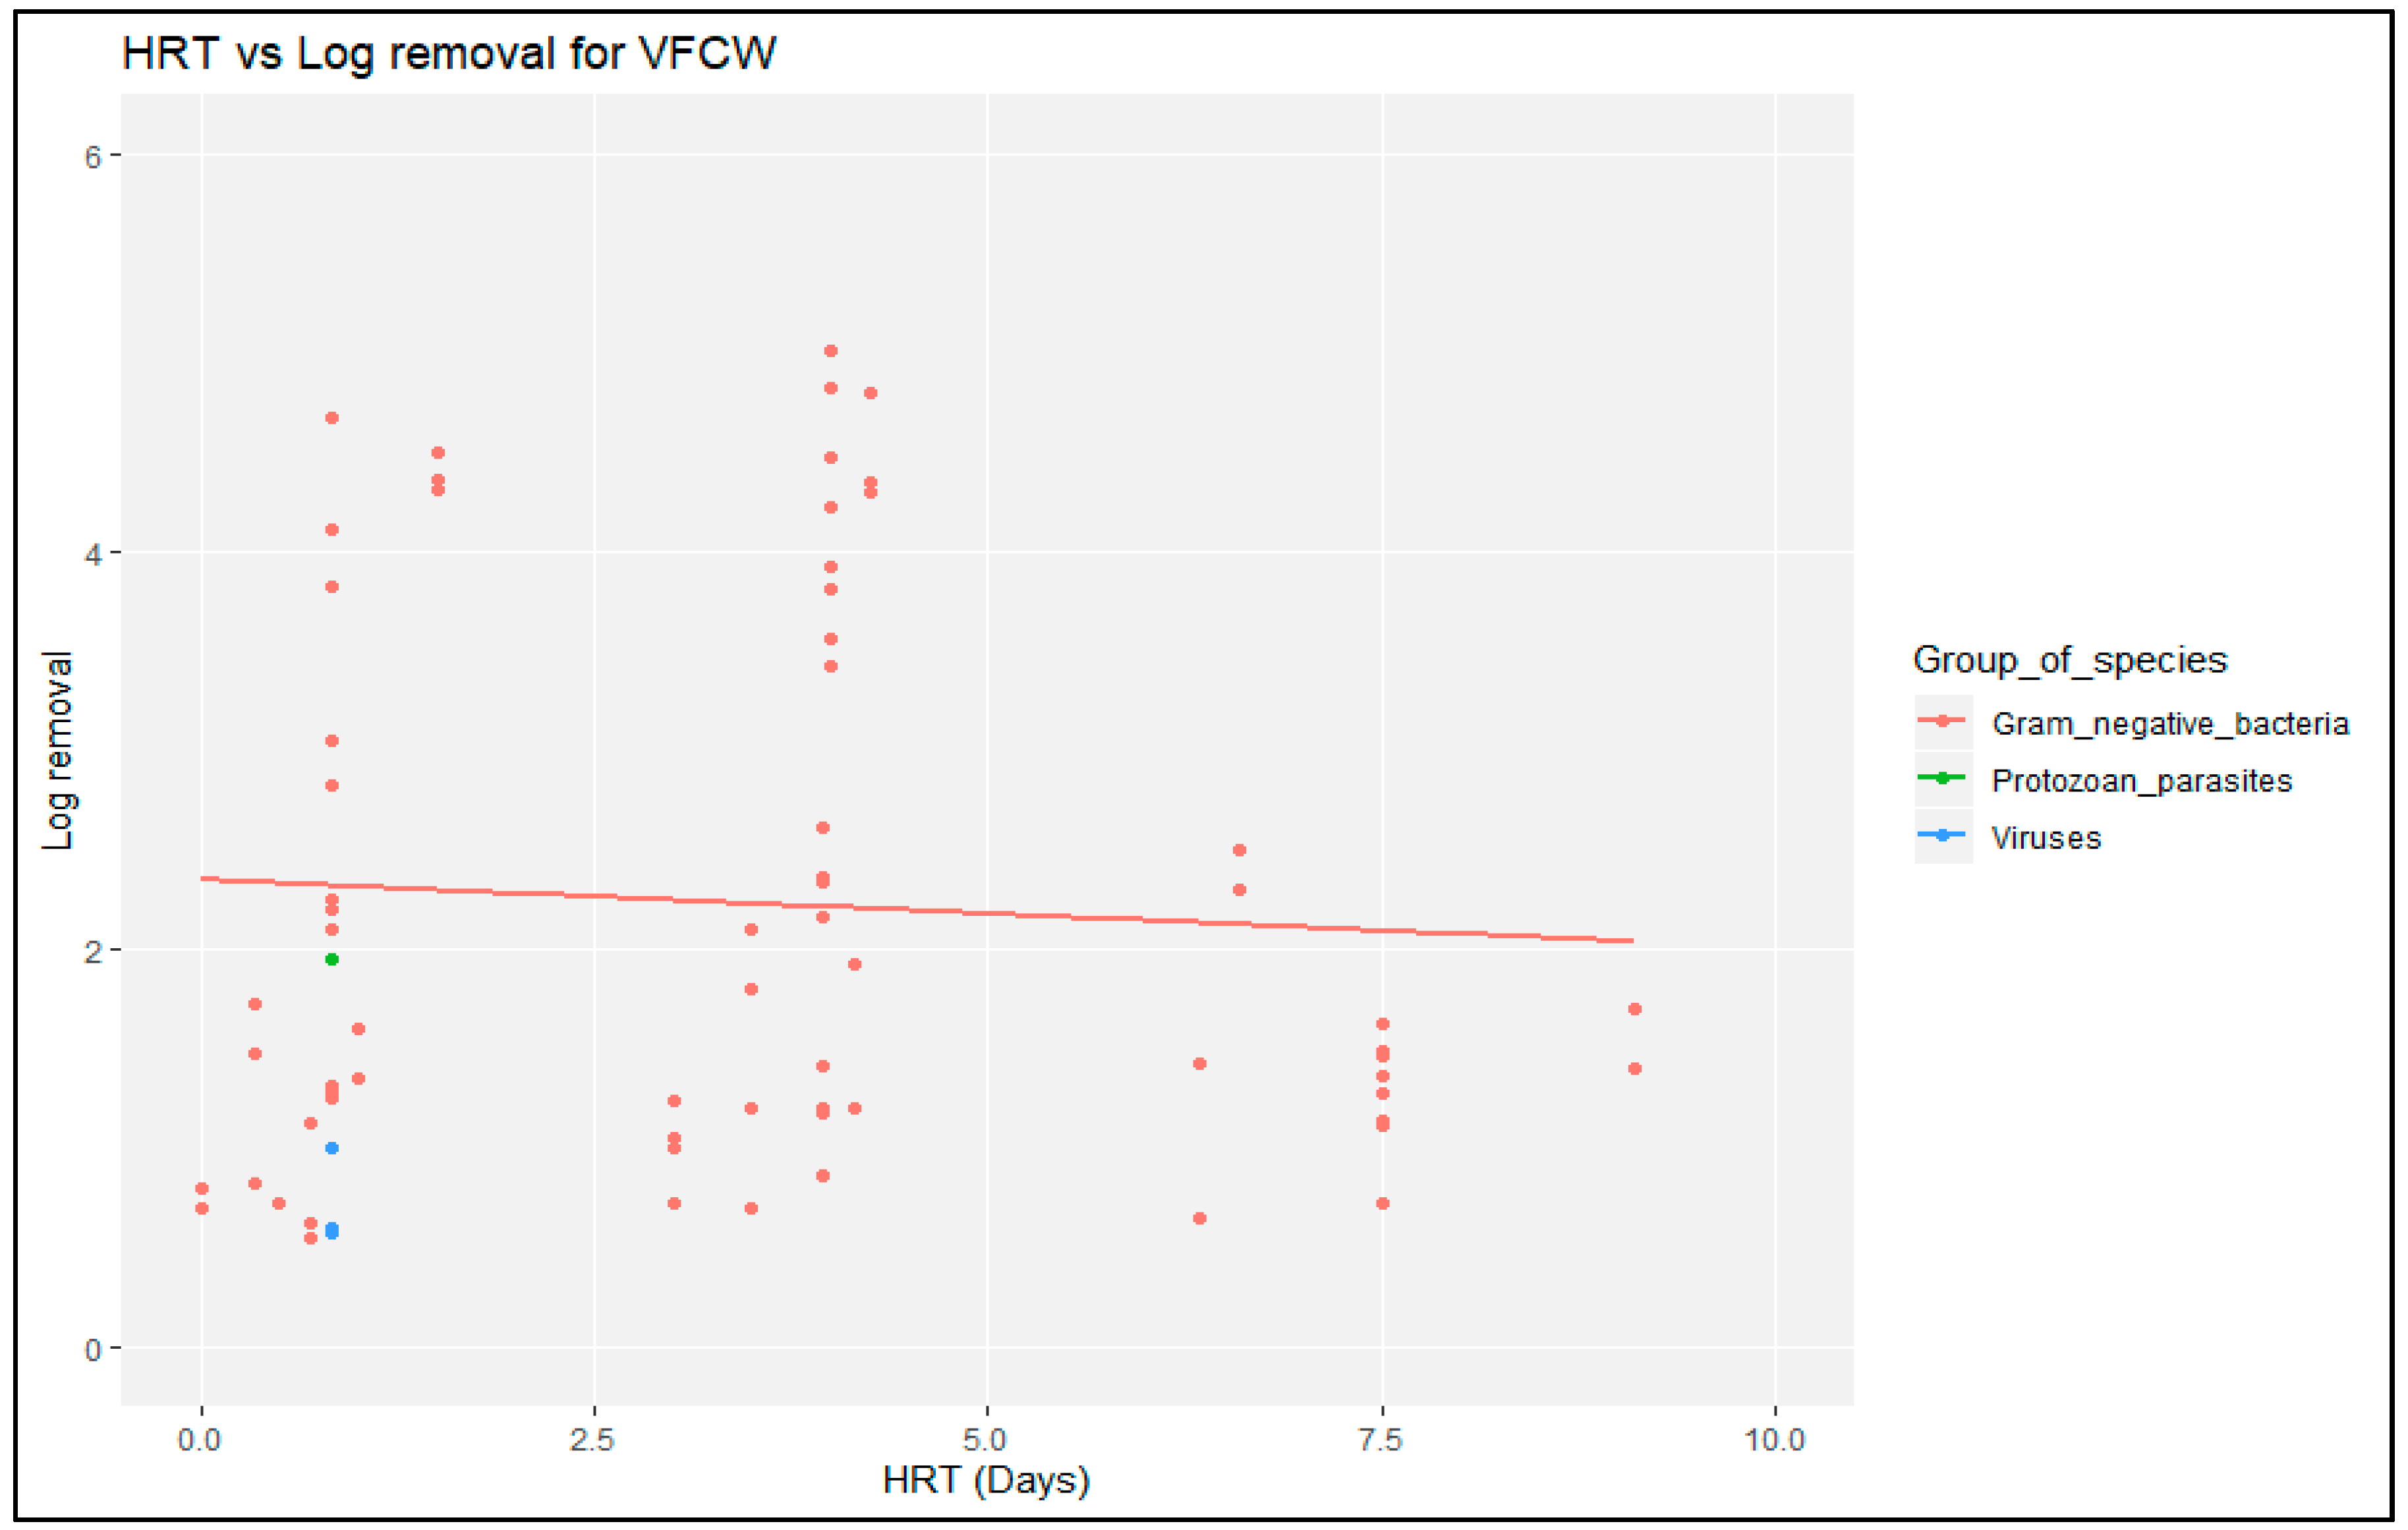
Therefore, plotting log removal values [LRV = log(Cin/Cout)] vs. HLR and HRT gives a first estimate of the significance of those parameters (a SSHFCW plot will be used as an example, whilst the rest can be found in Appendix D). Figure 7 and Figure 8 demonstrate the relationship between log removal and HLR/HRT for the three pathogen categories in a SSHFCW. The observed variation can be explained by the different applications (full-scale vs. pilot-scale)—pilot-scale applications have different dynamics (lower loading rates) and experimental conditions (dimensions, vegetation, etc.) which lead to a huge variation regarding removal—the complexity and variability in performance for the system itself, but also due to the different technical features/experimental conditions of each study (porosity, dimensions of CW, type of influent wastewater). Regardless, important information that can be extracted from these plots, namely the positive correlation between the removal of pathogens and HLR/HRT for all three pathogen categories (the positive correlation could not be observed in all types of wetlands, as can be seen in Appendix C) indicating that both hydraulic characteristics play a significant role in the removal of pathogens.
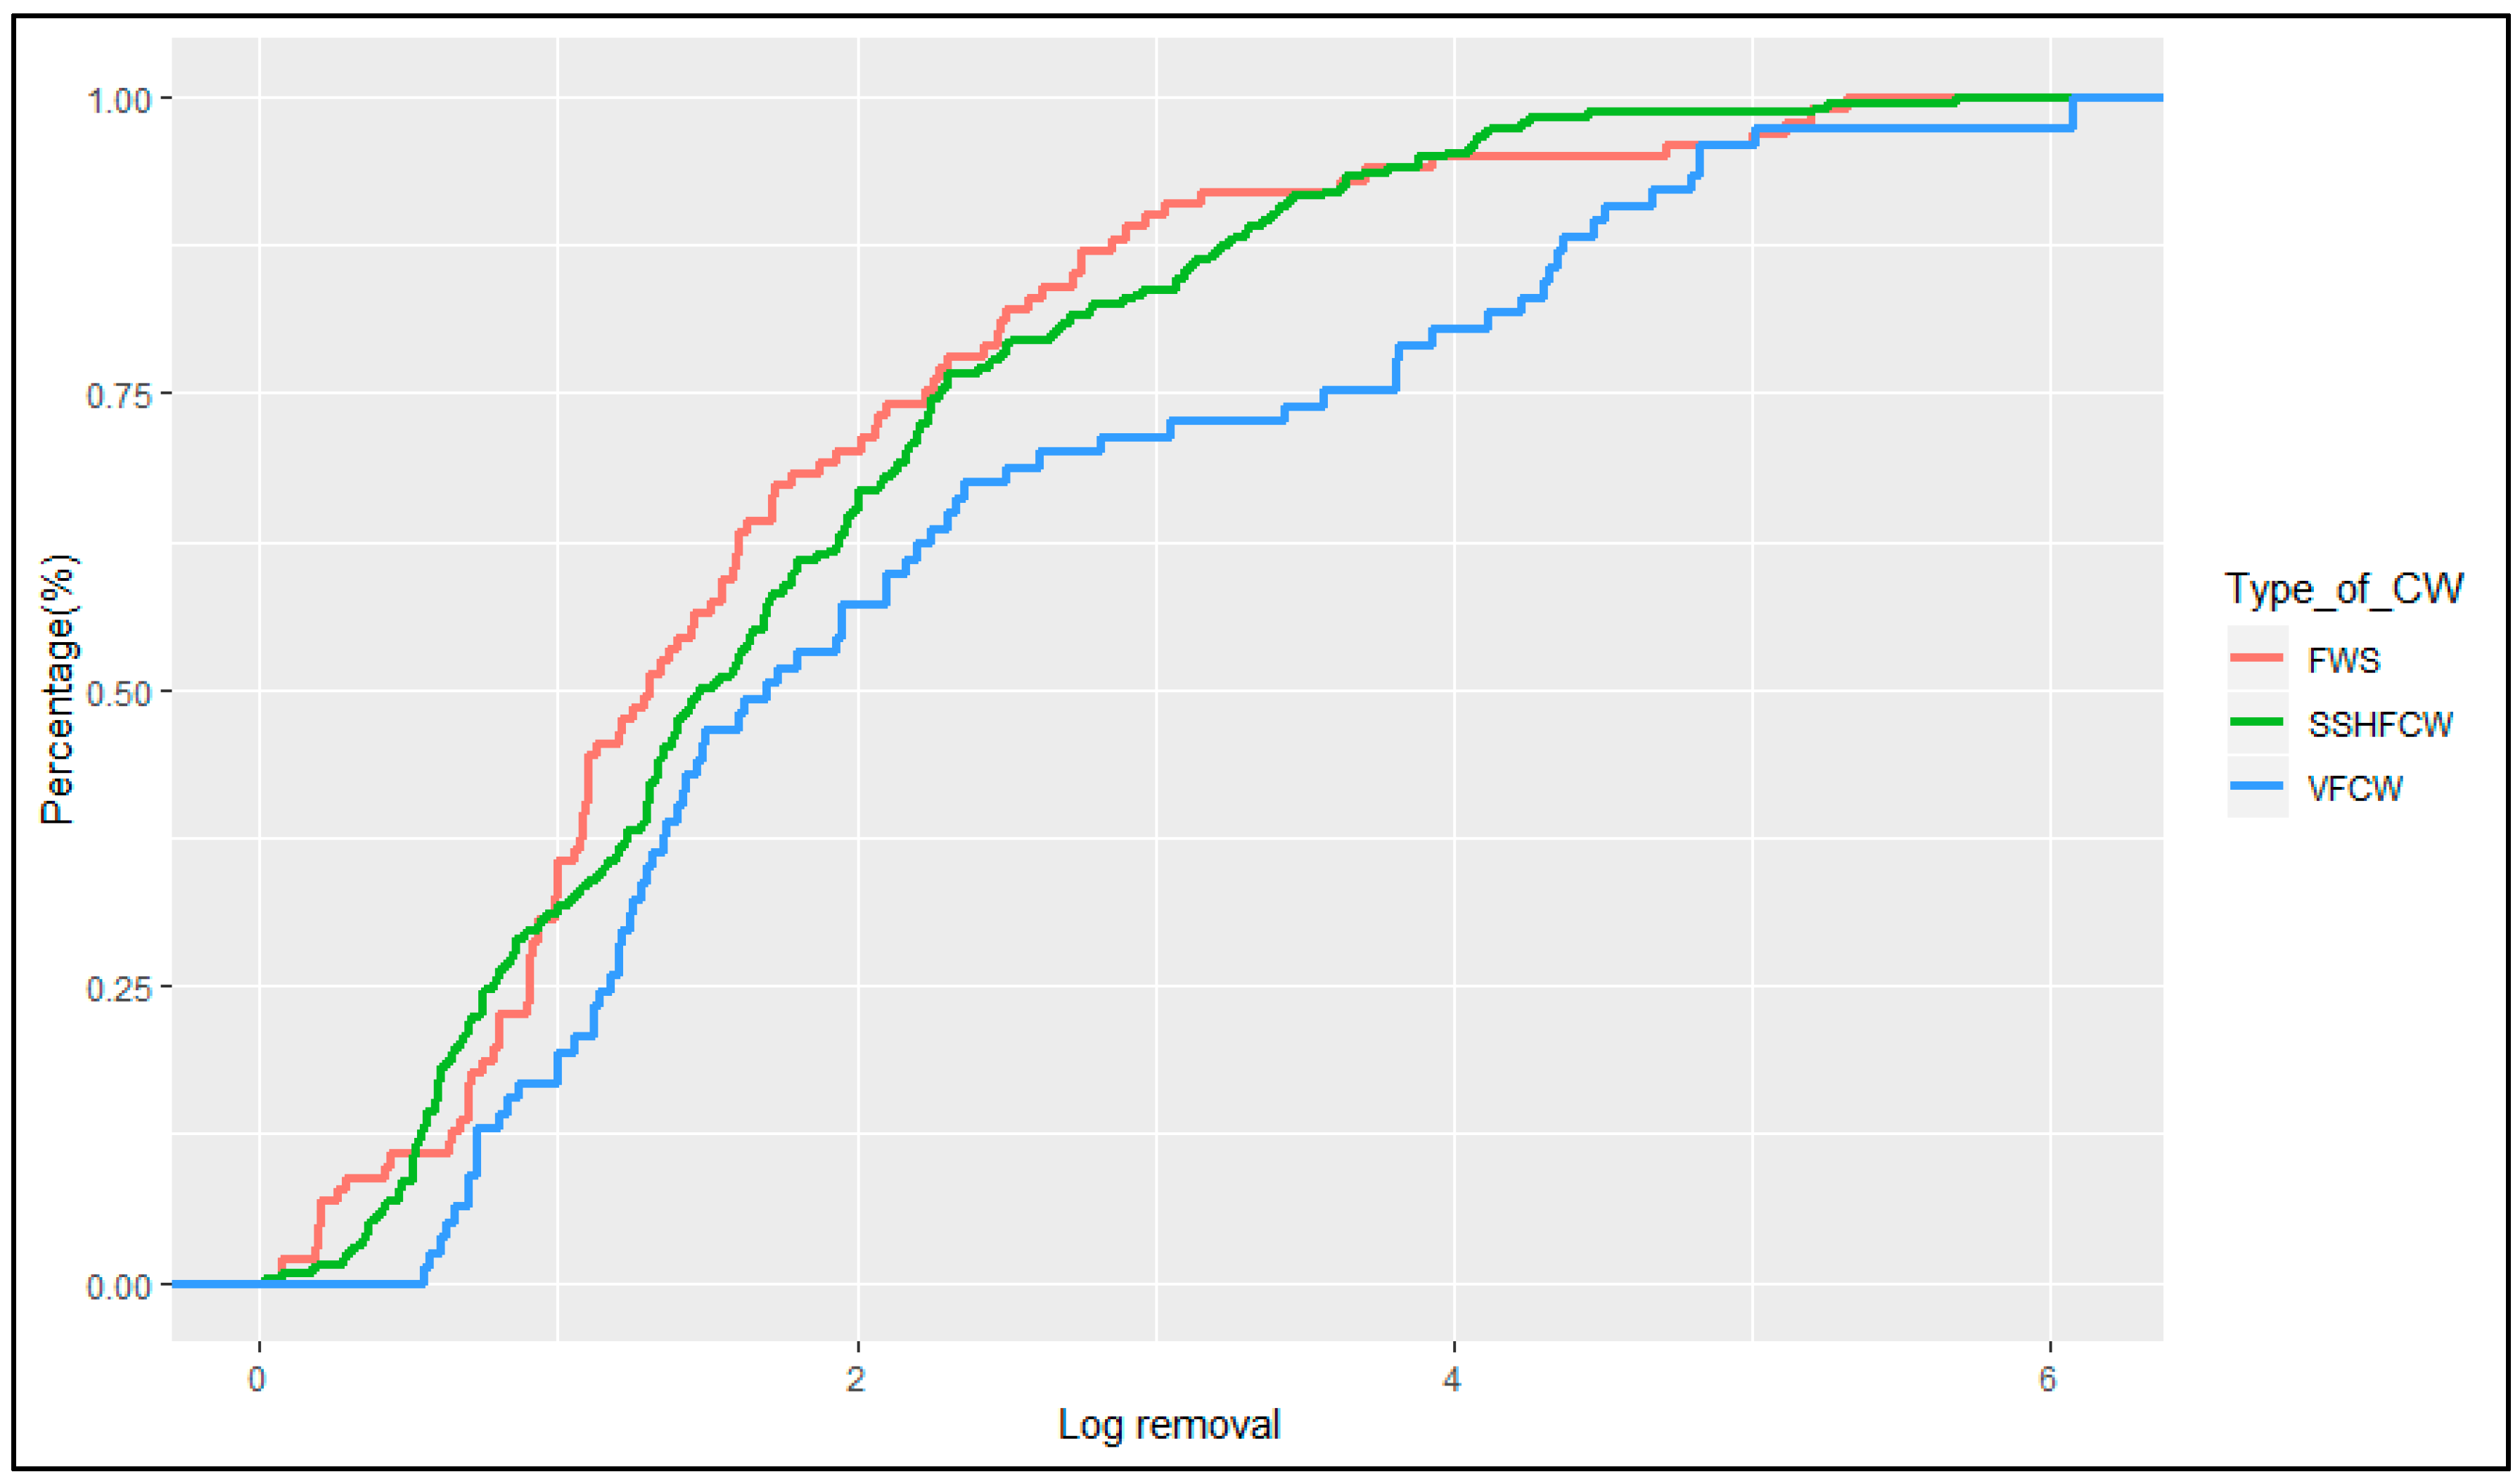
Additionally, Figure 9 demonstrates the Cumulative Distribution Function (CDF) of the different types of CWs regarding their removal. It can be observed that all three wetlands show an adequate removal since 50% of the distribution has a removal higher than 1.5 log. The FWS and SSHFCW have an identical distribution where 75% of them have log removal between 0–2 log and the rest are between 2–4 log. The VFCW shows a slightly different profile since 75% of the distribution is between 0–4 log and the rest between 4–6 log, indicating the higher capacity in removal compared to the other two systems.
3.3. Removal of Pathogen Categories
Table 3 shows that the category of GNB can be found in the majority of the papers collected (47 studies) while the protozoan parasites and viruses were found in 8 and 7 studies, respectively. This comes as no surprise since the specific category includes the most common indicators and index pathogens such as E. Coli, total coliforms, fecal coliforms, campylobacter, and salmonella. Furthermore, as expected, the same category was responsible for the minimum and maximum log removal values overall when compared with the viruses and protozoan parasites categories. Table 4 gives an overview of the three pathogen categories regarding their removal per CW type.
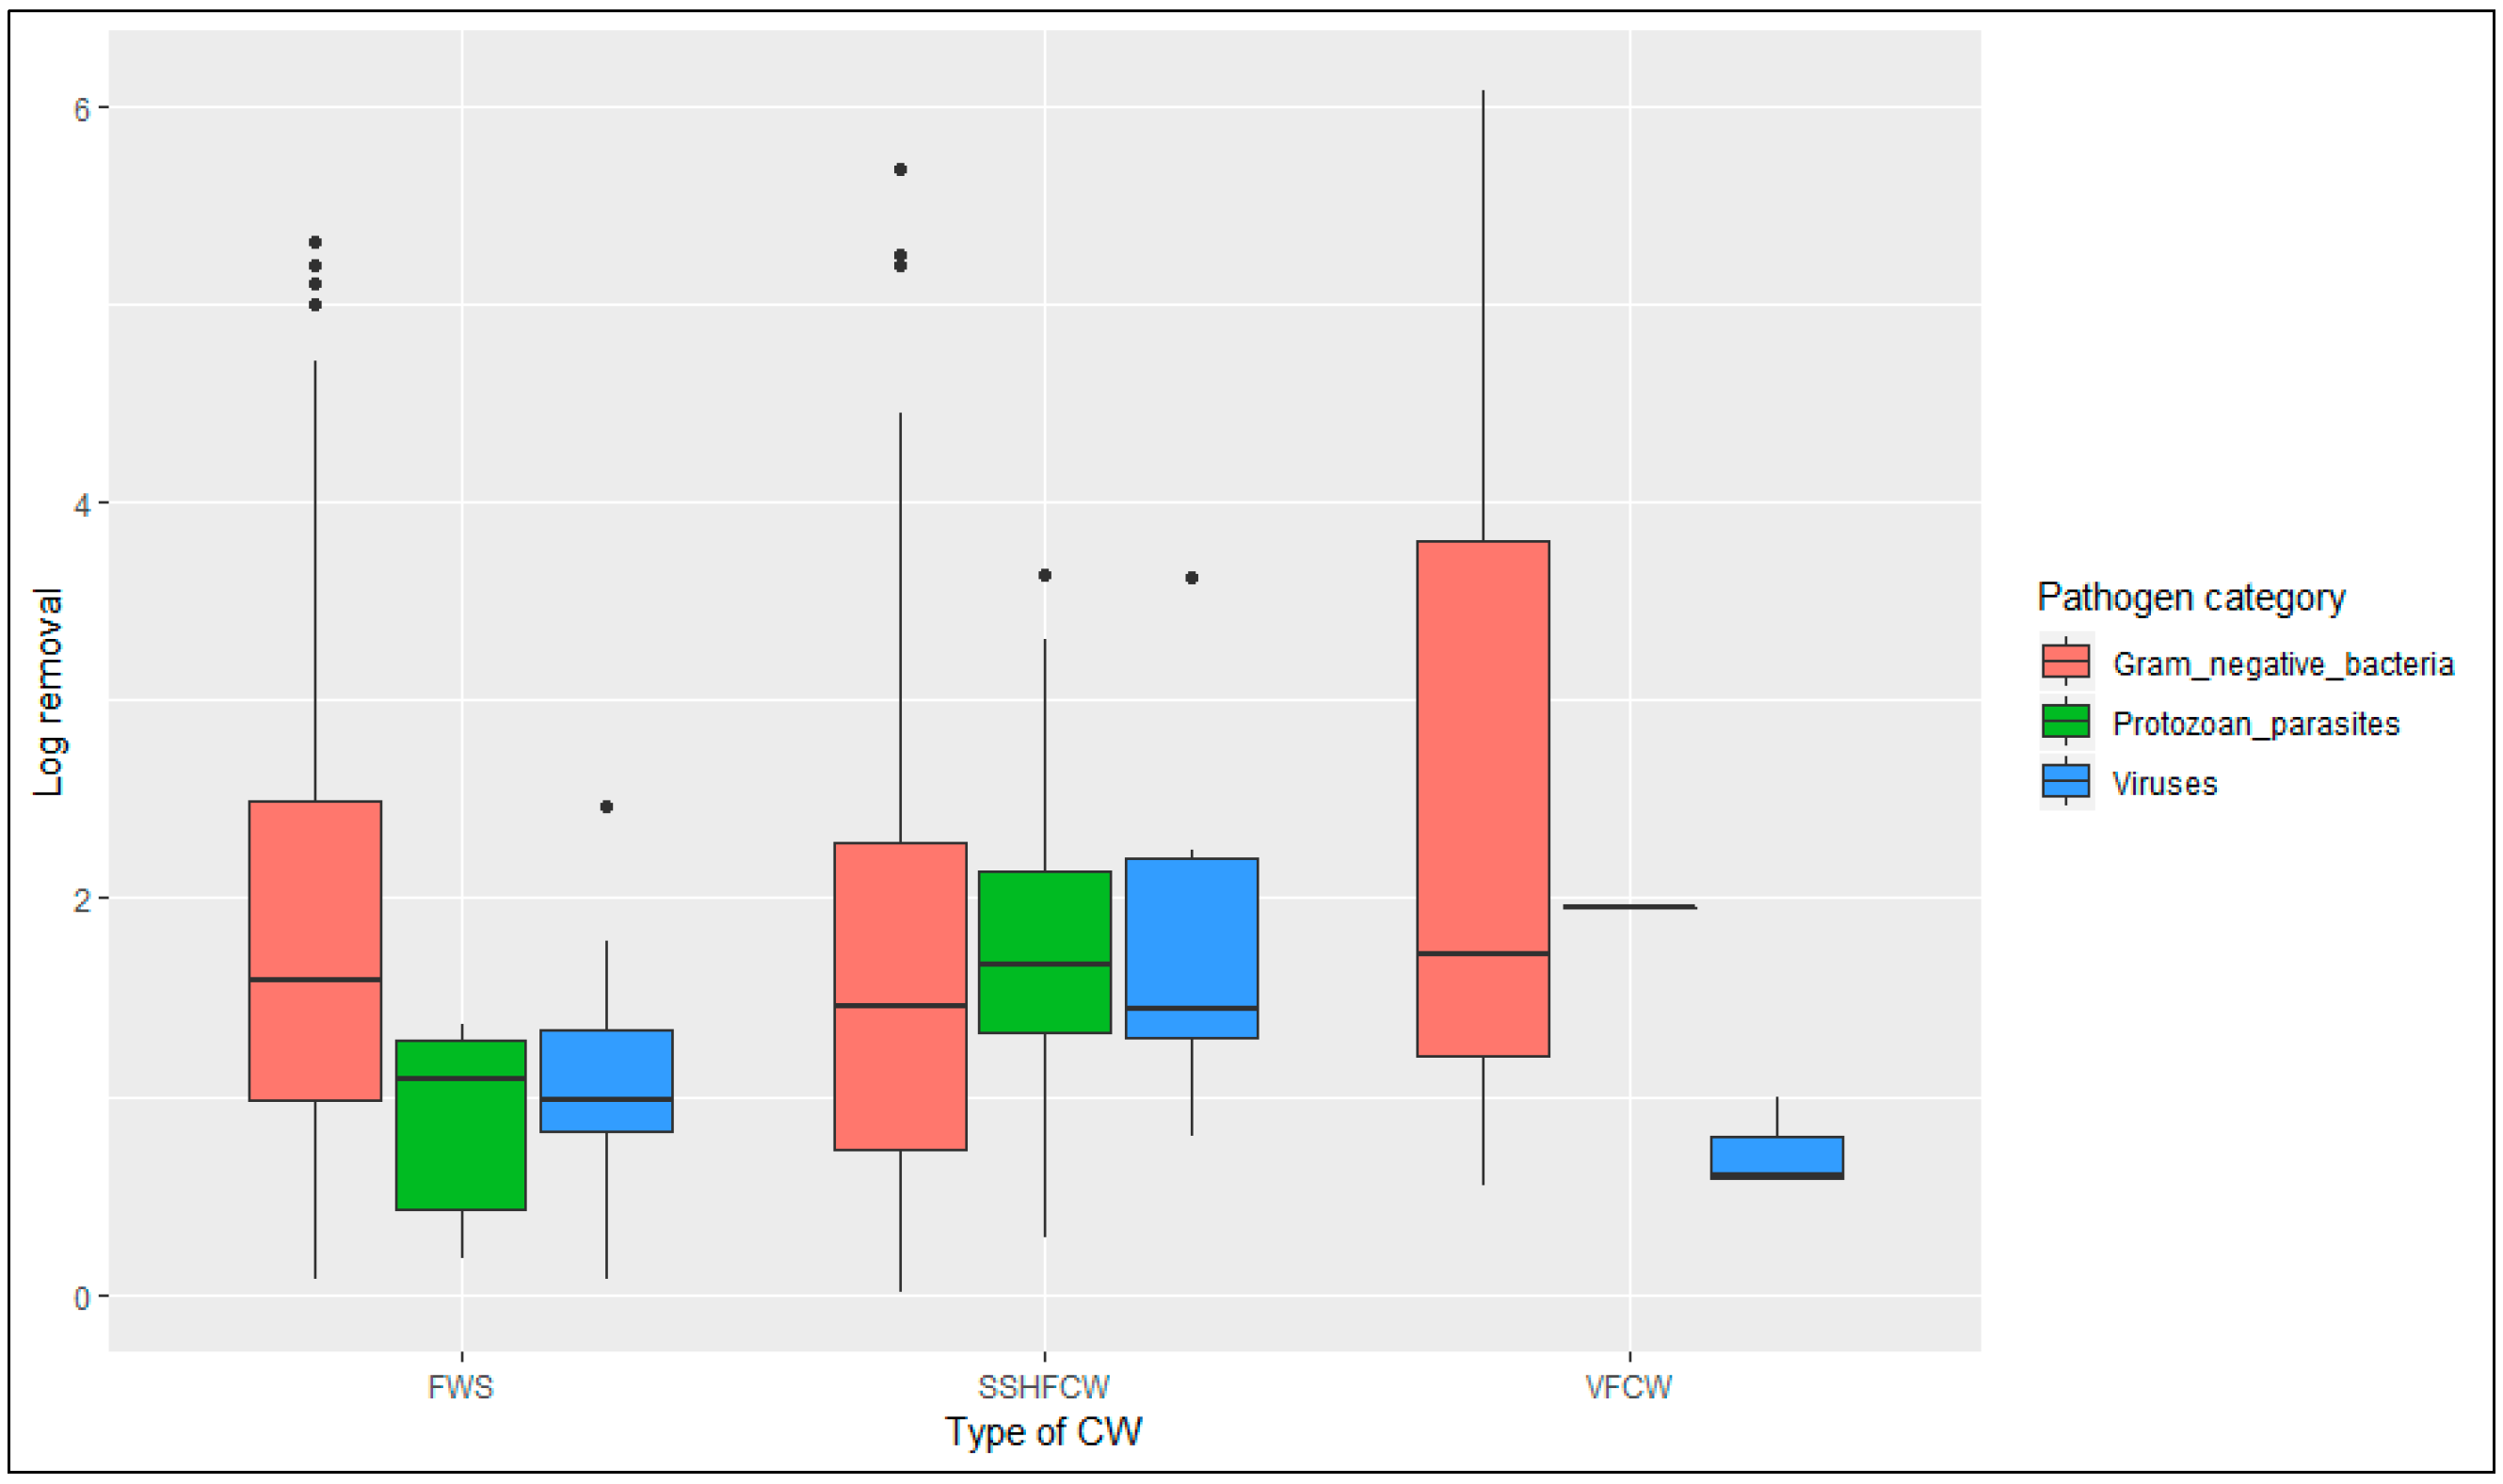
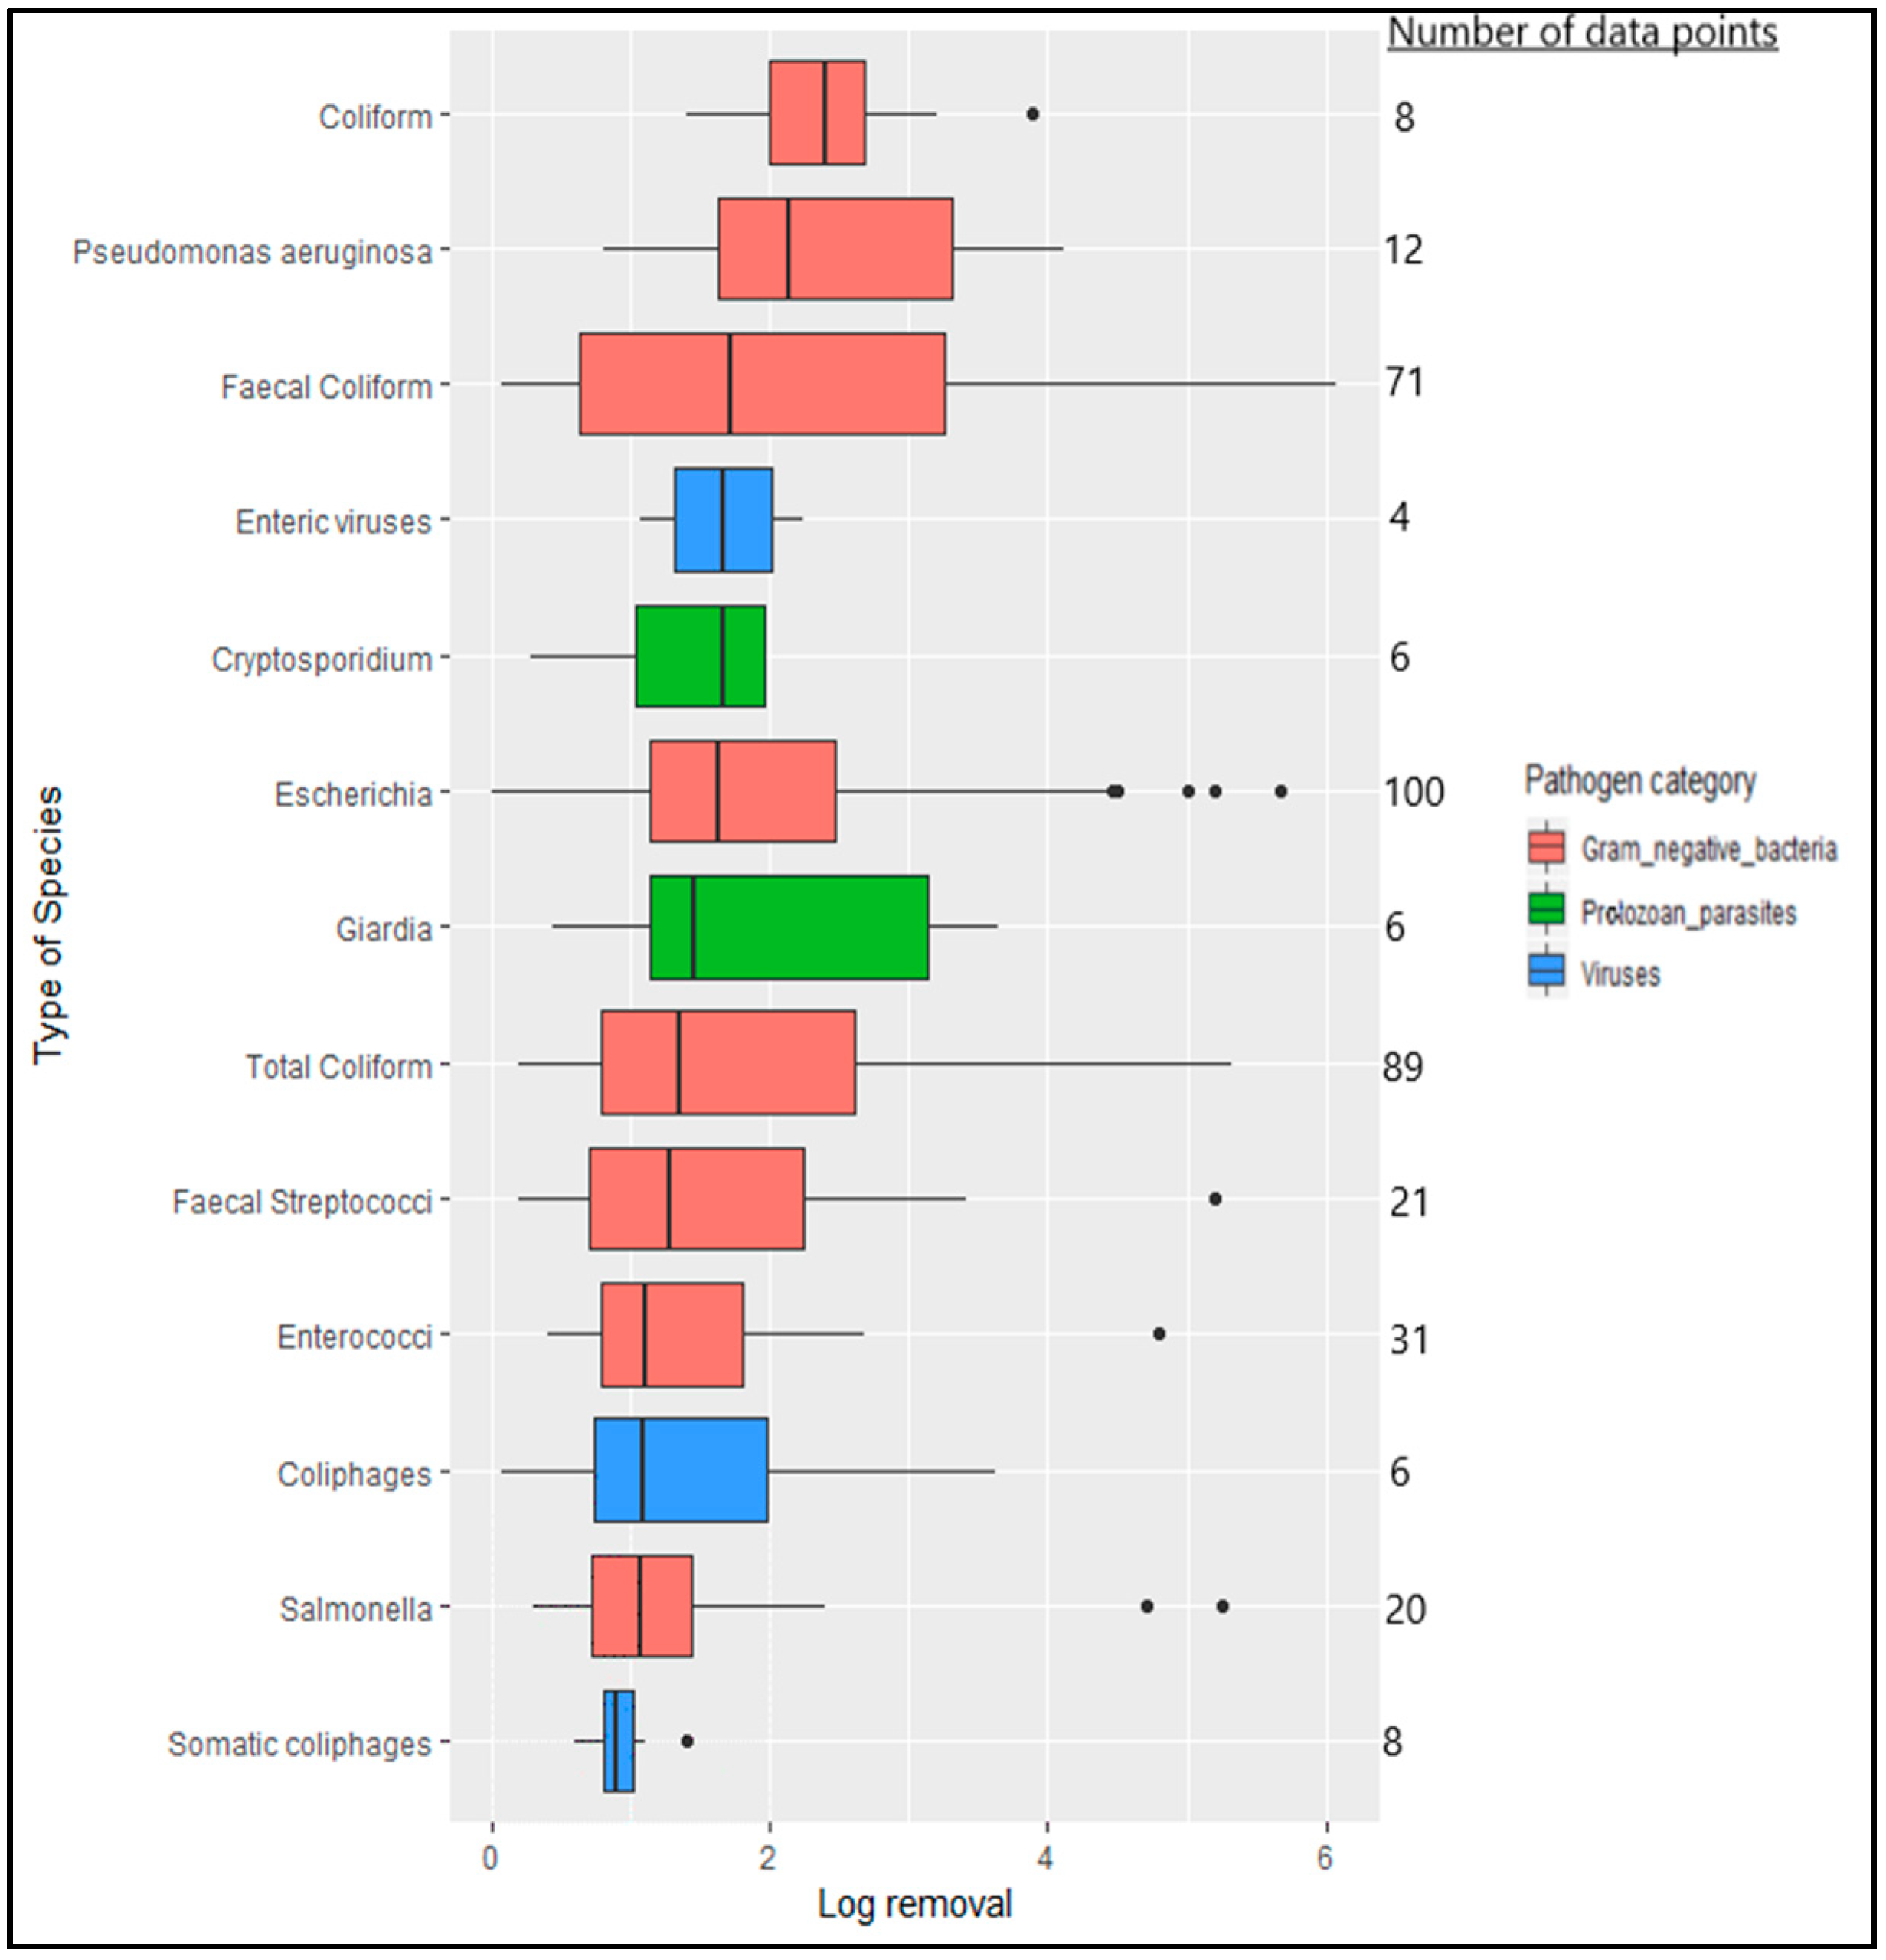
Furthermore, Table 3 depicts the overall performance of the GNB, while the other two categories can be found in Appendix D. These tables include information regarding the number of pilot and full-scale applications, as well as physicochemical characteristics, such as air and water temperature, and HRT and HLR range. In addition, there are values of COD, BOD, and TSS removal percentage that can be indicators of pollutant removal for each type of CW and pathogen category. What can be extracted from these tables is the difference and the small number of data points between types of CWs regarding their reported physicochemical characteristics, which makes it difficult to draw conclusions and compare the different types of wetlands. Only the HRT and HLR were consistently reported. Figure 10 shows that gram-negative bacteria show great variability in their removal (0.01–6.08 log) compared to viruses and protozoan parasites categories, where the ranges are between 0.02–3.62 log and 0.18–3.63 log, respectively. Again, it can be seen that the average log removal values range between 1 and 2 log for the three categories in all of the CW types except the viruses category in VFCW, where the average log removal is less than 1 log. Furthermore, Figure 11 illustrates the average log removal of the most representative indicators and index pathogens as recorded during the systematic review. The group of coliforms is that with the greatest variability. While the variability can be explained due to the different number of data points, another possible explanation is again the fact that both pilot and full-scale applications are included in the boxplots. The outliers in many of the species strengthen this assumption. Additionally, there is great variability of pathogen log removal within their categories. This is an important observation since it was expected for the different pathogen categories to formulate clusters regarding log removal.
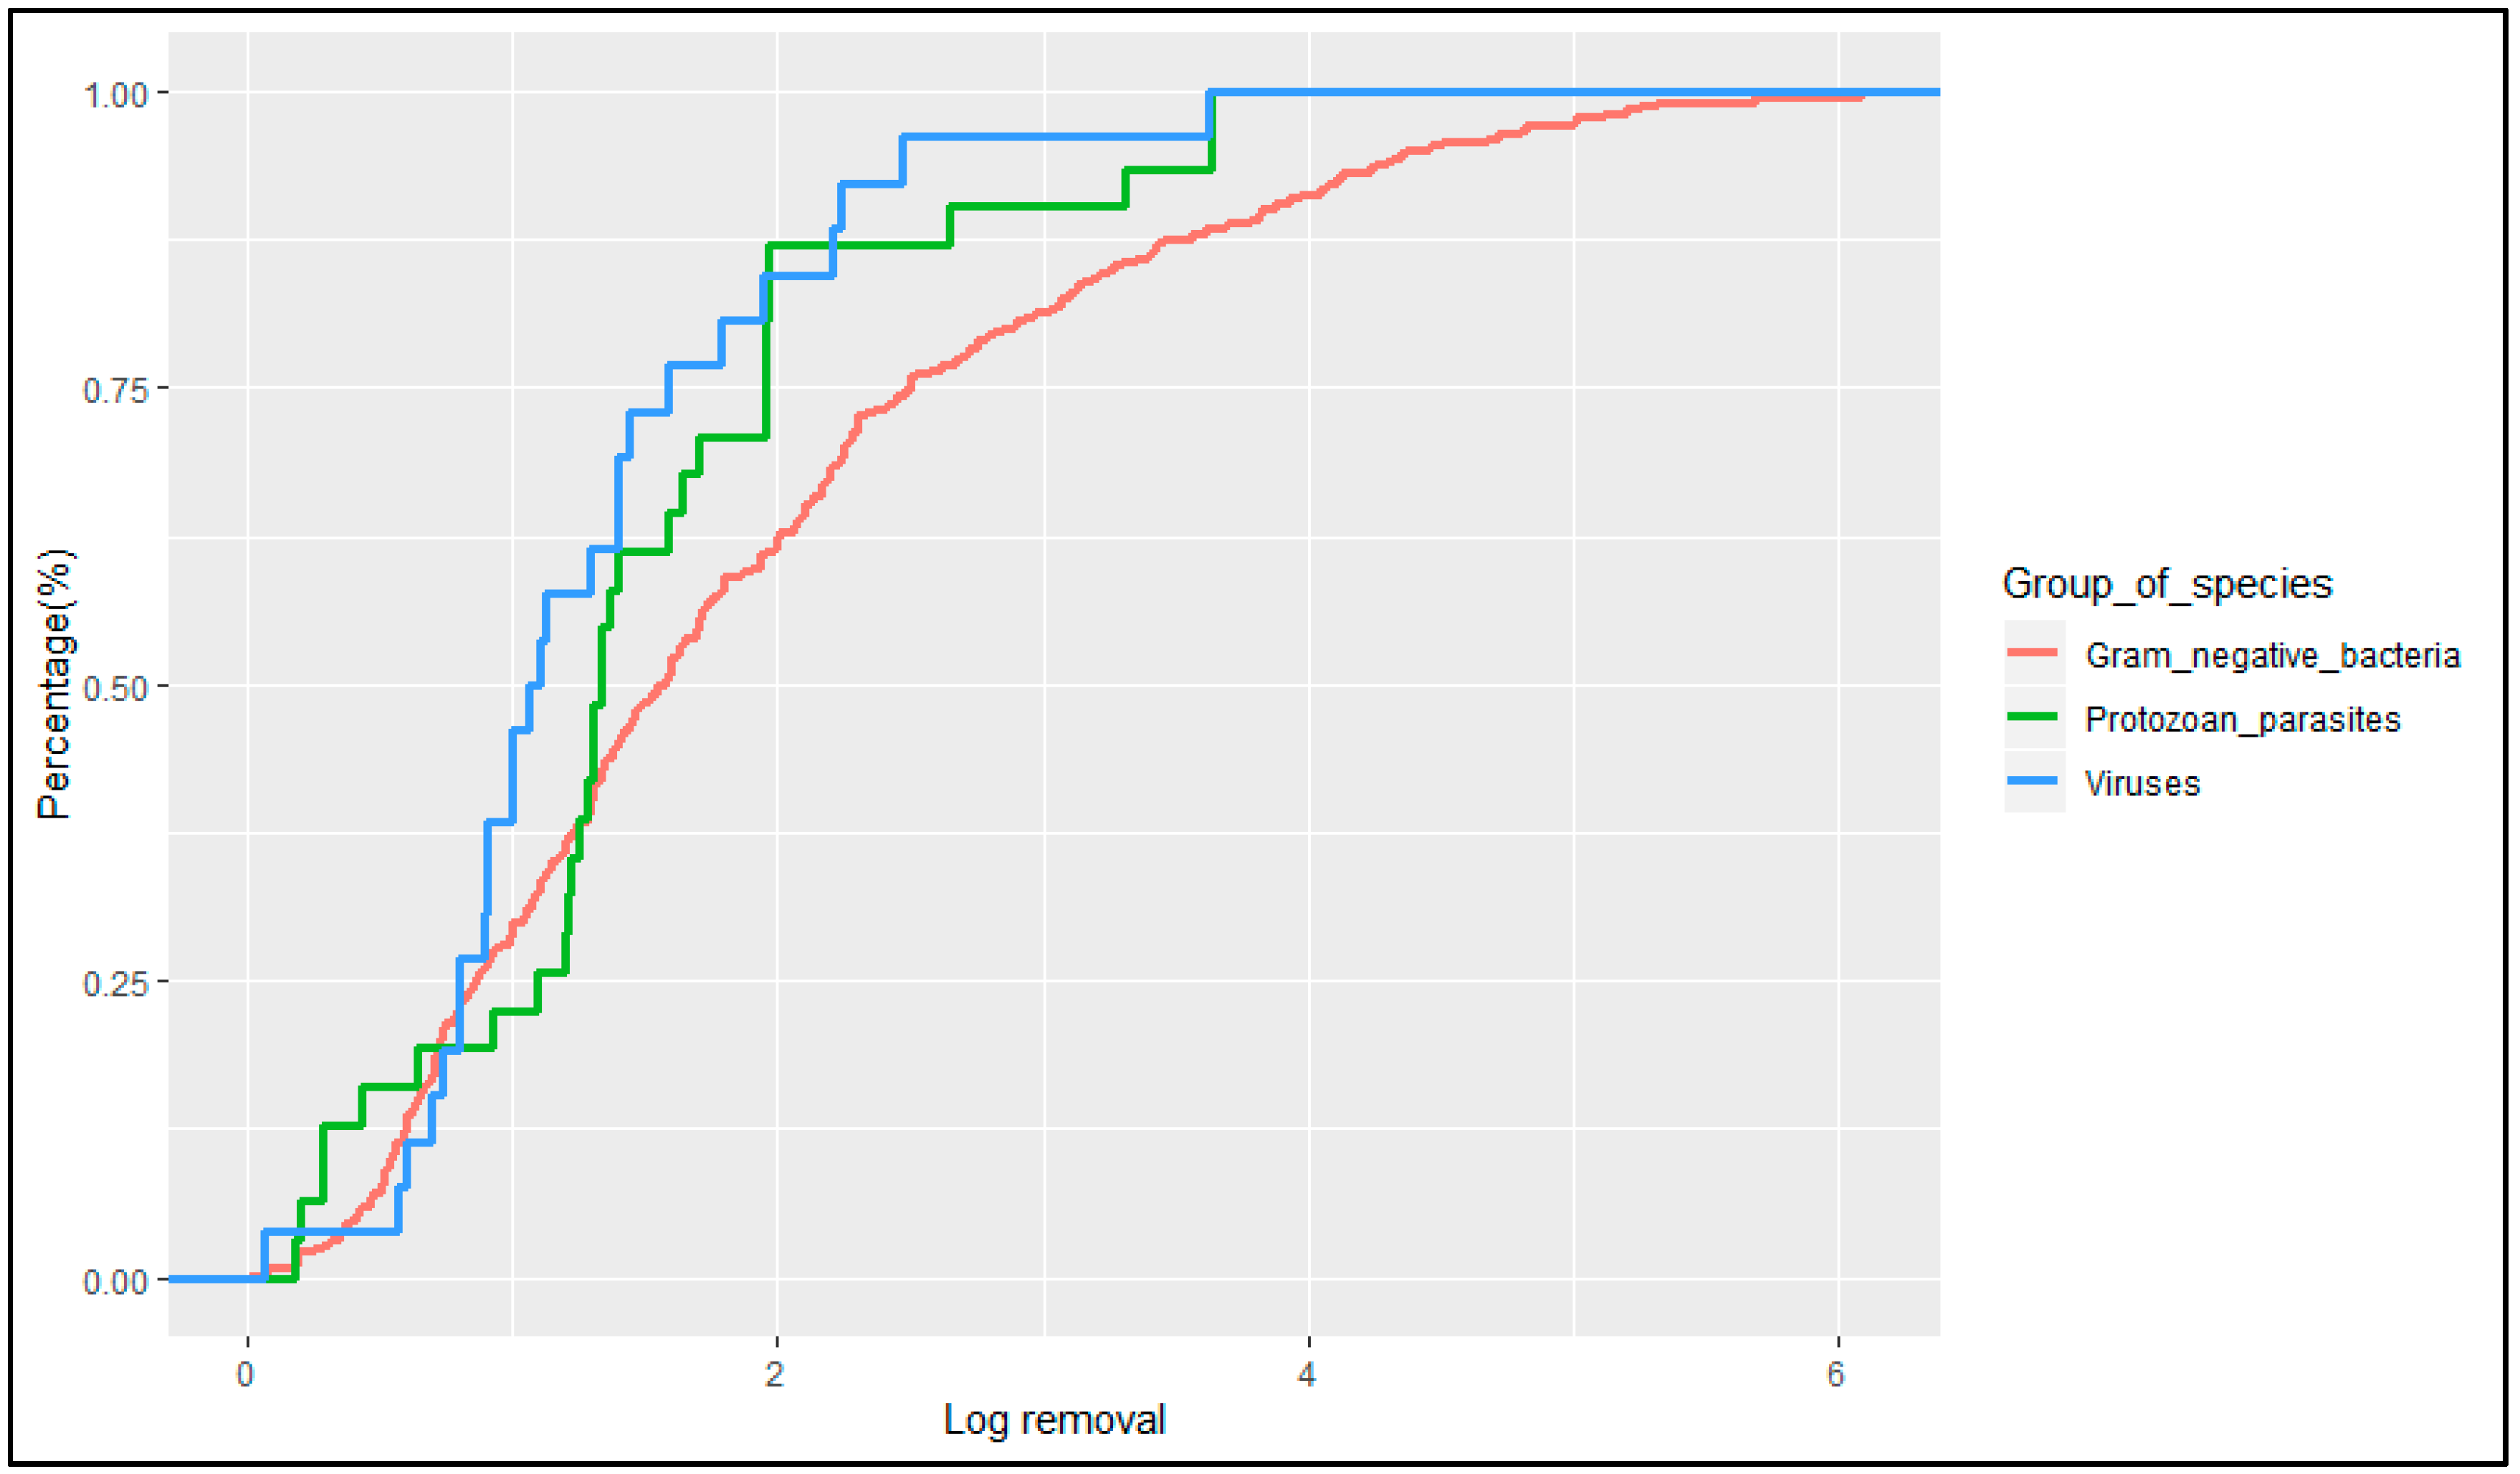
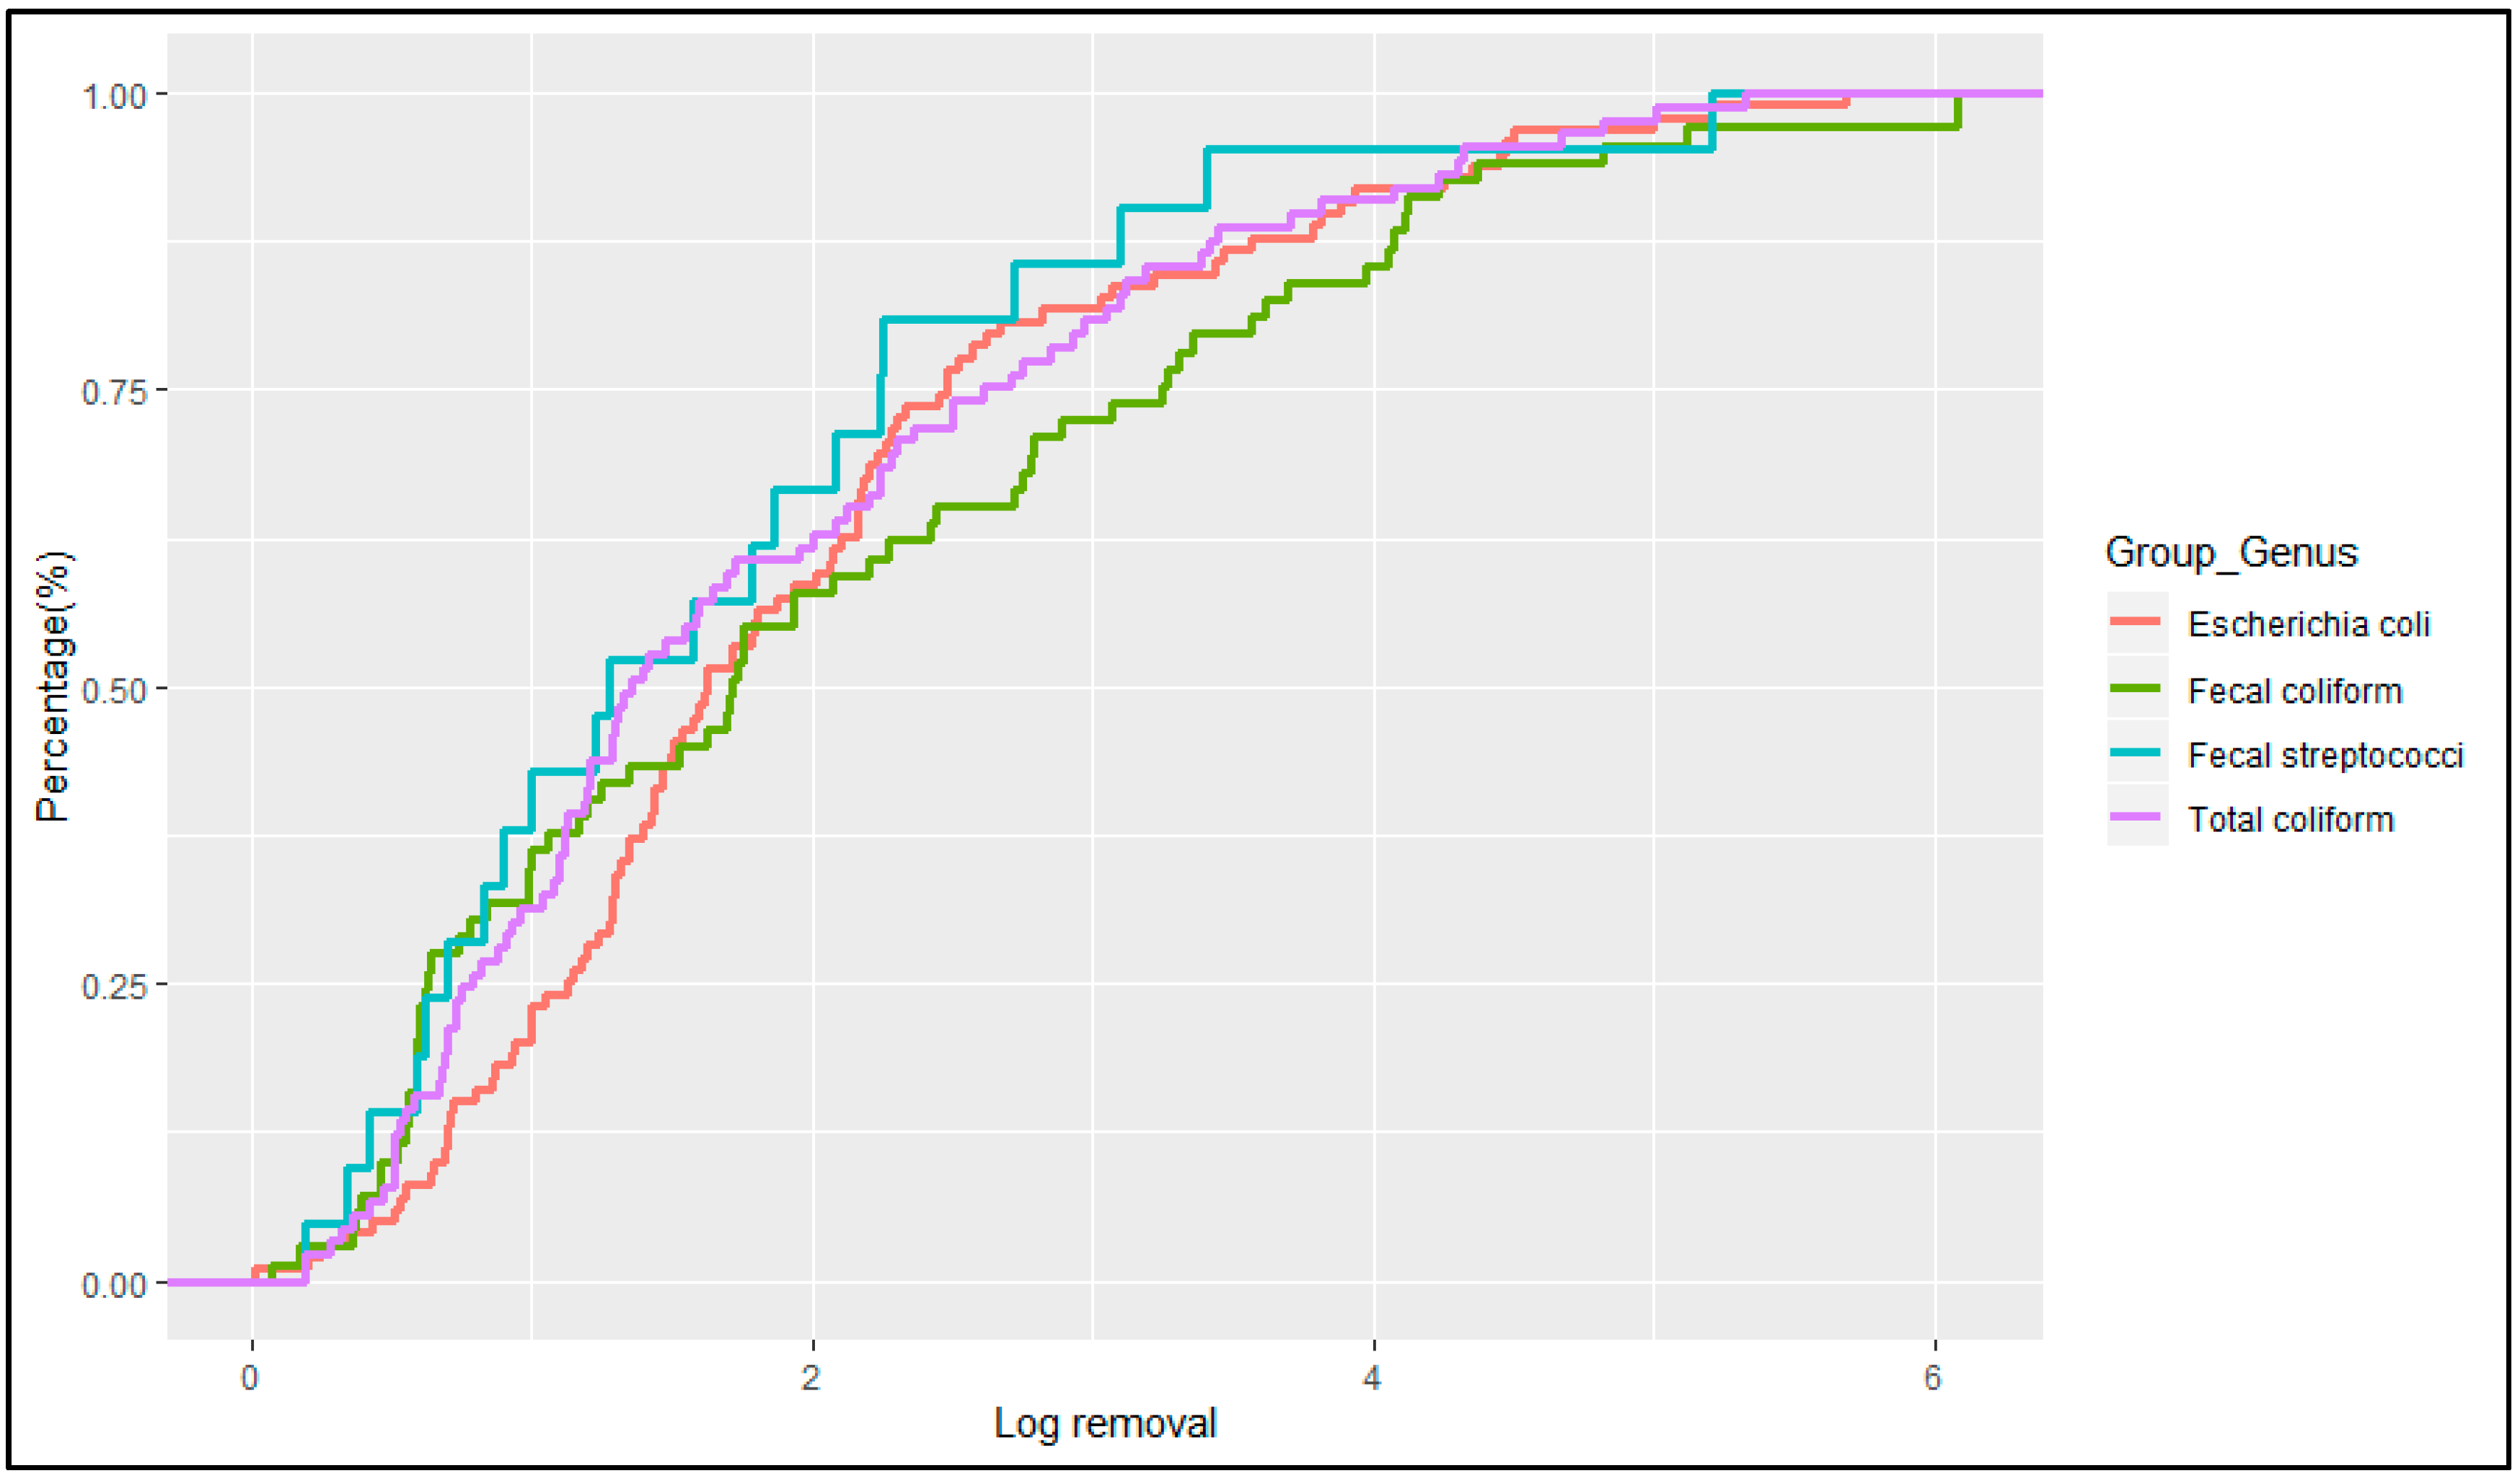
Finally, the CDF (Figure 12) of the different pathogen categories regarding their removal indicates that 75 % of both the protozoan parasites and viruses categories have a removal lower or equal to 2 log, while their peak lies just before 4 log. The sharp increase in log removal (straight lines) between 2 log onwards can be attributed to the low density of data points in these categories. In contrast, the gram-negative bacteria category exhibits a smooth curve along the distribution where 60% of the observed data points have a removal lower or equal to 2 log, while the remaining 40% lies between 2 and 6 log. Regarding the most representative indicators, Figure 13 shows that all four indicators follow a rather smooth curve along the distribution and have an adequate removal since 50% of all indicators show a removal higher than 1.5 log.
4. Discussion
This study brings all current quantitative data together in a dataset, giving any end-user access to the overall performance of CW types and their respective pathogen removal efficiency. More importantly, the systematic review included case studies from all over the world; therefore, the collected information can be considered representative. Pilot-scale applications have been reported most often, mainly because the majority of them were experimental case studies with the objective of investigating the removal efficiencies of pollutants and pathogens. Full-scale applications, although used in many cases, are not reported in scientific papers to the same extent. Furthermore, the initial attempt to try to identify trends and possible correlations between log removal and temperature/climatic zones was unsuccessful, since no robust conclusions could be drawn from the graph.
The average pathogen removal of all three types of CWs was between 1 and 2 log, indicating that CWs cannot be a reliable option for pathogen removal as a standalone wastewater treatment method, although some case studies showed potential for further research since they achieved a removal as high as 6 log. However, they can be a credible choice as a wastewater polishing step when they are combined with conventional wastewater treatment systems. Regarding the removal of the three pathogen categories, Table 4 shows that the gram-negative bacteria category has the highest log removal in all types of CW. On the other hand, the same group shows great variability which makes it difficult to draw tangible conclusions about the ease of removal of this category. This can best be seen in Figure 13, where the variability of all categories is shown using boxplots. Protozoan parasites show less variability in FWS, whereas the viruses’ category is the one with the smallest range in SSHFCW. Conclusions could not be drawn for the last two categories in VFCW types, since their number of data points was small. In addition, the huge difference in variability between the three categories can be attributed to the huge database of the gram-negative bacteria category since -to some extent- it was expected to see scattered removal values. On the other hand, although the other categories show less variability and it is easier to draw conclusions about their removal, their databases are quite small, which should make any decision-maker skeptical about the reliability of the results. The CDFs of different types of CWs and different pathogen categories simply provided an initial mapping of the situation (in terms of performance and removal capacity) according to the literature review and can be used as a reference point.
Regarding limitations, one of the major difficulties encountered in this literature review was the lack of important and relevant data from the studies that were included in the dataset. Therefore, a need for more descriptive information from papers is considered imperative, especially for studies that are directly related to constructed wetlands and pathogen removal. Additionally, a lot of studies did not provide extractable information, which meant that a lot of assumptions had to be made (e.g., the default value of porosity, the calculation of missing parameters using default values). Therefore, it is recommended that the scientific community should focus on adequate reporting of extractable data and information to better facilitate future research.
Finally, a relationship was identified by plotting the influent versus effluent concentration as well as the log removal versus HLR/HRT between different types of CWs. Various patterns were observed which give room for further investigation in these parameters. Therefore, a potential meta-analysis of this database using statistical analysis can provide additional and insightful information on the significance of Cin, HLR, and HRT on pathogen removal. If enough data can be provided for all types of CWs and pathogen categories, then a model that can predict the removal of pathogens under the influence of specific parameters can be created. This can potentially help the scientific community gain a better insight into the removal capacity of these systems.
5. Conclusions
The purpose of this literature review was to shed more light on the performance of CWs regarding pathogen removal. That was achieved, as the outcome of the review includes a comprehensive database that covers a wide range of information about constructed wetlands and log removal values from specific pathogen categories. Special attention must be paid to better reporting of extractable information to be able to draw tangible conclusions regarding different pathogen categories and their respective removal from CWs and improve the current dataset. Moreover, the plotting of different parameters indicated potential relationships that can lead to the creation of a predictive model if a meta-analysis of this dataset is performed. Overall, the outcome does provide an efficient approach to the scientific community by taking a step towards a better understanding of these ‘’black boxes’’ and pointing out where future research needs to focus to fine-tune and quantify the factors that influence the performance of constructed wetlands.
Conflicts of Interest
“The authors declare no conflict of interest”.
Abbreviations
The following abbreviations are used in this manuscript:
| BOD | Biological Oxygen Demand |
| C in | Concentration influent |
| C out | Concentration effluent |
| CDF | Cumulative Distribution Function |
| CFU | Colony-Forming Unit |
| COD | Chemical Oxygen Demand |
| CW | Constructed Wetland |
| FWS | Free Water Surface |
| GNB | Gram-negative bacteria |
| HLR | Hydraulic Loading Rate |
| HRT | Hydraulic Retention Time |
| LRV | Log Removal Value |
| MPN | Most Probable Number |
| n | Porosity |
| SSHFCW | Subsurface Horizontal Flow Constructed Wetland |
| T | Temperature |
| TSS | Total Suspended Solids |
| VFCW | Vertical Flow Constructed Wetland |
| WW | Wastewater |
| WWTP | Wastewater Treatment Plant |
Appendix A
Figure A1.
Total number of papers and the combinations of keywords that were used in the Scopus and PubMed databases.
Figure A1.
Total number of papers and the combinations of keywords that were used in the Scopus and PubMed databases.

Appendix B
Figure A2.
A sample of the complete dataset after the systematic literature review was completed.

Appendix C
Figure A3.
The relationship between influent and effluent concentration in Subsurface Horizontal Flow Constructed Wetland (SSHFCW).
Figure A3.
The relationship between influent and effluent concentration in Subsurface Horizontal Flow Constructed Wetland (SSHFCW).

Figure A4.
Relationship between influent and effluent concentration in Vertical Flow Constructed Wetland (VFCW).
Figure A4.
Relationship between influent and effluent concentration in Vertical Flow Constructed Wetland (VFCW).

Appendix D
Figure A5.
Positive and negative correlations between log removal and Hydraulic Loading Rate (HLR) for different pathogen categories.
Figure A5.
Positive and negative correlations between log removal and Hydraulic Loading Rate (HLR) for different pathogen categories.

Figure A6.
Positive and negative correlations between log removal and Hydraulic Retention Time (HRT) for different pathogen categories.
Figure A6.
Positive and negative correlations between log removal and Hydraulic Retention Time (HRT) for different pathogen categories.

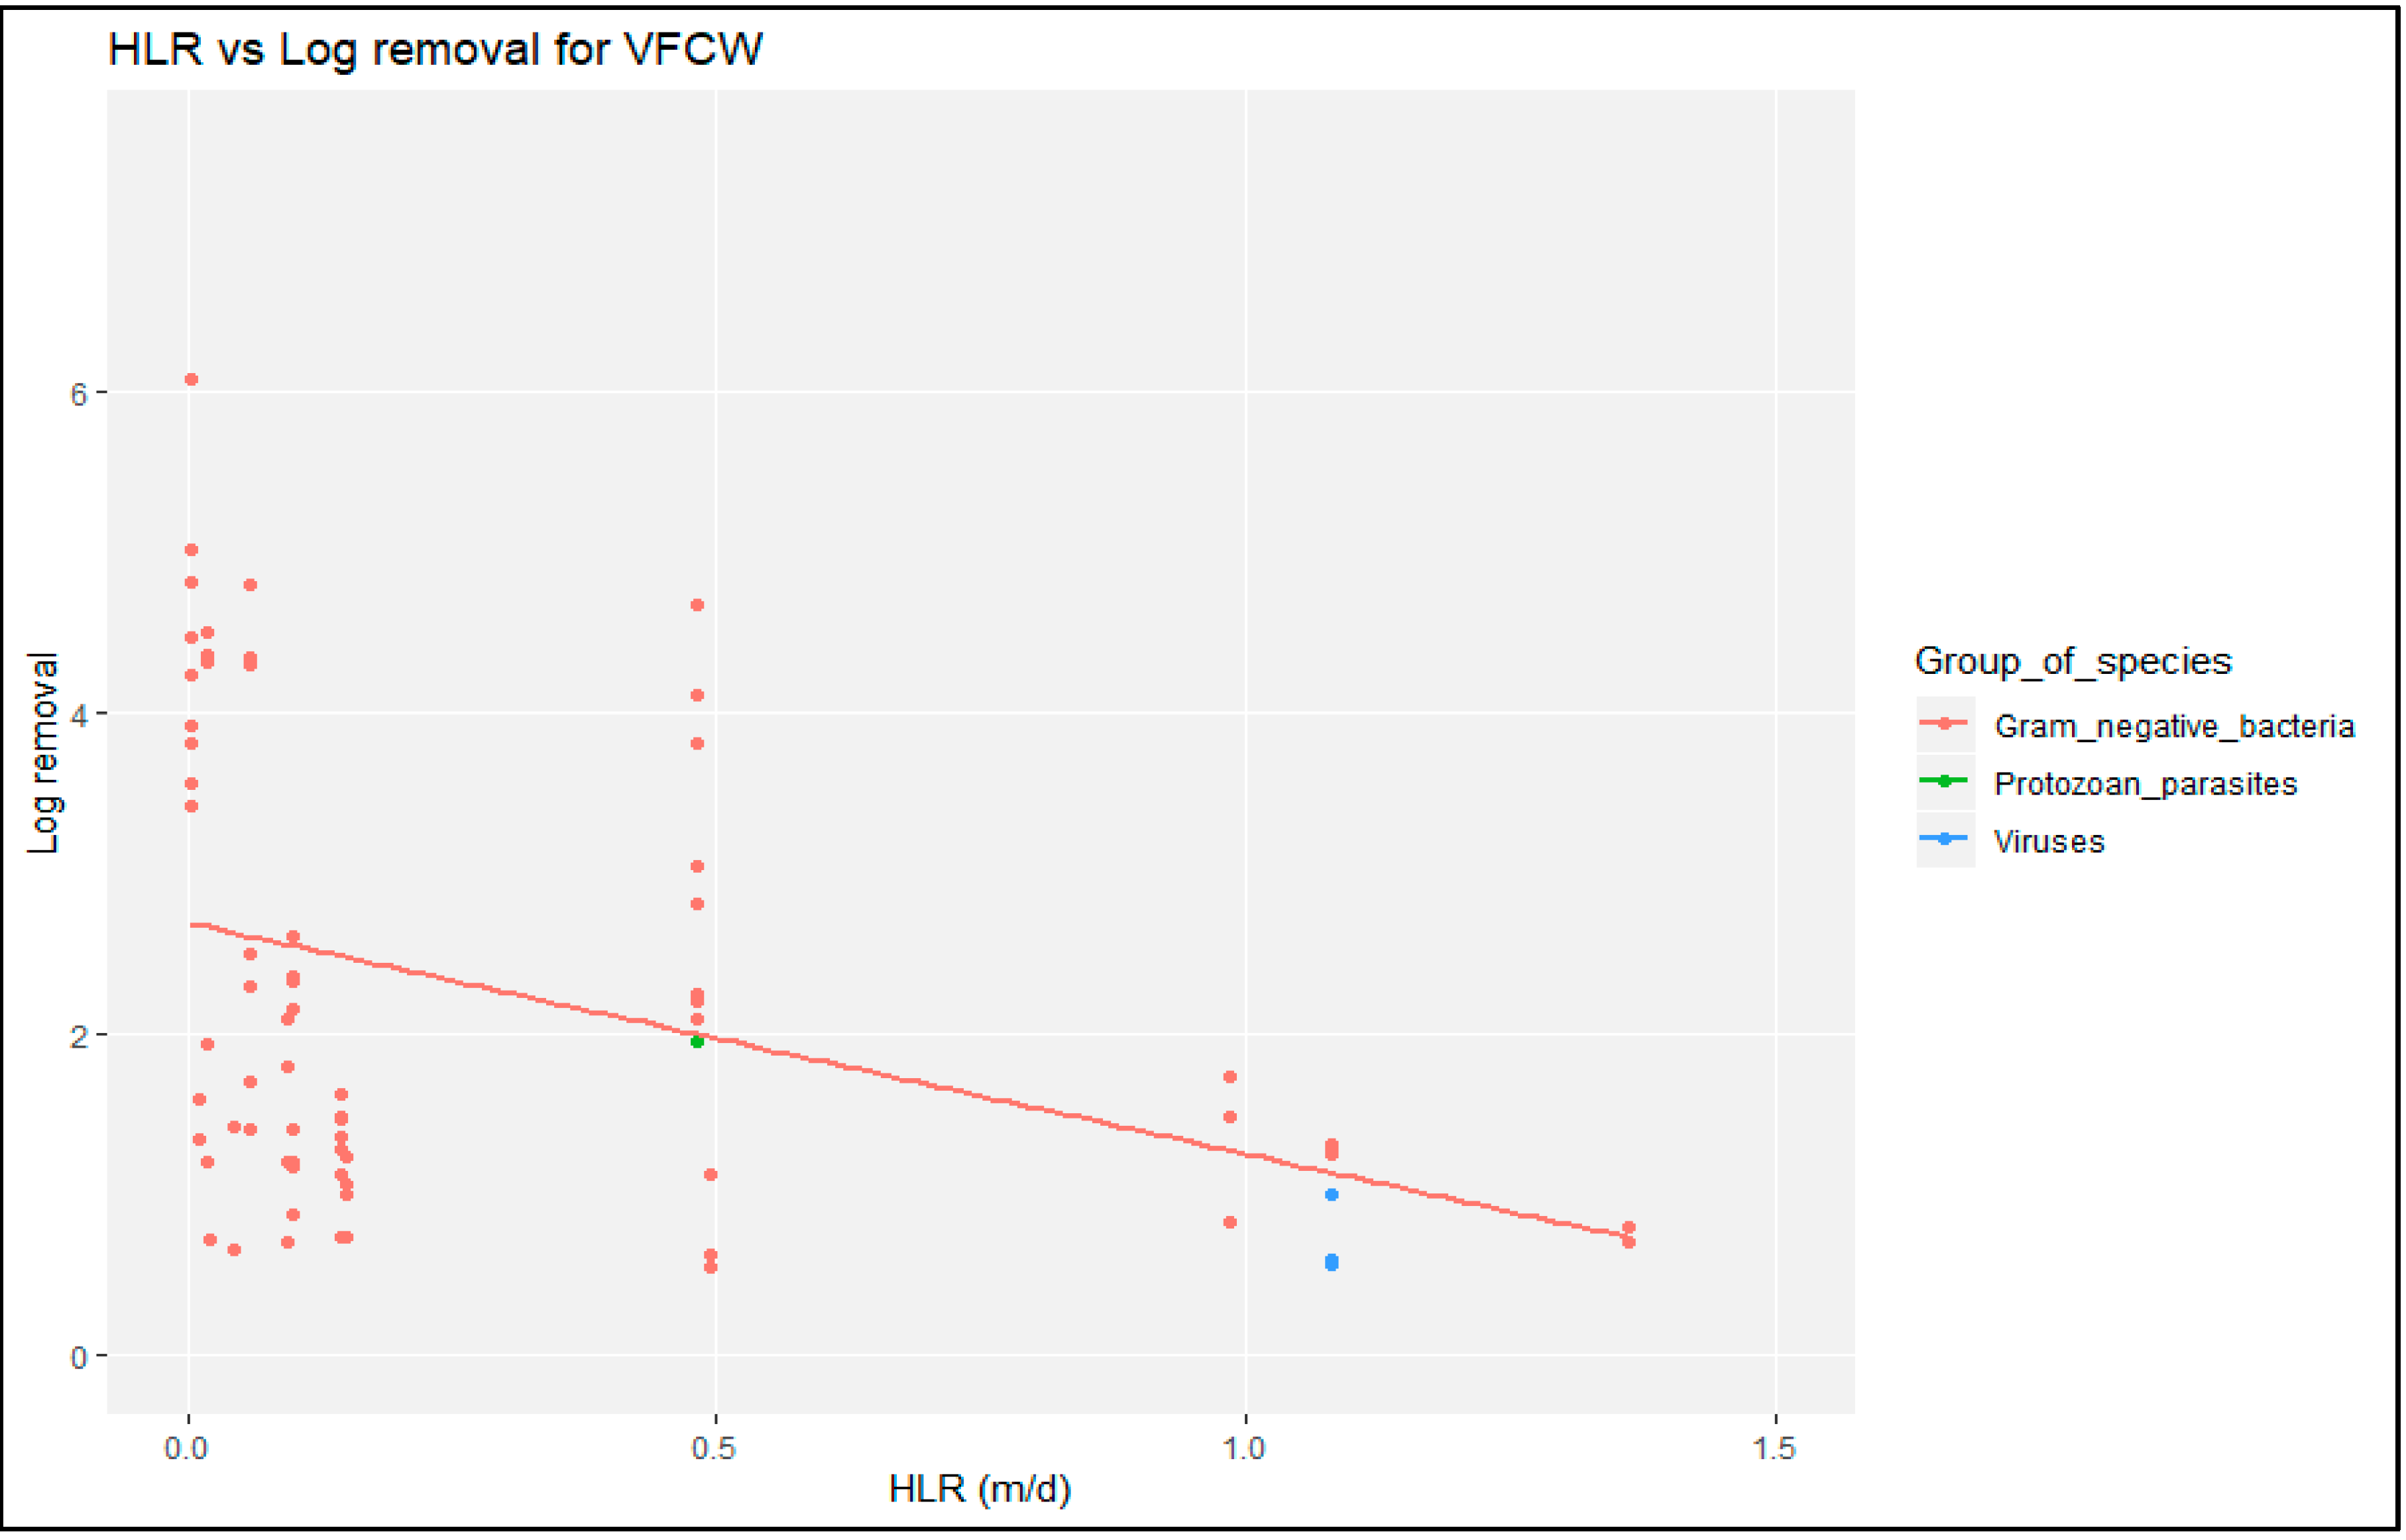
Figure A7.
Negative correlation between log removal and HLR for gram-negative bacteria. The remaining categories did not have enough data points.
Figure A7.
Negative correlation between log removal and HLR for gram-negative bacteria. The remaining categories did not have enough data points.

Figure A8.
Negative correlation between log removal and HRT for gram-negative bacteria. The remaining categories did not have enough data points.
Figure A8.
Negative correlation between log removal and HRT for gram-negative bacteria. The remaining categories did not have enough data points.

References
- Vymazal, J. Horizontal sub-surface flow and hybrid constructed wetlands systems for wastewater treatment. Ecol. Eng. 2005, 25, 478–490. [Google Scholar] [CrossRef]
- Toet, S.; Van Logtestijn, R.S.; Kampf, R.; Schreijer, M.; Verhoeven, J.T. The effect of hydraulic retention time on the removal of pollutants from sewage treatment plant effluent in a surface-flow wetland system. Wetlands 2005, 25, 375–391. [Google Scholar] [CrossRef]
- Rousseau, D.P.L.; Lesage, E.; Story, A.; Vanrolleghem, P.A.; De Pauw, N. Constructed wetlands for water reclamation. Desalination 2008, 218, 181–189. [Google Scholar] [CrossRef]
- Akratos, C.S.; Tsihrintzis, V.A. Effect of temperature, HRT, vegetation and porous media on removal efficiency of pilot-scale horizontal subsurface flow constructed wetlands. Ecol. Eng. 2007, 29, 173–191. [Google Scholar] [CrossRef]
- Weber, K.P.; Legge, R.L. Pathogen removal in constructed wetlands. In Wetlands: Ecology, Conservation and Restoration; Nova Publishers: New York, NY, USA, 2008; pp. 176–211. [Google Scholar]
- Liu, R.; Zhao, Y.; Doherty, L.; Hu, Y.; Hao, X. A review of incorporation of constructed wetland with other treatment processes. Chem. Eng. J. 2015, 279, 220–230. [Google Scholar] [CrossRef]
- Kadlec, R.H.; Wallace, S. Treatment Wetlands; CRC Press: Boca Raton, FL, USA, 2008. [Google Scholar]
- Lavrnić, S.; Mancini, M.L. Can constructed wetlands treat wastewater for reuse in agriculture? Review of guidelines and examples in South Europe. Water Sci. Technol. 2016, 73, 2616–2626. [Google Scholar] [CrossRef] [PubMed]
- Marecos do Monte, H.; Albuquerque, A. Analysis of constructed wetland performance for irrigation reuse. Water Sci. Technol. 2010, 61, 1699–1705. [Google Scholar] [CrossRef]
- Masi, F.; Rizzo, A.; Regelsberger, M. The role of constructed wetlands in a new circular economy, resource oriented, and ecosystem services paradigm. J. Environ. Manag. 2018, 216, 275–284. [Google Scholar] [CrossRef] [PubMed]
- Vymazal, J.; Greenway, M.; Tonderski, K.; Brix, H.; Mander, Ü. Constructed wetlands for wastewater treatment. In Wetlands and Natural Resource Management; Springer: Berlin/Heidelberg, Germany, 2006; pp. 69–96. [Google Scholar]
- Vymazal, J.; Kröpfelová, L. Wastewater Treatment in Constructed Wetlands with Horizontal Sub-Surface Flow; Springer Science & Business Media: Berlin, Germany, 2008; Volume 14. [Google Scholar]
- Alexandros, S.I.; Akratos, C.S. Removal of pathogenic bacteria in constructed wetlands: Mechanisms and efficiency. In Phytoremediation; Springer: Cham, Switzerland, 2016; pp. 327–346. [Google Scholar]
- Liberati, A.; Altman, D.G.; Tetzlaff, J.; Mulrow, C.; Gøtzsche, P.C.; Ioannidis, J.P.; Moher, D. The PRISMA statement for reporting systematic reviews and meta-analyses of studies that evaluate health care interventions: Explanation and elaboration. PLoS Med. 2009, 6, e1000100. [Google Scholar] [CrossRef] [PubMed]
- Das, B.M. Advanced Soil Mechanics; CRC Press: Boca Raton, FL, USA, 2013. [Google Scholar]
- Son, Y.K.; Yoon, C.G.; Kim, H.C.; Jang, J.H.; Lee, S.B. Determination of regression model parameter for constructed wetland using operating data. Paddy Water Environ. 2010, 8, 325–332. [Google Scholar] [CrossRef]
- Stone, K.C.; Poach, M.E.; Hunt, P.G.; Reddy, G.B. Marsh-pond-marsh constructed wetland design analysis for swine lagoon wastewater treatment. Ecol. Eng. 2004, 23, 127–133. [Google Scholar] [CrossRef]
- Knight, R.L.; Payne, V.W., Jr.; Borer, R.E.; Clarke, R.A., Jr.; Pries, J.H. Constructed wetlands for livestock wastewater management. Ecol. Eng. 2000, 15, 41–55. [Google Scholar] [CrossRef]
- Kadlec, R.H. Deterministic and stochastic aspects of constructed wetland performance and design. Water Sci. Technol. 1997, 35, 149–156. [Google Scholar] [CrossRef]
- Kadlec, R.H. The limits of phosphorus removal in wetlands. Wetlands Ecol. Manag. 1999, 7, 165–175. [Google Scholar] [CrossRef]
- Avelar, F.F.; de Matos, A.T.; de Matos, M.P.; Borges, A.C. Coliform bacteria removal from sewage in constructed wetlands planted with Mentha aquatica. Environ. Technol. 2014, 35, 2095–2103. [Google Scholar] [CrossRef] [PubMed]
- Arias, C.A.; Cabello, A.; Brix, H.; Johansen, N.H. Removal of indicator bacteria from municipal wastewater in an experimental two-stage vertical flow constructed wetland system. Water Sci. Technol. 2003, 48, 35–41. [Google Scholar] [CrossRef] [PubMed]
Figure 1.
Flow diagram of the selection of studies adopted by the Preferred Reporting Items for Systematic Reviews and Meta-Analyses (PRISMA) guidelines. Source: Liberati et al. (2009).
Figure 1.
Flow diagram of the selection of studies adopted by the Preferred Reporting Items for Systematic Reviews and Meta-Analyses (PRISMA) guidelines. Source: Liberati et al. (2009).

Figure 2.
Spatial distribution of selected case studies throughout the different temperature/climatic zones.
Figure 2.
Spatial distribution of selected case studies throughout the different temperature/climatic zones.

Figure 3.
Average log removal comparison between indicators and pathogens for the three categories.

Figure 4.
Average log removal per country and their respective climatic zone.

Figure 5.
Log removal comparison between different types of CW.

Figure 6.
The relationship between influent and effluent concentration in FWS.

Figure 7.
Positive correlation between HLR and log removal in FWS CW for the 3 different pathogen categories.
Figure 7.
Positive correlation between HLR and log removal in FWS CW for the 3 different pathogen categories.

Figure 8.
Positive correlation between Hydraulic Retention Time (HRT) and log removal in FWS CW for the 3 different pathogen categories.
Figure 8.
Positive correlation between Hydraulic Retention Time (HRT) and log removal in FWS CW for the 3 different pathogen categories.

Figure 9.
Cumulative distribution of the three types of wetlands found in the literature review.

Figure 10.
Comparison of pathogen categories per CW type.

Figure 11.
Log removal range for the most representative indicators and index pathogens, ranked based on average log removal.
Figure 11.
Log removal range for the most representative indicators and index pathogens, ranked based on average log removal.

Figure 12.
Cumulative distribution of the three pathogen categories found in the literature review.

Figure 13.
Cumulative distribution of the most representative indicators found in the literature review.
Figure 13.
Cumulative distribution of the most representative indicators found in the literature review.


Table 1.
Grouping of pathogenic microorganisms found in the literature review in three main categories.
Table 1.
Grouping of pathogenic microorganisms found in the literature review in three main categories.
| Gram-Negative Bacteria | Viruses | Protozoan Parasites | |
|---|---|---|---|
| Indicator | Escherichia coli Total/fecal coliform Fecal streptococci/enterococci Intestinal enterococci | Coliphages F-RNA specific phages Bacteriophages infecting GB124 MS2 bacteriophages | Clostridia Clostridium perfringens spores |
| Pathogen | Pseudomonas aeruginosa Campylobacter Salmonella Aeromonas | Adenovirus Aichi virus 1 BG/JC polyomavirus Enteric virus Norovirus GII | Giardia/giardia lamblia Cryptosporidium |
Table 2.
The overall performance of CW types. Log removal of pathogens is calculated on average.
| FWS | SSFHCW | VFCW | ||
|---|---|---|---|---|
| General Information | Number of papers | 21 | 31 | 19 |
| Number of pilot-scale | 11 | 22 | 16 | |
| Number of full-scale | 10 | 9 | 3 | |
| Pathogen Removal | Log removal | 1.54 (n = 106) | 1.72 (n = 241) | 2.26 (n = 77) |
| Percentage removal | 97.1 | 98.09 | 99.45 | |
| Minimum log removal | 0.07 | 0.011 | 0.35 | |
| Maximum log removal | 5.3 | 5.68 | 6.08 | |
| Standard deviation | 0.74 | 0.77 | 1.01 | |
| Physicochemical Characteristics | Air temperature °C | 20 (n = 34) | 19.2 (n = 95) | 19.4 (n = 31) |
| Water temperature °C | 17.3 (n = 47) | 21.6 (n = 121) | 17.9 (n = 63) | |
| PH | 7.43 (n = 73) | 7.03 (n = 1223) | 7.35 (n = 57) | |
| COD removal (mg/L) % | 66.6 (n = 57) | 69.5 (n = 169) | 83.4(n = 58) | |
| BOD removal (mg/L) % | 72.6 (n = 32) | 68.2 (n = 83) | 92.5 (n = 24) | |
| BOD5 removal (mg/L) % | 65.03 (n = 11) | 83.01 (n = 88) | 93.7 (n = 18) | |
| TSS removal (mg/L) % | 71.6 (n = 56) | 65.6 (n = 136) | 82.8 (n = 50) | |
| HLR range (m/d) | 0.058–5.1 (n = 107) | 0.005–2.59 (n = 255) | 0.0028–1.36 (n = 86) | |
| HRT range (d) | 0.29–7 (n = 107) | 0.028–13 (n = 255) | 0.01–9.1 (n = 86) |
N = number of data points. FWS = Free Water Surface; SSFHCW =Subsurface Horizontal Flow Constructed Wetland; VFCW = Vertical Flow Constructed Wetland.
Table 3.
Gram-negative bacteria (GNB) removal performance for all three types of wetlands.
| Pathogen Category | Gram-Negative Bacteria | |||
|---|---|---|---|---|
| General Information | Average log removal | 1.84 | ||
| Number of papers | 47 | |||
| Number of pilot-scale | 33 | |||
| Number of full-scale | 14 | |||
| Constructed Wetlands | Types of CWs | FWS | SSHFCW | VFCW |
| Number of data points | n = 77 | n = 216 | n = 72 | |
| Average log removal | 1.75 | 1.70 | 2.33 | |
| Minimum log removal | 0.07 | 0.01 | 0.55 | |
| Maximum log removal | 5.32 | 5.68 | 6.08 | |
| Standard deviation | 1.19 | 1.14 | 1.45 | |
| Average percentage removal | 98.22 | 98 | 99.5 | |
| Physicochemical Characteristics | Air temperature °C | 19.6 (n = 27) | 19.1 (n = 84) | 19 (n = 27) |
| Water temperature °C | 15.6 (n = 29) | 21.6 (n = 108) | 18.1 (n = 54) | |
| PH | 7.5 (n = 52) | 7.03 (n = 108) | 7.4 (n = 48) | |
| COD removal (mg/L) % | 66.2 (n = 50) | 67.5 (n = 151) | 82.6 (n = 52) | |
| BOD removal (mg/L) % | 72.5 (n = 26) | 67.6 (n = 81) | 92.2 (n = 22) | |
| BOD5 removal (mg/L) % | 64.8 (n = 10) | 84.6 (n = 71) | 92.46 (n = 14) | |
| TSS removal (mg/L) % | 71.1 (n = 49) | 64.7 (n = 127) | 83.5 (n = 45) | |
| HLR range (m/d) | 0.058–5.1 (n = 75) | 0.005–2.59 (n = 219) | 0.0028–1.36 (n = 72) | |
| HRT range (d) | 0.29–7 (n = 74) | 0.28–15 (n = 219) | 0.01–9.1 (n = 72) | |
Table 4.
Average log removal range for all three types of wetlands.
| Type of CW | FWS (log) | SSHFCW (log) | VFCW (log) | |
|---|---|---|---|---|
| Pathogen Category | Gram-negative bacteria | 0.07–5.32 | 0.01–5.68 | 0.55–6.08 |
| Viruses | 0.06–2.88 | 0.02–3.62 | 0.57–1.75 | |
| Protozoan parasites | 0.18–2 | 0.28–3.63 | 0.35–2.72 |
Publisher’s Note: MDPI stays neutral with regard to jurisdictional claims in published maps and institutional affiliations. |
© 2020 by the authors. Licensee MDPI, Basel, Switzerland. This article is an open access article distributed under the terms and conditions of the Creative Commons Attribution (CC BY) license (https://creativecommons.org/licenses/by/4.0/).
Share and Cite
MDPI and ACS Style
Paraskevopoulos, S.; Smeets, P. Quantifying the Log Reduction of Pathogenic Microorganisms by Constructed Wetlands: A Review. Proceedings 2020, 48, 9. https://doi.org/10.3390/ECWS-4-06433
AMA Style
Paraskevopoulos S, Smeets P. Quantifying the Log Reduction of Pathogenic Microorganisms by Constructed Wetlands: A Review. Proceedings. 2020; 48(1):9. https://doi.org/10.3390/ECWS-4-06433
Chicago/Turabian StyleParaskevopoulos, Sotirios, and Patrick Smeets. 2020. "Quantifying the Log Reduction of Pathogenic Microorganisms by Constructed Wetlands: A Review" Proceedings 48, no. 1: 9. https://doi.org/10.3390/ECWS-4-06433