Assessment and Impact of Soil Moisture Index in Agricultural Drought Estimation Using Remote Sensing and GIS Techniques †


RMO Division, National Institute of Hydrology, Roorkee, Uttarakhand 247 667, India
*
Author to whom correspondence should be addressed.
†
Presented at the 3rd International Electronic Conference on Water Sciences, 15–30 November 2018; Available online: https://ecws-3.sciforum.net.
Proceedings 2019, 7(1), 2; https://doi.org/10.3390/ECWS-3-05802
Published: 15 November 2018
(This article belongs to the Proceedings of ECWS-3)
Abstract
:Soil moisture takes an important part involving climate, vegetation and drought. This paper explains how to calculate the soil moisture index and the role of soil moisture. The objective of this study is to assess the moisture content in soil and soil moisture mapping by using remote sensing data in the selected study area. We applied the remote sensing technique which relies on the use of the soil moisture index (SMI) which uses the data obtained from satellite sensors in its algorithm. The relationship between land surface temperature (LST) and the normalized difference vegetation index (NDVI) are based on experimental parameterization for the soil moisture index. Multispectral satellite data (visible, red and near-infrared (NIR) and thermal infrared sensor (TIRS) bands) were utilized for assessment of LST and to make vegetation indices map. Geographic Information System (GIS) and image processing software were utilized to determine the LST and NDVI. NDVI and LST are considered as essential data to obtain SMI calculation. The statistical regression analysis of NDVI and LST were shown in standardized regression coefficient. NDVI values are within range −1 to 1 where negative values present loss of vegetation or contaminated vegetation, whereas positive values explain healthy and dense vegetation. LST values are the surface temperature in °C. SMI is categorized into classes from no drought to extreme drought to quantitatively assess drought. The final result is obtainable with the values range from 0 to 1, where values near 1 are the regions with a low amount of vegetation and surface temperature and present a higher level of soil moisture. The values near 0 are the areas with a high amount of vegetation and surface temperature and present the low level of soil moisture. The results indicate that this method can be efficiently applied to estimate soil moisture from multi-temporal Landsat images, which is valuable for monitoring agricultural drought and flood disaster assessment.
1. Introduction
Soil moisture is a key parameter which directy or indirectly influences the water cycle. Agriculture production of rabi crops in rainfed areas mainly depend on it as well as irrigation practices based on it. Climate change and the trend of increasing temperatures have a significant impact on crop production [1,2]. It is linked to various hydrological phenomenon, such as drought, climate, and vegetation. The data collected for soil moisture analysis taken below the surface over the long term as well as higher temporal and spatial resolution data are valuable for assessing the extent and severity of drought quite accurately [3]. Surface soil moisture is very sensitive which varies with space and time [4]. Various studies have been done to assess soil moisture. Two methods of soil moisture measurement are spcaborne remote sensing which is based on the microwave part of electomanetic spectrum and thermal, infrared observation [5].
In situ measurements can provide an accurate estimation of soil moisture, but they are both time consuming and expensive, and only represent a small area (few square decimeters). Nevertheless, a number of strategies can be adopted to upscale the spatially sparse ground-based observations [6,7], which are invaluable for calibrating and validating land surface models and satellite-based soil moisture retrievals [8]. Microwave remote sensing techniques have been used to obtain surface soil moisture, commonly referred to as the water content of the uppermost soil layer, at various temporal and spatial scales since the 1970s [9,10].
The soil moisture index (SMI) is defined as the proportion of the difference between the current soil moisture and the permanent wilting point to the field capacity and the residual soil moisture. The index values range from 0 to 1 with 0 indicating extreme dry conditions and 1 indicating extreme wet conditions [11].
2. Study Area and Data Used
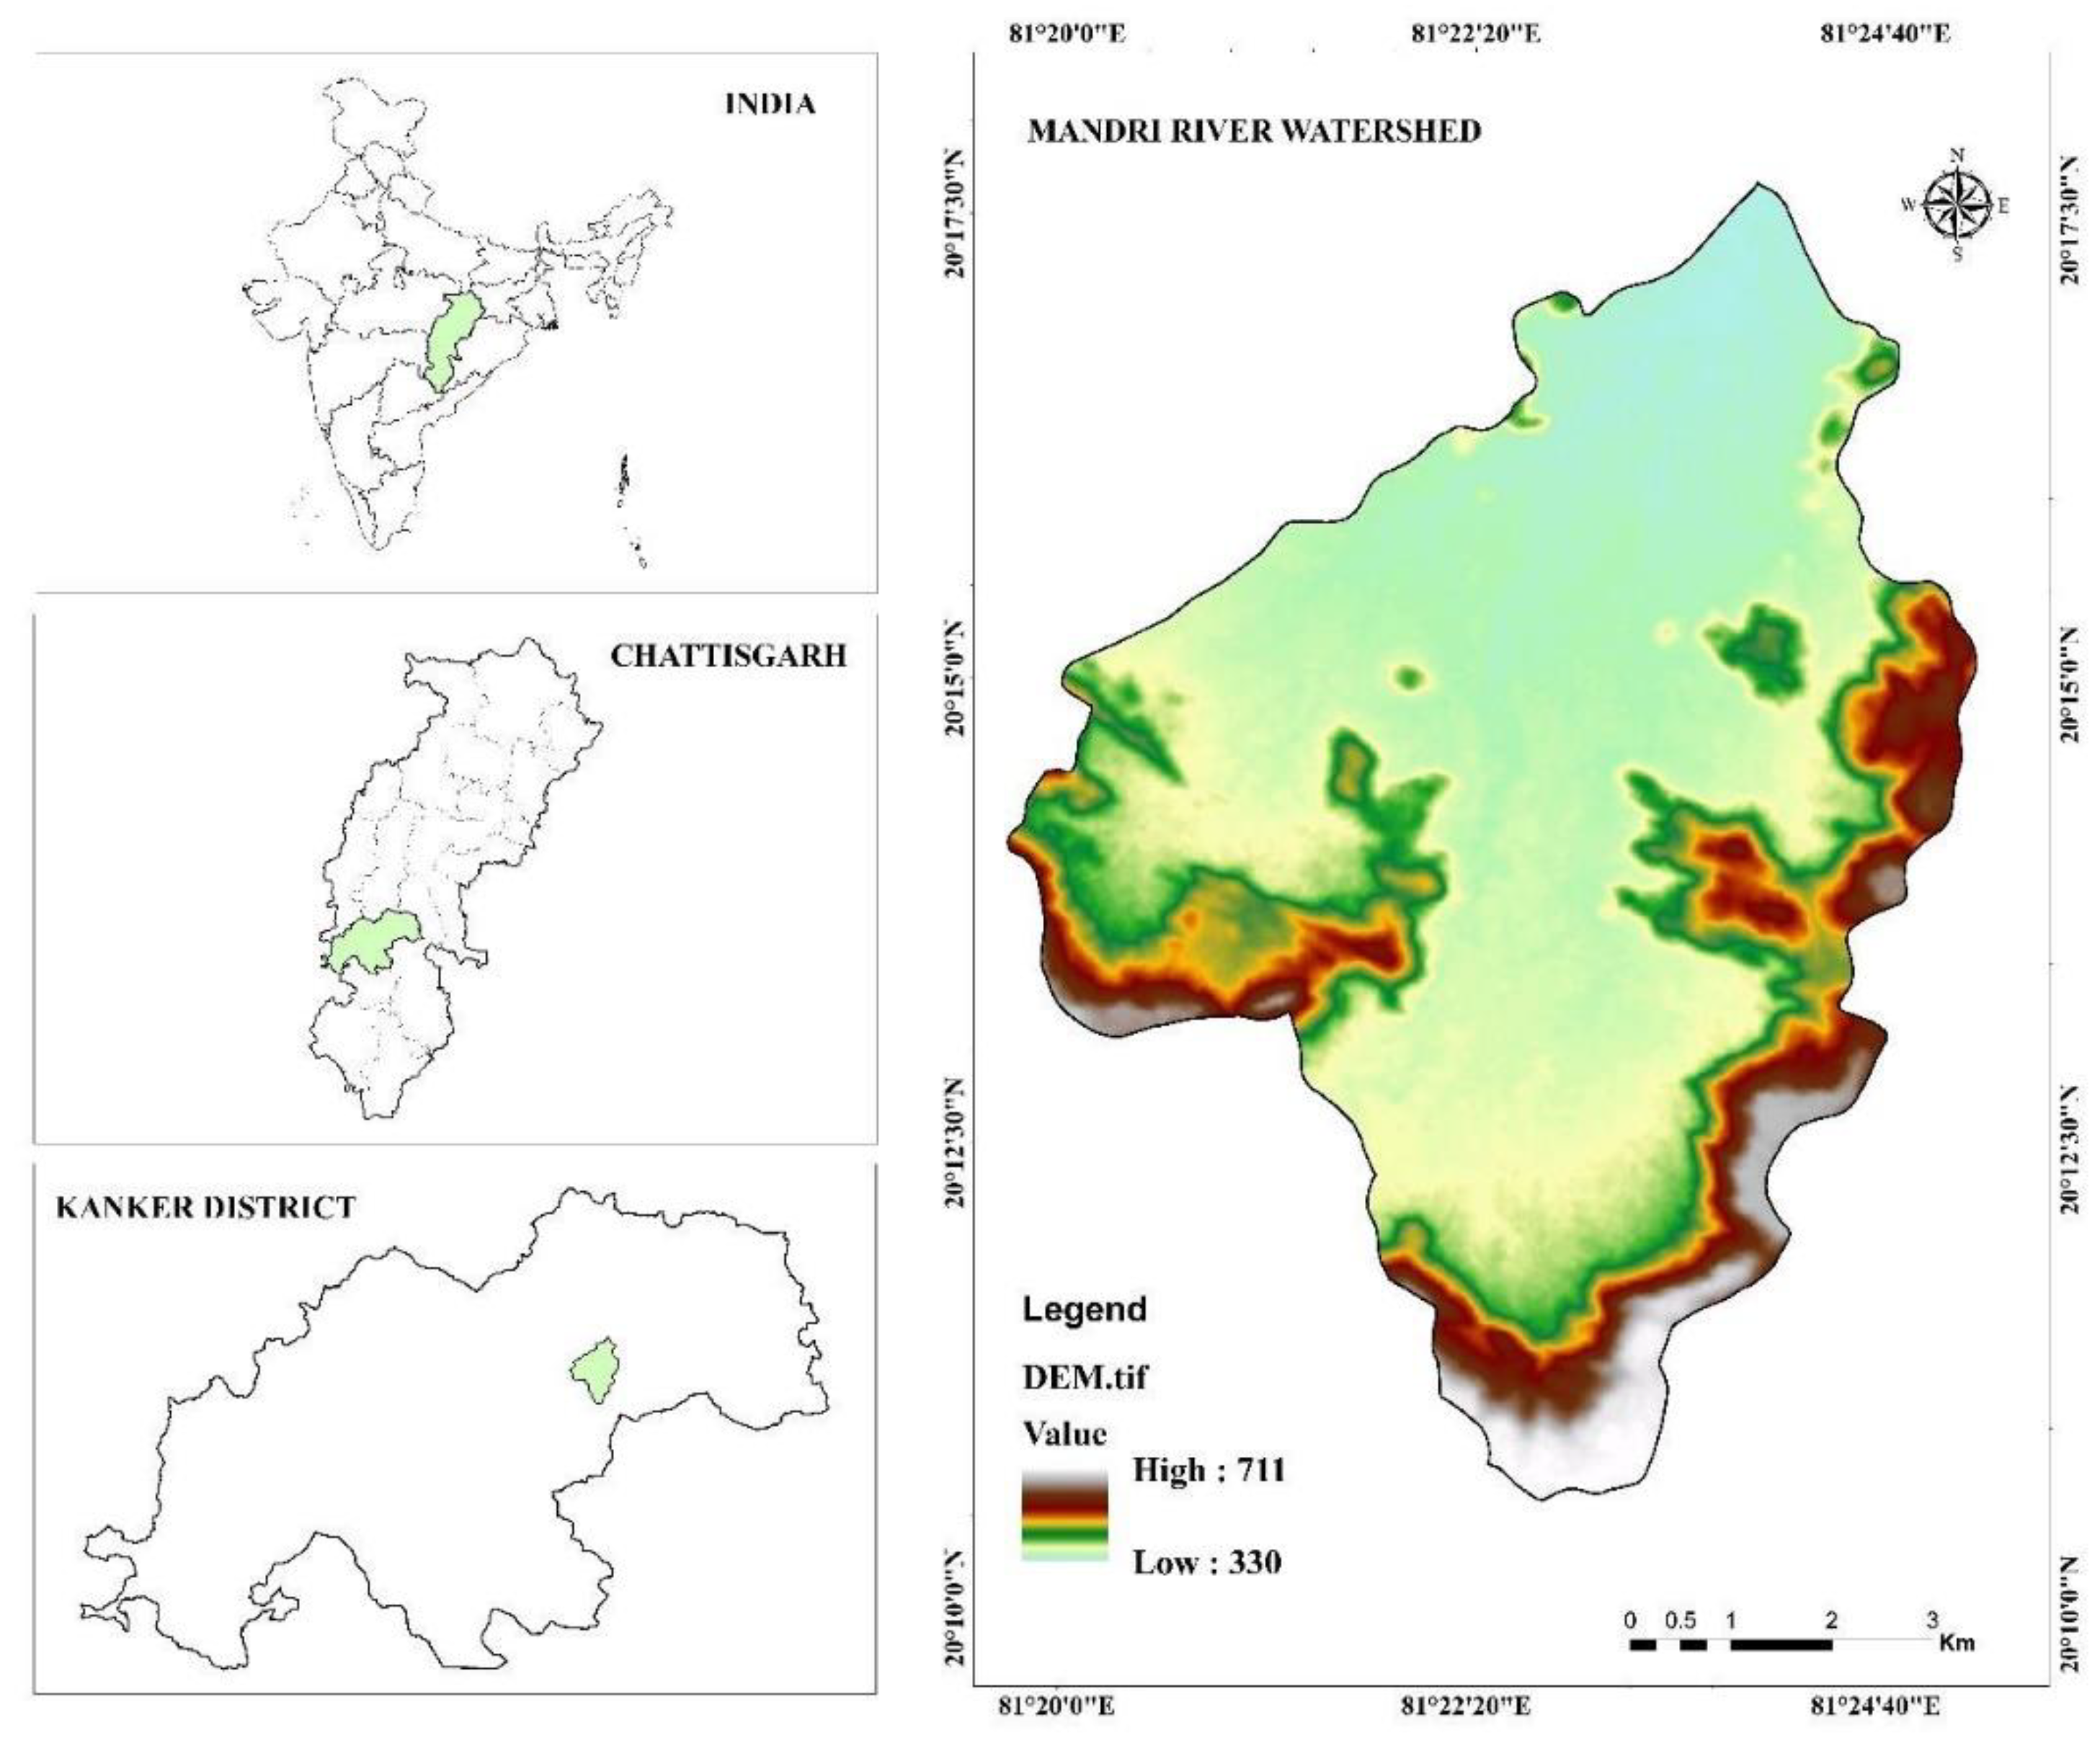
The study area was Mandri river watershed which falls in the Middle Mahanadi basin. This watershed lies in the district Kanker of Chattisgarh, India. Mandri nadi is the major stream flowing through the area. It is located between 20.1990° N latitude and 81.0755° E longitude, having a total geographical area of 6670.3 ha. The topography of the watershed is undulating. The watershed has a maximum elevation of 711m above mean sea level and minimum elevation of 330 m above msl. On average the region experiences an annual rainfall of around 1300 mm approximately 90% of which falls during the period from mid-June to mid-October. The average annual rainfall has fluctuated greatly over the last ten years. Agriculture is the major activity for employment. The majority of the rainfall occurs in the Kharif season thereby making it a rainfed region. The overall drainage pattern of the watershed is dendritic. Figure 1 (right image) shows the digital elevation of the watershed.
The soil moisture index is mainly based on land surface temperature and vegetation indices of the study area. In the present work, the spatial resolutions of the used band is 30 m of Landsat 8 satellite imagery were downloaded using the United States Geological Survey (USGS) Earth Explorer website. Satellite imagery was downloaded dated 6 December 2017. Essential bands from the satellite images for the calculation are red and near-infrared (NIR) for the NDVI calculation and thermal infrared (TIR) bands for the land surface temperature (LST) calculation.
3. Methodology
The soil moisture index is based on empirical parameterization of the relationship between land surface temperature (LST) and normalized difference vegetation index (NDVI) (Figure 2) and calculated using Equation (1) [1,12,13,14]:
where, 𝐿𝑆𝑇𝑚𝑎𝑥 and 𝐿𝑆𝑇min are the maximum and minimum surface temperature for a given NDVI and LST is Land Surface Temperature. The surface temperature of a pixel for a given NDVI derived using remote sensing data. 𝐿𝑆𝑇𝑚𝑎𝑥 and 𝐿𝑆𝑇min are calculated using Equations (2) and (3), respectively [1,12,15].
where 𝑎1, 𝑎2, 𝑏1, and 𝑏2 are the empirical parameters obtained by the linear regression (a present slope and b present intercept) defining both warm and cold edges of the data. First step in SMI calculation is the conversion of digital number (DN) to spectral radiance (L W/𝑚2/sr/μm) using Equation (4) [1,16]:
where, 𝐿𝑆𝑇𝑚𝑖𝑛 and 𝐿𝑆𝑇𝑚𝑎𝑥 are spectral radiance calibration constants (Table 1); 𝑄𝐶𝐴𝐿𝑚𝑎𝑥 and 𝑄𝐶𝐴𝐿𝑚𝑖𝑛 are the highest and lowest quantized calibration pixel values (Table 2), and DN is the Digital Number.
𝑆𝑀𝐼 = (𝐿𝑆𝑇𝑚𝑎𝑥 − 𝐿𝑆𝑇)/(𝐿𝑆𝑇𝑚𝑎𝑥 − 𝐿𝑆𝑇min)
𝐿𝑆𝑇𝑚𝑎𝑥 = 𝑎1 ∗ 𝑁𝐷𝑉𝐼 + 𝑏1
𝐿𝑆𝑇𝑚𝑖𝑛 = 𝑎2 ∗ 𝑁𝐷𝑉𝐼 + 𝑏2
L = 𝐿𝑆𝑇𝑚𝑖𝑛 + (((𝐿𝑆𝑇𝑚𝑎𝑥 − 𝐿𝑆𝑇𝑚𝑖𝑛)/(𝑄𝐶𝐴𝐿𝑚𝑎𝑥 − 𝑄𝐶𝐴𝐿𝑚𝑖𝑛)) * (DN − 𝑄𝐶𝐴𝐿𝑚𝑖𝑛))
Two inputs must be calculated (LST and NDVI) to be able to calculate 𝐿𝑆𝑇𝑚𝑎𝑥 and 𝐿𝑆𝑇𝑚𝑖𝑛. LST (K) is calculated using Landsat 5 and Landsat 8 Thermal bands using Equation (5) [13]:
where 𝑇𝑏 (Equation (6)) is At-Satellite Brightness Temperature, λ is wavelength of emitted radiance, 𝐶2 = 1.4388 * 10−2 m K and it is presented with Equation (7) and ε is emissivity (typically 0.95).
where K1 is the sensor dependent calibration constant 1 and K2 is the sensor dependent calibration constant 2 (Table 3). ε is emissivity (typically 0.95), and L is the spectral radiance [16].
where, (Weng et al., 2004) h is Planck’s constant = 6.626 × 10⁻³⁴ J s; c is the velocity of light = 2.998 × 10⁸ m/s, and s is the Boltzmann constant = 1.38 × 10⁻²³ J/K.
LST = 𝑇𝑏/[1 + (λ * 𝑇𝑏/𝐶2) * ln (ε)]
𝑇𝑏 = (𝐾2/(ln (𝐾1 * ε/L + 1)))
𝐶2 = h ∗ c/s
The ratio of the reflectivity differences for the NIR and the red band to their sum (NDVI) is calculated using Equation (8) [1,17]:
NDVI = (NIR − Red)/(NIR + Red)
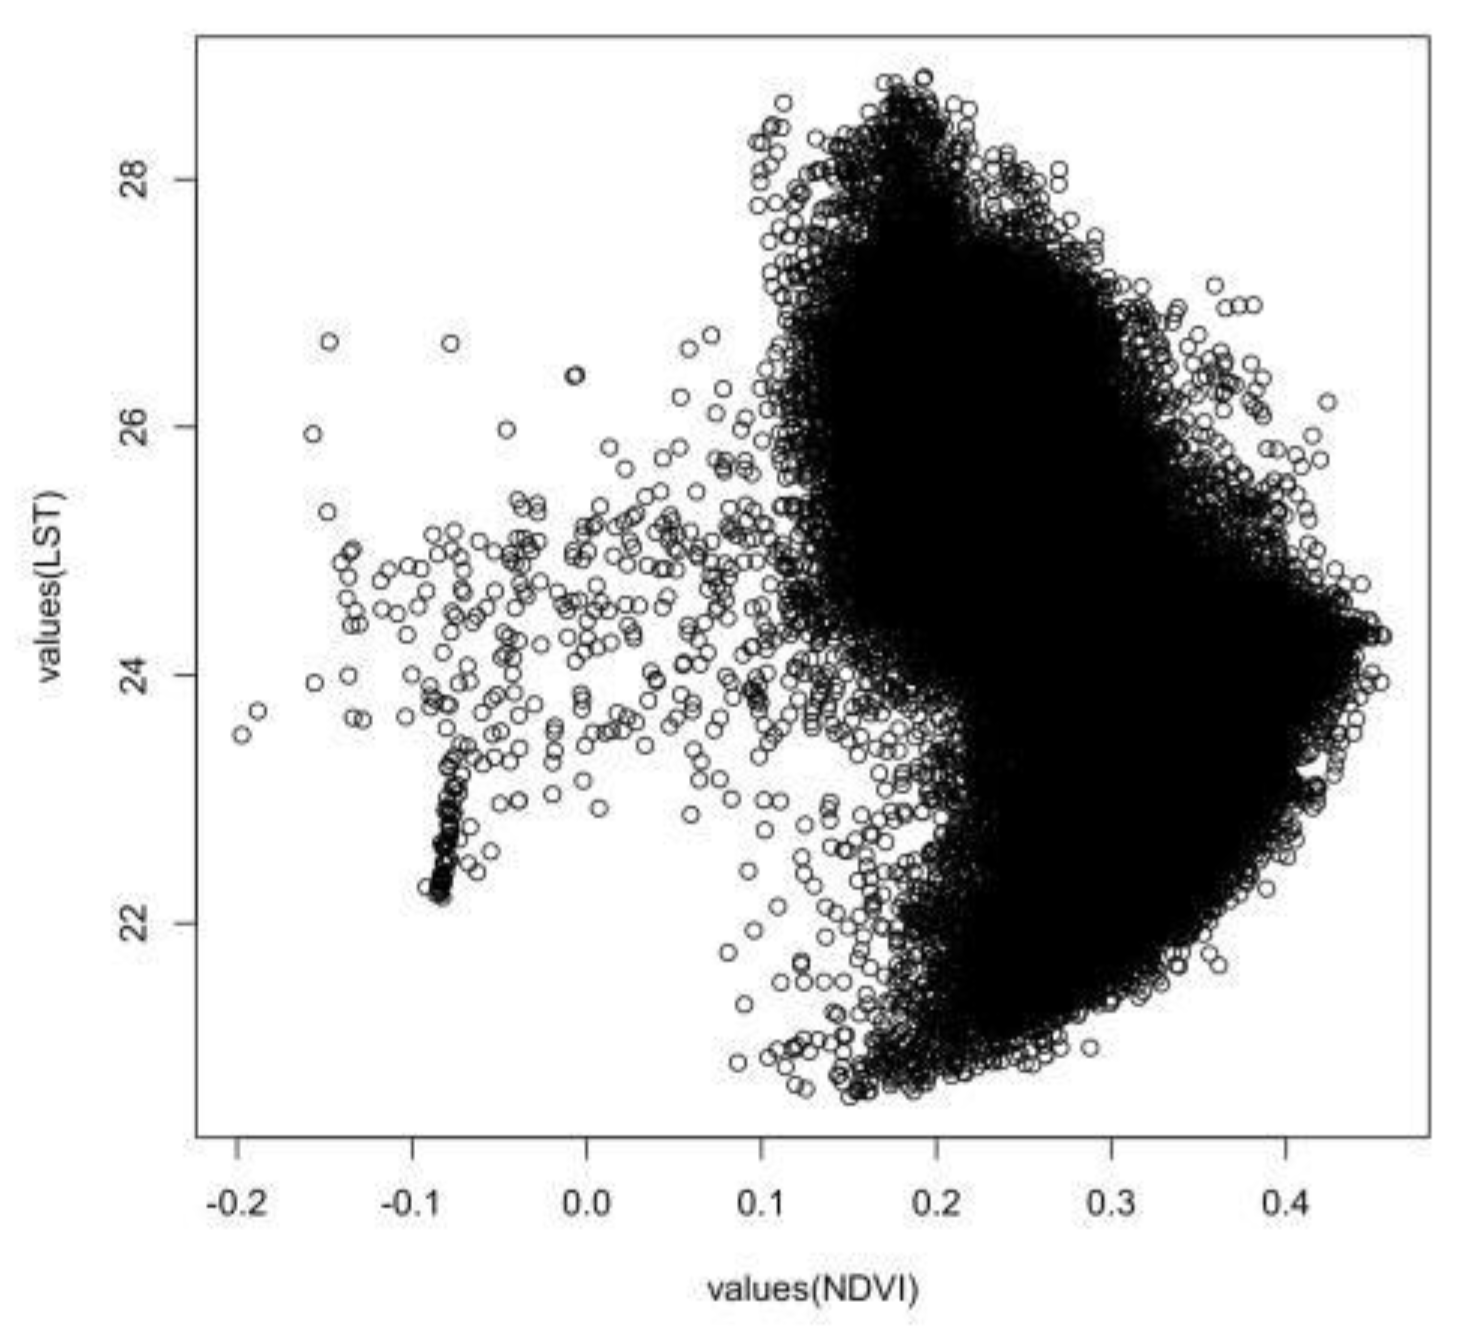
The final step in the data collecting is the determination of empirical parameters by linear regression. To do so, statistical software was developed which was able to process the data for the same pixel from two raster sets, LST and NDVI, and present the distribution of the data in a scatter plot. Linear regression values range from 0 at the “warm edge” to 1 at the “cold edge”. Pixels close to the warm edge are drier relative to the cold edge which is wetter (maximum evapotranspiration—unlimited water access). The scatter plot position of a pixel defines its moisture condition. The parameters are implemented in Equations (2) and (3).
4. Results and Discussion
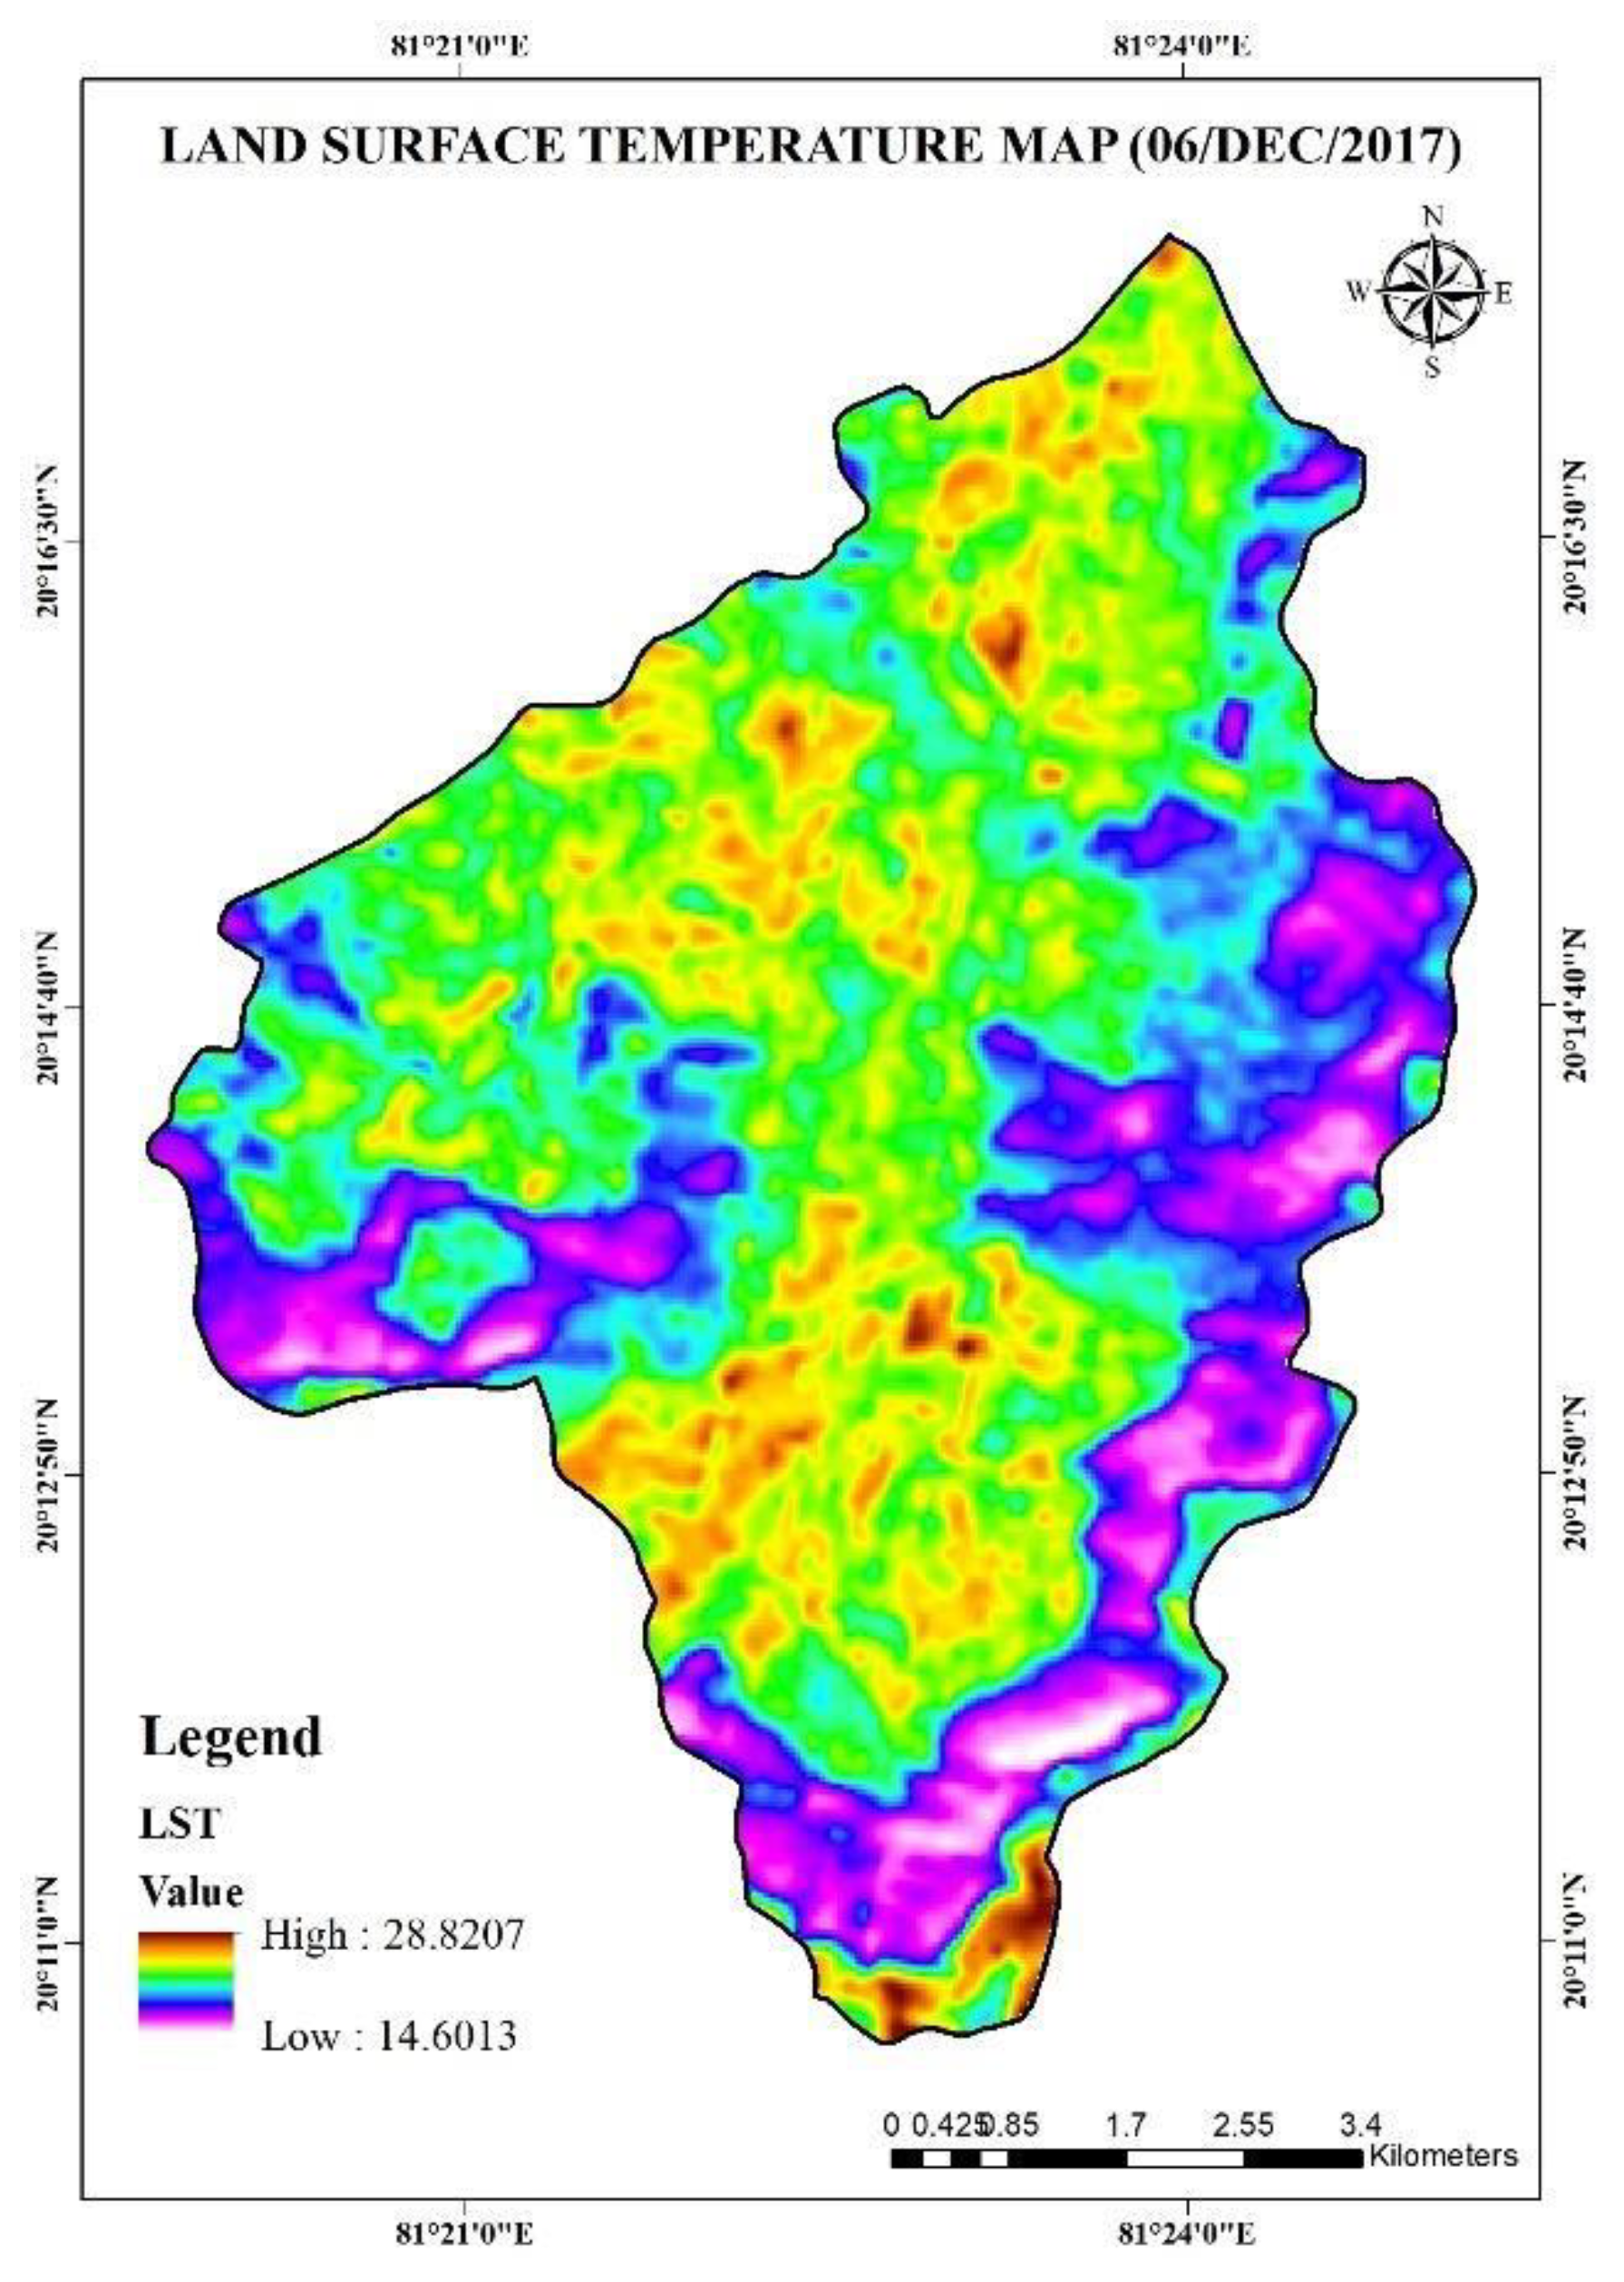
NDVI (Figure 3) and LST (Figure 4) are calculated based on essential data and correlate the scatter plot of NDVI and LST (Figure 5) to obtain SMI calculation. NDVI values vary in the range of −1 to 1 where negative values indicate the absence of vegetation or poor vegetative cover, while positive values show dense and good vegetative cover. LST values are the temperature of the surface which is measured in °C. The result is accessible with the values range within 0 to 1, where values close to 1 are regions with a lower vegetation cover and surface temperature which indicates that the surface has low infiltration and present a higher amount of soil moisture. The values close to 0 are the areas with a major vegetation cover and surface temperature and present a low level of soil moisture and increased infiltration capacity of the soil surface.
As per the research undertaken, the following conclusions are drawn:
NDVI value is within the range of −1 to +1 and it is divided between the five classes as mention in Figure 3. LST value varies between a minimum of 14.60 °C and a maximum of 28.82 °C. The scatter plot between the pixels with NDVI values with corresponding LST values is shown in Figure 5.
The results of the soil moisture index map of December 2017 indicate the soil moisture index was in the range of 0 to 1 as classified in four color gradient. Most of the study area, as shown in Figure 6 (violet and blue color), has a value close to zero, which was highly affected by water deficit. The values near 1 (red and yellow) are forest cover which has moisture as compared to the rest of the land cover. The results concluded that more than 50 percent of the area was close to zero, which indicates a moisture deficit in the offseason throughout the study area. As per the index, 1 represents a higher presence of water or moisture, and zero indicates minimum moisture content, such as dry areas.
5. Conclusions
Soil moisture is important in agricultural for crop production. The study was undertaken in the Mandri river watershed of the Kanker district in Chhattisgarh, of which around 39% of the total area is dominated by agriculture land. The amount of irrigation depends on soil moisture. Results conclude that around 50% area has severe drought conditions and the remainder of the forest cover has normal moisture conditions. To increase agriculture productivity, we have to focus on reforestation to increase precipitation as well as moisture conditions.
Author Contributions
A.S.: contributed to all sections. M.P.: contributed to all sections. V.C.G.: contributed to the introduction and discussion sections. D.S.R.: contributed to the results and discussion sections. The author read and approved the final manuscript.
Acknowledgments
Thanks to the National Institute of Hydrology, Roorkee for providing feedback on the results of this research. The author also wishes to thank the editors for inviting this present contribution.
Conflicts of Interest
The authors declare that they have no competing interests.
Abbreviations
The following abbreviations are used in this manuscript:
| SMI | Soil Moisture Index |
| NDVI | Normalized Difference Vegetation Index |
| LST | Land Surface Temperature |
| NIR | Near Infrared |
| TIR | Thermal Infrared |
| USGS | United States Geological Survey |
References
- Potić, I.; Bugarski, M.; Matić-Varenica, J. Soil Moisture Determination Using Remote Sensing Data for the Property Protection and Increase of Agriculture Production. In Proceedings of the 2017 Annual World Bank Conference On Land And Poverty, Washington, DC, USA, 20–24 March 2017. [Google Scholar]
- van Leeuwen, B. GIS Workflow for Continuous Soil Moisture Estimation Based on Medium Resolution Satellite Data. 2015. Available online: https://agile-online.org/conference_paper/cds/agile_2015/shortpapers/65/65_Paper_in_PDF.pdf (accessed on 9 June 2015).
- Sridhar, V.; Hubbard, K.G.; You, J.; Hunt, E.D. Development of the Soil Moisture Index to Quantify Agricultural Drought and Its “User Friendliness” in Severity-Area-Duration Assessment. J. Hydrometeorol. 2007, 9, 660–676. [Google Scholar] [CrossRef]
- Korres, W.; Reichenau, T.; Schneider, K. Patterns and scaling properties of surface soil moisture in an agricultural landscape: An ecohydrological modeling study. J. Hydrol. 2013, 498, 89–102. [Google Scholar] [CrossRef]
- Vicente-Serrano, S.M.; Pons-Fernández, X.; Cuadrat-Prats, J.M. Mapping soil moisture in the central Ebro river valley (northeast Spain) with Landsat and NOAA satellite imagery: A comparison with meteorological data. Int. J. Remote Sens. 2004, 25, 4325–4350. [Google Scholar] [CrossRef]
- Cosh, M.H.; Ochsner, T.E.; McKee, L.; Dong, J.; Basara, J.B.; Evett, S.R.; Hatch, C.E.; Small, E.E.; Steele-Dunne, S.C.; Zreda, M. The soil moisture active passive marena, Oklahoma, in situ sensor testbed (smap-moisst): Testbed design and evaluation of in situ sensors. Vadose Zone J. 2016, 15. [Google Scholar] [CrossRef]
- Crow, W.T.; Berg, A.A.; Cosh, M.H.; Loew, A.; Mohanty, B.P.; Panciera, R.; Rosnay, P.; Ryu, D.; Walker, J.P. Upscaling sparse ground-based soil moisture observations for the validation of coarse-resolution satellite soil moisture products. Rev. Geophys. 2012, 50. [Google Scholar] [CrossRef]
- Dorigo, W.; Wagner, W.; Hohensinn, R.; Hahn, S.; Paulik, C.; Xaver, A.; Gruber, A.; Drusch, M.; Mecklenburg, S.; Oevelen, P.V. The International Soil Moisture Network: A data hosting facility for global in situ soil moisture measurements. Hydrol. Earth Syst. Sci. 2011, 15, 1675–1698. [Google Scholar] [CrossRef]
- Schmugge, T.; Gloersen, P.; Wilheit, T.; Geiger, F. Remote sensing of soil moisture with microwave radiometers. J. Geophys. Res. 1974, 79, 317–323. [Google Scholar] [CrossRef]
- Zhang, Y.; Gong, J.; Sun, K.; Yin, J.; Chen, X. Estimation of Soil Moisture Index Using Multi-Temporal Sentinel-1 Images over Poyang Lake Ungauged Zone. Remote Sens. 2018, 10, 12. [Google Scholar] [CrossRef]
- Chandrasekar, K. Geo-spatial Meteorological Products for Agricultural Drought Assessment, NRSC User Interaction Meet- PPT. 2016. Available online: https://www.nrsc.gov.in/sites/all/pdf/UIM_2016_K%20cHandra-2.pdf (accessed on 3 February 2016).
- Parida, B.R.; Collado, W.B.; Borah, R.; Hazarika, M.K.; Samarakoon, L. Detecting Drought-Prone Areas of Rice Agriculture Using a MODIS-Derived Soil Moisture Index. GIsci. Remote Sens. 2008, 45, 109–129. [Google Scholar] [CrossRef]
- Weng, Q.; Lu, D.; Schubring, J. Estimation of land surface temperature–vegetation abundance relationship for urban heat island studies. Remote Sens. Environ. 2004, 89, 467–483. [Google Scholar] [CrossRef]
- Zeng, Y.; Feng, Z.; Xiang, N. Assessment of soil moisture using Landsat ETM+ temperature/vegetation index in semiarid environment. In Proceedings of the IGARSS’04 Geoscience and Remote Sensing Symposium, Anchorage, AK, USA, 20–24 September 2004; Volume 6, pp. 4306–4309. [Google Scholar] [CrossRef]
- Zhan, Z.; Qin, Q.; Wang, X. The Application of LST/NDVI Index for Monitoring Land Surface Moisture in Semiarid Area. In Proceedings of the IGARSS ’04, Anchorage, AK, USA, 20–24 September 2004; Volume 3, pp. 1551–1555. [Google Scholar]
- Lwin, K.K. Estimation of Landsat TM Surface Temperature Using ERDAS Imagine Spatial Modeler; SIS Tutorial Series; Division of Spatial Information Science, 2010; Available online: http://giswin.geo.tsukuba.ac.jp/sis/tutorial/koko/SurfaceTemp/SurfaceTemperature.pdf (accessed on 1 November 2010).
- Rouse, J.W.; Haas, R.H.; Schell, J.A.; Deering, D.W. Monitoring vegetation systems in the Great Plains with ERTS. In Proceedings of the Third ERTS-1 Symposium, NASA SP-351, Washington, DC, USA, 10–14 December 1973; pp. 309–317. [Google Scholar]
Figure 1.
Study area map of Mandri river watershed in Chattisgarh.

Figure 2.
Methodology flowchart of soil moisture index (SMI) calculations.

Figure 3.
Normalized difference vegetation index (NDVI) map.

Figure 4.
Land surface temperature (LST) map.

Figure 5.
Scatter plots for corresponding areas of interest.

Figure 6.
Soil moisture index map of study area.


Table 1.
Spectral radiance (Lmin and Lmax) values for thermal bands of Landsat imagery. (source: NASA (2013), USGS (2015), [1]).
Table 1.
Spectral radiance (Lmin and Lmax) values for thermal bands of Landsat imagery. (source: NASA (2013), USGS (2015), [1]).
| Landsat 5 (Band 6) | Landsat 8 (Band 10 and 11) | ||
|---|---|---|---|
| Radiance maximum | Radiance minimum | Radiance maximum | Radiance minimum |
| 1.238 | 15.303 | 0.1003 | 22.0018 |
Table 2.
Quantized calibration pixel (Qmin and Qmax) values for thermal bands of Landsat imagery (source: NASA (2013), USGS (2015), [1]).
Table 2.
Quantized calibration pixel (Qmin and Qmax) values for thermal bands of Landsat imagery (source: NASA (2013), USGS (2015), [1]).
| Landsat 5 (Band 6) | Landsat 8 (Band 10 and 11) | ||
|---|---|---|---|
| Radiance maximum | Radiance minimum | Radiance maximum | Radiance minimum |
| 1 | 255 | 1 | 65535 |
Publisher’s Note: MDPI stays neutral with regard to jurisdictional claims in published maps and institutional affiliations. |
© 2018 by the authors. Licensee MDPI, Basel, Switzerland. This article is an open access article distributed under the terms and conditions of the Creative Commons Attribution (CC BY) license (https://creativecommons.org/licenses/by/4.0/).
Share and Cite
MDPI and ACS Style
Saha, A.; Patil, M.; Goyal, V.C.; Rathore, D.S. Assessment and Impact of Soil Moisture Index in Agricultural Drought Estimation Using Remote Sensing and GIS Techniques. Proceedings 2019, 7, 2. https://doi.org/10.3390/ECWS-3-05802
AMA Style
Saha A, Patil M, Goyal VC, Rathore DS. Assessment and Impact of Soil Moisture Index in Agricultural Drought Estimation Using Remote Sensing and GIS Techniques. Proceedings. 2019; 7(1):2. https://doi.org/10.3390/ECWS-3-05802
Chicago/Turabian StyleSaha, Arnab, Manti Patil, Vikas Chandra Goyal, and Devendra Singh Rathore. 2019. "Assessment and Impact of Soil Moisture Index in Agricultural Drought Estimation Using Remote Sensing and GIS Techniques" Proceedings 7, no. 1: 2. https://doi.org/10.3390/ECWS-3-05802