Estimating Groundwater Recharge in the Semiarid Al-Khazir Gomal Basin, North Iraq

Abstract
:1. Introduction
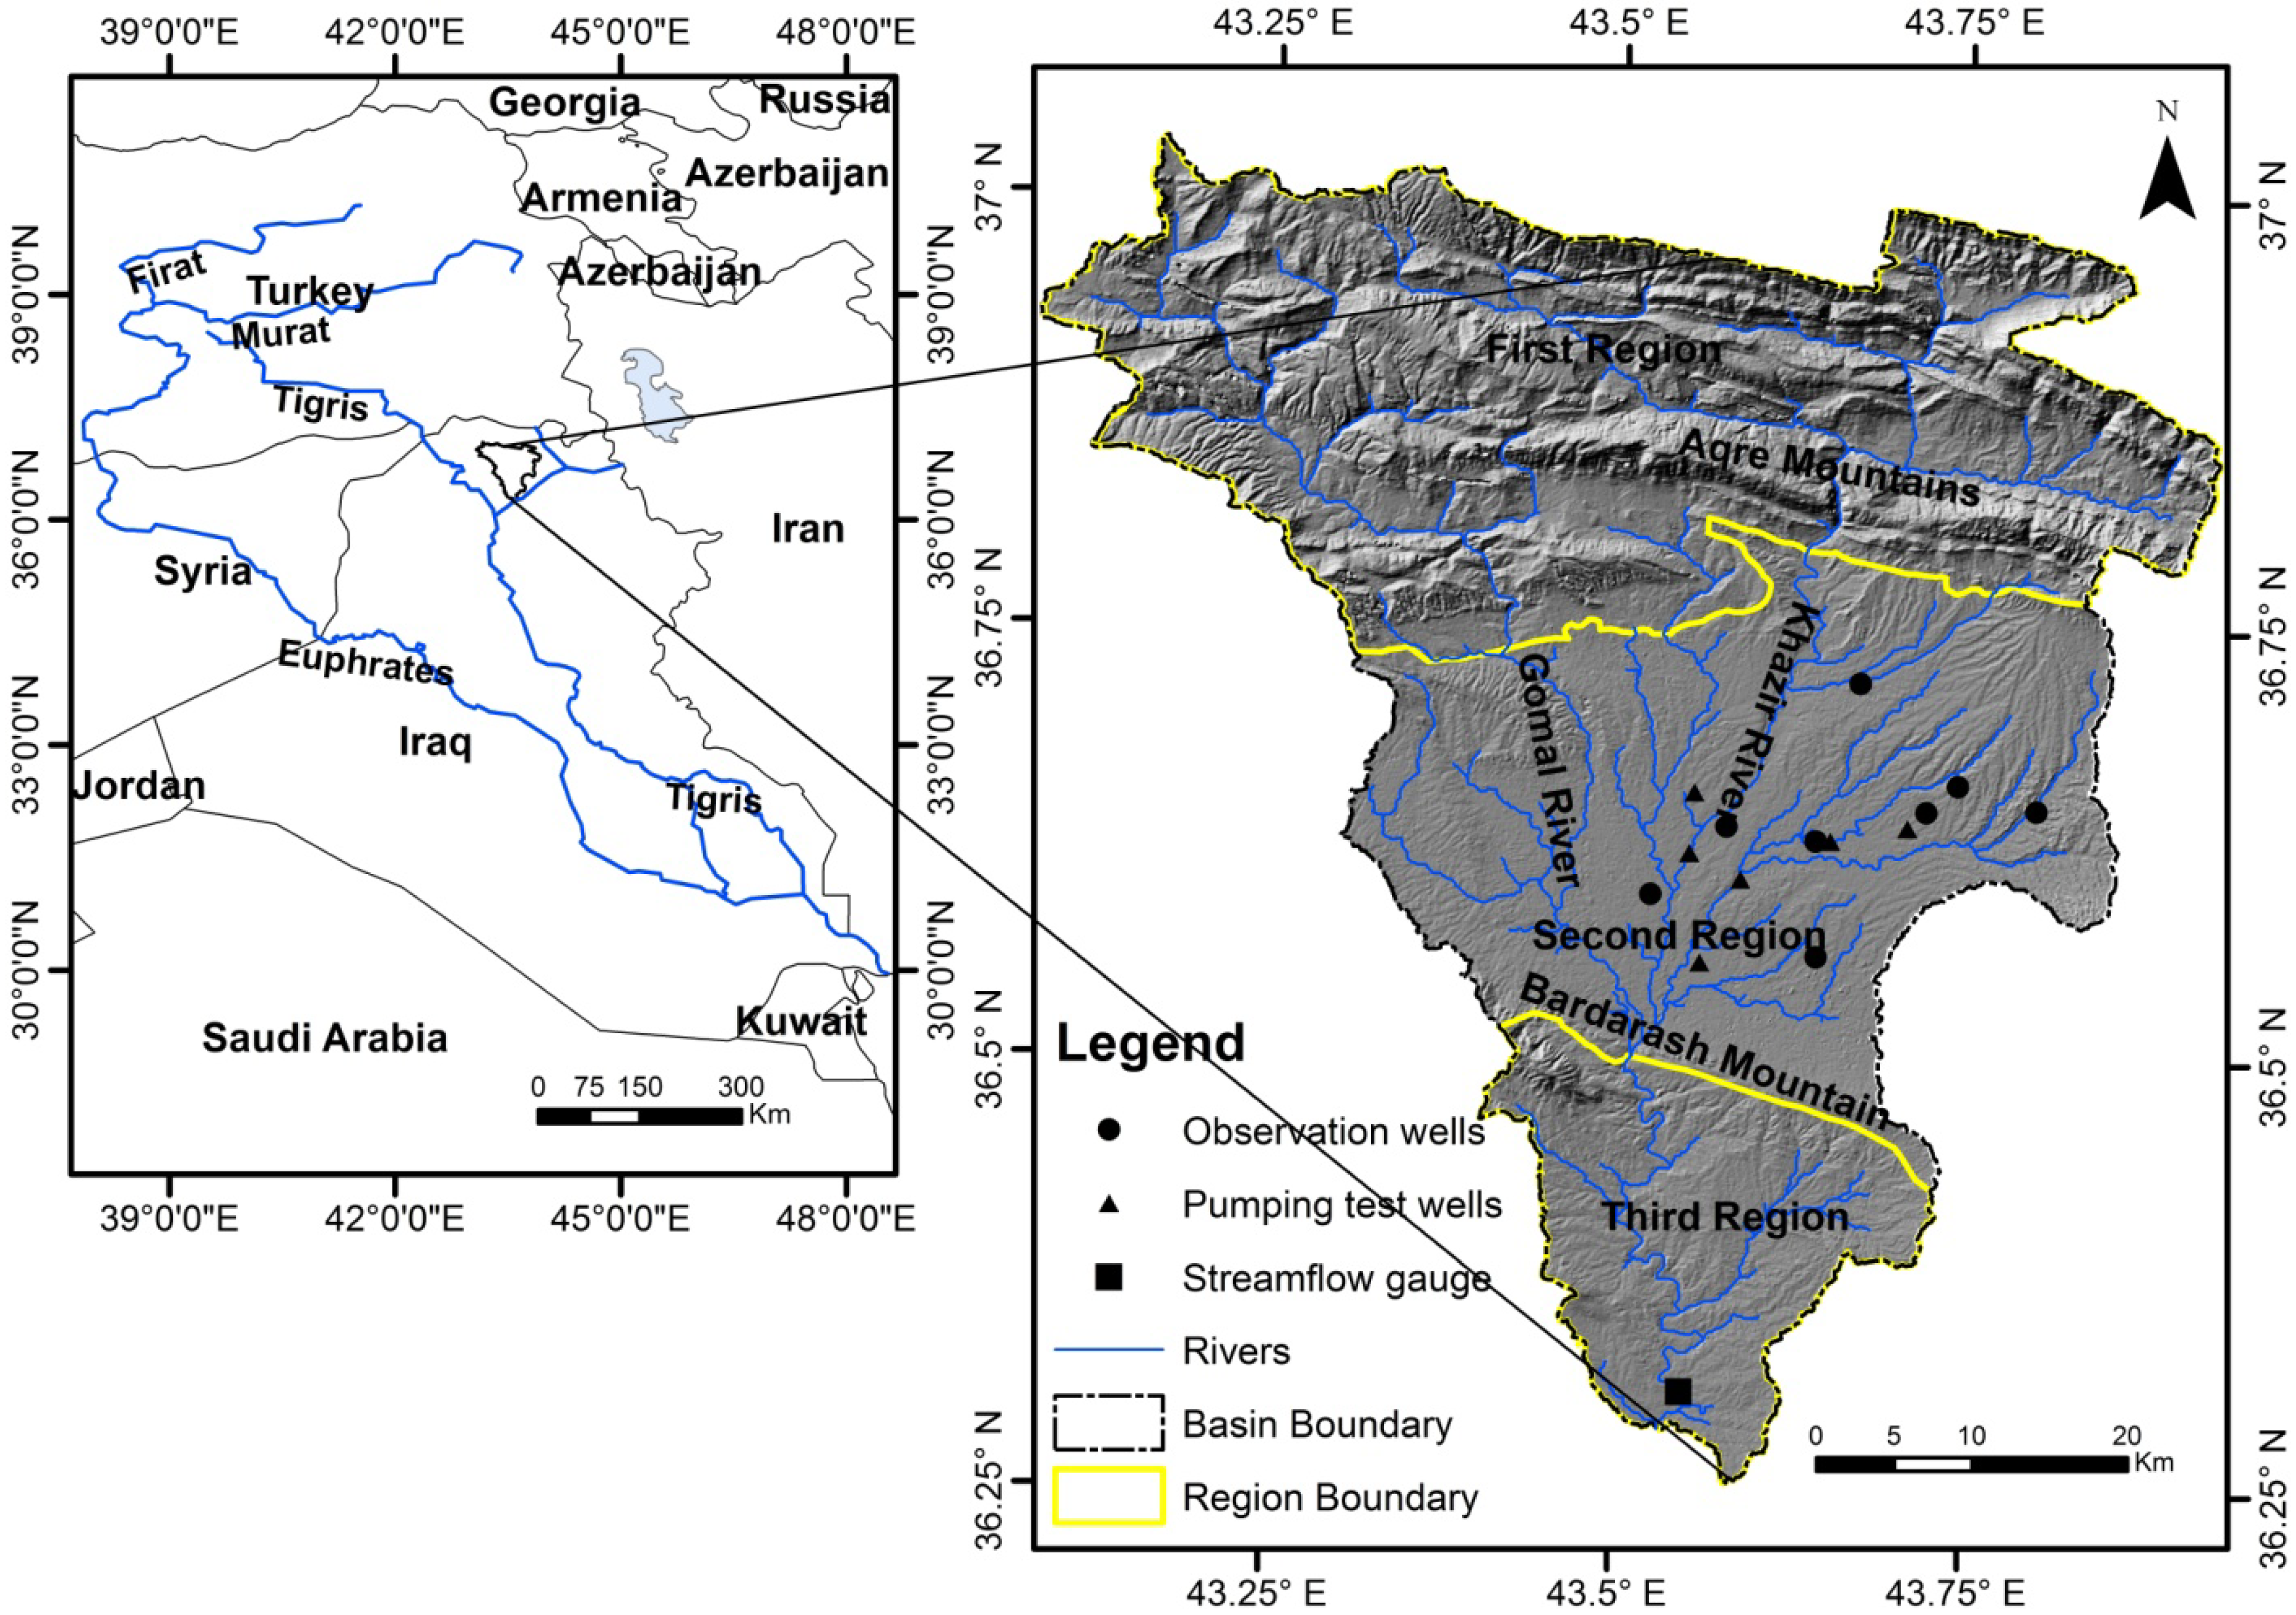
2. Study Area

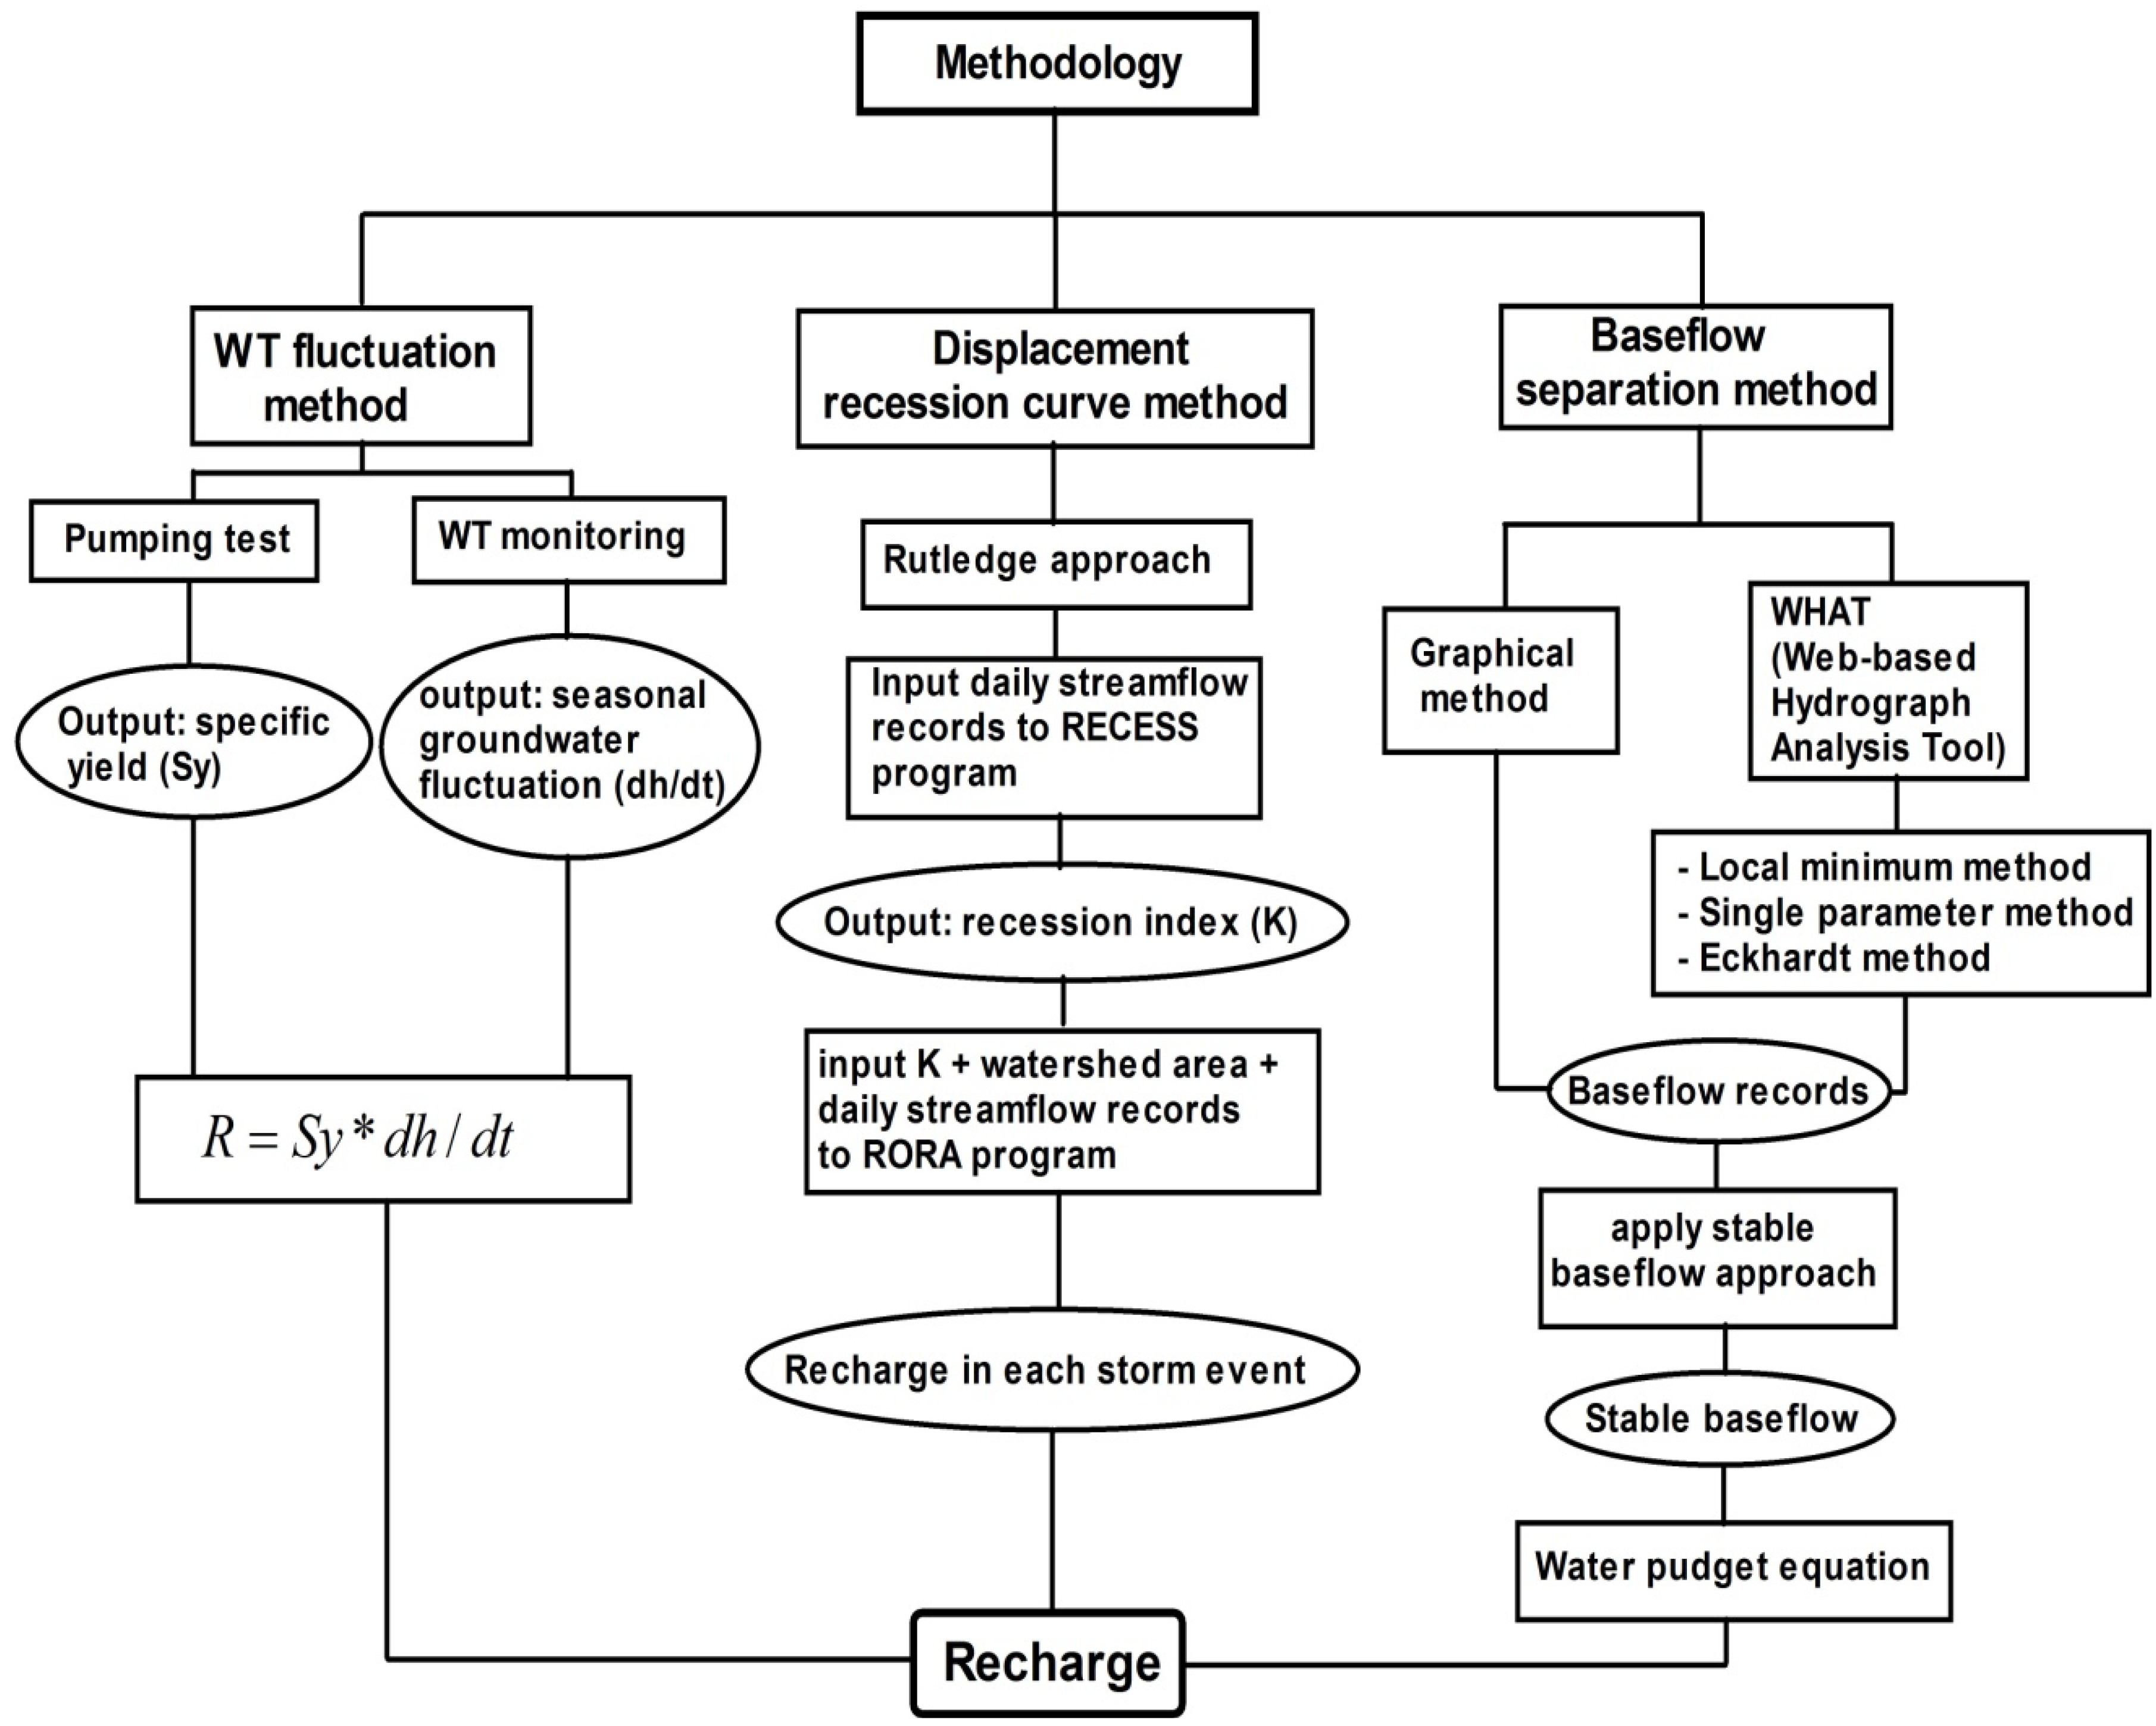
3. Methodology

3.1. Base-Flow SEPARATION
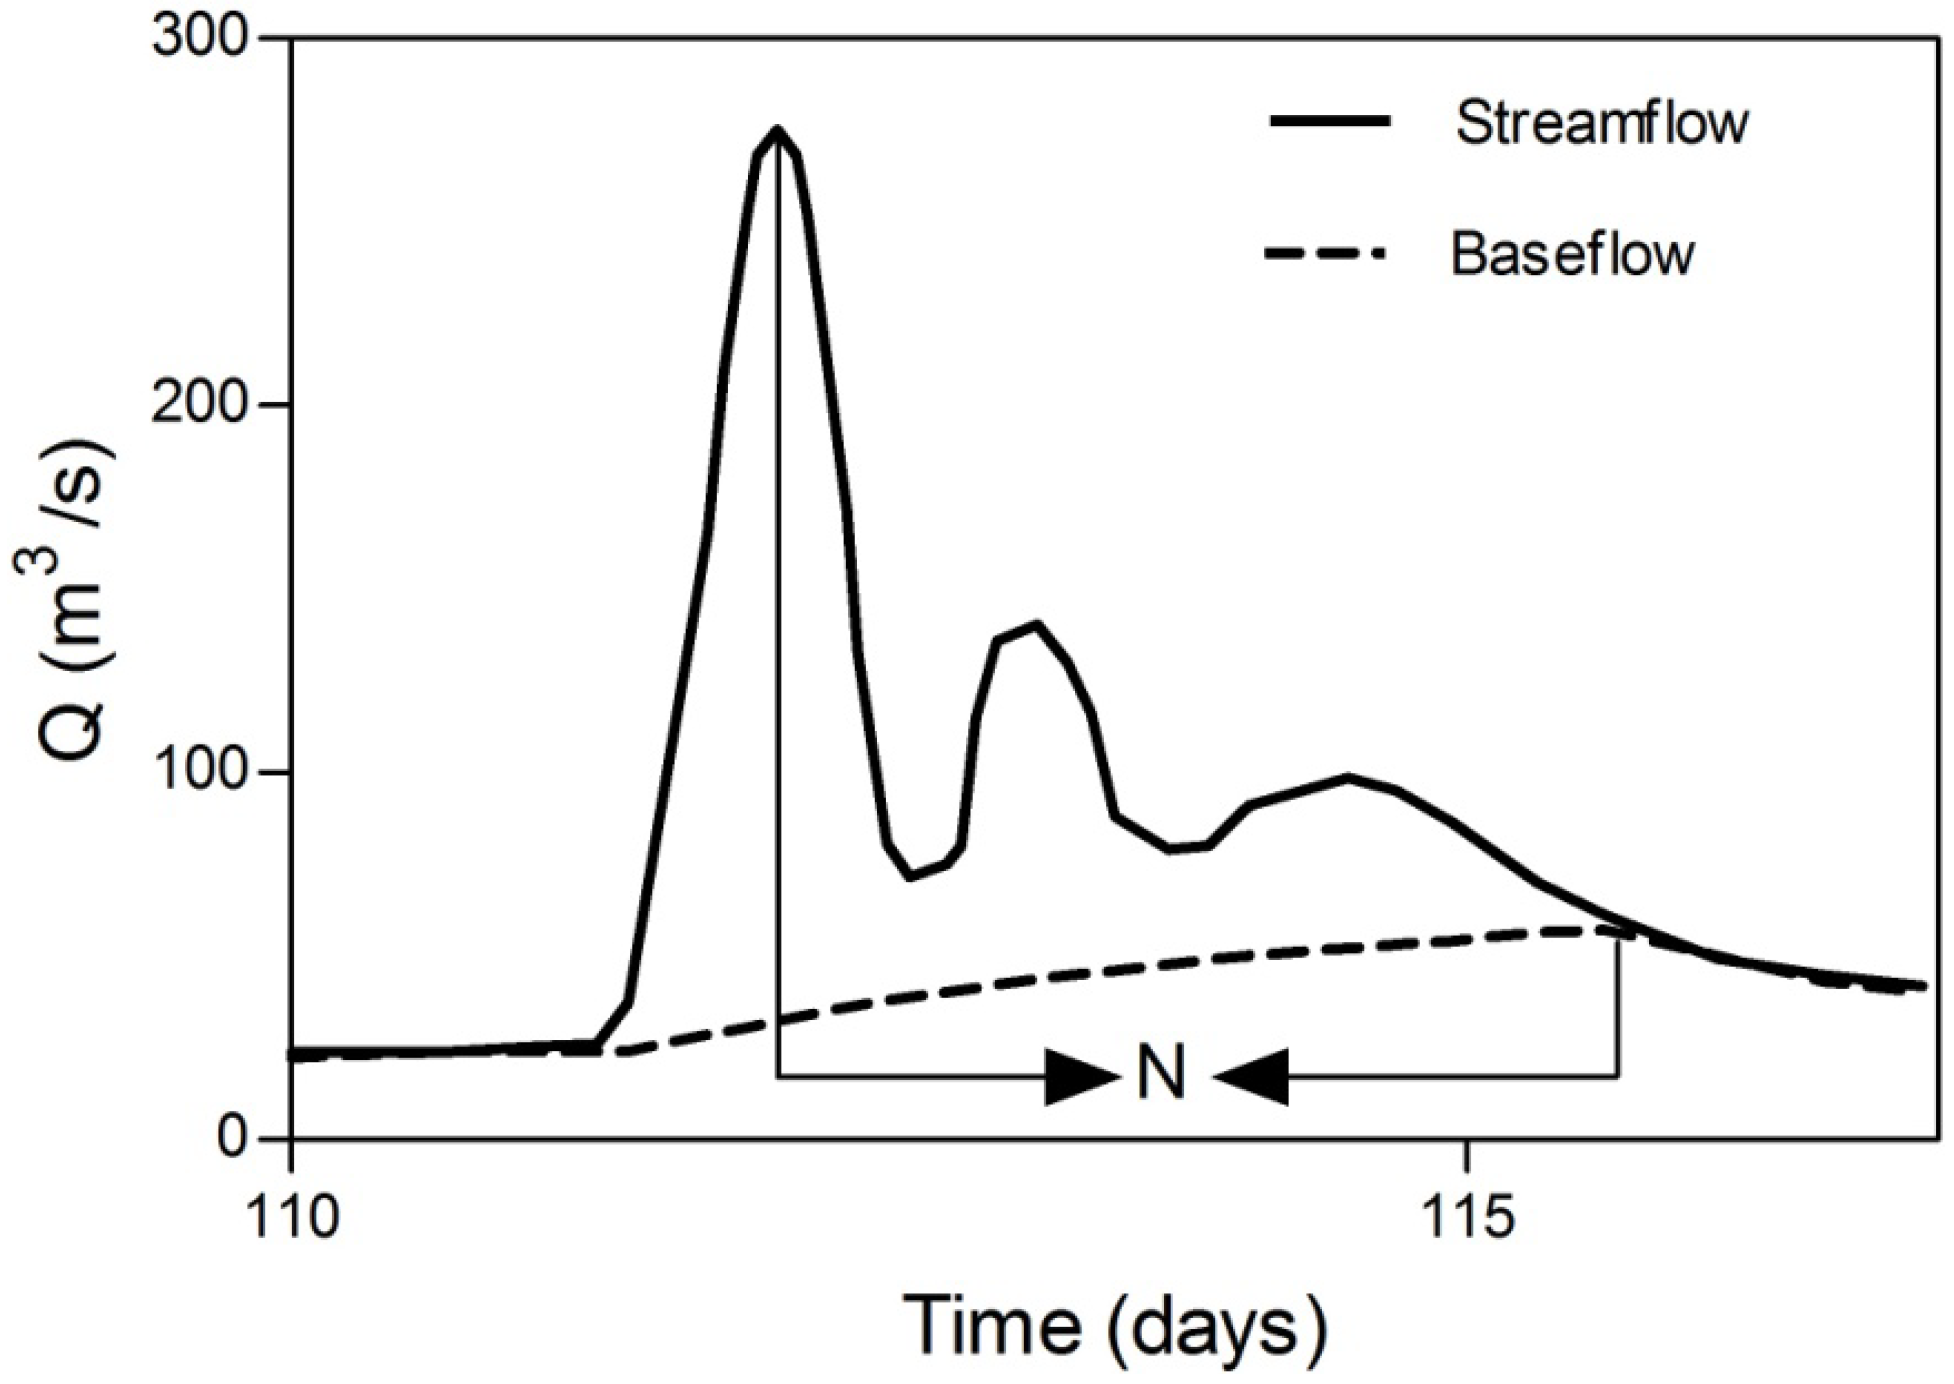
3.1.1. Graphical Method (Constant Slope Method)
- Identify the start of direct runoff;
- Estimate the duration of the direct runoff period N after the peak of the storm by the empirical relationship (N = A0.2) proposed by Linsley et al. [26], where N is the number of the days after the peak and A is the area of the watershed in square miles (Mi2) above the gauge station;
- Draw a line connecting the start of direct runoff to the end (inflection point after N days). This is the base-flow hydrograph (Figure 3).

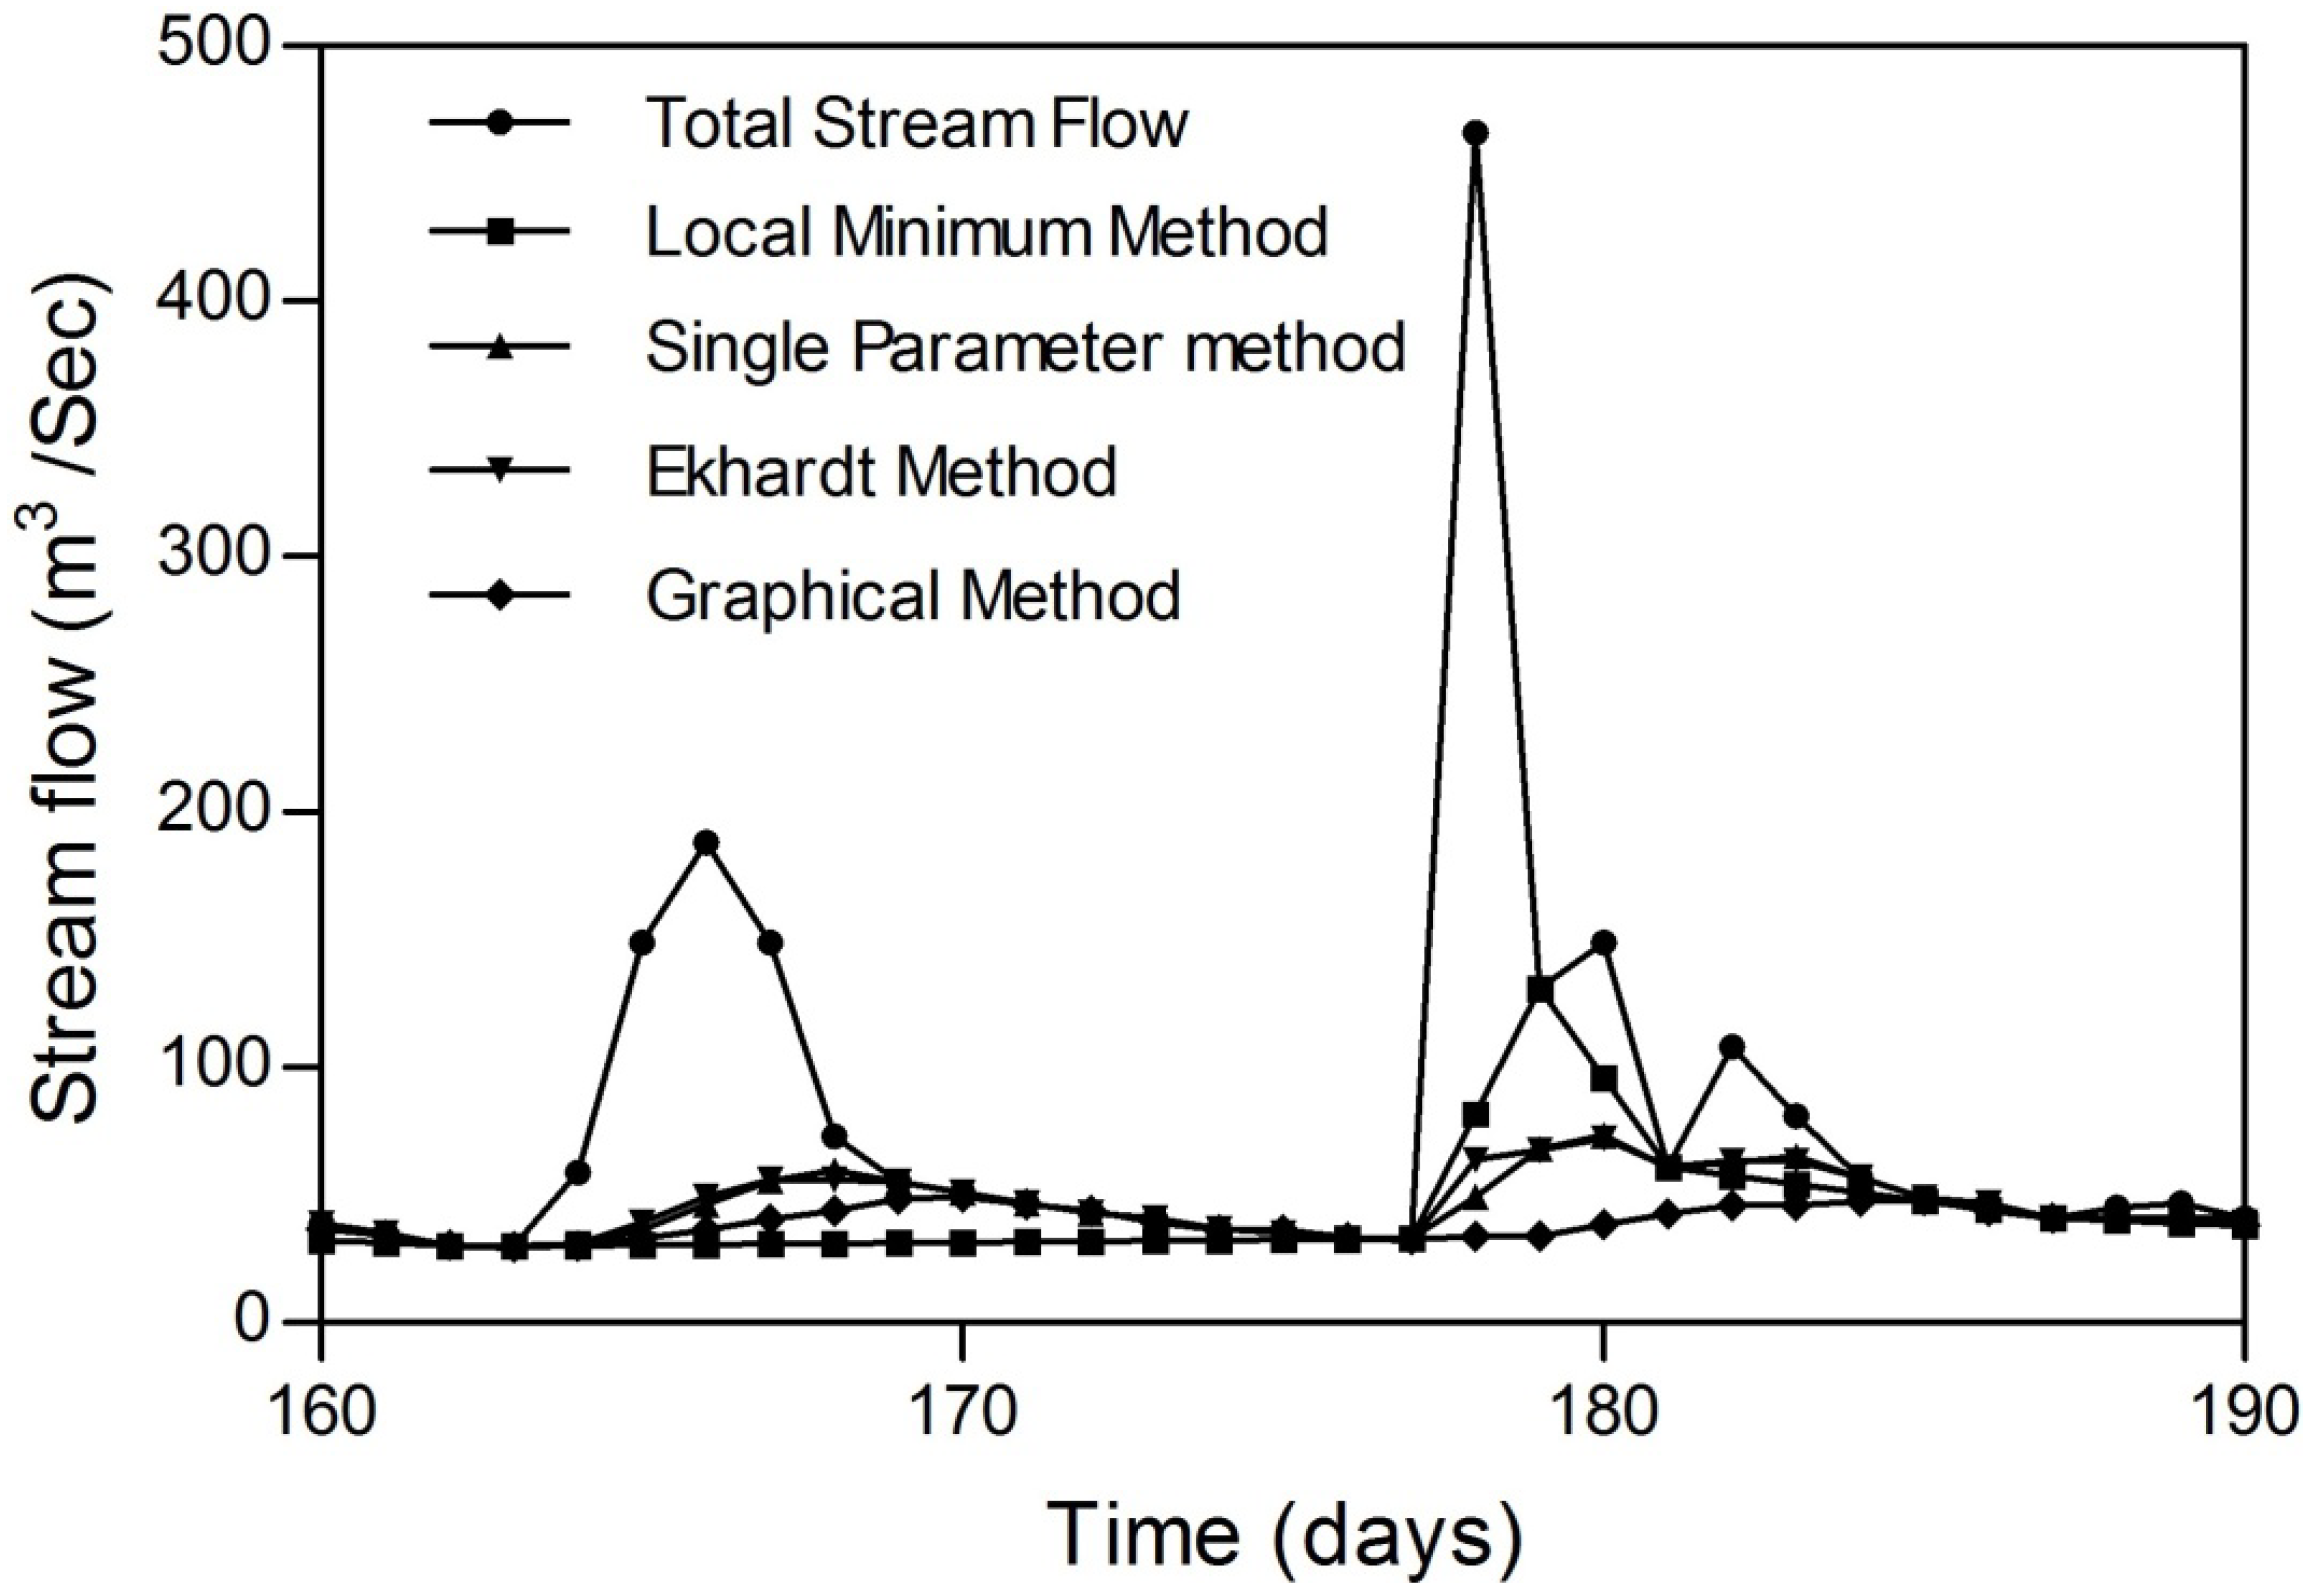
3.1.2. Automated Web GIS-Based Hydrograph Analysis Tool (WHAT)
- Eckhardt method: Eckhardt [14] proposed in Equation (3) two parameters in the digital filter base-flow, the base-flow filter parameter α (0.98) and BFImax (base-flow index (BFI); the maximum value of long-term ratio of base-flow to total stream-flow). To reduce the subjective influence of using BFImax, Eckhardt [14] proposed that BFImax in perennial and ephemeral streams with porous aquifers be 0.8 and 0.5, respectively, and 0.25 with a hard rock aquifer. In this study, a BFImax value of 0.8 was used.
- Local minimum method: The local minimum method begins by constructing a sequence of “local minima”. The procedure depends on determining the lowest discharge value in one half of the interval minus one day (0.5(2N − 1) days) before and after the day being considered and then connects the adjacent local minimum by an interpolated line [13].
- (1)
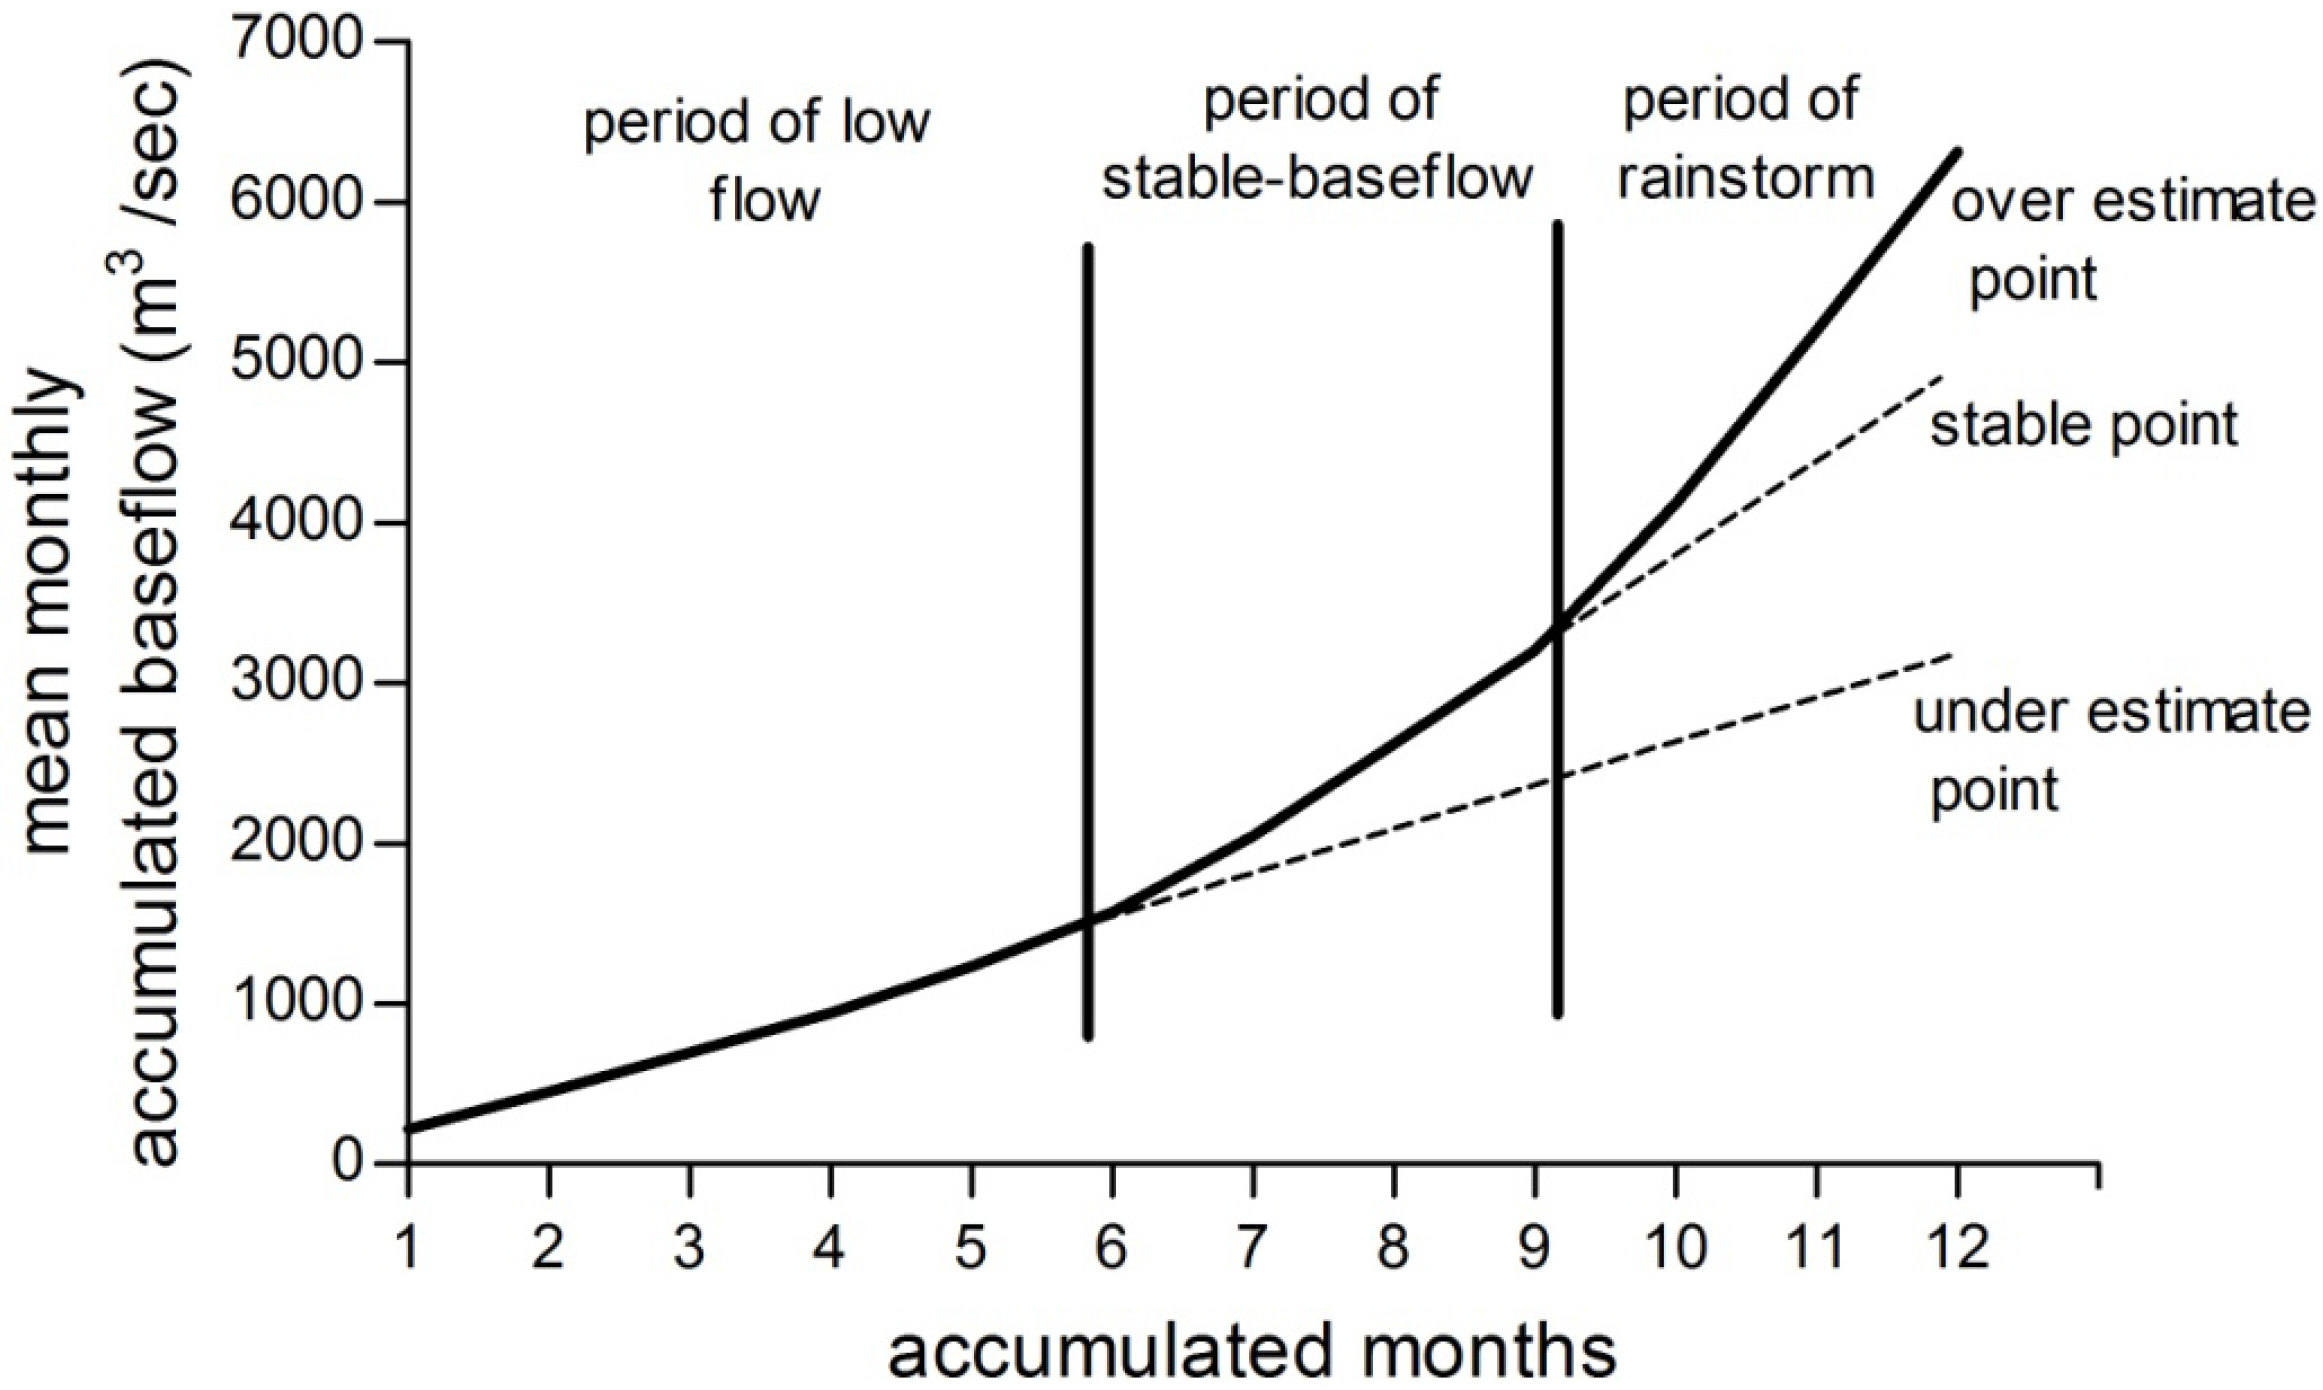
- Obtain monthly base-flow from the base-flow-record estimation;
- (2)
- Obtain long-term mean monthly base-flow. In our case, this was done for the period 1969 to 1981;
- (3)
- Perform data processing by sorting and accumulating the long-term mean monthly base-flow. In this way, a new series of long-term mean monthly accumulated base-flow values is obtained;
- (4)
- Choose the most stable (near-linear) segment and obtain the slope of the stable base-flow;
- (5)
- Use linear interpolation in the remaining months; finally, the mean annual base-flow is obtained.

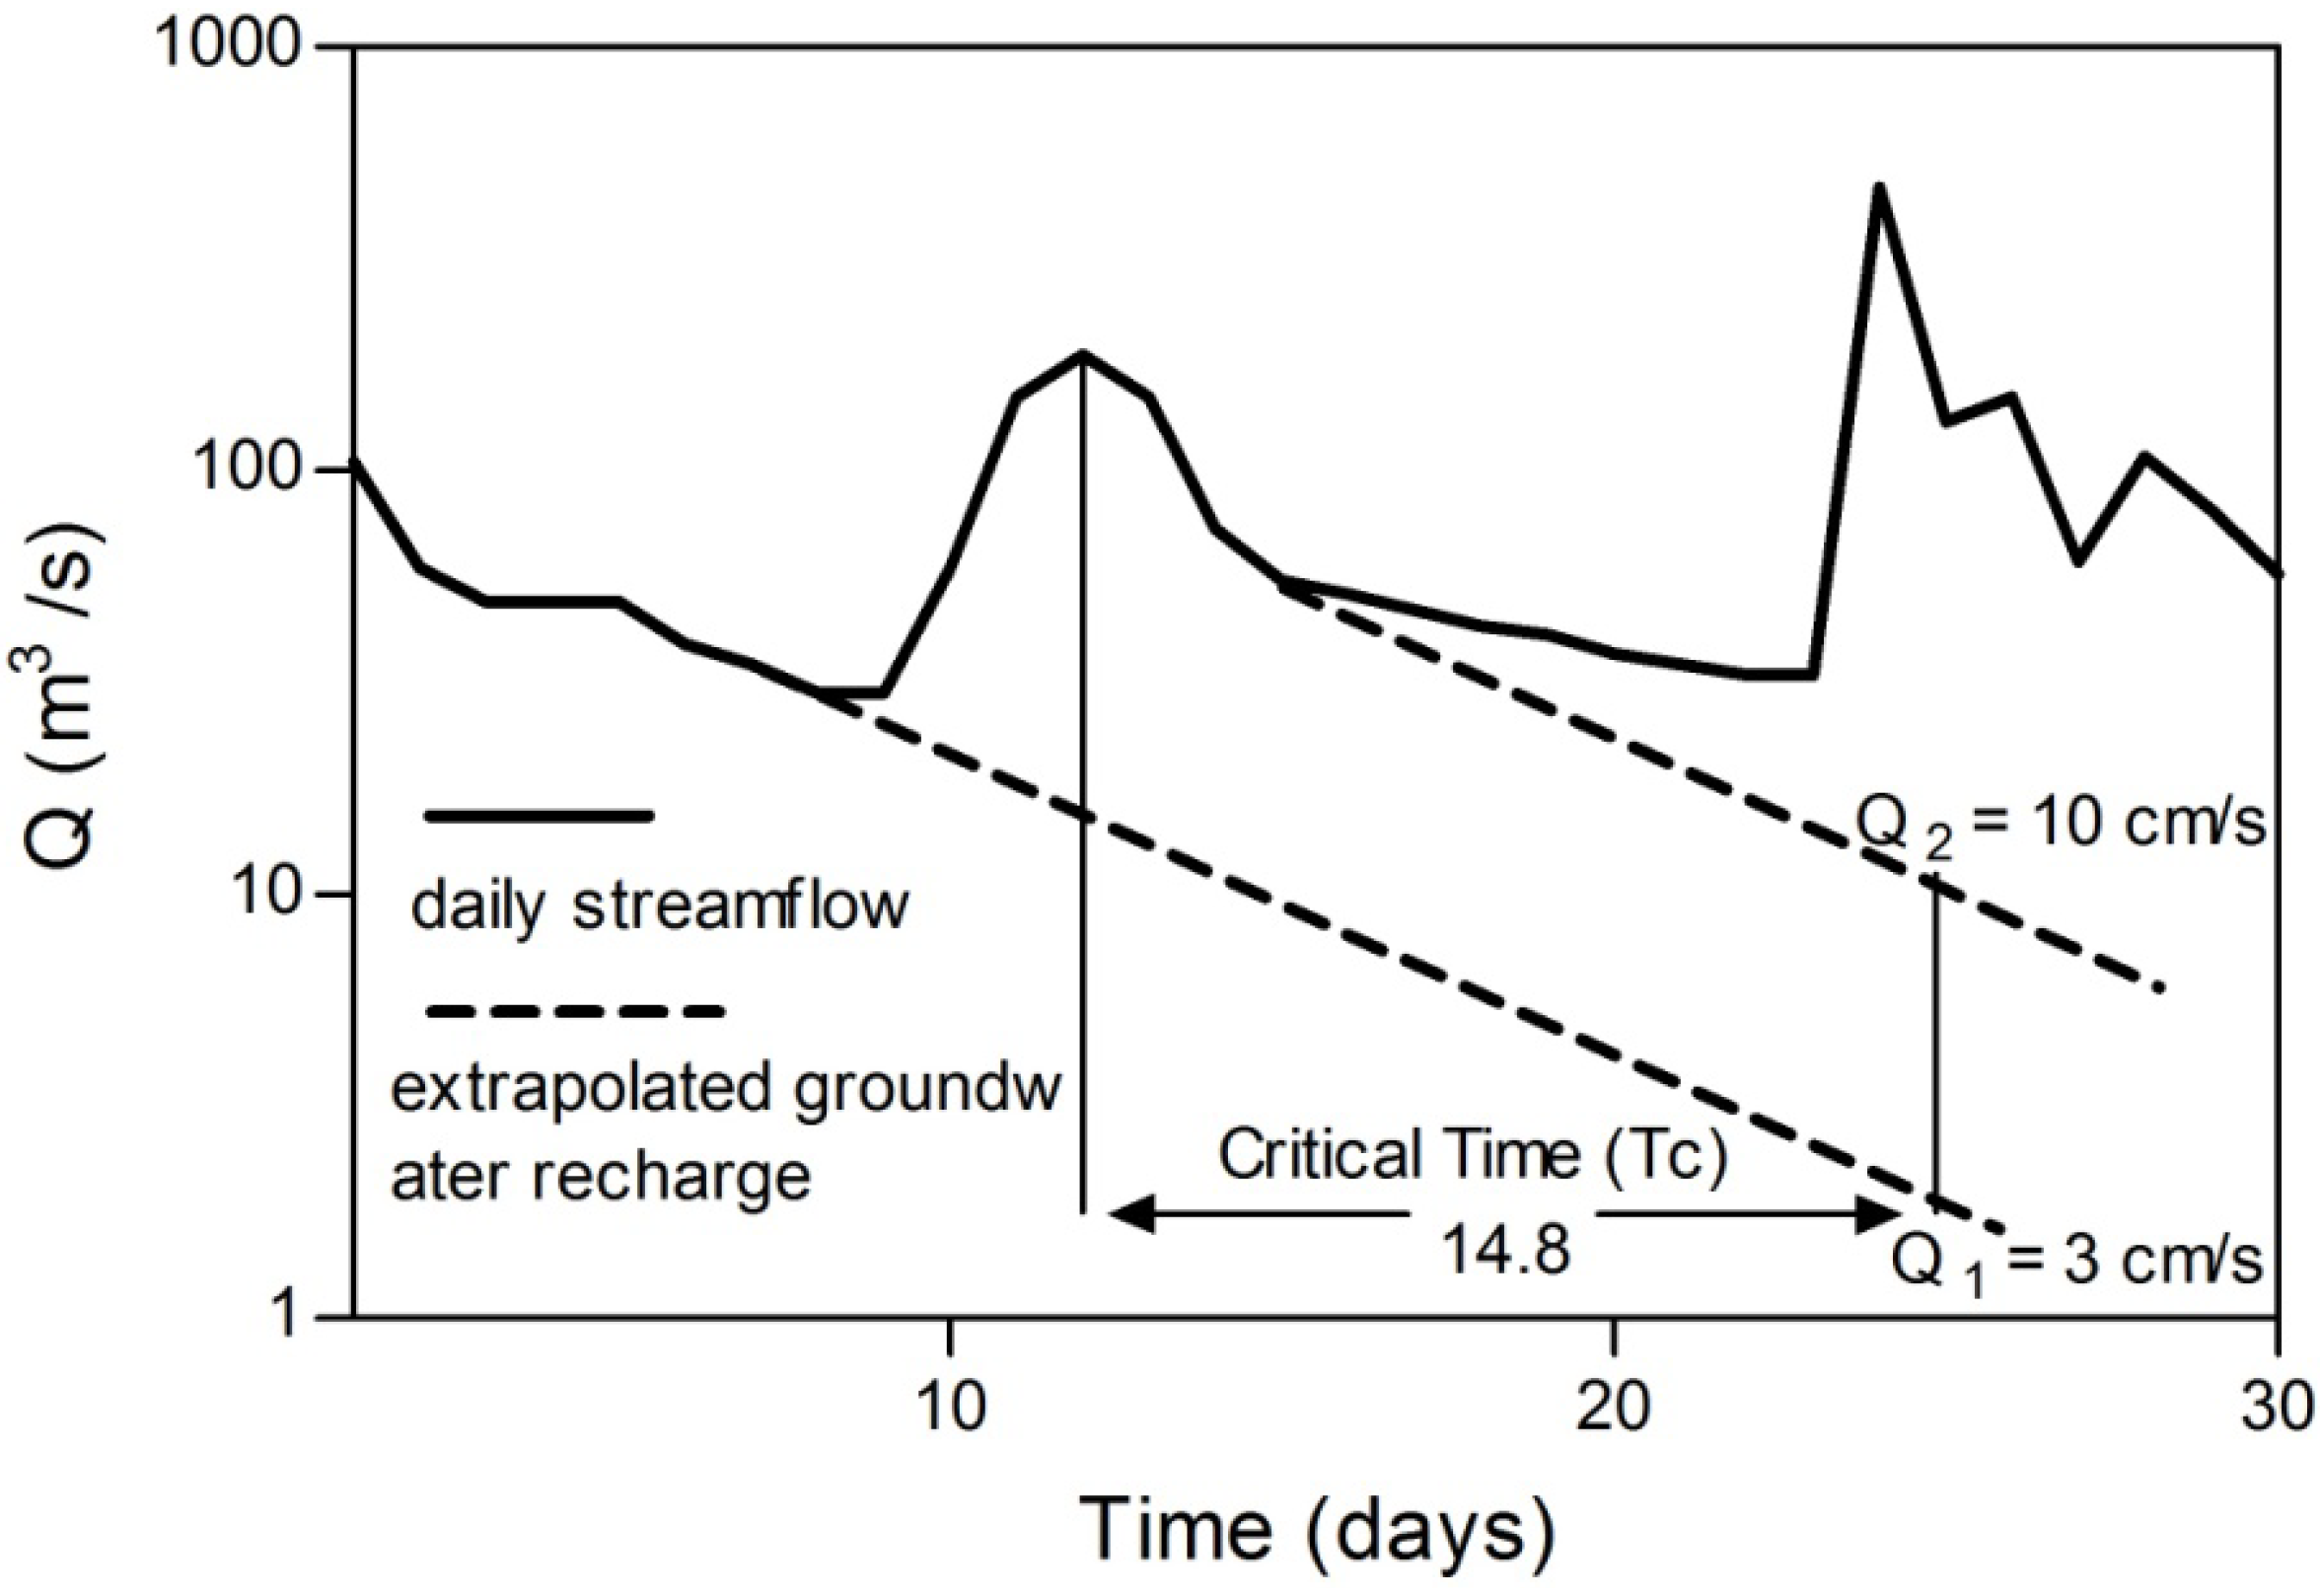
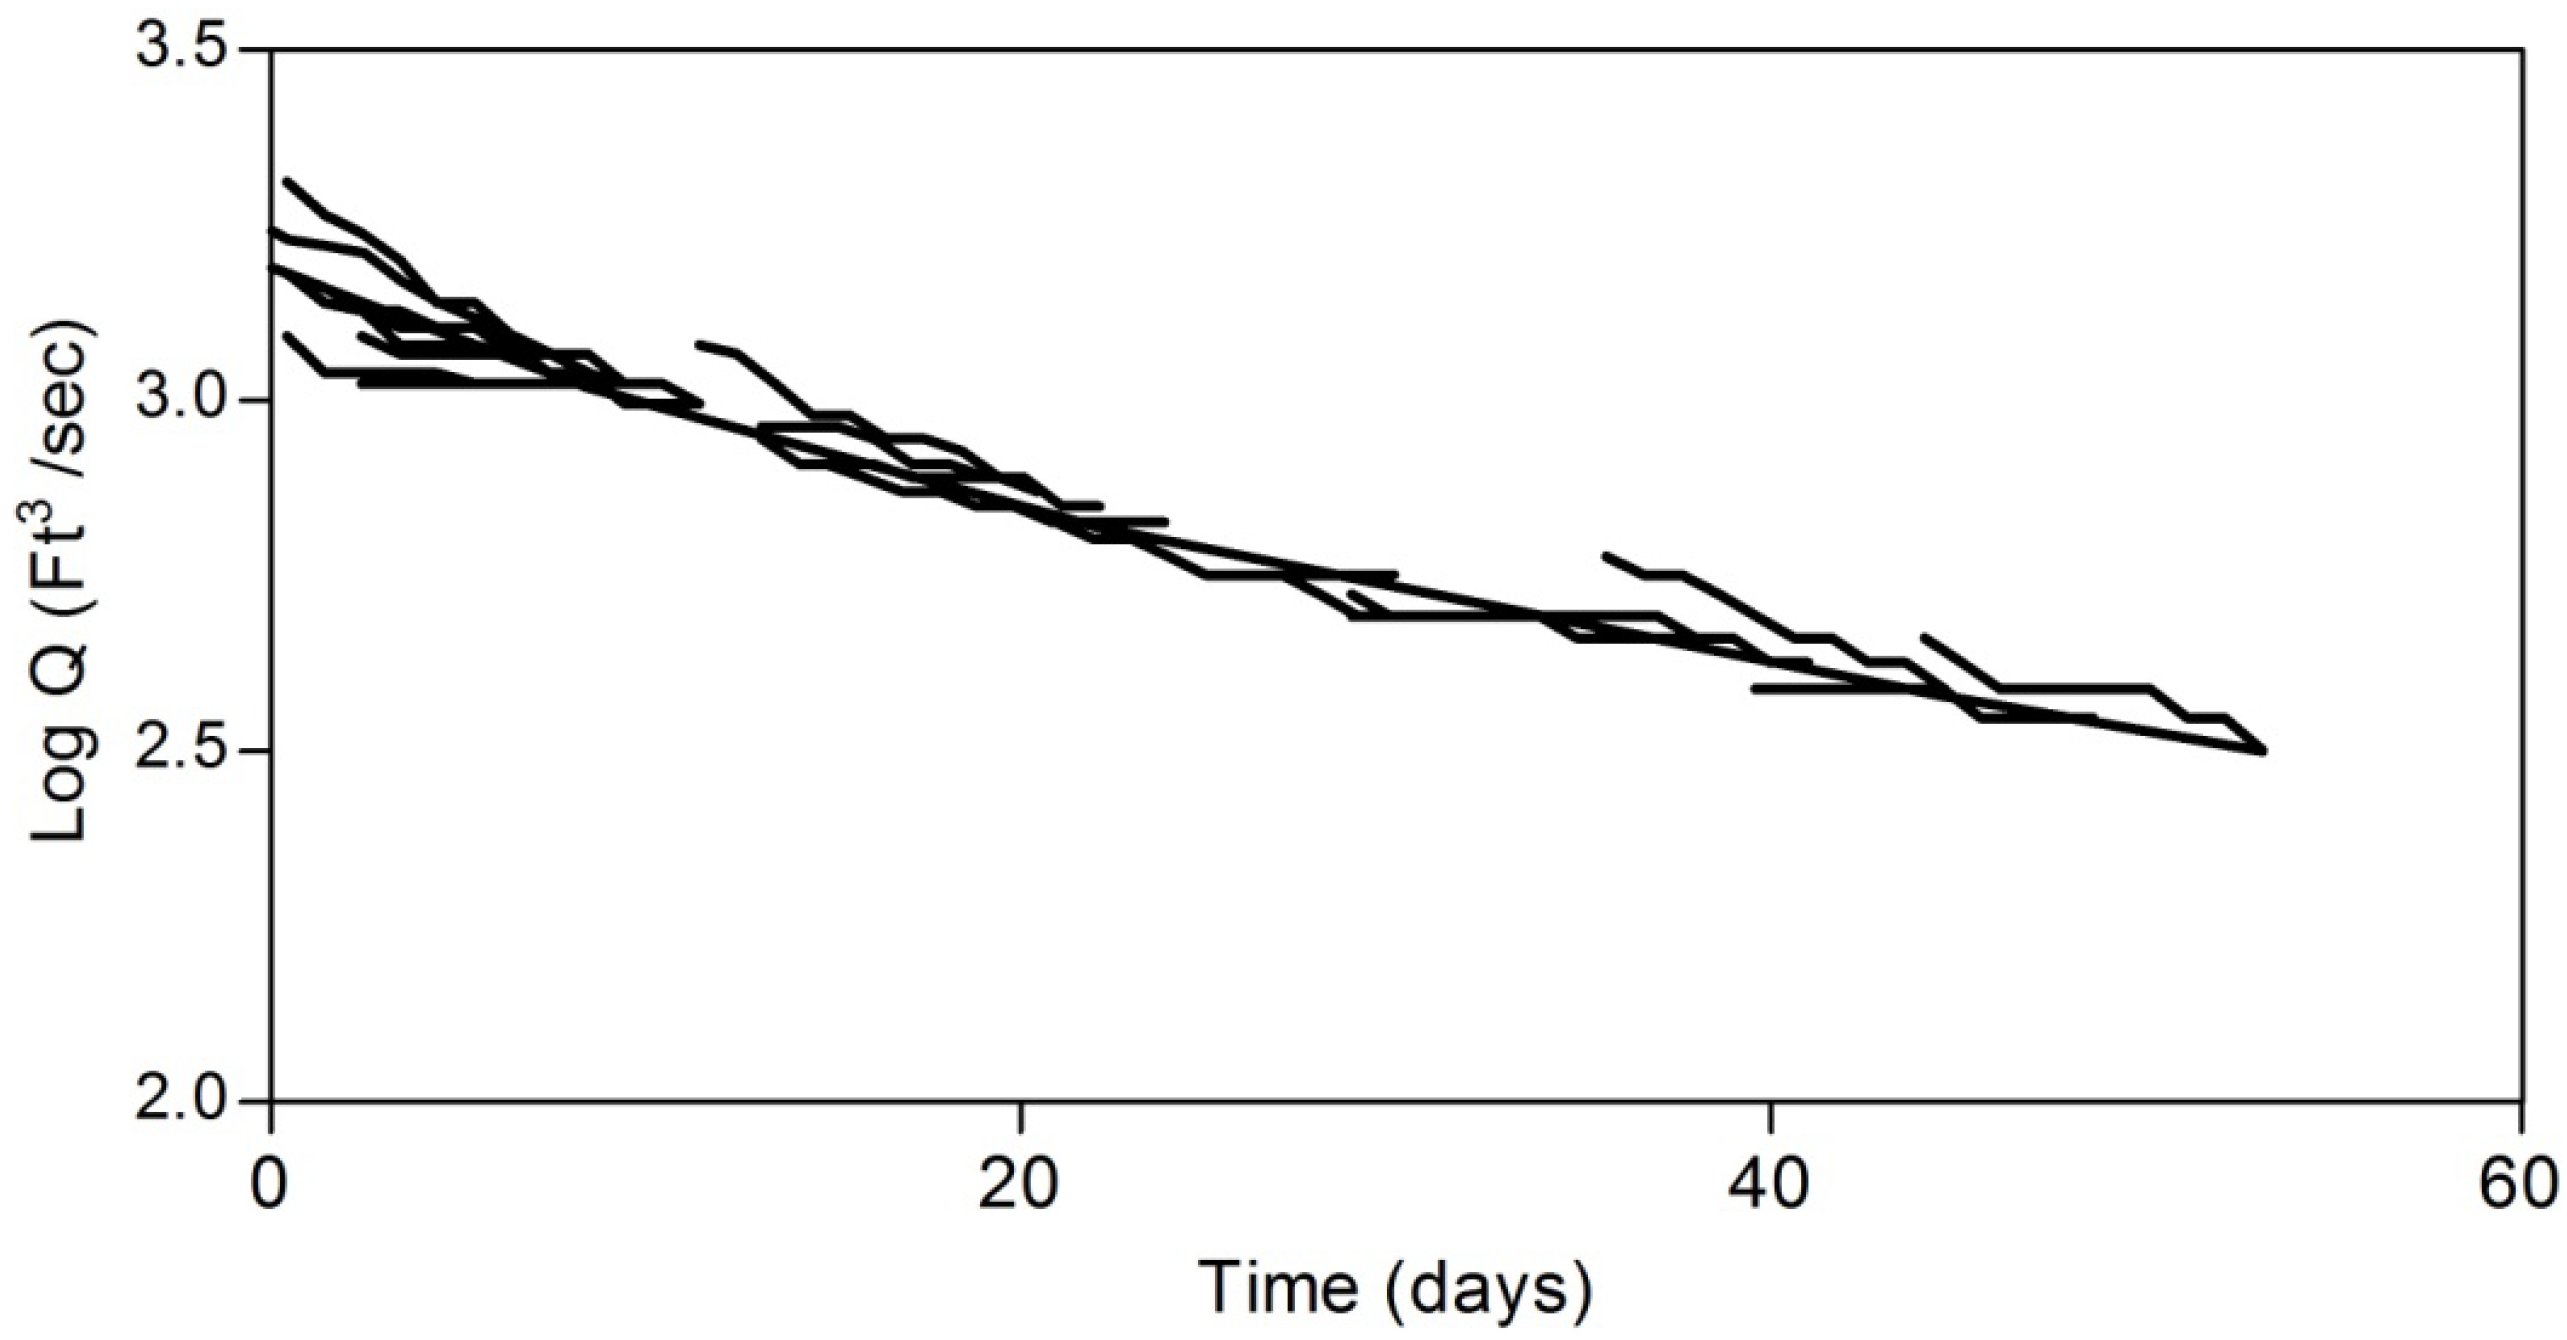
3.2. Displacement Recession Curve Method


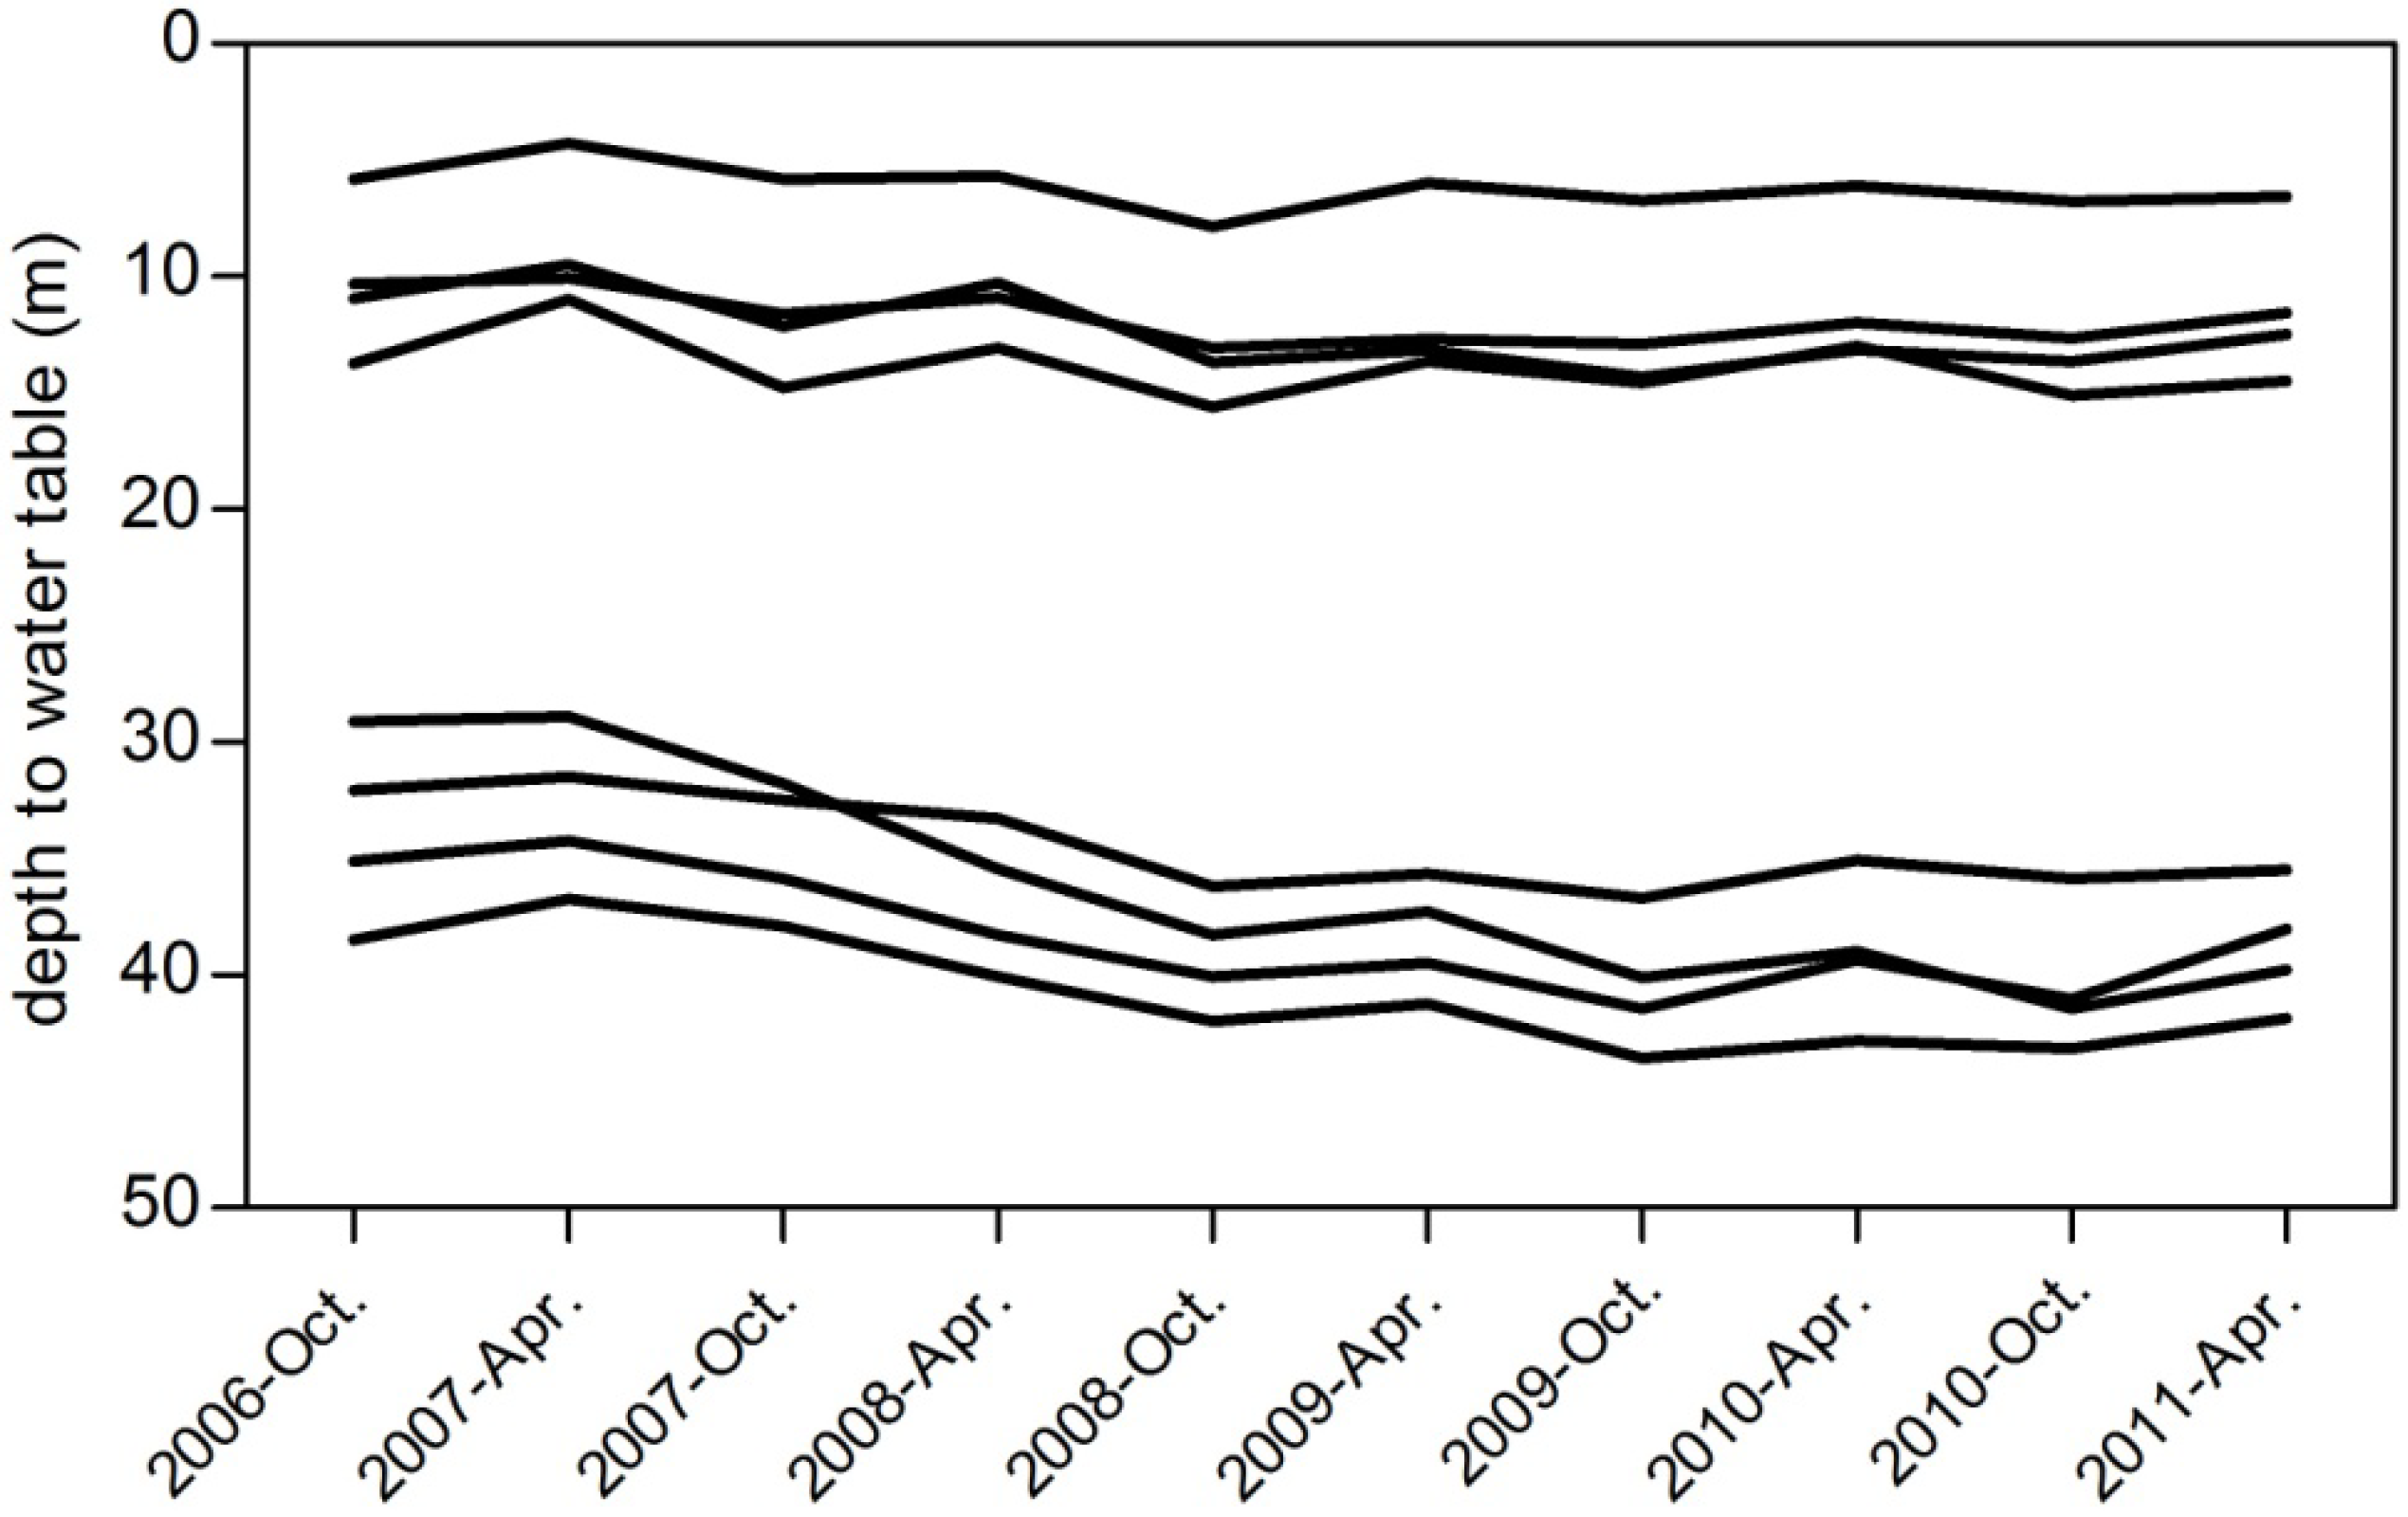
3.3. Water Table Fluctuation Method
4. Results and Discussion

| Method | Base-Flow Records (m3/y) | Base-Flow Indices (BFI) | Stable Base-flow records (m3/y) | Stable Base-Flow Indices (BFI) |
|---|---|---|---|---|
| Graphical method | 4.9 × 10⁸ | 0.68 | 3.8 × 10⁸ | 0.52 |
| Single parameter method | 5.51 × 10⁸ | 0.75 | 4.2 × 10⁸ | 0.56 |
| Eckhardt method | 5.1 × 10⁸ | 0.69 | 3.9 × 10⁸ | 0.52 |
| Local minimum method | 5.48 × 10⁸ | 0.75 | 4.2 × 10⁸ | 0.56 |


- Recharge estimated by the hydrograph analysis method represents an integrated long-term recharge over a large area in different mechanisms (diffuse recharge and focused recharge through river bed leakage). However, the main source of recharge calculated by water table (WT) fluctuation is diffuse recharge, and it is less affected by indirect recharge, especially in areas far away from the main river course;
- Base-flow may be overestimated by bank storage, which is considered as a short-term storage discharge, in addition to snow melt in the spring season;
- The probability of leakage from the confined system becomes higher downstream, because the difference in hydrostatic pressure increases with the decreasing of the unconfined aquifer thickness;
- Recharge obtained by the WT fluctuation method does not represent the entire watershed, because neither monitoring wells nor pumping test wells cover the entire watershed area.

5. Conclusions
Acknowledgments
Author Contributions
Conflicts of Interest
References
- Kinzelbach, W.; Aeschbach, W.; Alberich, C.; Goni, I.; Beyerle, U.; Brunner, P.; Chiang, W.-H.; Rueedi, J.; Zoellmann, K. A Survey of Methods for Groundwater Recharge in Arid and Semi-Arid Regions; Early Warning and Assessment Report Series; United Nations Environment Programme: Nairobi, Kenya, 2002. [Google Scholar]
- Risser, D.W.; Gburek, W.J.; Folmar, G.J. Comparison of Methods for Estimating Ground-Water Recharge and Base Flow at a Small Watershed Underlain by Fractured Bedrock in the Eastern United States. Geological Survey Scientific Investigations Report 2005-5038. Available online: http://pubs.usgs.gov/sir/2005/5038/pdf/sir2005-5038.pdf (accessed on 11 August 2014).
- Scanlon, B.R.; Healy, R.W.; Cook, P.G. Choosing appropriate techniques for quantifying groundwater recharge. Hydrogeol. J. 2002, 10, 18–39. [Google Scholar] [CrossRef]
- Eckhardt, K. A comparison of baseflow indices, which were calculated with seven different baseflow separation methods. J. Hydrol. 2008, 352, 168–173. [Google Scholar] [CrossRef]
- Risser, D.W.; Conger, R.W.; Ulrich, J.E.; Asmussen, M.P. Estimates of Ground Water Recharge Based on Stream-Flow-Hydrograph Methods: Pennsylvania; U.S. Geological Survey: Reston, VA, USA, 2005. [Google Scholar]
- Combalicer, E.A.; Lee, S.H.; Ahn, S.; Kim, D.Y.; Im, S. Comparing groundwater recharge and base flow in the Bukmoongol small-forested watershed, Korea. J. Earth Syst. Sci. 2008, 117, 553–566. [Google Scholar] [CrossRef]
- Moore, G. Hydrograph analysis in a fractured rock terrane. Ground Water 1992, 30, 390–395. [Google Scholar] [CrossRef]
- Zhang, R.; Li, Q.; Chow, T.L.; Li, S.; Danielescu, S. Base-flow separation in a small watershed in New Brunswick, Canada, using a recursive digital filter calibrated with the conductivity mass balance method. Hydrol. Processes 2013, 27, 2659–2665. [Google Scholar] [CrossRef]
- Smakhtin, V.U. Low flow hydrology: A review. J. Hydrol. 2001, 240, 147–186. [Google Scholar] [CrossRef]
- Rutledge, A.T. Computer Programs for Describing the Recession of Ground-Water Discharge and for Estimating Mean Ground-Water Recharge and Discharge from Stream-flow Records—Update; U.S. Geological Survey: Reston, VA, USA, 1993. [Google Scholar]
- Rutledge, A.T. Model-Estimated Ground-Water Recharge and Hydrograph of Ground-Water Discharge to a Stream; U.S. Geological Survey: Reston, VA, USA, 1997. [Google Scholar]
- Arnold, J.G.; Allen, P.M.; Muttiah, R.; Bernhardt, G. Automated Base Flow Separation and Recession Analysis Techniques. Ground Water 1995, 33, 1010–1018. [Google Scholar] [CrossRef]
- Sloto, R.A.; Crouse, M.Y. HYSEP: A Computer Program for Stream Flow Hydrograph Separation and Analysis; U.S. Geological Survey: Reston, VA, USA, 1996. [Google Scholar]
- Eckhardt, K. How to construct recursive digital filters for base-flow separation. Hydrol. Processes 2005, 19, 507–515. [Google Scholar] [CrossRef]
- Rorabaugh, M. Estimating changes in bank storsage and ground-water contribution to stream-flow. Int. Assoc. Sci. Hydrol. 1964, 63, 432–441. [Google Scholar]
- Wittenberg, H. Base-flow recession and recharge as nonlinear storage processes. Hydrol. Processes 1999, 13, 715–726. [Google Scholar] [CrossRef]
- Szilagyi, J.; Harvey, F.E.; Ayers, J.F. Regional estimation of base recharge to ground water using water balance and a base-flow index. Ground Water 2003, 42, 504–513. [Google Scholar] [CrossRef]
- Lee, C.H.; Chen, W.P.; Lee, R.H. Estimation of groundwater recharge using water balance coupled with base-flow-record estimation and stable-base-flow analysis. Environ. Geol. 2006, 51, 73–82. [Google Scholar] [CrossRef]
- Rutledge, A.T. Program User Guide for RORA; U.S. Geological Survey: Reston, VA, USA, 2007. [Google Scholar]
- Rutledge, A.T. Considerations for Use of the RORA Program to Estimate Ground-Water Recharge from Stream-Flow Records; U.S. Geological Survey: Reston, VA, USA, 2000. [Google Scholar]
- United Nations Environment Programme (UNEP). World Atlas of Desertification; UNEP: London, UK, 1992. [Google Scholar]
- Chen, W.P.; Lee, C.H. Estimating ground-water recharge from stream-flow records. Environ. Geol. 2003, 44, 257–265. [Google Scholar] [CrossRef]
- Halford, K.J.; Mayer, G.C. Problems Associated with Estimating Ground Water Discharge and Recharge from Stream Discharge Records. Ground Water 1999, 38, 331–342. [Google Scholar] [CrossRef]
- Director General of Irrigation. Discharges for Selected Gauging Stations in Iraq 1959–1975. Unpublished report. Baghdad, Iraq, 1976. [Google Scholar]
- Al-Sam, S.; Hanna, F. Evaluation of Groundwater Resources in Al-Khazir Gomal Basin. Report No. 1270. Unpublished report. GEOSURV: Baghdad, Iraq, 1981. [Google Scholar]
- Linsley, R.K.; Kohler, M.A.; Paulhus, J. Hydrology for Engineer, 3rd ed.; McGraw-Hill: New York, NY, USA, 1982. [Google Scholar]
- Mehta, T. Chart Image to Data. Available online: http://www.tushar-mehta.com/excel/software/chart_image_to_data/ (accessed on 5 August 2013).
- Lim, K.J.; Engel, B.A. WHAT: Web-Based Hydrograph Analysis Tool. Available online: http://pasture.ecn.purdue.edu/~what (accessed on 25 March 2013).
- Lyne, V.D.; Hollick, M. Stochastic Time-Variable Rainfall- Runoff Modeling. In Proceedings of the Hydrology and Water Resources, Symposium Institution of Engineers Australia, Perth, Australia, 1979.
- Arnold, J.G.; Allen, P.M. Automated Methods for Estimating Baseflow and Ground Water Recharge from Streamflow Records. JAWRA J. Am. Water Resour. Assoc. 1999, 35, 411–424. [Google Scholar]
- Schicht, R.; Walton, W. Hydrologic Budgets for Three Small Watersheds in Illinois; Illinois State Water Survey: Champaign, IL, USA, 1961. [Google Scholar]
- Rutledge, A.T. The appropriate use of the Rorabaugh model to estimate ground water recharge. Ground Water 2005, 43, 292–293. [Google Scholar] [CrossRef] [PubMed]
- Healy, R.; Cook, P. Using groundwater levels to estimate recharge. Hydrogeol. J. 2002, 10, 91–109. [Google Scholar] [CrossRef]
- Lim, K.J.; Engel, B.A.; Tang, Z.; Choi, J.; Kim, K.-S.; Muthukrishnan, S.; Tripathy, D. Automated WEB GIS Based Hydrograph Analysis Tool, WHAT1. JAWRA J. Am. Water Resour. Assoc. 2005, 41, 1407–1416. [Google Scholar] [CrossRef]
© 2014 by the authors; licensee MDPI, Basel, Switzerland. This article is an open access article distributed under the terms and conditions of the Creative Commons Attribution license (http://creativecommons.org/licenses/by/3.0/).
Share and Cite
Jassas, H.; Merkel, B. Estimating Groundwater Recharge in the Semiarid Al-Khazir Gomal Basin, North Iraq. Water 2014, 6, 2467-2481. https://doi.org/10.3390/w6082467
Jassas H, Merkel B. Estimating Groundwater Recharge in the Semiarid Al-Khazir Gomal Basin, North Iraq. Water. 2014; 6(8):2467-2481. https://doi.org/10.3390/w6082467
Chicago/Turabian StyleJassas, Hussein, and Broder Merkel. 2014. "Estimating Groundwater Recharge in the Semiarid Al-Khazir Gomal Basin, North Iraq" Water 6, no. 8: 2467-2481. https://doi.org/10.3390/w6082467