Rubella Virus Strain-Associated Differences in the Induction of Oxidative Stress Are Independent of Their Interferon Activation

 , and
, and 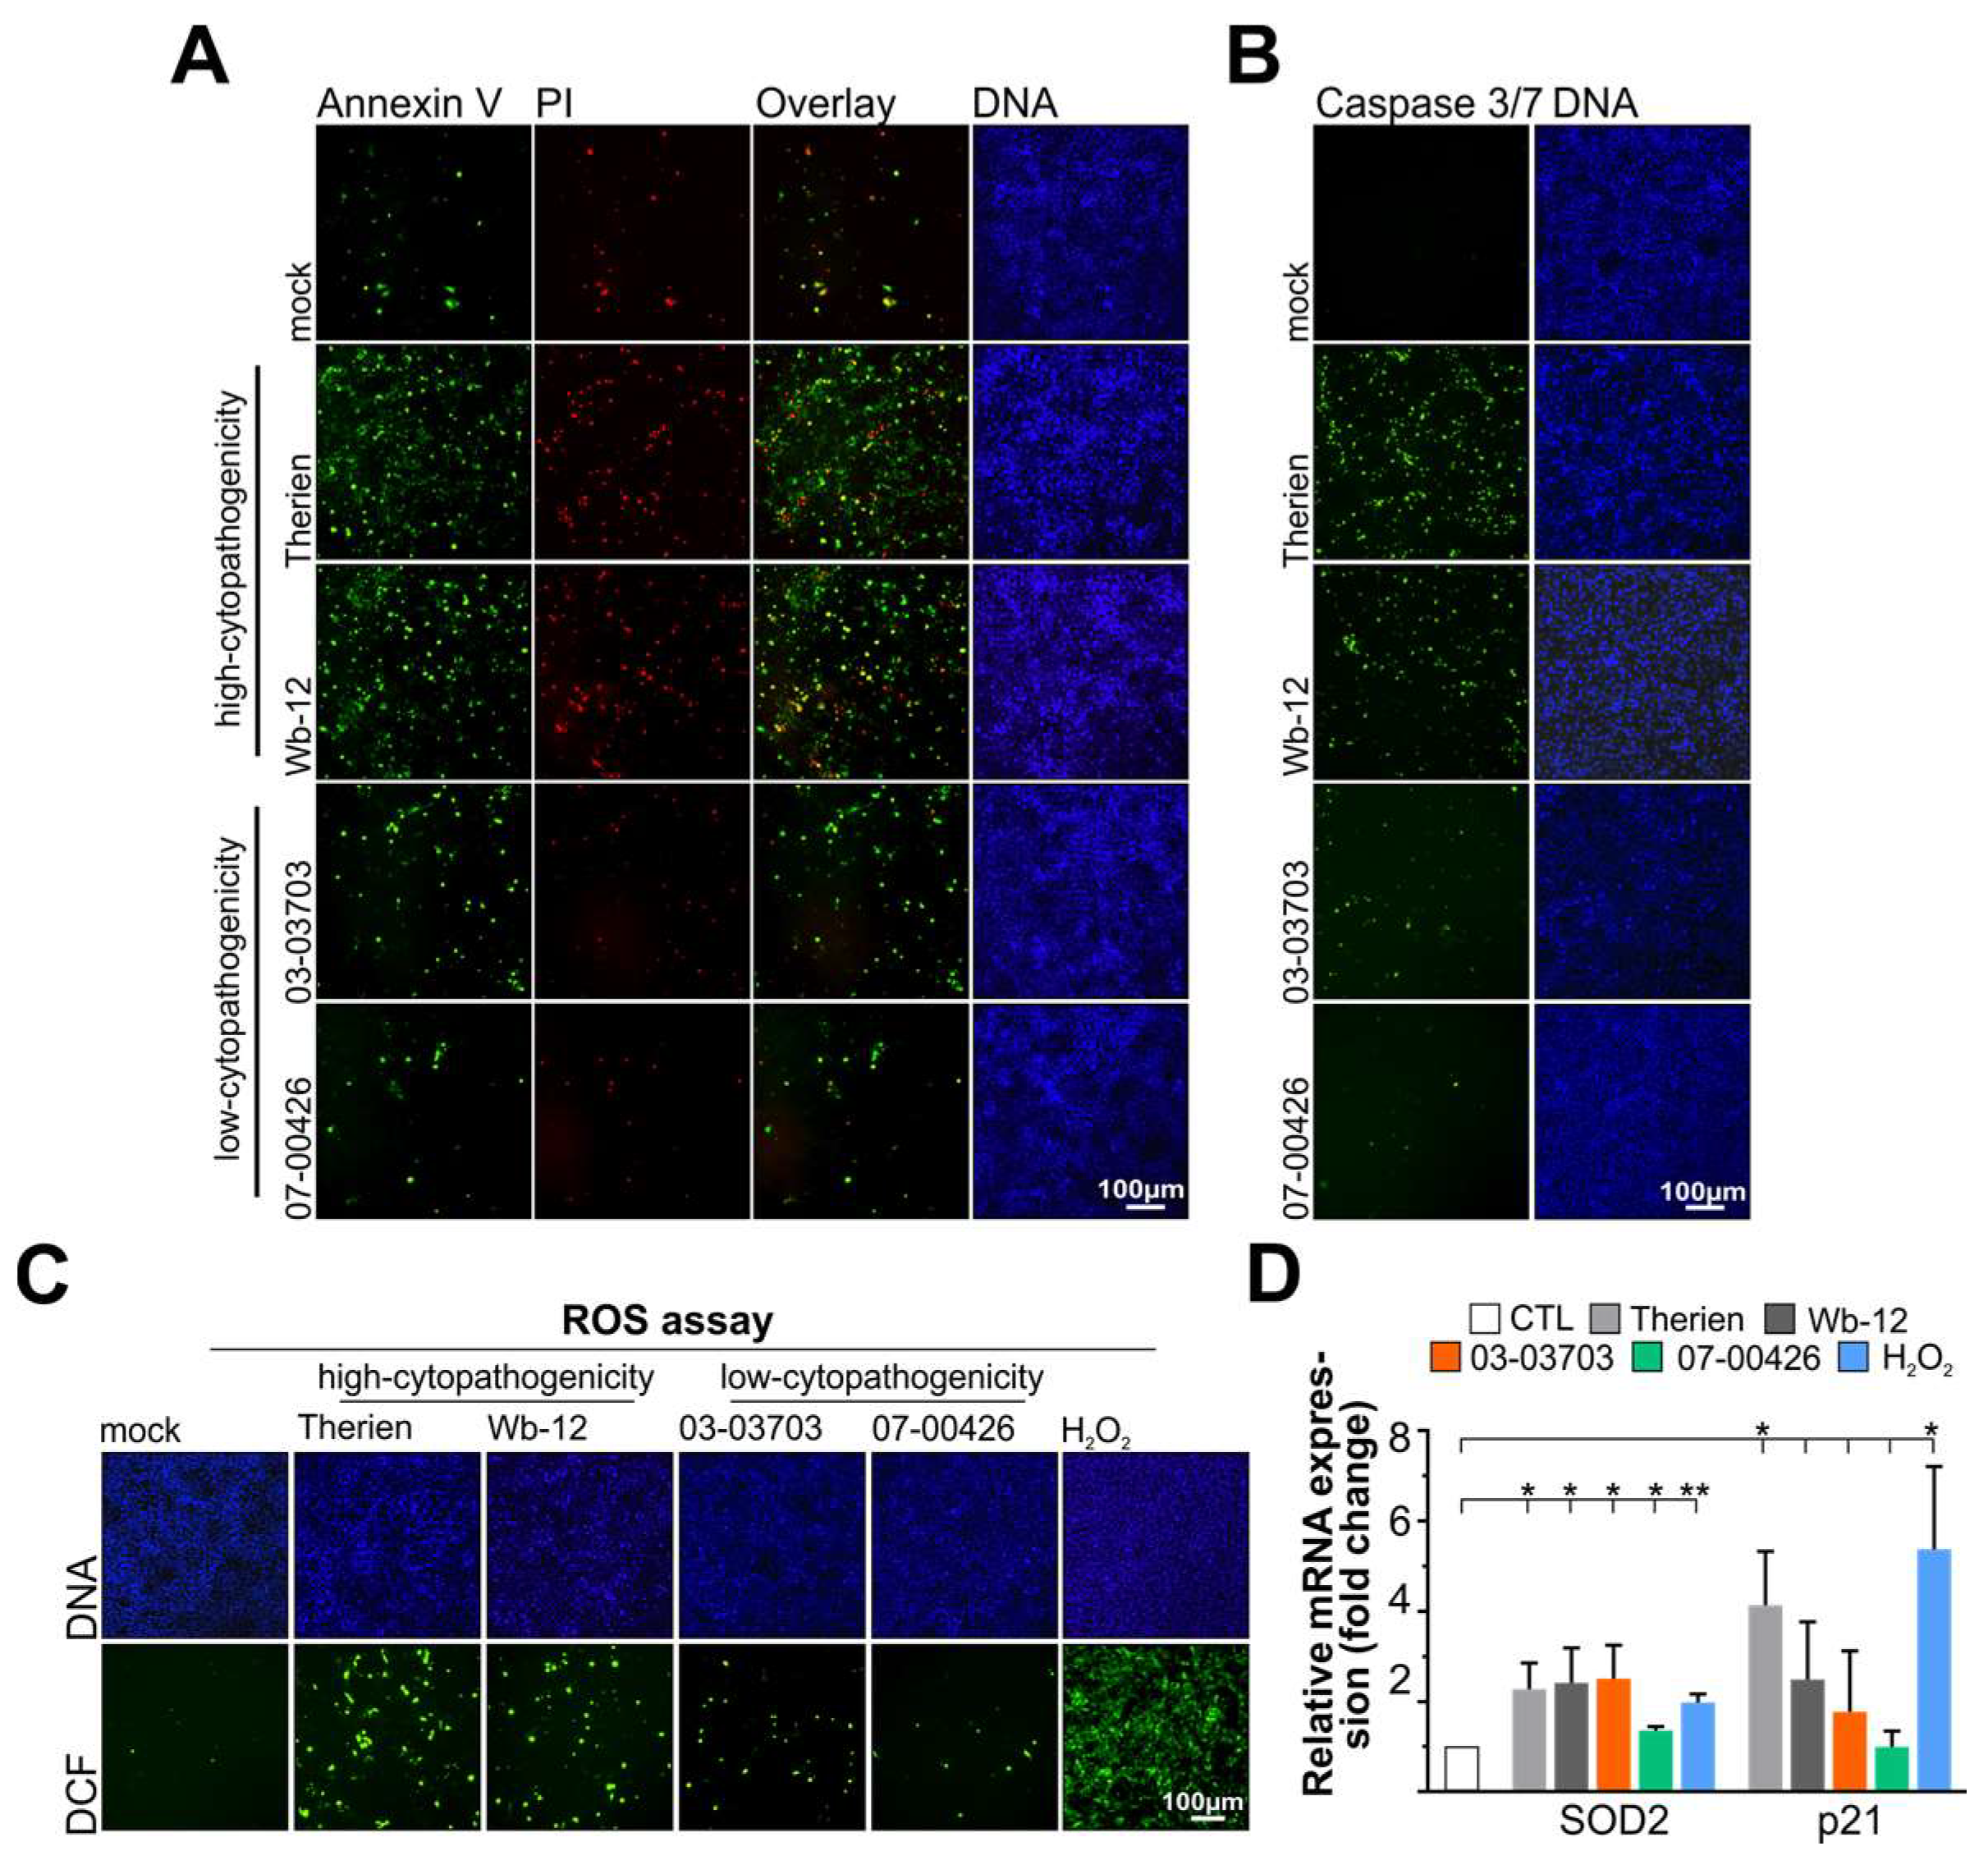
Abstract
:1. Introduction
2. Material and Methods
2.1. Cell Lines and Cultivation
2.2. Ethic Statement
2.3. Virus Strains and Virus Infection
2.4. RV Titre Determination
2.5. Viral Genomic RNA Quantification
2.6. Cellular mRNA Expression
- HPRT1 TGACACTGGCAAAACAATGCA/GGTCCTTTTCACCAGCAAGCT (62 °C), [24];
- SOD2 TGGCTTGGTTTCAATAAGGAA/AGCGTGCTCCCACACATCAAT (58 °C), (RTPrimerDB);
- p21 CCTGTCACTGTCTTGTACCCT/GCGTTTGGAGTGGTAGAAATCT (52 °C), [25];
- IFNβ1 GCCGCATTGACCATCTAT/GTCTCATTCCAGCCAGTG (60 °C);
- IFNλ1 GCAGGTTCAAATCTCTGTCACC/AAGACAGGAGAGCTGCAACTC (60 °C);
- IFNλ2/3 GCCACATAGCCCAGTTCAAG/TGGGAGAGGATATGGTGCAG (60 °C);
- viperin GAGAGCCATTTCTTCAAGACC/CTATAATCCCTACACCACCTCC (60 °C);
- IFIT1 AAAAGCCCACATTTGAGGTG/GAAATTCCTGAAACCGACCA (60 °C);
- IFITM1 CCAAGGTCCACCGTGATTAAC/ACCAGTTCAAGAAGAGGGTGTT (56 °C), [26];
- IFITM3 GATGTGGATCACGGTGGAC/AGATGCTCAAGGAGGAGCAC (55 °C);
- ISG15 CTGTTCTGGCTGACCTTCG/GGCTTGAGGCCGTACTCC (56 °C), [26];
2.7. Cell-Based Assays
2.8. Analysis of Apoptosis Induction
2.9. Detection of ROS and Application of ROS Scavengers
2.10. IFN Response and Stimulation Assays
2.11. Immunofluorescence Analysis
2.12. Western Blot Analysis
2.13. Statistical Analysis
3. Results
3.1. Infection of Vero Cells with RV Strains Results in Differential Induction of Apoptosis and Oxidative Stress
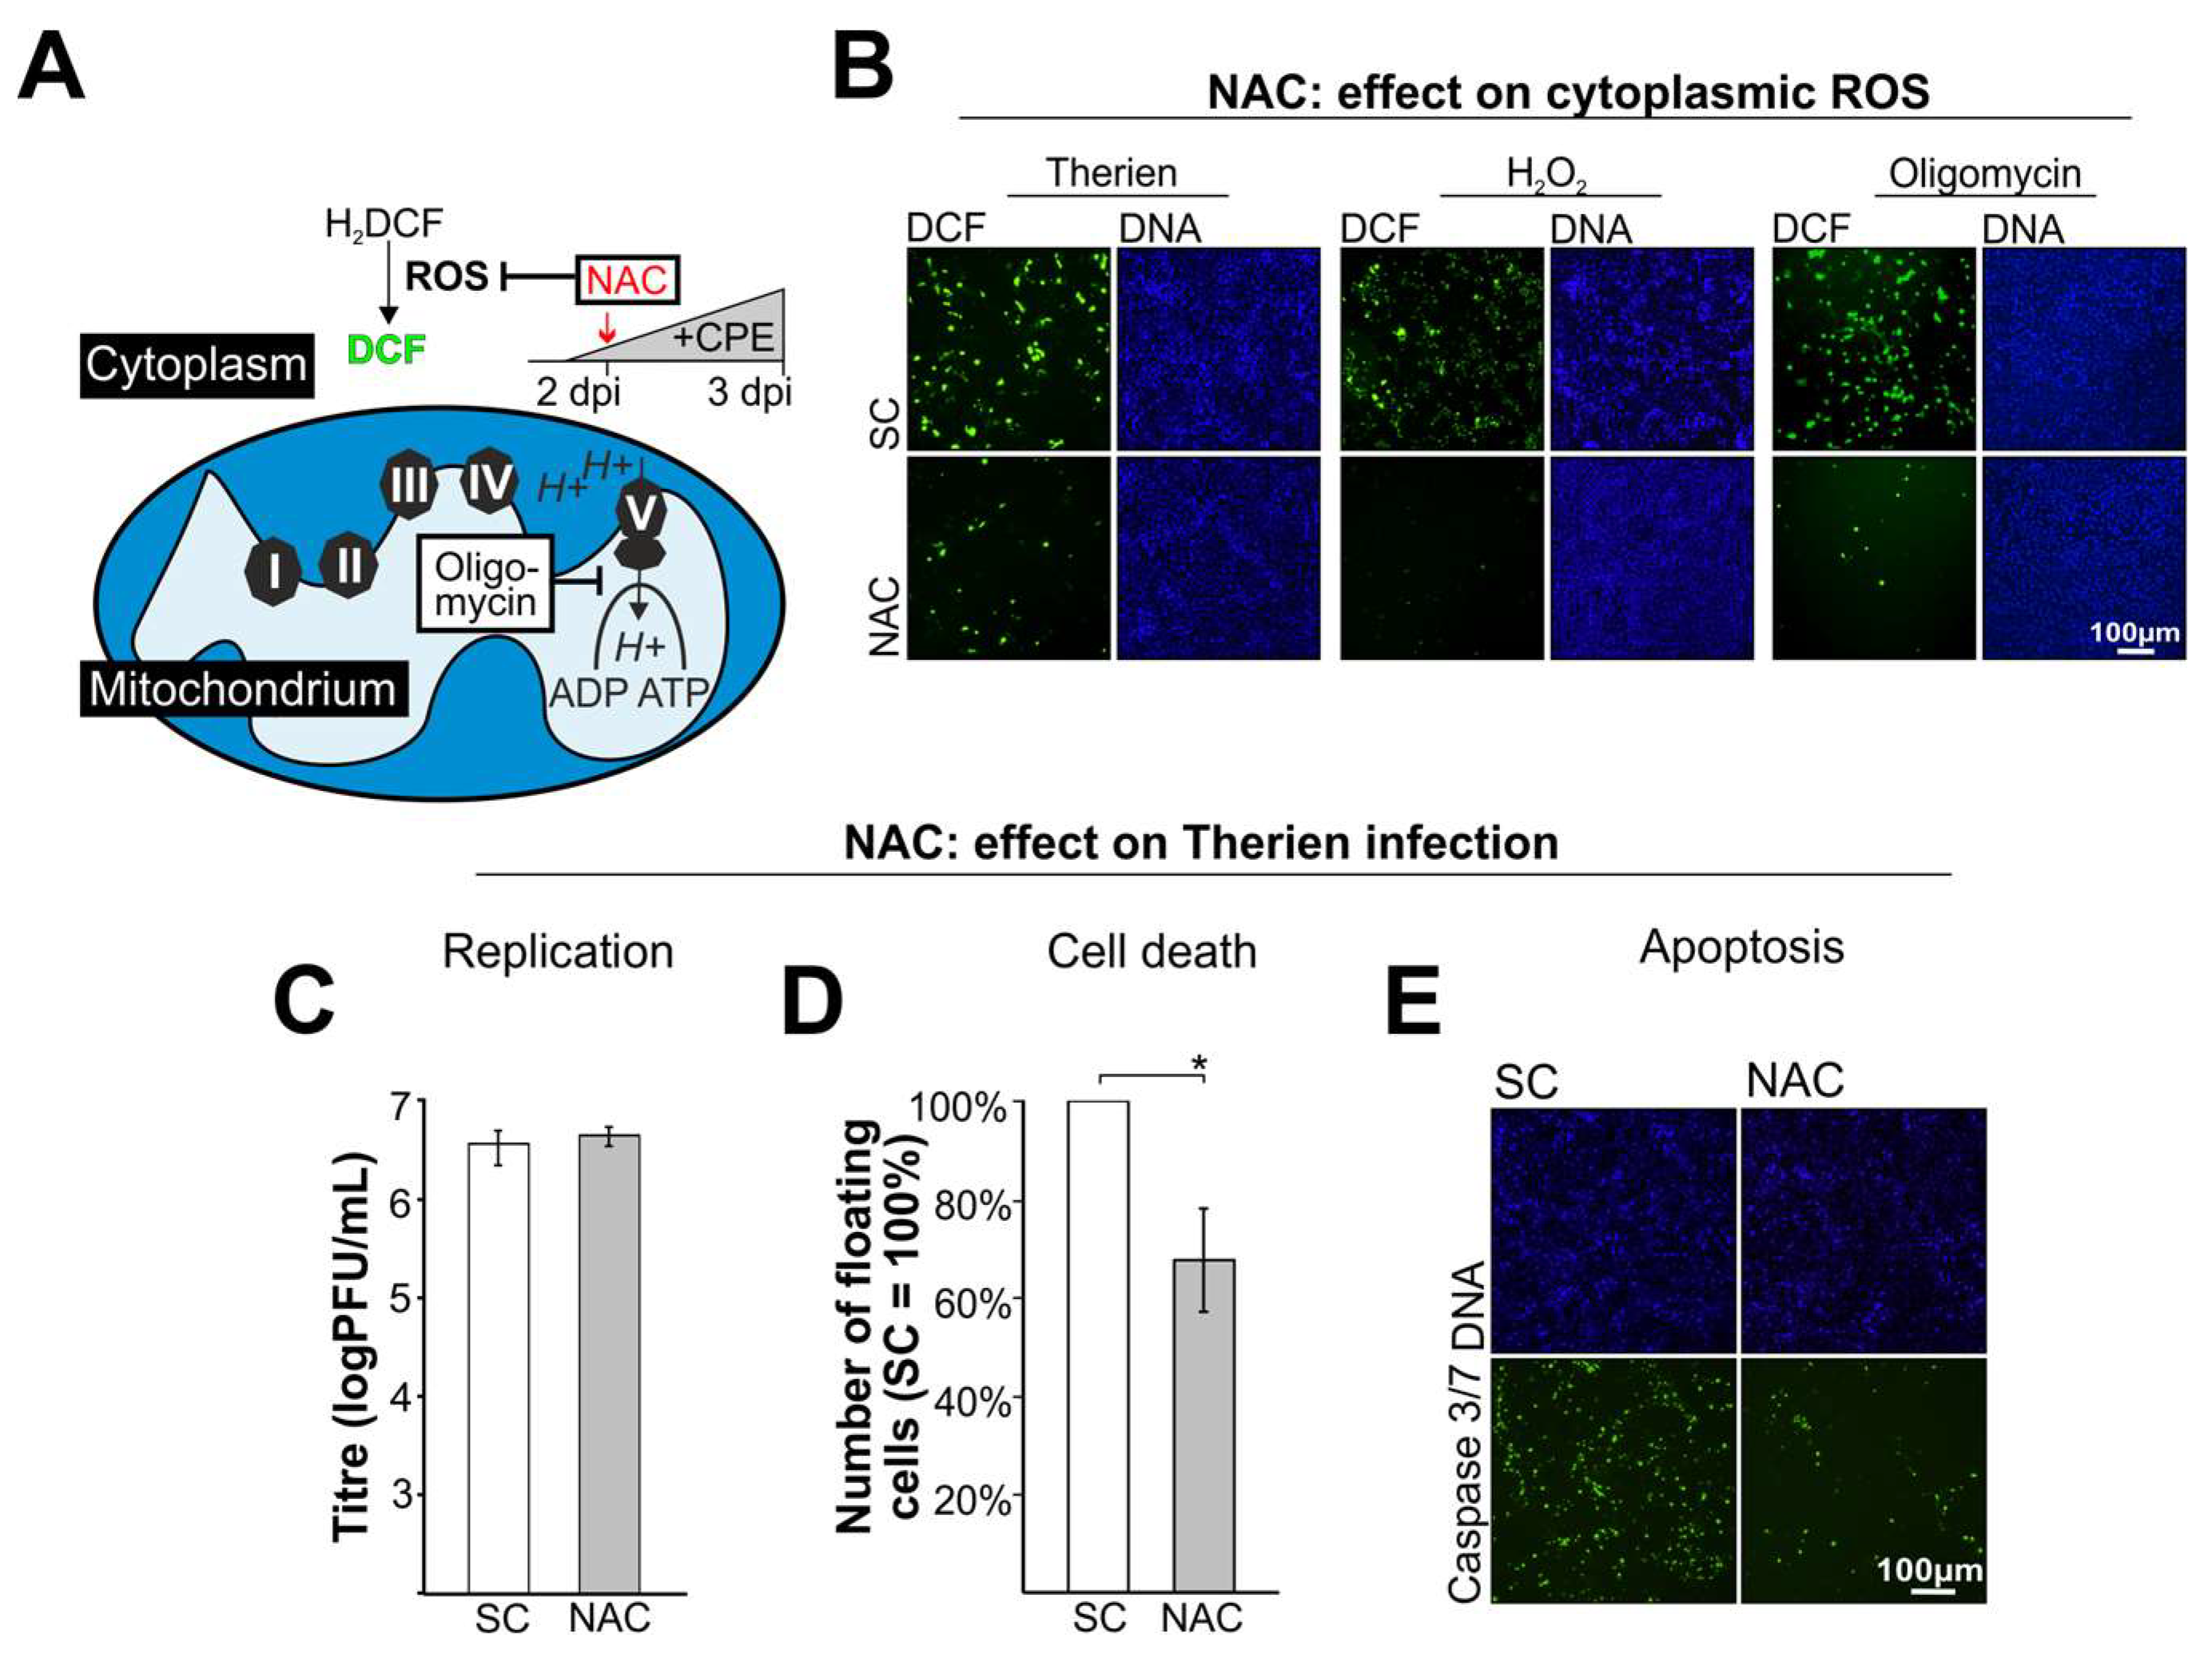
3.2. The ROS Scavenger NAC Reduces RV Cytopathogenicity
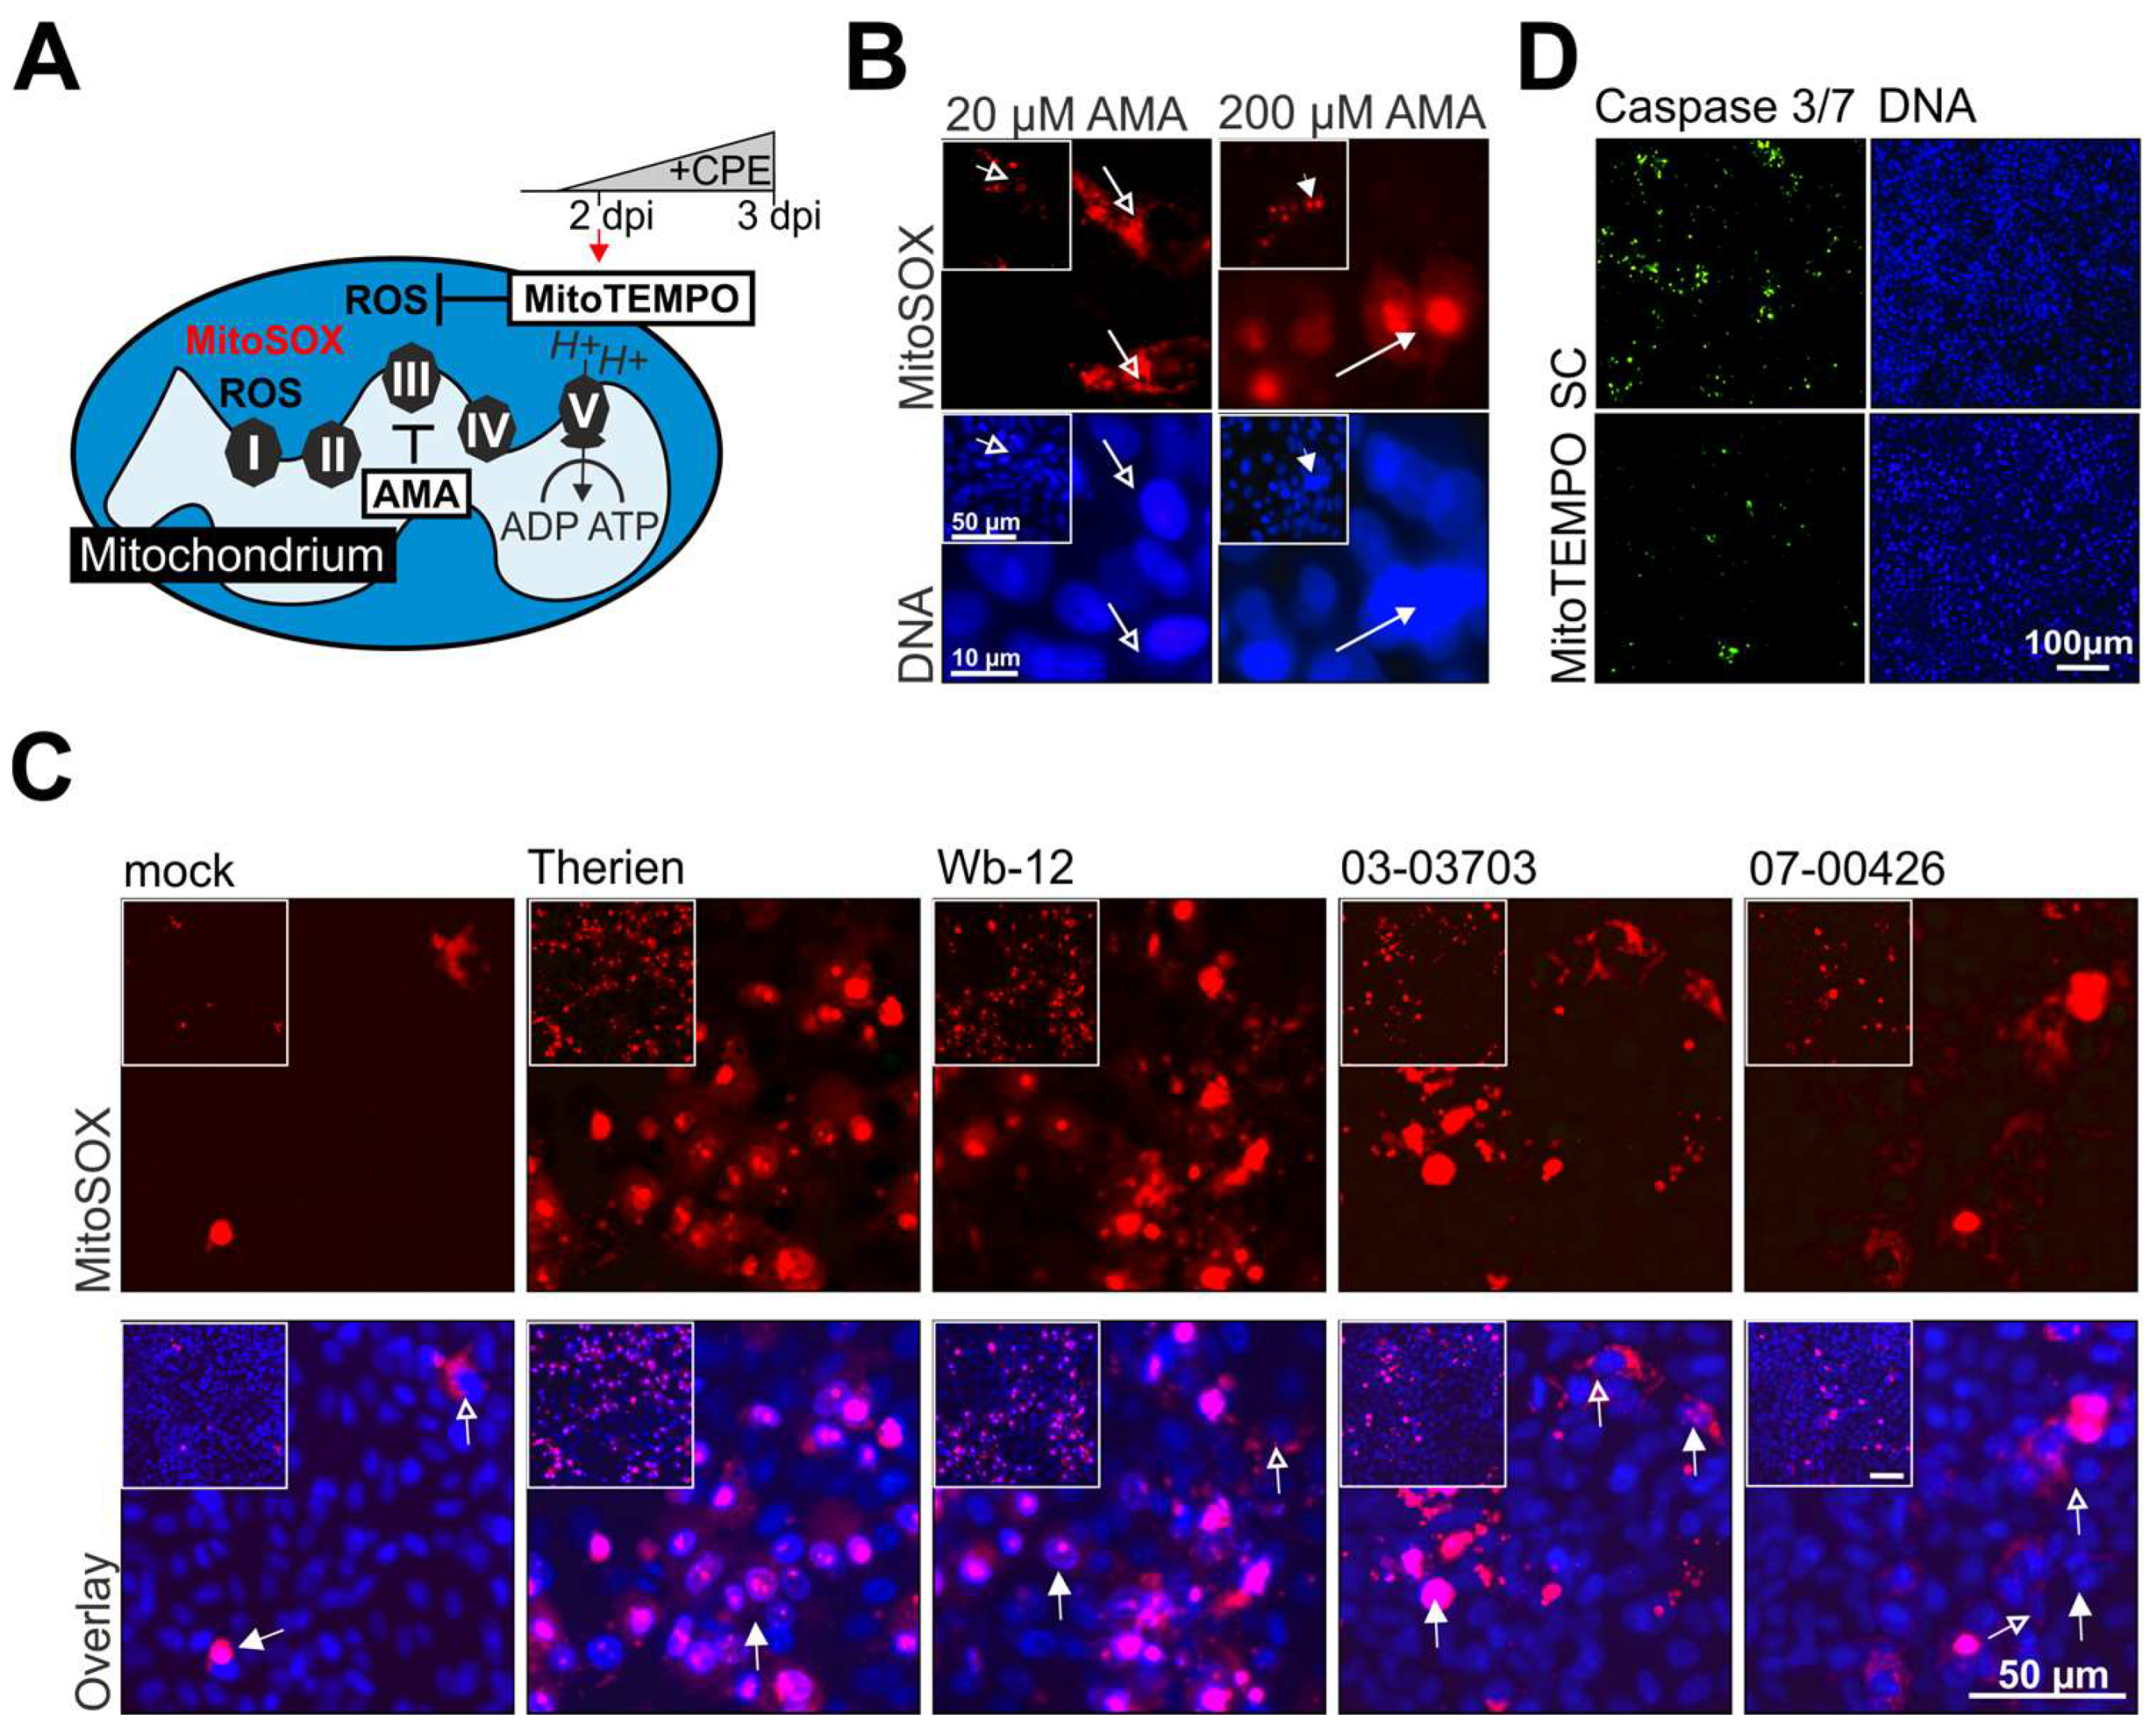
3.3. Nuclear Localization of the Superoxide Sensitive Dye MitoSOX Reveals Mitochondrial Dysfunction during RV Infection
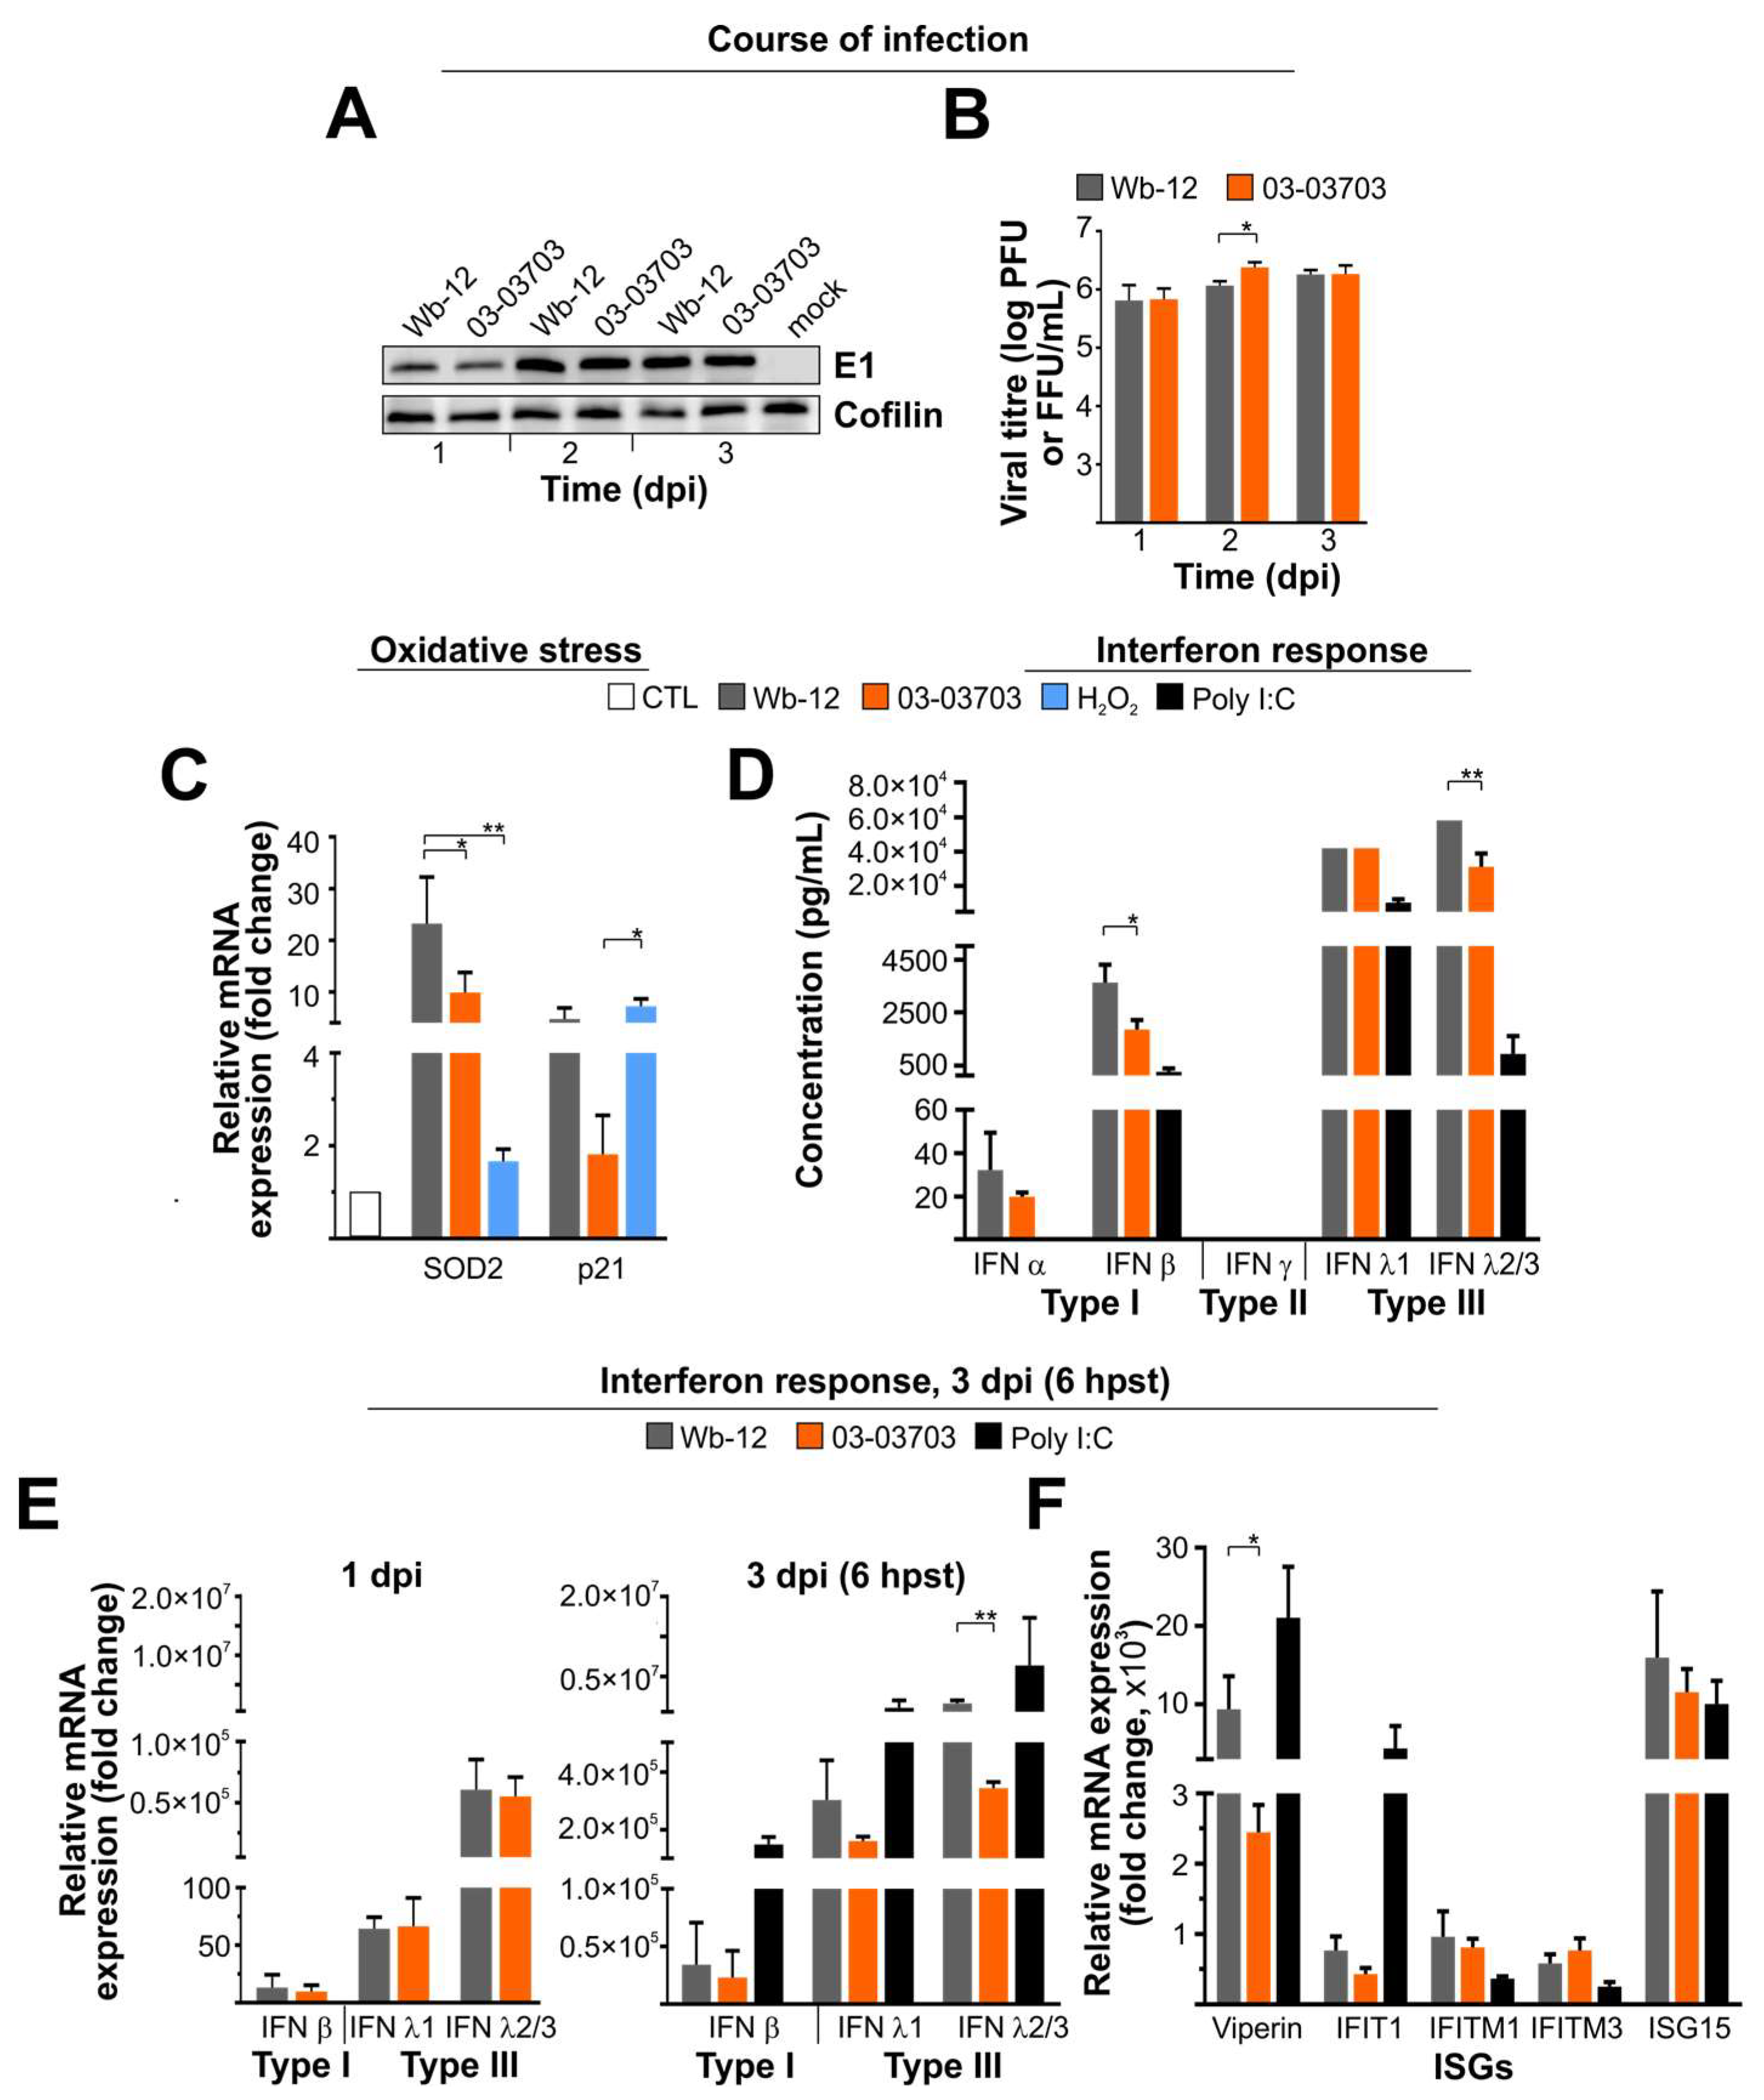
3.4. On A549 Cells RV Strains Activate Type I and III IFNs and a Panel of IFN-Stimulated Genes in a Comparable Manner
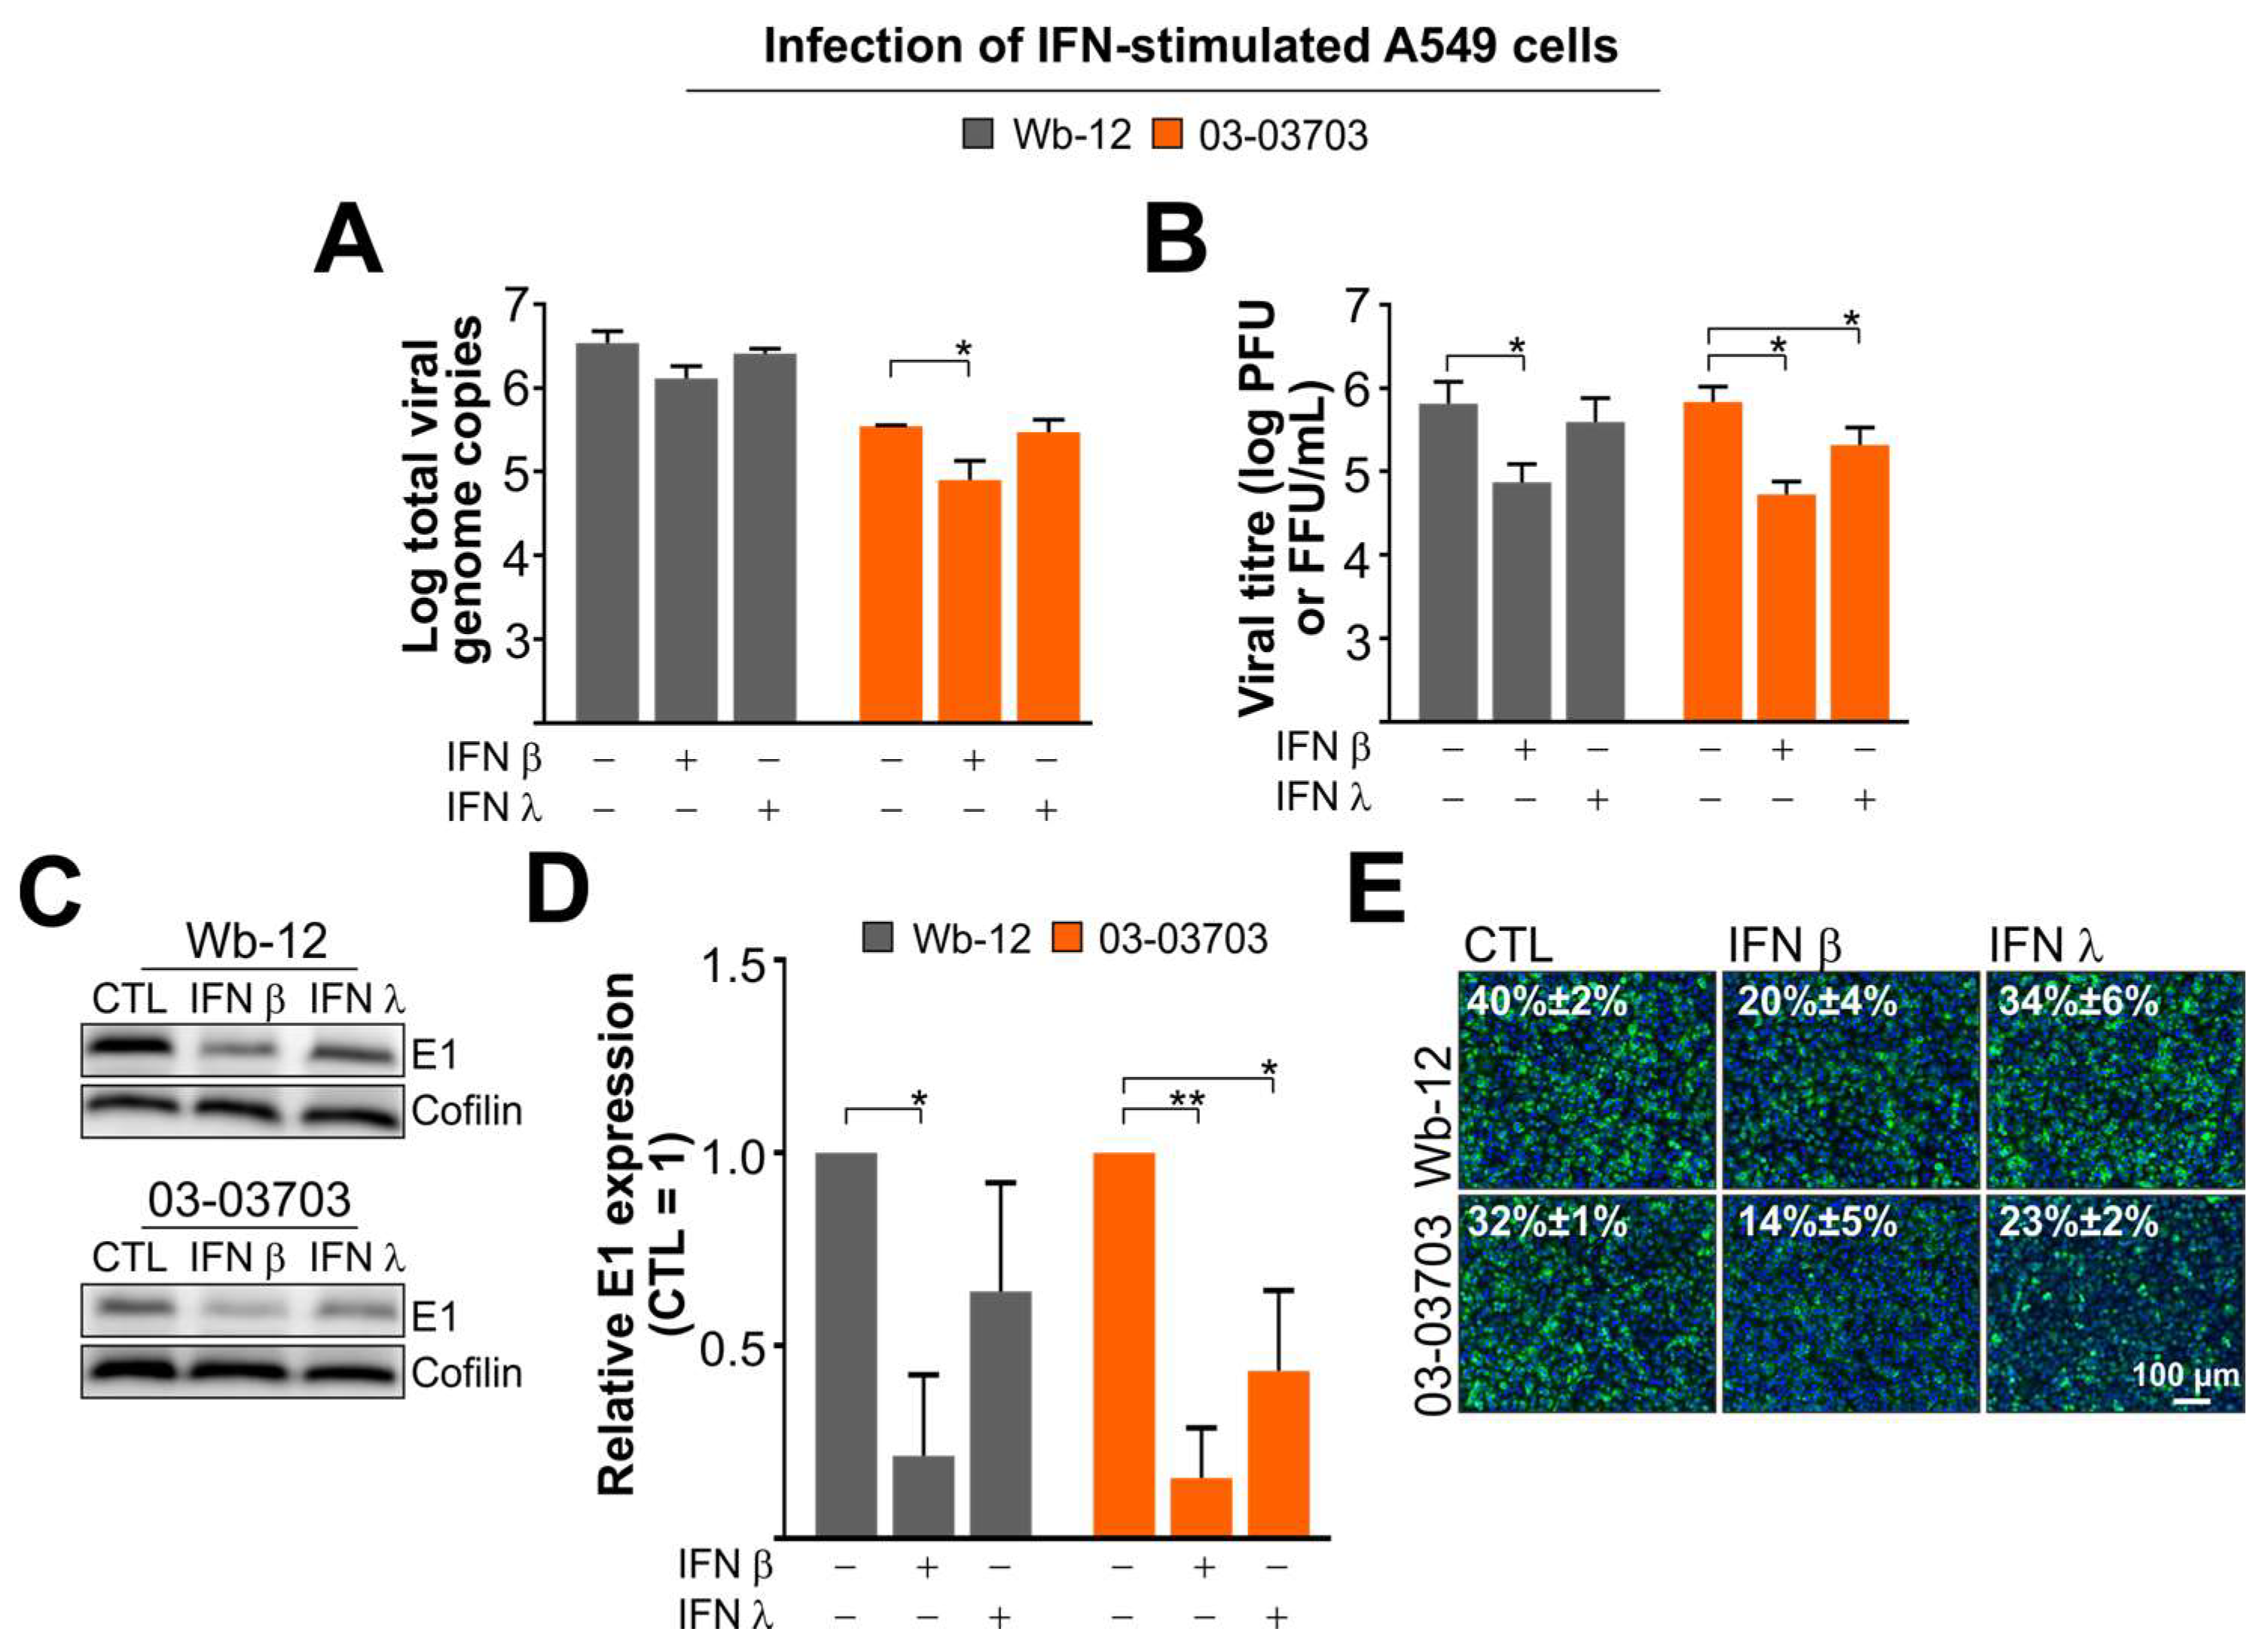
3.5. RV Infection is Marginally Reduced after Pre-Treatment of A549 Cells with IFN β and Almost Insensitive to Type III IFNs
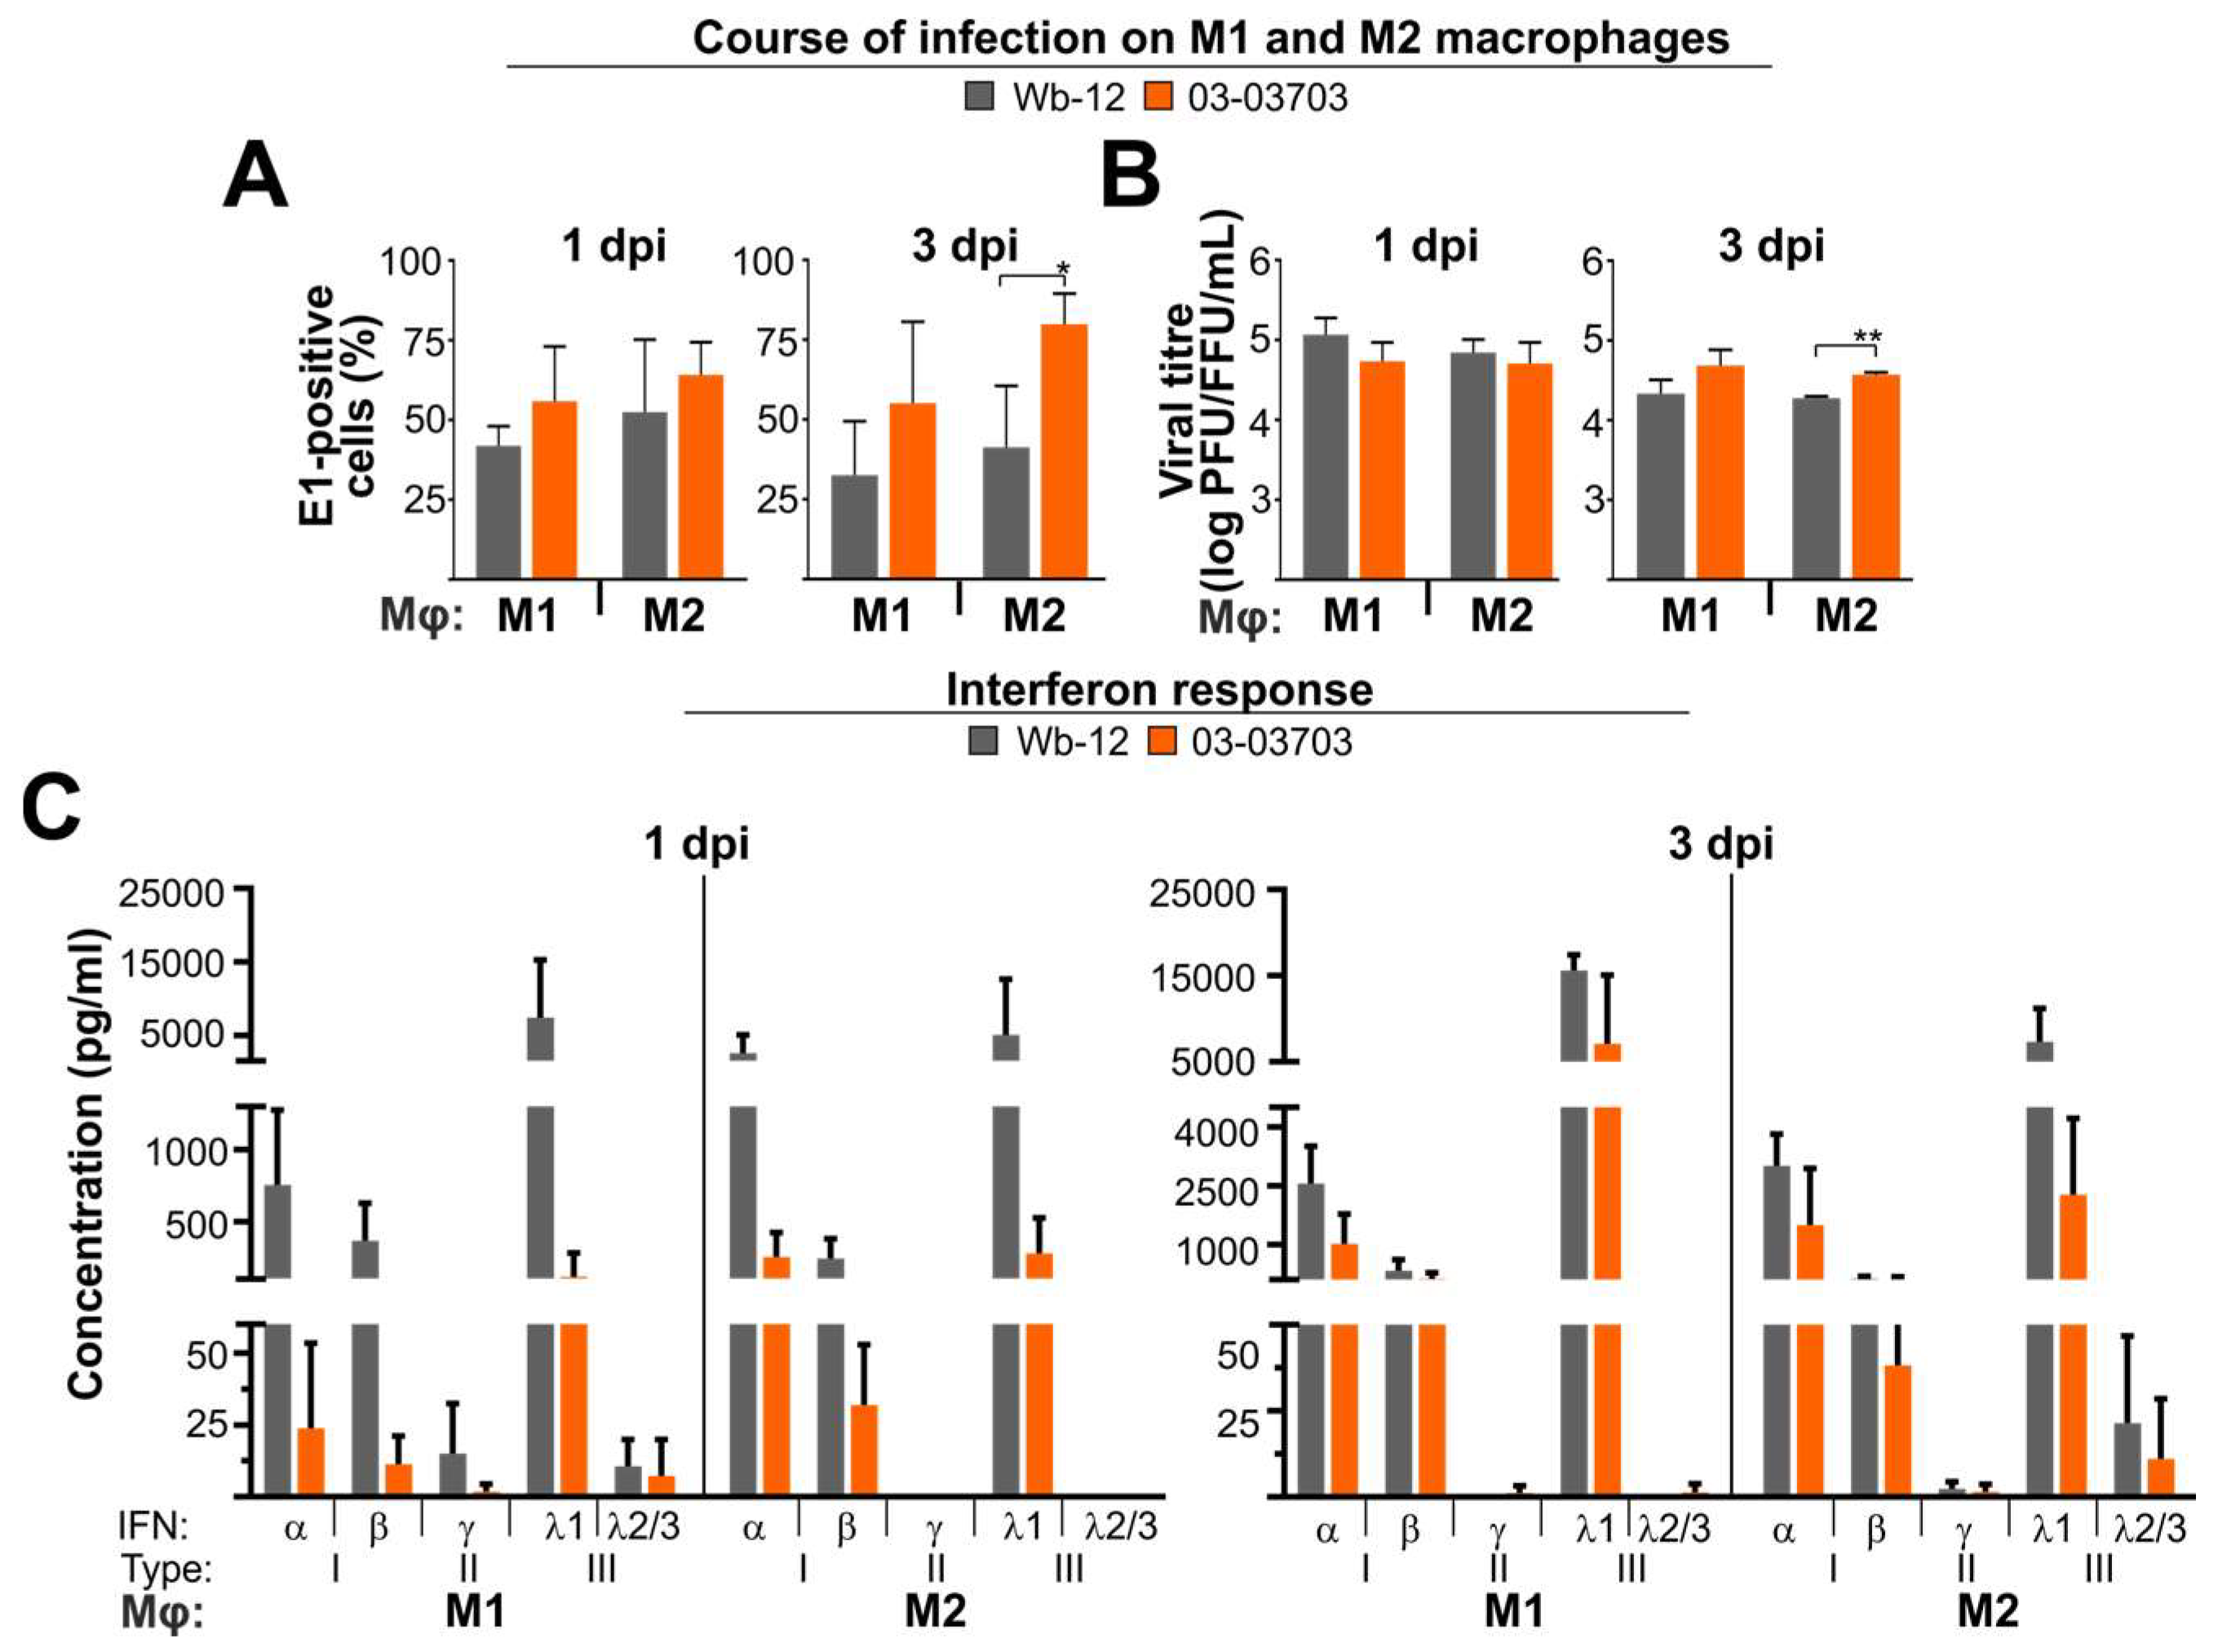
3.6. An Equal Infection Rate of RV Strains on M1- and M2-Mφ Occurred in Association with a Strong Type I and III IFN Response
4. Discussion
Supplementary Materials
Author Contributions
Funding
Acknowledgments
Conflicts of Interest
References
- Freij, B.J.; South, M.A.; Sever, J.L. Maternal rubella and the congenital rubella syndrome. Clin. Perinatol. 1988, 15, 247–257. [Google Scholar] [CrossRef]
- Bouthry, E.; Picone, O.; Hamdi, G.; Grangeot-Keros, L.; Ayoubi, J.M.; Vauloup-Fellous, C. Rubella and pregnancy: Diagnosis, management and outcomes. Prenat. Diagn. 2014, 34, 1246–1253. [Google Scholar] [PubMed]
- Lazar, M.; Abernathy, E.; Chen, M.H.; Icenogle, J.; Janta, D.; Stanescu, A.; Pistol, A.; Santibanez, S.; Mankertz, A.; Hubschen, J.M.; et al. Epidemiological and molecular investigation of a rubella outbreak, romania, 2011 to 2012. Euro Surveill. 2016, 21. [Google Scholar] [CrossRef] [PubMed]
- Paradowska-Stankiewicz, I.; Czarkowski, M.P.; Derrough, T.; Stefanoff, P. Ongoing outbreak of rubella among young male adults in Poland: Increased risk of congenital rubella infections. Eurosurveillance 2013, 18, 2–6. [Google Scholar]
- Duncan, R.; Muller, J.; Lee, N.; Esmaili, A.; Nakhasi, H.L. Rubella virus-induced apoptosis varies among cell lines and is modulated by bcl-xl and caspase inhibitors. Virology 1999, 255, 117–128. [Google Scholar] [CrossRef] [PubMed]
- Adamo, M.P.; Zapata, M.; Frey, T.K. Analysis of gene expression in fetal and adult cells infected with rubella virus. Virology 2008, 370, 1–11. [Google Scholar] [CrossRef] [PubMed]
- Chen, M.H.; Zhu, Z.; Zhang, Y.; Favors, S.; Xu, W.B.; Featherstone, D.A.; Icenogle, J.P. An indirect immunocolorimetric assay to detect rubella virus infected cells. J. Virol. Methods 2007, 146, 414–418. [Google Scholar] [CrossRef] [PubMed]
- Perelygina, L.; Zheng, Q.; Metcalfe, M.; Icenogle, J. Persistent infection of human fetal endothelial cells with rubella virus. PLoS ONE 2013, 8, e73014. [Google Scholar] [CrossRef] [PubMed]
- Findlay, J.S.; Ulaeto, D. Semliki forest virus and sindbis virus, but not vaccinia virus, require glycolysis for optimal replication. J. Gen. Virol. 2015, 96, 2693–2696. [Google Scholar] [CrossRef] [PubMed]
- Bilz, N.C.; Jahn, K.; Lorenz, M.; Ludtke, A.; Hubschen, J.M.; Geyer, H.; Mankertz, A.; Hubner, D.; Liebert, U.G.; Claus, C. Rubella viruses shift cellular bioenergetics to a more oxidative and glycolytic phenotype with a strain-specific requirement for glutamine. J. Virol. 2018, 92, e00934-18. [Google Scholar] [CrossRef] [PubMed]
- Claus, C.; Schonefeld, K.; Hübner, D.; Chey, S.; Reibetanz, U.; Liebert, U.G. Activity increase in respiratory chain complexes by rubella virus with marginal induction of oxidative stress. J. Virol. 2013, 87, 8481–8492. [Google Scholar] [PubMed]
- Beatch, M.D.; Hobman, T.C. Rubella virus capsid associates with host cell protein p32 and localizes to mitochondria. J. Virol. 2000, 74, 5569–5576. [Google Scholar] [CrossRef] [PubMed]
- Ilkow, C.S.; Goping, I.S.; Hobman, T.C. The rubella virus capsid is an anti-apoptotic protein that attenuates the pore-forming ability of bax. PLoS Pathog. 2011, 7, e1001291. [Google Scholar]
- Claus, C.; Manssen, L.; Hübner, D.; Rossmark, S.; Bothe, V.; Petzold, A.; Grosse, C.; Reins, M.; Mankertz, A.; Frey, T.K.; et al. Activation of the mitochondrial apoptotic signaling platform during rubella virus infection. Viruses 2015, 7, 6108–6126. [Google Scholar] [PubMed]
- Valadao, A.L.C.; Aguiar, R.S.; de Arruda, L.B. Interplay between inflammation and cellular stress triggered by flaviviridae viruses. Front. Microbiol 2016, 7, 1233. [Google Scholar] [CrossRef] [PubMed]
- Olagnier, D.; Peri, S.; Steel, C.; van Montfoort, N.; Chiang, C.; Beljanski, V.; Slifker, M.; He, Z.; Nichols, C.N.; Lin, R.; et al. Cellular oxidative stress response controls the antiviral and apoptotic programs in dengue virus-infected dendritic cells. PLoS Pathog. 2014, 10, e1004566. [Google Scholar] [CrossRef] [PubMed]
- Di Bona, D.; Cippitelli, M.; Fionda, C.; Camma, C.; Licata, A.; Santoni, A.; Craxi, A. Oxidative stress inhibits IFN-alpha-induced antiviral gene expression by blocking the JAK-STAT pathway. J. Hepatol. 2006, 45, 271–279. [Google Scholar] [PubMed]
- Jensen, S.; Thomsen, A.R. Sensing of rna viruses: A review of innate immune receptors involved in recognizing RNA virus invasion. J. Virol. 2012, 86, 2900–2910. [Google Scholar] [CrossRef] [PubMed]
- Schneider, W.M.; Chevillotte, M.D.; Rice, C.M. Interferon-stimulated genes: A complex web of host defenses. Annu. Rev. Immunol. 2014, 32, 513–545. [Google Scholar] [CrossRef] [PubMed]
- Lazar, M.; Perelygina, L.; Martines, R.; Greer, P.; Paddock, C.D.; Peltecu, G.; Lupulescu, E.; Icenogle, J.; Zaki, S.R. Immunolocalization and distribution of rubella antigen in fatal congenital rubella syndrome. EBioMedicine 2016, 3, 86–92. [Google Scholar] [PubMed]
- Akagawa, K.S.; Komuro, I.; Kanazawa, H.; Yamazaki, T.; Mochida, K.; Kishi, F. Functional heterogeneity of colony-stimulating factor-induced human monocyte-derived macrophages. Respirology 2006, 11, S32–S36. [Google Scholar] [CrossRef] [PubMed]
- Bayer, C.; Varani, S.; Wang, L.; Walther, P.; Zhou, S.; Straschewski, S.; Bachem, M.; Soderberg-Naucler, C.; Mertens, T.; Frascaroli, G. Human cytomegalovirus infection of M1 and M2 macrophages triggers inflammation and autologous t-cell proliferation. J. Virol. 2013, 87, 67–79. [Google Scholar] [CrossRef] [PubMed]
- Claus, C.; Bergs, S.; Emmrich, N.C.; Hubschen, J.M.; Mankertz, A.; Liebert, U.G. A sensitive one-step taqman amplification approach for detection of rubella virus clade I and II genotypes in clinical samples. Arch. Virol. 2017, 162, 477–486. [Google Scholar] [CrossRef] [PubMed]
- Cicinnati, V.R.; Shen, Q.L.; Sotiropoulos, G.C.; Radtke, A.; Gerken, G.; Beckebaum, S. Validation of putative reference genes for gene expression studies in human hepatocellular carcinoma using real-time quantitative RT-PCR. BMC Cancer 2008, 8, 350. [Google Scholar] [CrossRef] [PubMed]
- Kasahara, T.; Kakinuma, C.; Kuwayama, C.; Hashiba, M.; Harada, T.; Degawa, M. Increased expression of cyclin-dependent kinase-interacting protein p21 during tamoxifen-induced hepatocarcinogenesis in female rats. J. Health Sci. 2005, 51, 185–190. [Google Scholar] [CrossRef]
- Wu, X.; Dao Thi, V.L.; Huang, Y.; Billerbeck, E.; Saha, D.; Hoffmann, H.H.; Wang, Y.; Silva, L.A.V.; Sarbanes, S.; Sun, T.; et al. Intrinsic immunity shapes viral resistance of stem cells. Cell 2018, 172, 423.e25–438.e25. [Google Scholar] [CrossRef] [PubMed]
- Rivailler, P.; Abernathy, E.; Icenogle, J. Genetic diversity of currently circulating rubella viruses: A need to define more precise viral groups. J. Gen. Virol. 2017, 98, 396–404. [Google Scholar] [CrossRef] [PubMed]
- Vitiello, P.F.; Wu, Y.C.; Staversky, R.J.; O’Reilly, M.A. p21(Cip1) protects against oxidative stress by suppressing er-dependent activation of mitochondrial death pathways. Free Radic. Boil. Med. 2009, 46, 33–41. [Google Scholar] [CrossRef] [PubMed]
- Pugachev, K.V.; Frey, T.K. Rubella virus induces apoptosis in culture cells. Virology 1998, 250, 359–370. [Google Scholar] [CrossRef] [PubMed]
- Mukhopadhyay, P.; Rajesh, M.; Hasko, G.; Hawkins, B.J.; Madesh, M.; Pacher, P. Simultaneous detection of apoptosis and mitochondrial superoxide production in live cells by flow cytometry and confocal microscopy. Nat. Protoc. 2007, 2, 2295–2301. [Google Scholar] [CrossRef] [PubMed] [Green Version]
- Kawai, T.; Akira, S. Toll-like receptor and RIG-I-like receptor signaling. Ann. N. Y. Acad. Sci. 2008, 1143, 1–20. [Google Scholar] [CrossRef] [PubMed]
- Perelygina, L.; Plotkin, S.; Russo, P.; Hautala, T.; Bonilla, F.; Ochs, H.D.; Joshi, A.; Routes, J.; Patel, K.; Wehr, C.; et al. Rubella persistence in epidermal keratinocytes and granuloma m2 macrophages in patients with primary immunodeficiencies. J. Allergy Clin. Immunol. 2016, 138, 1436.e1411–1439.e1411. [Google Scholar] [CrossRef] [PubMed]
- Newsholme, P. Why is l-glutamine metabolism important to cells of the immune system in health, postinjury, surgery or infection? J. Nutr. 2001, 131, 2515S–2522S. [Google Scholar] [CrossRef] [PubMed]
- Neu, C.; Sedlag, A.; Bayer, C.; Forster, S.; Crauwels, P.; Niess, J.H.; van Zandbergen, G.; Frascaroli, G.; Riedel, C.U. CD14-dependent monocyte isolation enhances phagocytosis of Listeria monocytogenes by proinflammatory, GM-CSF-derived macrophages. PLoS ONE 2013, 8, e66898. [Google Scholar] [CrossRef] [PubMed] [Green Version]
- Campbell, G.M.; Nicol, M.Q.; Dransfield, I.; Shaw, D.J.; Nash, A.A.; Dutia, B.M. Susceptibility of bone marrow-derived macrophages to influenza virus infection is dependent on macrophage phenotype. J. Gen. Virol. 2015, 96, 2951–2960. [Google Scholar] [CrossRef] [PubMed]
- Cassol, E.; Cassetta, L.; Rizzi, C.; Alfano, M.; Poli, G. M1 and M2a polarization of human monocyte-derived macrophages inhibits HIV-1 replication by distinct mechanisms. J. Immunol. 2009, 182, 6237–6246. [Google Scholar] [CrossRef] [PubMed]
- Cassetta, L.; Kajaste-Rudnitski, A.; Coradin, T.; Saba, E.; Della Chiara, G.; Barbagallo, M.; Graziano, F.; Alfano, M.; Cassol, E.; Vicenzi, E.; et al. M1 polarization of human monocyte-derived macrophages restricts pre and postintegration steps of HIV-1 replication. Aids 2013, 27, 1847–1856. [Google Scholar] [CrossRef] [PubMed] [Green Version]
- Claus, C.; Chey, S.; Heinrich, S.; Reins, M.; Richardt, B.; Pinkert, S.; Fechner, H.; Gaunitz, F.; Schafer, I.; Seibel, P.; et al. Involvement of p32 and microtubules in alteration of mitochondrial functions by rubella virus. J. Virol. 2011, 85, 3881–3892. [Google Scholar] [CrossRef] [PubMed]
- Liu, Y.; Schubert, D.R. The specificity of neuroprotection by antioxidants. J. Biomed. Sci. 2009, 16, 98. [Google Scholar] [CrossRef] [PubMed]
- Levitz, R.; Gao, Y.; Dozmorov, I.; Song, R.; Wakeland, E.K.; Kahn, J.S. Distinct patterns of innate immune activation by clinical isolates of respiratory syncytial virus. PLoS ONE 2017, 12, e0184318. [Google Scholar] [CrossRef] [PubMed]
- Le Goffic, R.; Bouguyon, E.; Chevalier, C.; Vidic, J.; Da Costa, B.; Leymarie, O.; Bourdieu, C.; Decamps, L.; Dhorne-Pollet, S.; Delmas, B. Influenza A virus protein PB1-F2 exacerbates IFN-beta expression of human respiratory epithelial cells. J. Immunol. 2010, 185, 4812–4823. [Google Scholar] [CrossRef] [PubMed]
- Leymarie, O.; Meyer, L.; Tafforeau, L.; Lotteau, V.; Costa, B.D.; Delmas, B.; Chevalier, C.; Le Goffic, R. Influenza virus protein PB1-F2 interacts with CALCOCO2 (NDP52) to modulate innate immune response. J. Gen. Virol. 2017, 98, 1196–1208. [Google Scholar] [CrossRef] [PubMed]
- Potter, J.E.; Banatvala, J.E.; Best, J.M. Interferon studies with Japanese and U.S. Rubella virus strains. Br. Med. J. 1973, 1, 197–199. [Google Scholar] [CrossRef] [PubMed]
- Mifune, K.; Desmyter, J.; Rawls, W.E. Effect of exogenous interferon on rubella virus production in carrier cultures of cells defective in interferon production. Infect. Immun. 1970, 2, 132–138. [Google Scholar] [PubMed]
- Tzeng, W.P.; Xu, J.; Frey, T.K. Characterization of cell lines stably transfected with rubella virus replicons. Virology 2012, 429, 29–36. [Google Scholar] [CrossRef] [PubMed] [Green Version]
- Doceul, V.; Chauveau, E.; Lara, E.; Breard, E.; Sailleau, C.; Zientara, S.; Vitour, D. Dual modulation of type i interferon response by bluetongue virus. J. Virol. 2014, 88, 10792–10802. [Google Scholar] [CrossRef] [PubMed]
- Zhang, Z.; Filzmayer, C.; Ni, Y.; Sultmann, H.; Mutz, P.; Hiet, M.S.; Vondran, F.W.R.; Bartenschlager, R.; Urban, S. Hepatitis D virus replication is sensed by MDA5 and induces IFN-beta/lambda responses in hepatocytes. J. Hepatol. 2018, 69, 25–35. [Google Scholar] [CrossRef] [PubMed]
- Alfaiate, D.; Lucifora, J.; Abeywickrama-Samarakoon, N.; Michelet, M.; Testoni, B.; Cortay, J.C.; Sureau, C.; Zoulim, F.; Deny, P.; Durantel, D. HDV RNA replication is associated with hbv repression and interferon-stimulated genes induction in super-infected hepatocytes. Antivir. Res. 2016, 136, 19–31. [Google Scholar] [CrossRef] [PubMed]
- Fontana, J.; Lopez-Iglesias, C.; Tzeng, W.P.; Frey, T.K.; Fernandez, J.J.; Risco, C. Three-dimensional structure of rubella virus factories. Virology 2010, 405, 579–591. [Google Scholar] [CrossRef] [PubMed]
- Cooray, S.; Best, J.M.; Jin, L. Time-course induction of apoptosis by wild-type and attenuated strains of rubella virus. J. Gen. Virol. 2003, 84, 1275–1279. [Google Scholar] [CrossRef] [PubMed] [Green Version]
- Frey, T.K. Molecular biology of rubella virus. Adv. In Virus Res. 1994, 44, 69–160. [Google Scholar]
- Hubner, D.; Jahn, K.; Pinkert, S.; Bohnke, J.; Jung, M.; Fechner, H.; Rujescu, D.; Liebert, U.G.; Claus, C. Infection of iPSC lines with miscarriage-associated coxsackievirus and measles virus and teratogenic rubella virus as a model for viral impairment of early human embryogenesis. ACS Infect. Dis. 2017, 3, 886–897. [Google Scholar] [CrossRef] [PubMed]


© 2018 by the authors. Licensee MDPI, Basel, Switzerland. This article is an open access article distributed under the terms and conditions of the Creative Commons Attribution (CC BY) license (http://creativecommons.org/licenses/by/4.0/).
Share and Cite
Zobel, S.; Lorenz, M.; Frascaroli, G.; Böhnke, J.; Bilz, N.C.; Stanifer, M.L.; Boulant, S.; Bergs, S.; Liebert, U.G.; Claus, C. Rubella Virus Strain-Associated Differences in the Induction of Oxidative Stress Are Independent of Their Interferon Activation. Viruses 2018, 10, 540. https://doi.org/10.3390/v10100540
Zobel S, Lorenz M, Frascaroli G, Böhnke J, Bilz NC, Stanifer ML, Boulant S, Bergs S, Liebert UG, Claus C. Rubella Virus Strain-Associated Differences in the Induction of Oxidative Stress Are Independent of Their Interferon Activation. Viruses. 2018; 10(10):540. https://doi.org/10.3390/v10100540
Chicago/Turabian StyleZobel, Sarah, Mechthild Lorenz, Giada Frascaroli, Janik Böhnke, Nicole C. Bilz, Megan L. Stanifer, Steeve Boulant, Sandra Bergs, Uwe G. Liebert, and Claudia Claus. 2018. "Rubella Virus Strain-Associated Differences in the Induction of Oxidative Stress Are Independent of Their Interferon Activation" Viruses 10, no. 10: 540. https://doi.org/10.3390/v10100540