An Integrated Planning Framework for Sustainable Water and Energy Supply
by
 , , and
Esmaeil Ahmadi
1,* ,
,
Benjamin McLellan
1 ,
,
Seiichi Ogata
1, 
Behnam Mohammadi-Ivatloo
2,3,* and
and
Tetsuo Tezuka
1 1
Graduate School of Energy Science, Kyoto University, Kyoto 606-8501, Japan
2
Faculty of Electrical and Computer Engineering, University of Tabriz, Tabriz 5157944533, Iran
3
Institute of Research and Development, Duy Tan University, Da Nang 550000, Vietnam
*
Authors to whom correspondence should be addressed.
Sustainability 2020, 12(10), 4295; https://doi.org/10.3390/su12104295
Submission received: 8 May 2020
/
Revised: 17 May 2020
/
Accepted: 21 May 2020
/
Published: 24 May 2020
(This article belongs to the Special Issue Energy Storage Technologies in Future Energy Systems)
Abstract
:This study aims to reveal the economic, technical, and environmental impacts of different system configurations (centralized or decentralized, components, and technologies) on transition plans to achieve a higher share of renewable energy and desalination supplies for regions facing water scarcity. The main contribution of this research is the comparative evaluation of on-grid decentralized or distributed renewable-powered desalination systems for sustainable water and energy supply planning. Applying a novel nexus approach, an interactive multi-period planning model is developed to highlight synergies and to identify conflicts of planning both energy and water sectors at the same time as endogenous subsystems of one overall system. For studying these synergies in this study, the pace of technology deployment and the path of decline in overall costs are assumed to be a function of experience and knowledge as two-factor learning curves. Using data from 81 projects, the levelized cost and capacity factor of utility-scale photovoltaic and wind supplies in the Middle East were calculated. The results indicate that a scenario with a decentralized water sector and renewable-powered multiple-effect distillation technology has the best overall performance among the proposed scenarios.
1. Introduction
Over 2 billion people live in countries under high water stress in 2019 [1]. A United Nations study predicted that, by 2050, under the current average economic growth rate and without improvement in the water sector’s efficiency, the global freshwater demand could increase by 20% to 30% [2]. The ongoing pace of improvement in water sector efficiency is not sufficient to close this freshwater supply-demand gap [1]. Moreover, the potential of remaining freshwater resources that can be harnessed sustainably is limited, and due to steep marginal costs, the water prices are expected to rise [3].
Unconventional water supplies such as desalination are becoming a practical option to meet water demand in the future for specific areas due to climate change, natural and physical water scarcity, freshwater resource security, and access to clean water. Currently, more than 150 countries have already started developing desalination units, with production capacity of around 1% of the world’s total drinking water [4]. Desalination technologies are categorized into two main sub-groups based on the processes they utilize, as phase-change or thermal technologies and single-phase technologies. The primary source of energy for phase-change technologies is thermal energy, while single-phase technologies require electricity or hydraulic energy to operate. Table 1 summarizes these desalination technologies. Reverse osmosis (RO), multi-stage flash desalination (MSF), multi-effect desalination (MED), and hybrid desalination are the current dominant commercialized technologies to desalinate saline water [5].
Although desalination costs have dropped significantly because of technological progress and market maturation, and the environmental impacts of the desalination process, such as high carbon footprint and effluent-associated pollution, are somewhat mitigated, the sustainability of these systems are still under question. Energy is one of the chief factors affecting the sustainability and feasibility of desalination projects. From 30% to more than 50% of desalination costs are expended on energy [6]. Energy affects not only the desalination cost, but also technology adoption. The largest desalination plants located in the Middle East are adopting thermal-process-based desalination technologies, making use of their rich fossil fuel reserves [6]. Currently, fossil fuel resources are the main supply for powering desalination facilities in the world [7]. Renewable-powered desalination is a promising solution to mitigate the carbon footprint and eliminate the dependency of desalinated water costs on fuel prices [8]. Table 2 summarizes studies with renewable-powered desalination units with on-grid energy supplies. As can be observed from this table, centralized topology, RO technology, and solar electricity as one of the energy resources are popular ones in the literature. Due to affordability, availability, and zero-water-consumption for energy production compared to other renewable technologies in the regions facing water scarcity, solar and wind supplies are the most widely deployed renewable resources, which are coupled with desalination technologies. Wind resources account for around 32% and solar resources account for 19% of the total renewable-powered desalination facilities worldwide [9].
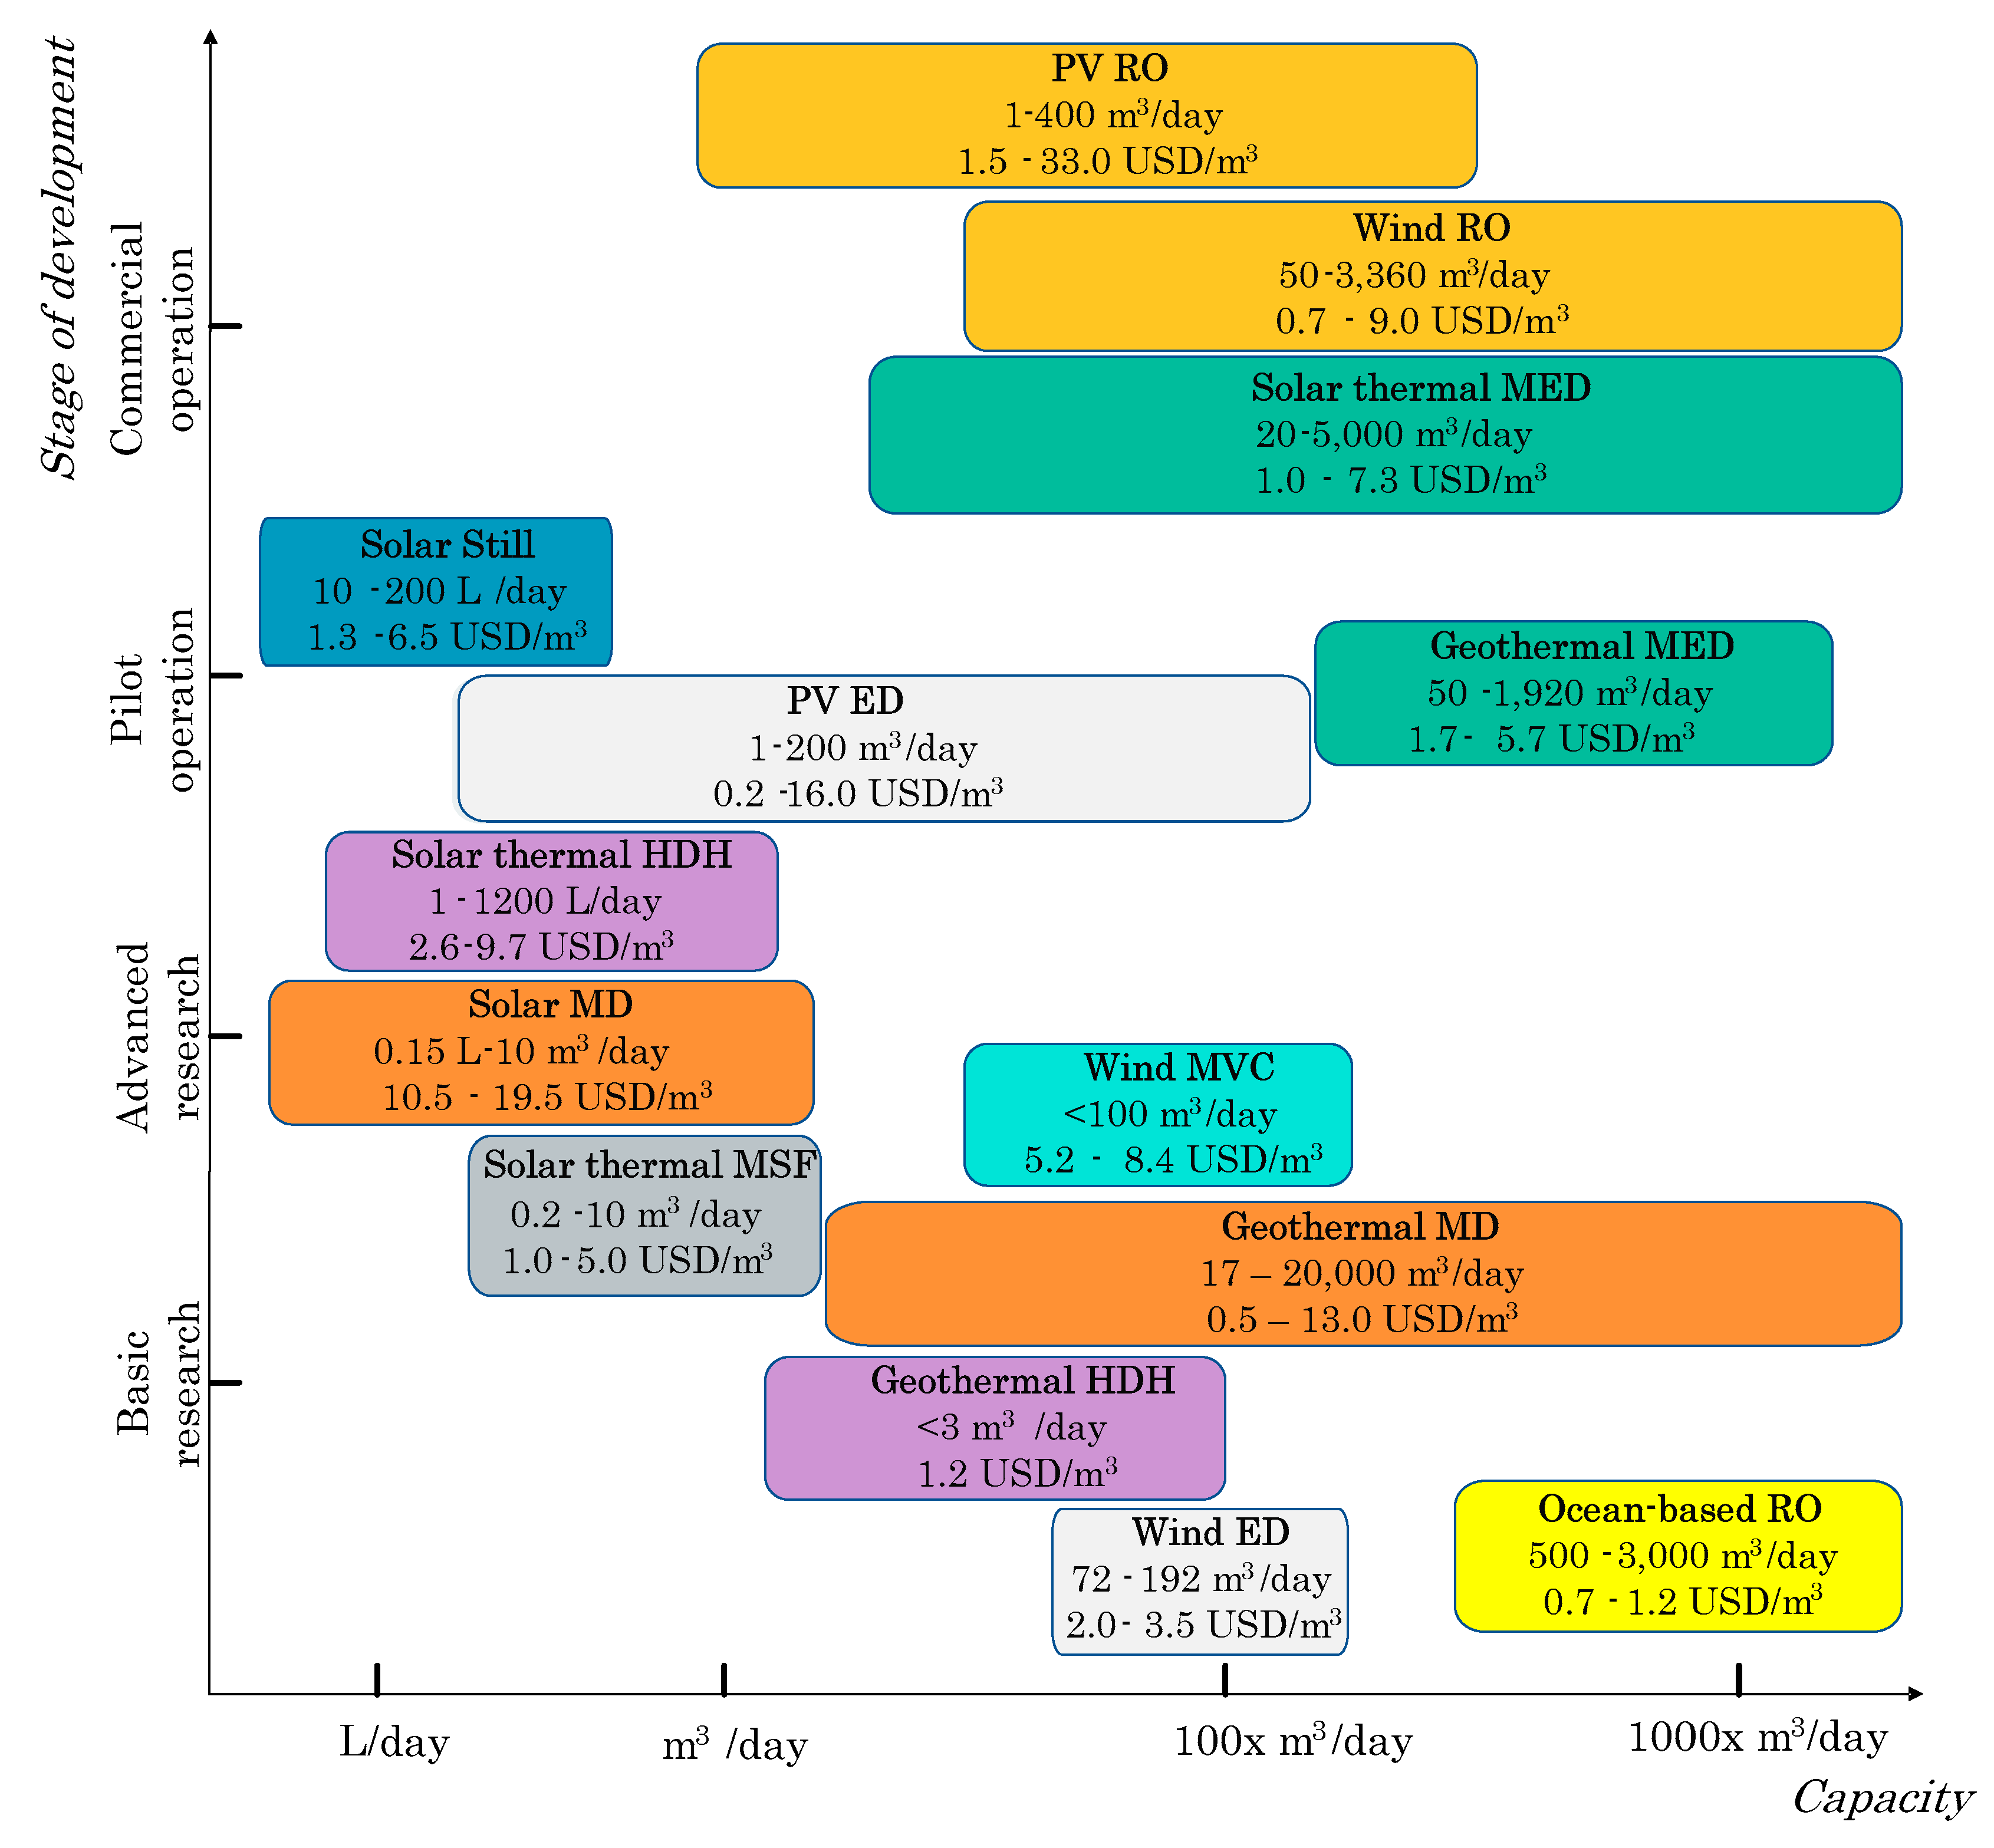
Variable renewable resources (VREs), including wind and solar power, impose fluctuations on energy systems. The future energy sector, with its high share of renewables, needs to ensure secure energy supply [39] in the event of a crisis such as technical failures or potential political conflicts in the case of exchanging renewable electricity with neighboring countries or regions. Variable renewable energy resources are non-dispatchable, therefore they cannot be controlled by operators. This means the future energy sector needs flexible plans to deal with demand shifts or decline in the case of a crisis such as the COVID-19 outbreak. An IEA report showed that full lockdowns due to the coronavirus outbreak caused an average 25% decline in energy demand per week and this decline is equal to 18% for partial lockdowns [40]. The resilience of energy systems with a high share of VREs hinges on exploring solutions to overcome these fluctuations in power generation to avoid instability caused by an imbalance between the supply side and demand side. Large-scale energy storage units increase the capital cost and could make the whole energy system more complicated due to additional compulsory equipment such as charge and discharge controllers, which could make them impractical for renewable-powered desalination systems [41]. Specifically, utilizing batteries, which have high capital costs and relatively short lifetimes, influences the economic feasibility of renewable-powered desalination projects [41,42]. Authors in some previous studies [43,44] have compared the levelized cost of desalinated water for renewable-powered RO units with and without battery storage. The results revealed estimated cost increases from 8.7 $/m3 to 9.2 $/m3 [43] and from 10 $/m3 to 13 $/m3, respectively [44]. Furthermore, high ambient temperature, which is a characteristic of most of the regions facing water scarcity, increases the self-discharge rate of battery units [45]. Figure 1 illustrates the current state of development, the estimated cost of desalinated water, and the potential capacity of renewable-powered desalination facilities (see Appendix E for details).
Desalination units are capable of compensating for the fluctuating power production of VREs to some extent, as water is desalinated whenever energy is available and is stored as a final product [34]. Studies showed that desalination units could be effectively powered by VREs without applying energy storage systems [46]. Each charge-discharge cycle of energy storage systems causes an amount of energy loss (battery systems operate with a typical charge-cycle efficiency of 75% to 98% [47,48]), so this direct consumption of renewable power could improve the efficiency of the renewable energy systems. The levelized cost of energy (LCOE) was shown to decrease by around 3% for a 100-percent-renewable scenario in Saudi Arabia due to the flexibility provided by RO units and the reduction of required battery capacity [14].
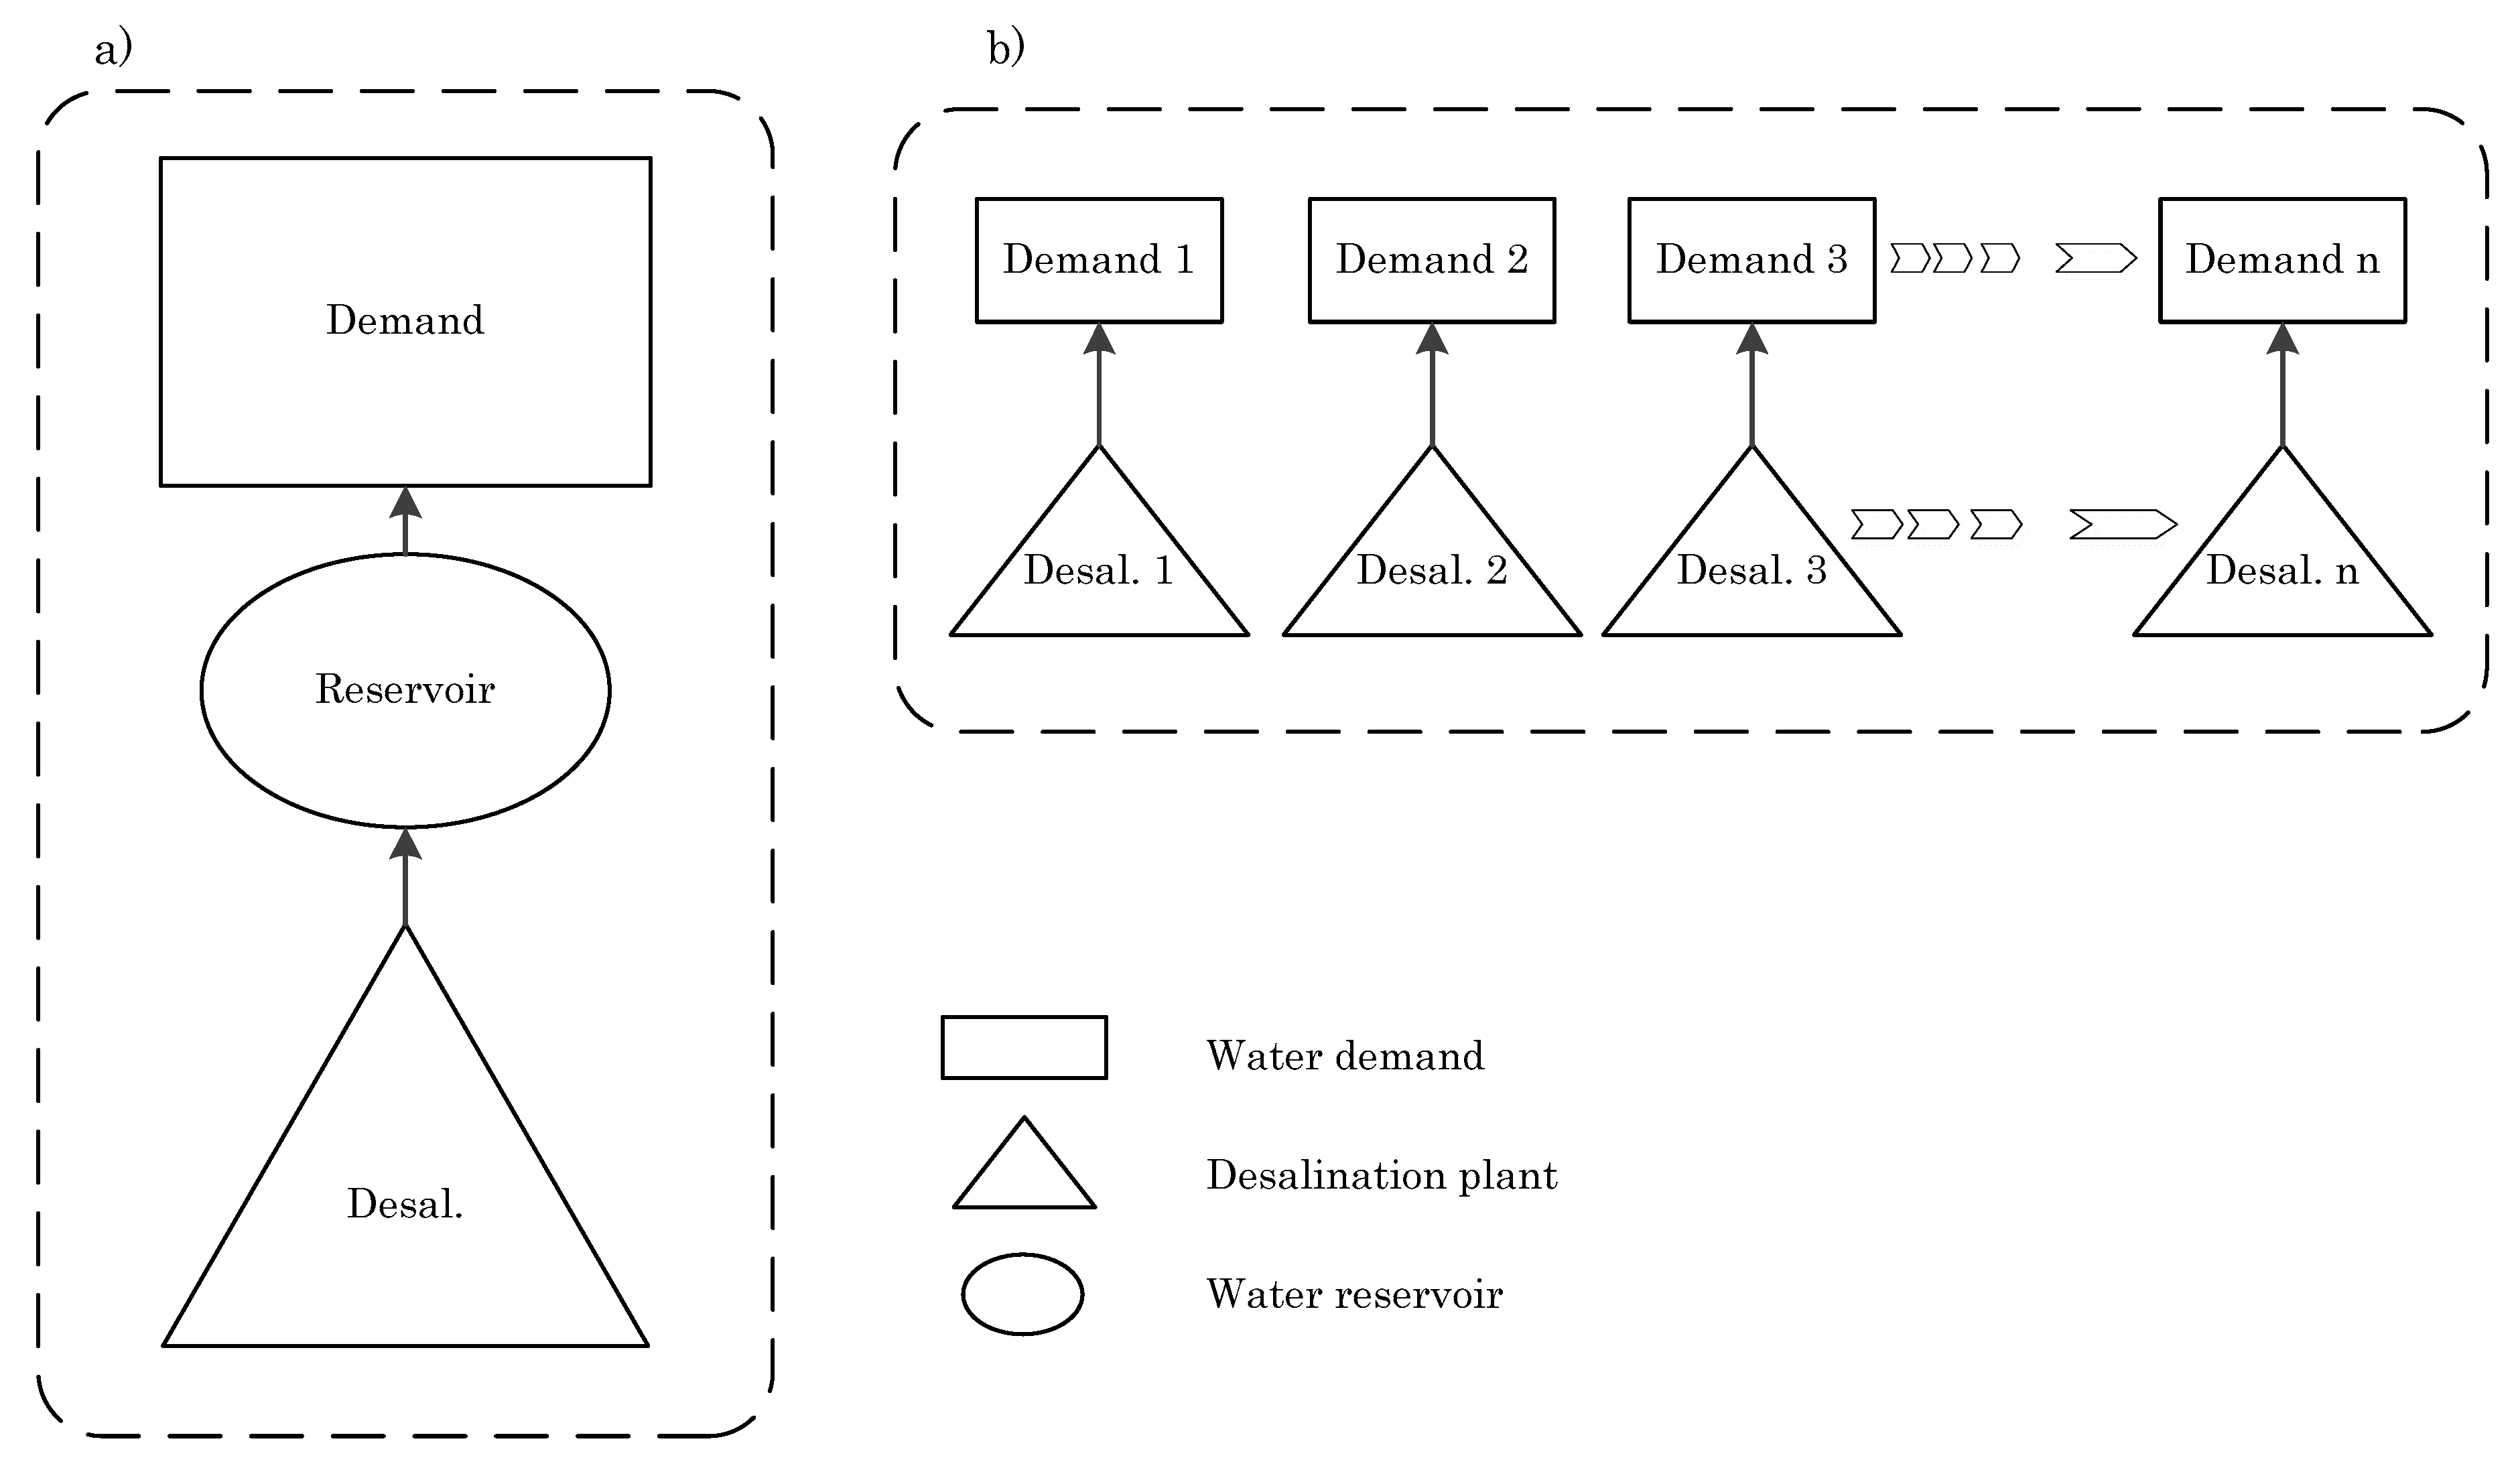
Figure 1 reveals that renewable-powered desalination systems are typically considered to be suitable small-volume desalination, while studies with on-grid energy systems focus on large-capacity desalination facilities. In this study, a centralized desalination system refers to a water system in which saline water is desalinated by one unit and distributed among all target users, while in a decentralized or distributed desalination system, there more than one desalination unitprovide water demand (see Figure 2). As can be seen in Table 2, and to the best of the authors’ knowledge, there is only one study [38], which modeled a water system with more than one unit of desalination for the long-run planning of a water system with on-grid renewable energy resources. This study followed a sequenced approach [38]. After calculating the surplus electricity from roof-top photovoltaics in a region in Australia for only two days during a year through a spatial model, this excess electricity is considered as a yearly fixed energy resource for RO units at zero cost (assumed as waste energy). The proposed system led to the LCOE reduction by 20% for the photovoltaic electricity generation and reducing the levelized cost of desalinated water (LCOW) by 10% compared to the water sector as a fixed electric load.
Moreover, these decentralized desalination systems have the potential to save energy from water distribution by increasing the number of options for site locations of desalination units. Pumps for water distribution are energy-intensive components, which need to be considered for site selection (the location), size of desalination plants, and system configuration (distributed water system with several small-size desalination units or centralized water system with a large-size desalination unit). Studies [49,50] estimated the cost of water transport from coastal desalination plants as summarized in Table 3. It can be seen that for several cases, the cost of water transfer is considerable, relative to the cost of water desalination.
Studies for designing and planning on-grid energy systems with a share of VREs with desalination as a share of the water supply have typically followed a sequenced approach. One sector has been considered as an existing sector with a fixed configuration, based on which the other sector has been planned for the long run. There is a gap in the scope of this field to design and plan both the water and energy sectors at the same time. The operational flexibility of water desalination, transfer, and storage is another key factor that needs to be considered in the long-run planning of VREs, as these flexible loads can help to solve the issues related to the fluctuations of renewable power production. This factor has only been considered in studies that have focused on the operational optimization of these systems. To the best of our knowledge, there is no previous study that compares the long-term planning of centralized and decentralized desalination systems powered by on-grid VREs considering short-term (hourly) operational constraints. These systems have the potential to compensate for the fluctuating power production of variable renewables, to reduce GHG (greenhouse gases) emissions, and to solve effluent-associated environmental issues by providing multiple options for site locations avoiding discharging brine into sensitive ecosystems and distributing the brine.
This study aims to shed more light on potential synergies and conflicts of the transitions to an energy sector with a share of renewables and a water sector with a share of desalination. To this aim, a nexus approach is applied to design the future configuration of both water and energy systems together. More precisely, this study reveals the economic, technical, and environmental impacts of different system configurations (such as centralized, decentralized, and alternative technology mixes) on transition plans to achieve a higher share of renewable energy and desalination supplies for regions facing water scarcity. The authors consider that the current study provides novel insights: (1) Designing and planning both the water and energy sectors at the same time, (2) detailed representation of short-term operational aspects in long-run planning of the water and energy sectors to capture the inherent variability of renewable energy resources, (3) modeling the water sector with centralized and decentralized on-grid renewable-powered desalination systems, (4) proposing a new methodology to study the synergies and conflicts of designing the water and energy sectors as an integrated system/separated system, and (5) estimating the two-factor learning curves for wind, photovoltaic, reverse osmosis desalination, and multi-effect distillation desalination industries in the Middle East.
The remainder of this paper is organized as follows. The research methodology and model developed in this study are explained in Section 2. Furthermore, the case study is introduced in this section. The results of the optimization modules and analysis are illustrated in Section 3 and lastly, the conclusion of this research is summarized in Section 4.
2. Methodology
The nexus approach is deemed necessary to design future, inherently interlinked systems from the starting point of planning in a holistic manner [51]. Concepts such as integrated management consider at least one of the systems as an existing system and are therefore different from the nexus approach. This approach identifies the future systems as inherently interconnected. The nexus approach aims to highlight potential synergies and identify critical conflicts to be dealt with [52]. These outcomes are benchmarks for trade-offs among system integration, increasing complexity to the point where the decision making is delayed or incapacitated; and designing these systems as separated systems with less complexity, but potentially lower efficiency. Moreover, different system configurations could influence the extent of these synergies, conflicts of interests, and complexity.
Two system types (integrated and separated) and two system configurations for the water sector (see Figure 2) are assumed, making a total of four scenarios for investigation in this study, including:
- Base Scenario: The water sector is considered as a centralized system with MED desalination technology.
- C_RO Scenario: The water sector is studied as a centralized system with RO desalination technology.
- D_RO Scenario: The water sector is assumed as a decentralized system with RO desalination technology.
- D_MED Scenario: The water sector is considered as a decentralized system with MED desalination technology.
In the base scenario, the water sector is studied as an exogenous factor for the energy system, in which there is no control over it. In C_RO, D_RO, and D_MED scenarios, both energy and water systems are studied as an integrated system, which are endogenous parts of one integrated system. The energy sector is considered as centralized in all of the above scenarios because of the data limitation for descaling learning curves for variable renewable resources to give sensible differentiation between a set of small-scaled systems and an equivalent large-scaled system.
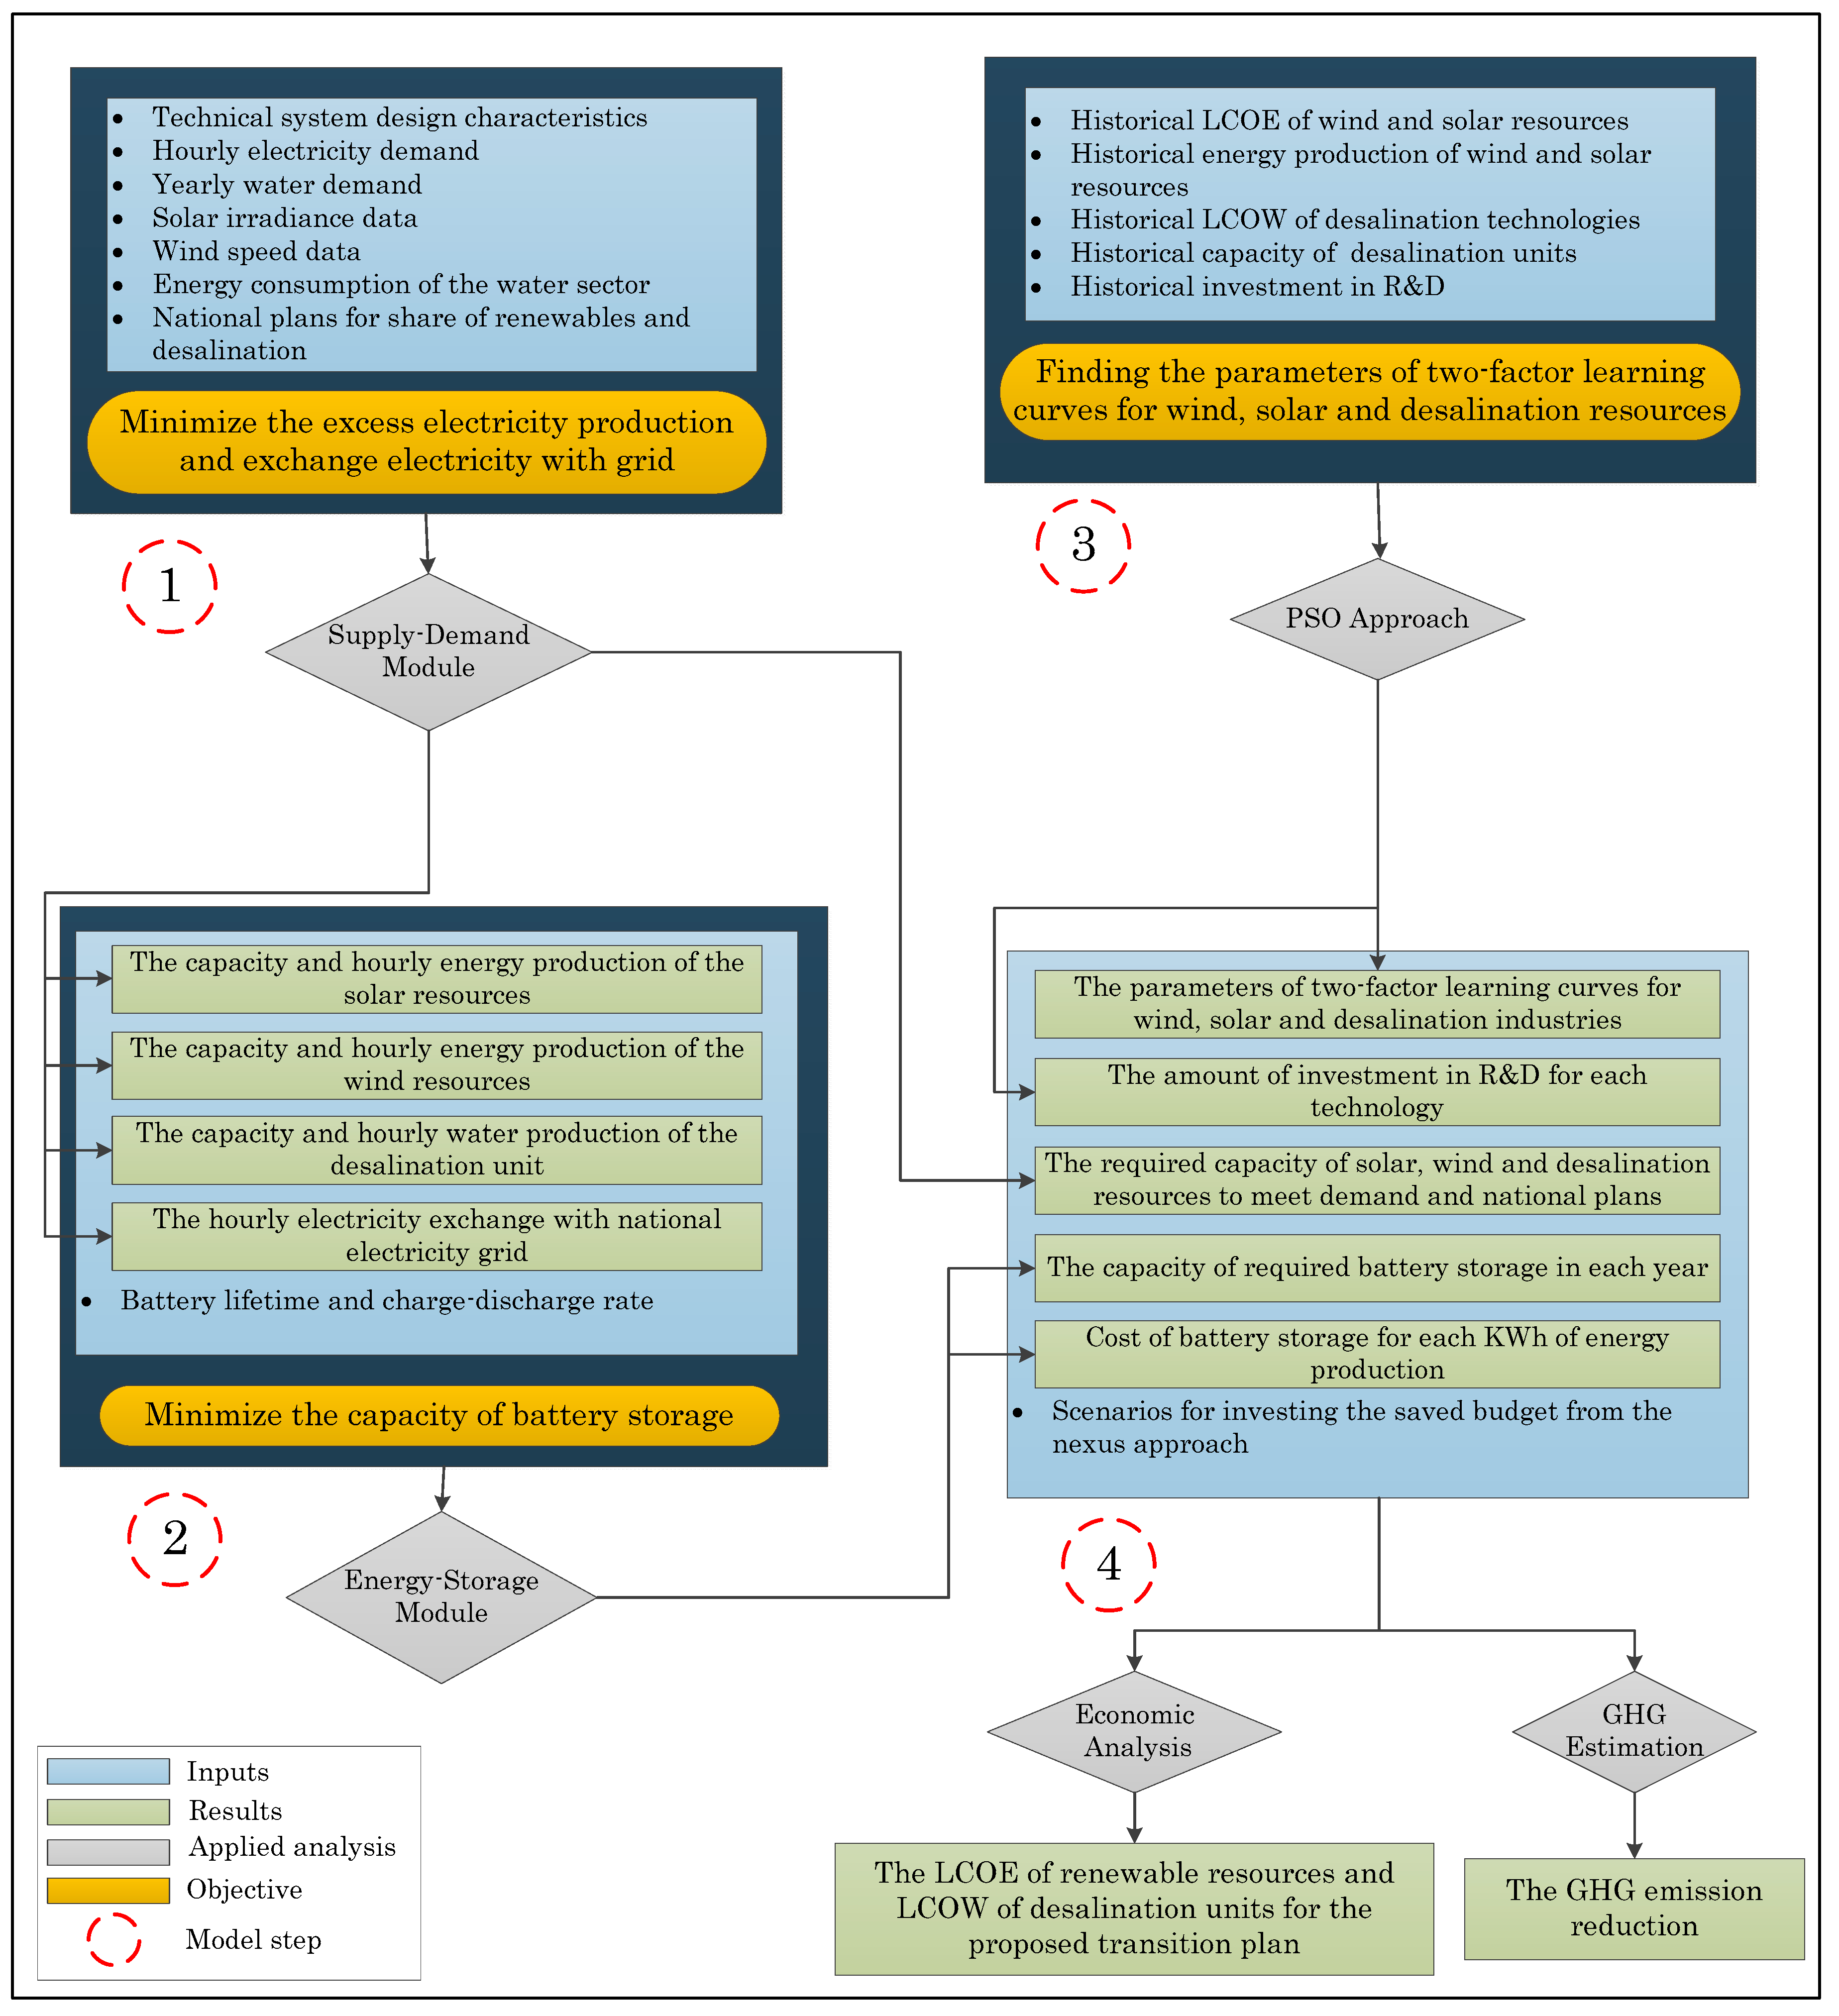
As shown in Figure 3, there are four modules within the model proposed in this study: (1) Proposing a supply-demand module, (2) developing an energy storage module, (3) estimating the learning curves for the region of the case study, and (4) conducting economic analysis and calculating GHG emissions reduction.
I Supply-demand module
A supply-demand module is developed as the first step of the proposed model, to study the technical aspects of the proposed scenarios. The energy demand is estimated based on demographic trends and historical data. System configuration and national plans and targets are taken into account in this optimization module, which is described in detail in Appendix A. The module is developed and solved as a linear problem. The objective function is to minimize the electricity exchange with the national grid, as follows:
where is the absolute value of hourly electricity exchange with the electric grid. includes both negative (selling electricity to the grid) and positive values (purchasing electricity from the grid).
II Energy storage module
The energy storage module is developed to find the required battery capacity equivalent to the operational capacity of the flexible water sector. This optimization model is described in detail in Appendix B. The new required capacity of battery storage for each year and the cost of this battery storage for a unit of variable renewable energy generation (MWh) are calculated using the results of the supply-demand module. The objective function is to minimize the capacity of batteries () equivalent to the operational capacity of the flexible water sector in each year as:
III Learning curves
Learning curves have been applied as a practical approach of looking at the pace of technology deployment and the path of cost reduction. As the underlying assumption of the learning curve, experience, knowledge, and other factors can improve technology performance that leads to unit cost reduction with the accumulation of factors mentioned above. The one-factor learning curve, which was popular in the mid-1970s, only reflects the effect of experience (cumulative production), whereas the two-factor learning curve considers the influence of both experience and knowledge. Studies have shown that the one-factor learning curve overestimates the impact of experience [53].
Modeling the pace of technology deployment and the path of cost reduction just as a function of time , which is the most frequent approach among studies [54], is not practical, because it does not allow the consideration of synergistic effects of an integrated energy-water transition study but supports a separation of the systems because both energy and water systems will see cost reductions at the same rate regardless of integration. In this study, the path of cost reduction is modeled by the two-factor learning curve and is assumed to be a function of experience and knowledge (), which is explained in Equation (3) [55]. The two-factor learning curve is described in more detail in Appendix C.
where describes the unit cost of technology, is the initial unit cost, is the cumulative production, depicts the learning-by-doing elasticity, is the knowledge stock, and is the learning-by-searching elasticity.
Based on this learning curve, the technology cost decreases by increasing the cumulative production as well as investment in research and development (R&D). In the two-factor learning curve, learning-by-doing (LDR) and learning-by-searching (LSR) illustrate this decreasing technology cost denoting the percentage of variation in cost as a result of doubling the cumulative production and R&D investment, respectively. The LDR is calculated as and the LSR is obtained as .
Due to a lack of data, a new approach is developed to estimate the learning-by-searching ratio of the two-factor learning curve and the average R&D budget using particle swarm optimization. The details of this approach are described in Appendix C.
IV Economic analysis and GHG emissions
To reveal the synergistic effects, conflicts, and the influence of the system type and shape, the results of the previous modules are used to assess the future cost of variable renewable energy and desalinated water for the proposed scenarios for the region of the case study. Furthermore, the potential of each scenario in decreasing GHG emissions is calculated. Finally, a sensitivity analysis is conducted to evaluate the effect of R&D investment on the technologies.
Case Study
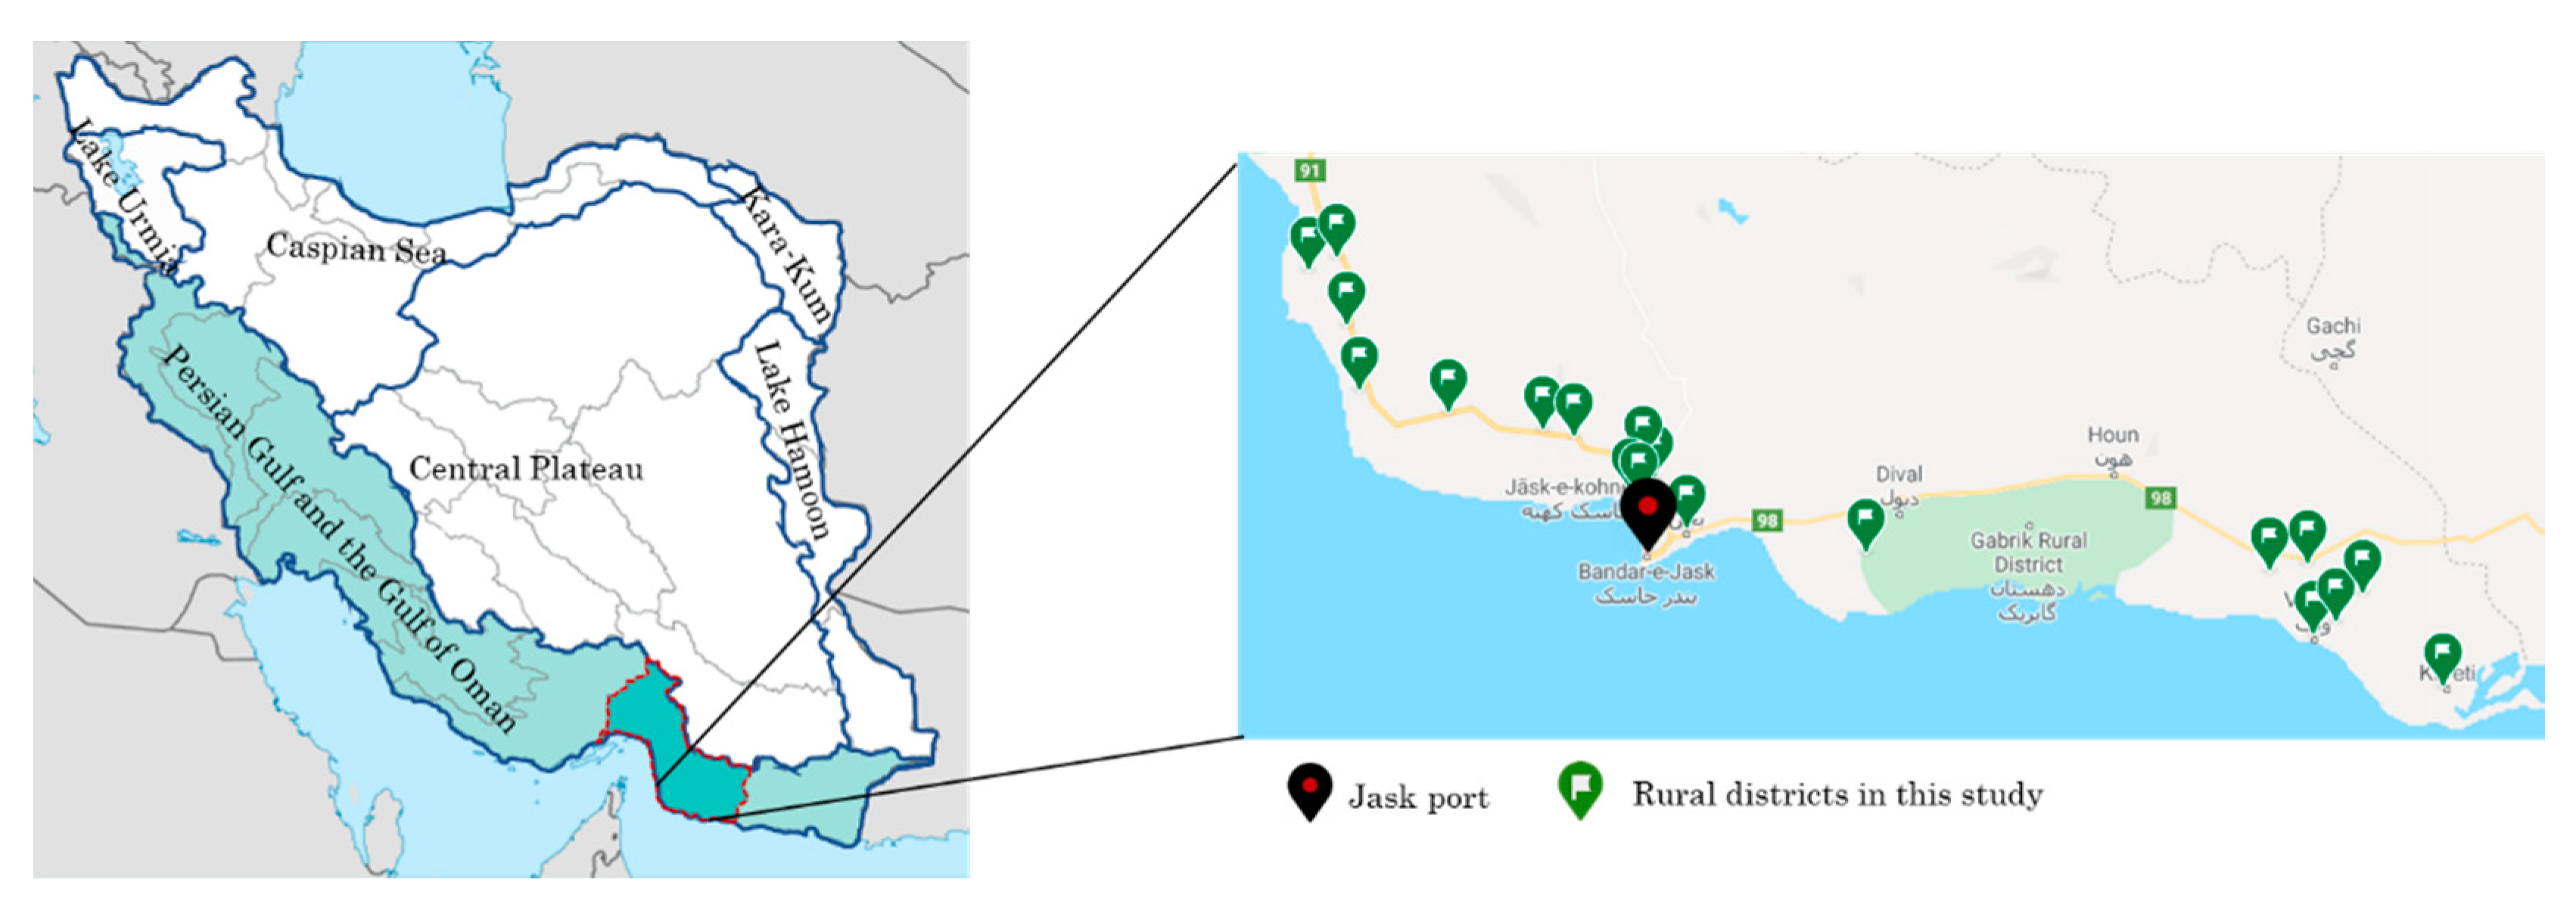
The southern coast of Iran, which is facing severe water scarcity [56], is chosen as a case study. This region has ready access to seawater for desalination from the Persian Gulf and the Gulf of Oman. As can be seen in Figure 4 [56], Iran has 6 main and 31 secondary water basins. The six main drainage basins include the Caspian Sea basin in the north, the Central Plateau in the middle of the country, the Persian Gulf and Gulf of Oman basin in the west and south, the Kara-Kum basin in the north-east, the Lake Urmia basin in the north-west, and Lake Hamoon basin in the east [56].
The Persian Gulf and Gulf of Oman basin has ready access to seawater, giving four provinces inside this water basin, which are considered as the region of the present case study, to deploy desalination as a source of freshwater.
The region of the case study also has great potential to generate solar and wind power, which are taken as the VRE resources in the current study. In this region, the hourly average wind speed is 3.26m/s and the daily average solar radiation is equal to 5.63KWh/m2/day [58].
Jask county has a hot desert climate with sweltering summers and little precipitation, situated on the Gulf of Oman. A port town (see Figure 4), the capital of the county, also named Jask, is the case study as an urban area (small town) with a population of 16,860 at the 2017 census [59]. To model a decentralized water sector for rural areas, 19 rural districts are selected (see Figure 4), which are inside Jask county and have access to seawater for desalination. The total population of these districts is 16,855 in order to be readily comparable with the centralized case (see Appendix D for details) [59]. Due to a lack of data, it is assumed that the water demand of these 19 rural districts is equal to Jask port and distributed as a proportion of their population.
3. Results and Discussion
In this section, first the results of the supply-demand module and the energy storage module for the proposed scenarios the case study (Jask, Iran) are explained. These outcomes are the baseline for technical, economic, and environmental analysis for the whole region in the southern coast of Iran.
All water, energy, and technology-related costs in this study were converted to 2018 United States dollars ($).
3.1. Supply-Demand Module
In the 2015 Paris Climate Agreement, COP21, Iran pledged to meet a target of 7.5 GW of renewable electricity generation capacity by 2030 [60]. According to the Iranian Sixth National Development Plan, the Ministry of Energy and the Renewable Energy Organization, which are Iran’s leading electric utility and subsidiaries, are assigned a target of supplying 5% of total electricity demand from renewables by 2021 [61]. Moreover, according to the Iranian National Strategic Energy Plan, Iran aims to reach competitive costs for renewable power production by 2040 and increase the current renewable deployment rate, which is around 1% yearly. The Iranian Ministry of Energy has proposed comprehensive plans to hit the aforementioned targets, such as a feed-in tariff mechanism and long-term contracts at guaranteed prices, extended from five-year contracts to 20-year contracts from 2015 [62]. In this study, the growth rate of VREs’ share of total electricity supplies is assumed to be 2% per year by 2040.
For the water sector, according to the Iranian Sixth National Development Plan, the Ministry of Energy is assigned to propose a plan for transferring required knowledge and providing sufficient financial support toward supplying 70% of the urban water demand on the shoreline of the Persian Gulf and the Gulf of Oman by 2021 from desalination [61]. This study assumes a linear increase for the expansion of desalination across the period to meet the 70% target.
Ten days in each season, for a total of 40 days as representative of each year, are chosen (due to a software limitation) as the short-term operation horizon for each year between 2020 to 2040 as the long-run planning horizon to solve the linear supply-demand module. The module is coded into GAMS 26.3.5 [63] and solved by CPLEX solver for the sample county (Jask, Iran).
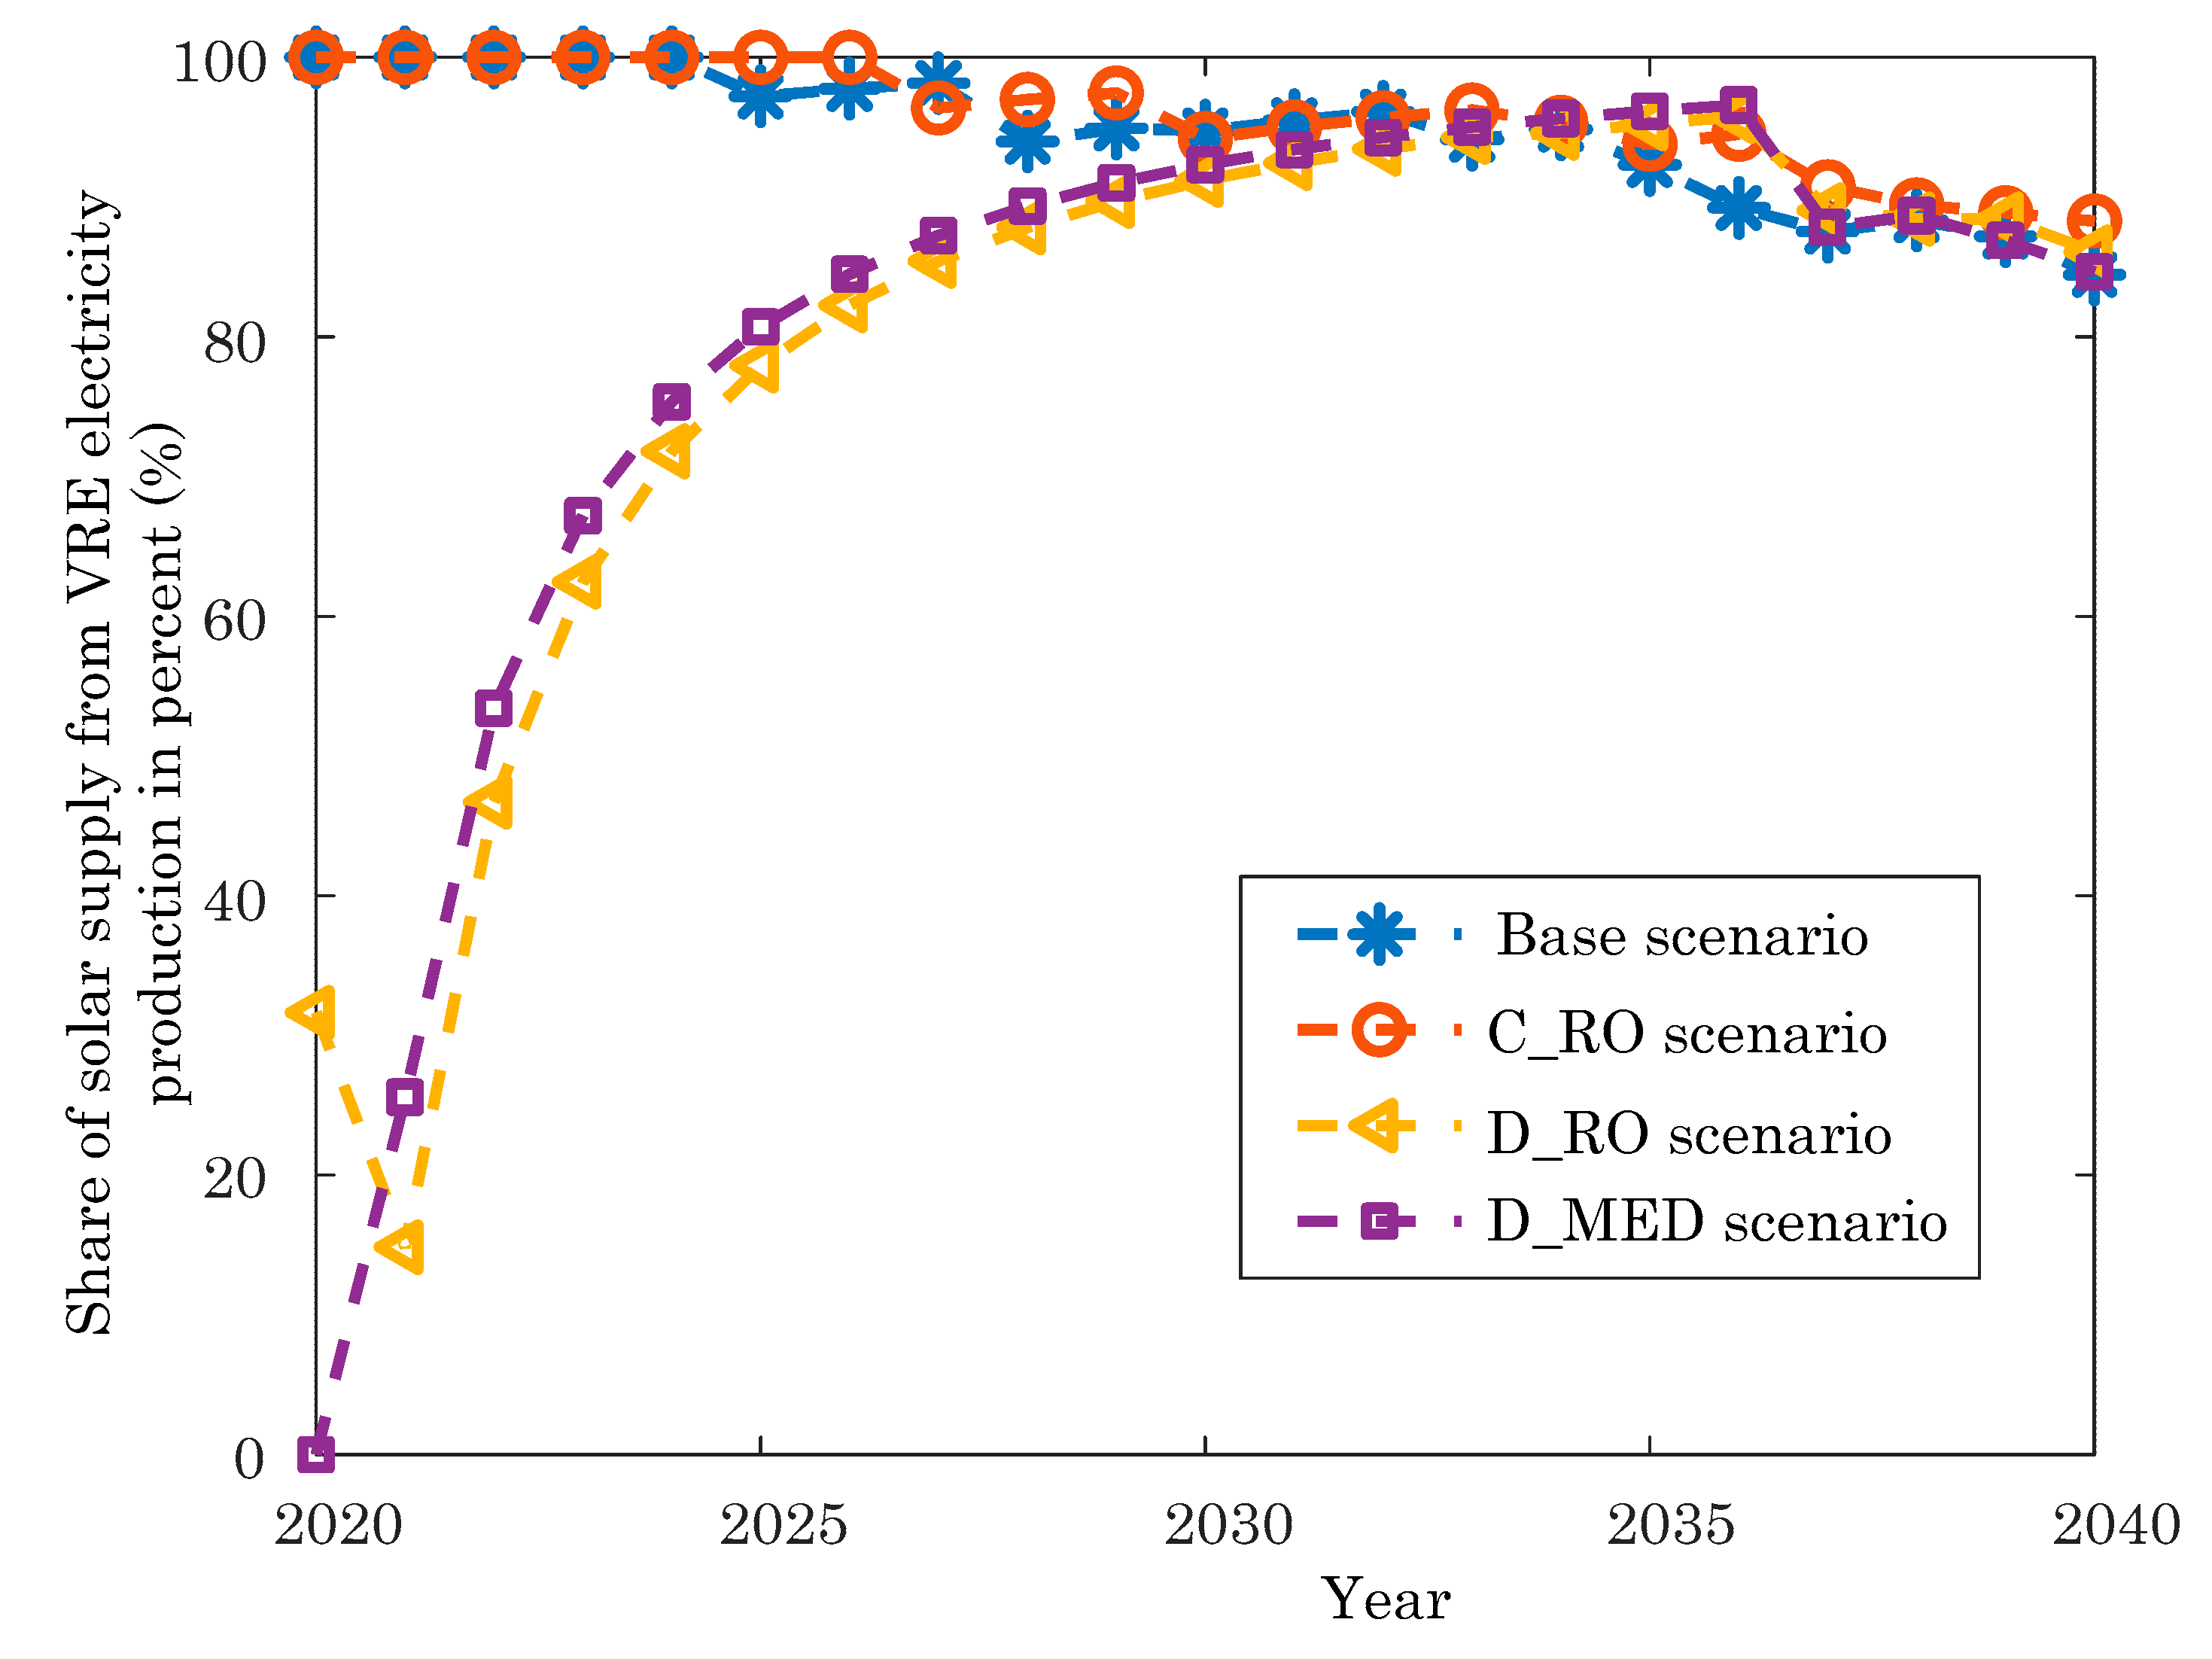
The total renewable electricity production for each scenario is the same (68,371 MWh from 2020 to 2040, 40 days each year). The optimal yearly capacity of wind supply, photovoltaic (PV) supply, and desalination plants are obtained for the proposed scenarios. The hourly water production of each desalination plant, the amount of stored water in the city’s reservoir (for the base and C_RO scenarios), the amount of water stored in the desalination unit’s reservoir, the amount of water pumped from the desalination reservoir (for the base and C_RO scenario), and the amount of hourly water extraction from the conventional water sources are the other variables of this model to meet the mentioned target share of VRE and desalination production. The share of PV and wind in the total VRE electricity production is depicted in Figure 5 and Figure 6. For D_RO and D_MED scenarios, the share of solar electricity rises from 32% and 0% of total renewable electricity generation in 2020 to 86% and 85% in 2040, respectively, while for the base and C_RO scenarios, the share of solar electricity production from the total VRE electricity production declines from 100% in 2020 to 85% and 88% in 2040, respectively. As can be seen in Figure 5 and Figure 6, solar electricity performs better in following the electrical load pattern in this case study and with a share of more than 85% of total VRE, electricity production is the dominant renewable resource for all the scenarios.
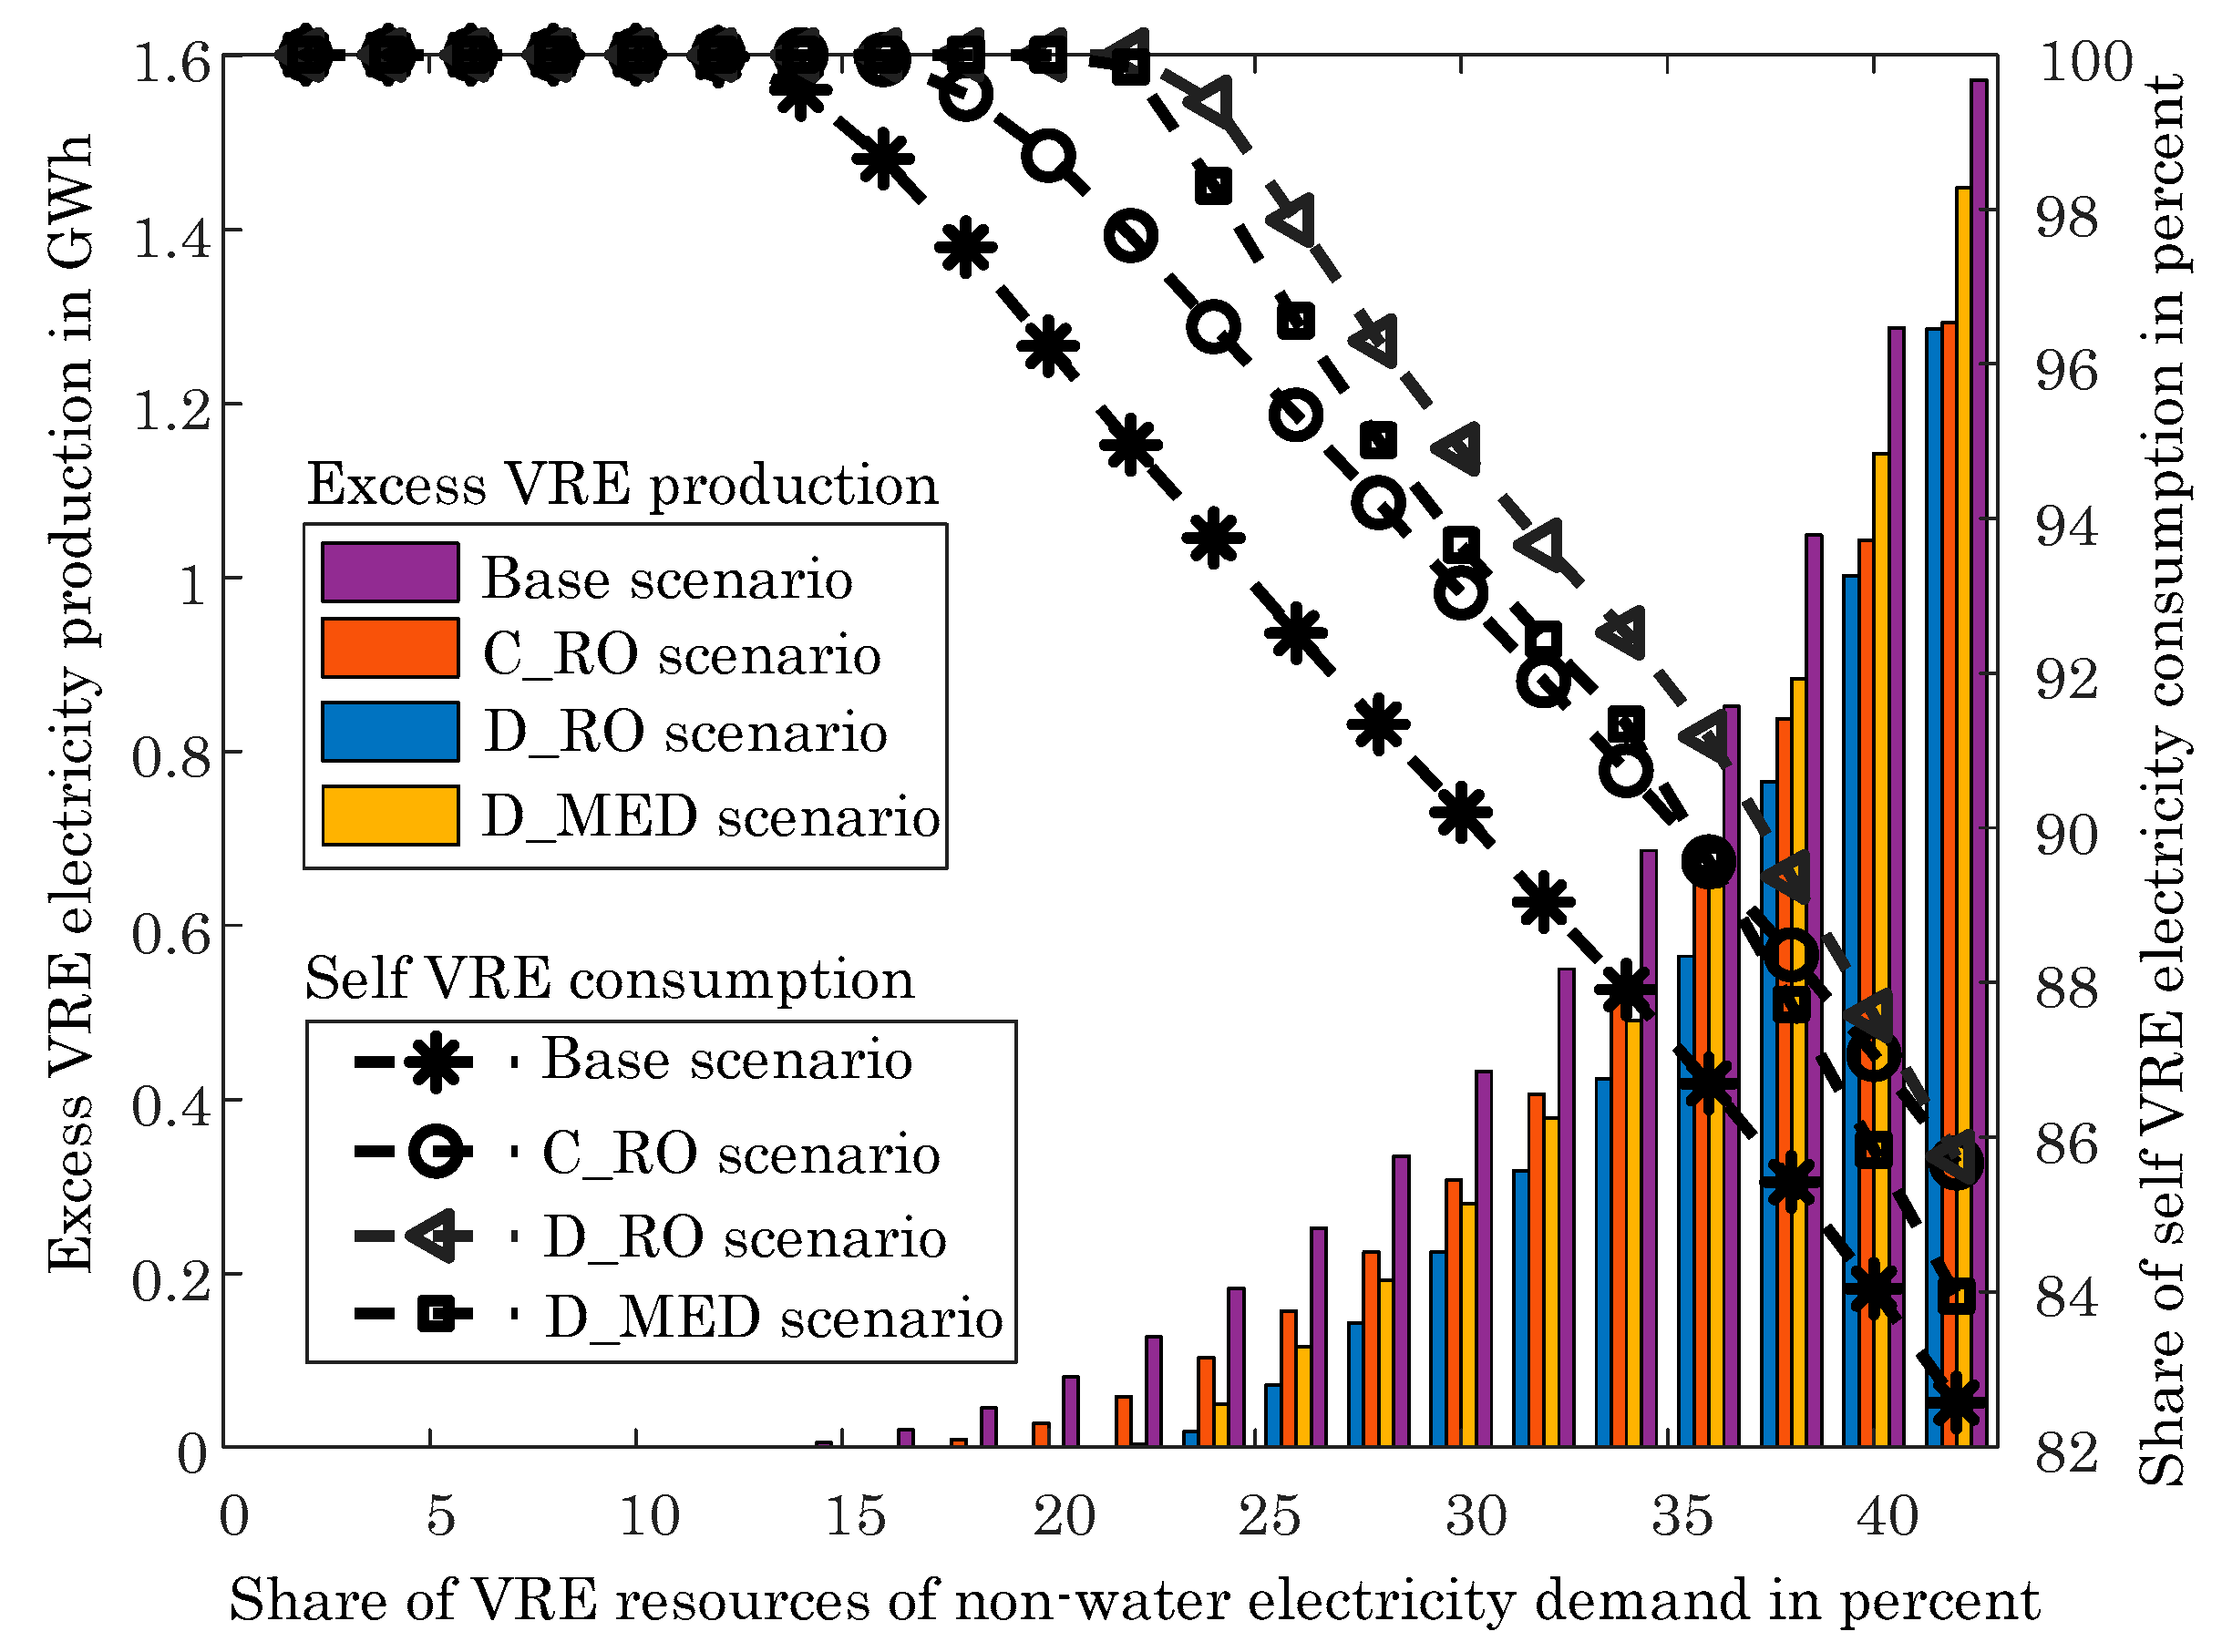
Mismatches between VRE electricity generation profiles and electric demand due to the variability of VRE power generation can cause instability in electricity grids. The portion of VRE electricity generation exceeding the electric load is defined as the excess renewable electricity generation in this study, and self-consumption refers to a portion that is consumed directly by the county of the study and is not fed into the national electricity grid. Figure 7 shows the amount of excess electricity generation and share of self-consumption from the entire VRE electricity generation for all the scenarios. The amount of excess power generation from VREs in 2040 reaches about 17.4% of total renewable electricity generation for the base scenario, while this excess energy generation is around 14.3% for the C_RO and D_RO scenarios and 16.1% for the D_MED scenario.
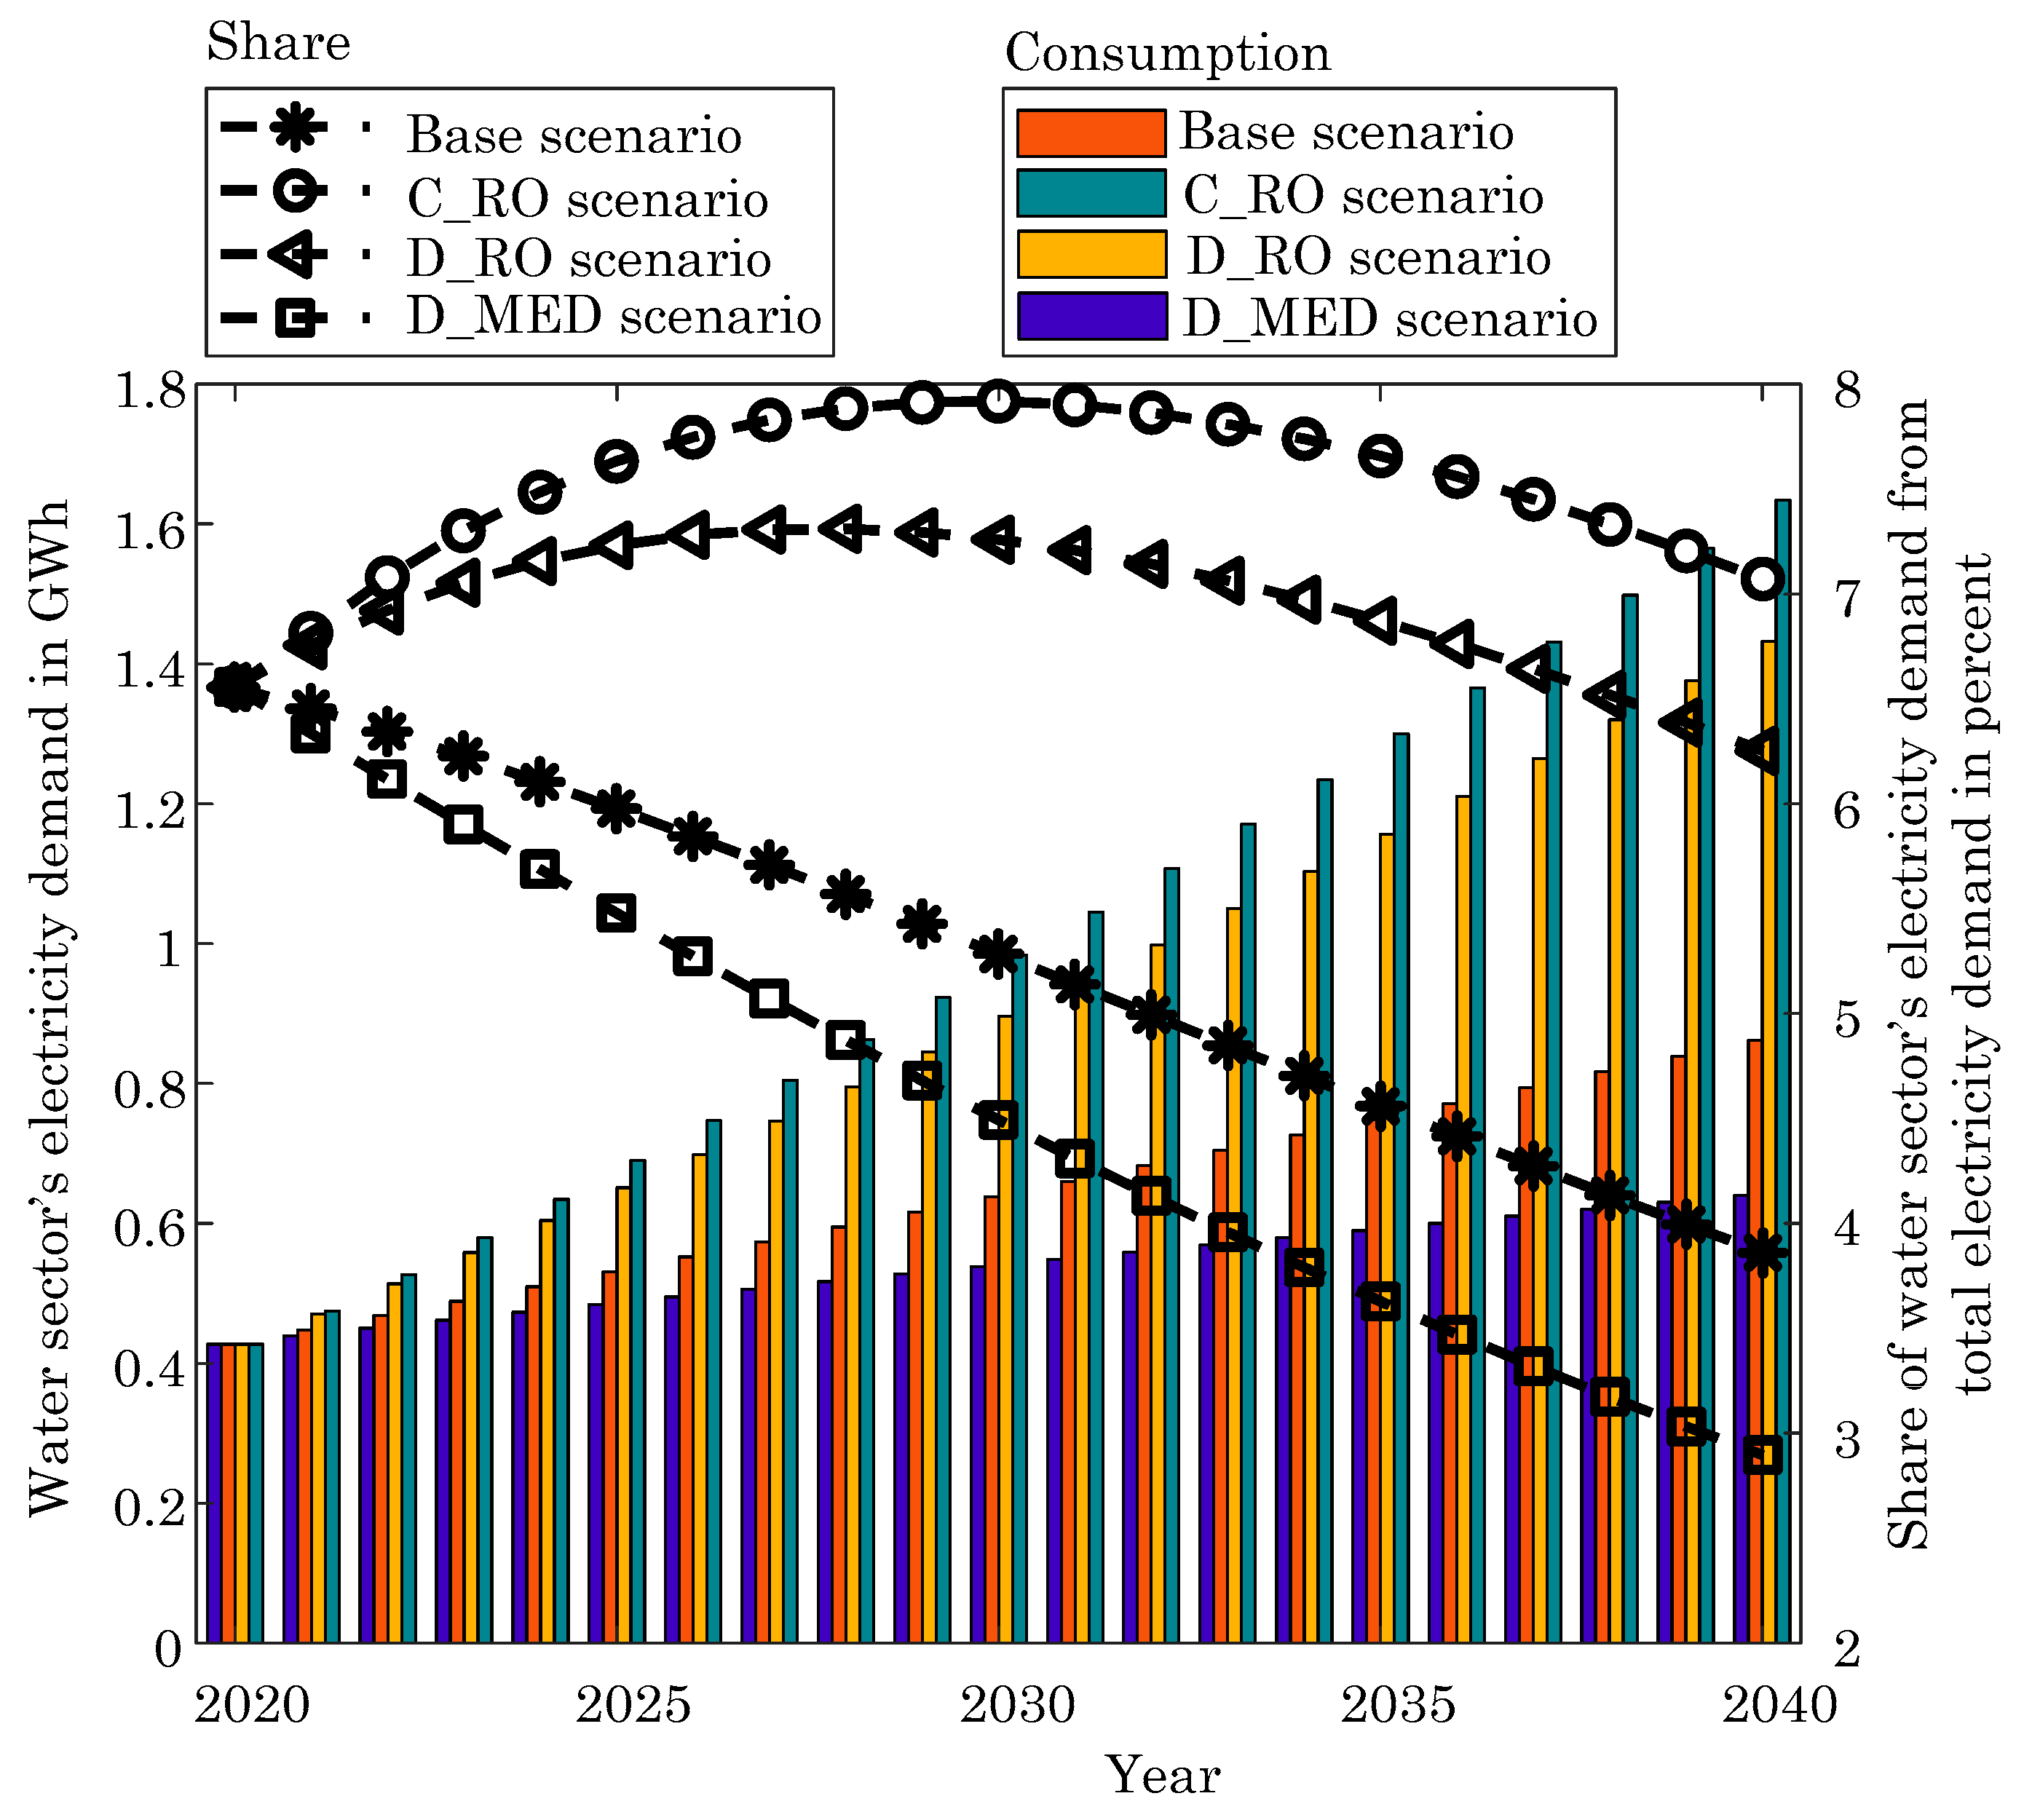
Figure 8 depicts the electricity demand of the water sector and its share from the total electricity demand. Although the water sector’s electricity demand is rising for all the scenarios from 2020 to 2040 (due to a higher portion of desalination and demand growth in proportion to Iran’s population growth [64]), its share from the total electricity demand shrinks from 6.6% in 2020 to 3.9%, 6.3%, and 2.9% for the base, D_RO, and D_MED scenarios in 2040, respectively. For the C_RO scenario, this share rises slightly from 6.6% in 2020 to 7.1% in 2040. This comes from differences between the yearly growth rate of water demand influenced by the population growth in the current module and the growth rate of electricity demand, which is a constant (a 6.5% yearly growth based on national data predictions [59]). The RO desalination technology requires more electricity to desalinate water (4 KWh/m3) compared to the electricity consumption of MED technology, 1.5 KWh/m3 in this study. As a result, scenarios with RO technology, the C_RO and D_RO scenarios, have a higher electricity demand compared to the scenarios with MED technology, the base and D_MED scenarios. Furthermore, as can be seen in Figure 8, the scenarios with the decentralized water sector, the D_RO and D_MED scenarios, benefit from energy-saving due to less electricity consumption for water distribution.
3.2. Energy Storage
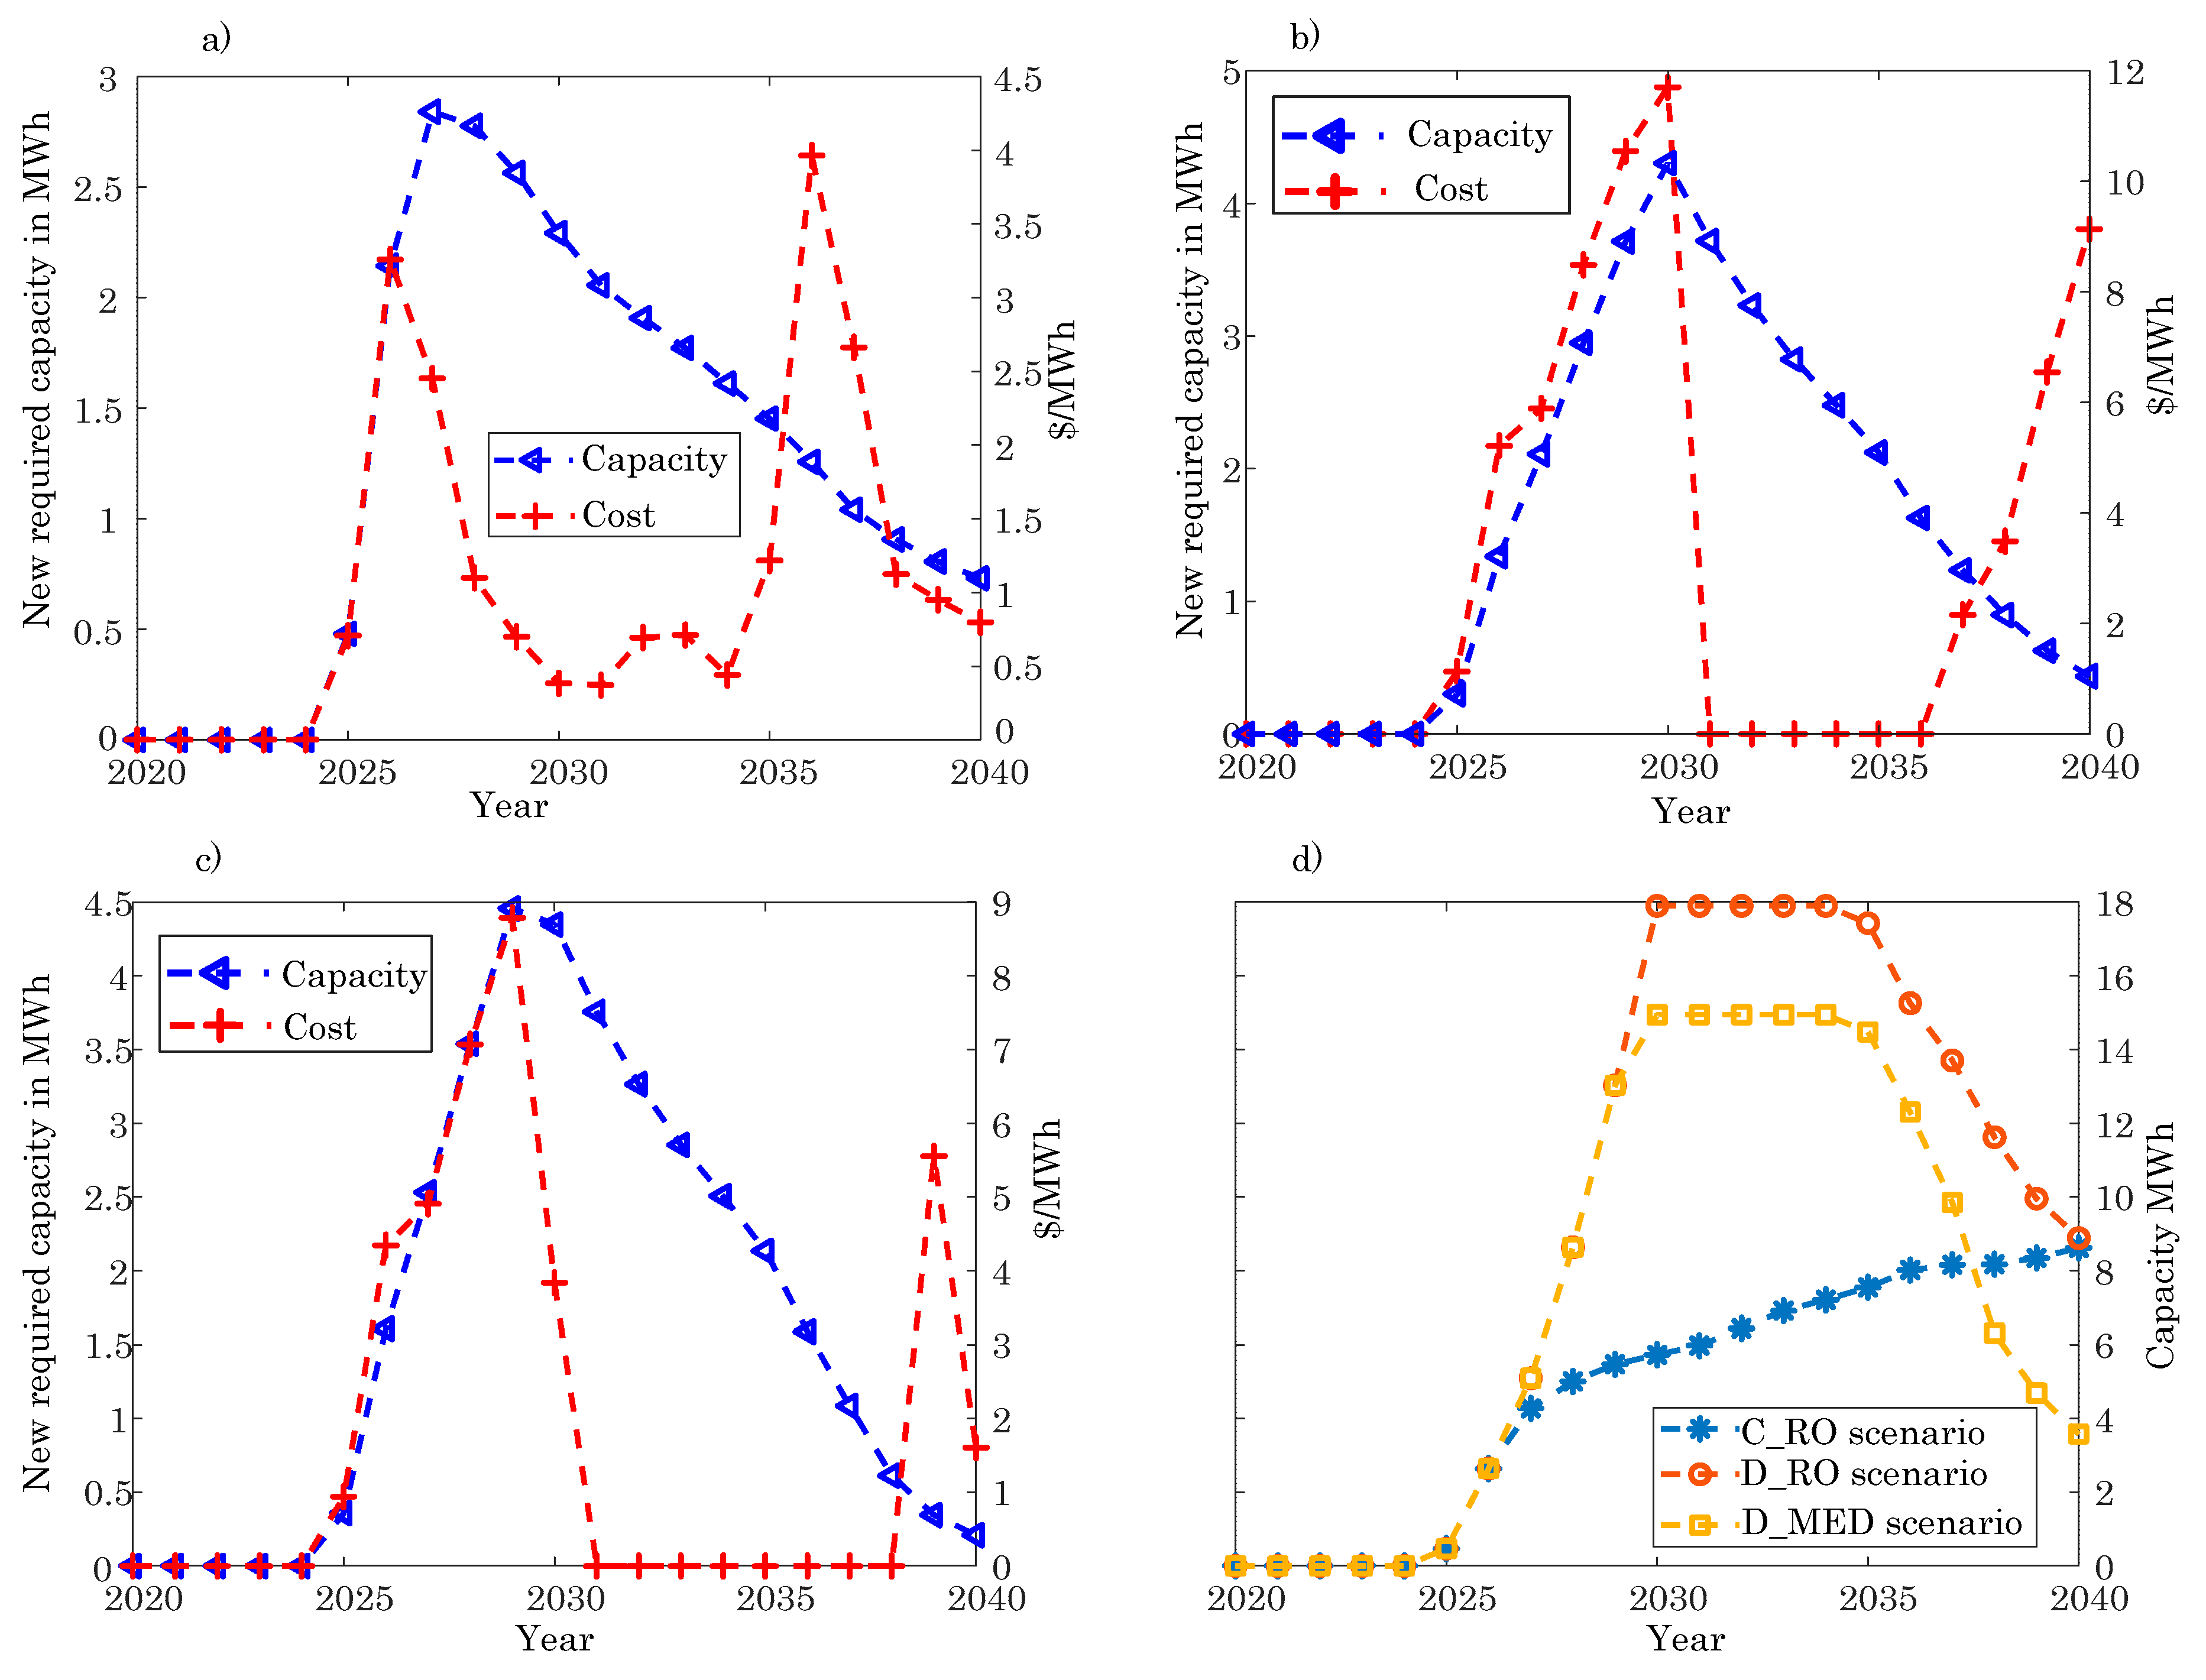
In the next step, based on the results of the supply-demand module, an optimization problem was solved using GAMS software [63] to find the required batteries equivalent to the operational capacity of the flexible water sector. Annual equivalents of the lump sum unit investment cost of the required batteries are determined to calculate the cost of batteries for a unit of VRE electricity production (MWh/$). This annual equivalent of the lump sum unit investment cost of each technology is defined as a stream of equal annual debts over the lifetime of the technology, in such a way that the present value of the stream is equivalent to the lump sum unit investment cost for each technology. The results of this optimization module are summarized in Figure 9.
The flexibility of the water sector as an electric load in D_RO and D_MED reaches its highest capacity between 2030 to 2034, at about 18 MWh and 15 MWh, respectively. This flexibility is lower in the C_RO scenario compared to the scenarios with the decentralized water sector in most of the studied time horizon, which was not expected due to stricter constraints on the decentralized water sector (see Appendix A). This flexibility is sensitive to the share of each VRE supply in the total renewable power generation. In the scenarios with the decentralized water sector, by reaching above 90% share of solar electricity in total VRE power generation in 2030 (see Figure 5), the equivalent capacity of batteries reaches the highest value and starts declining after 2035, when the portion of wind electricity is increasing (see Figure 6). This means the decentralized water sector has local optimum flexibility around 90% share of solar electricity in the total VRE power generation. For the C_RO scenario with the centralized water sector, the equivalent battery capacity is growing with the rising share of wind electricity in total VRE power generation (see Figure 9d). This shows that the centralized water sector operates more flexibly with a higher percentage of wind electricity compared to the decentralized water sector. It is noteworthy to mention that the objective function of the supply-demand module, the results of which are the baseline for the current storage module, is to find the optimal capacity of VRE supplies for reaching minimum overall electricity exchange with the national grid, which is not identical with finding the maximum flexibility of the water sector as an electric load.
The cost of batteries for a unit of VRE electricity generation falls in several periods, although the equivalent capacity is constant or decreasing, for instance, in Figure 9b for the D_RO scenario, from 2030 to 2035. This is due to an assumption in this study that the cost of lithium-ion batteries will decrease by 40% by 2040 [65,66] causing a lowering of costs while the equivalent battery capacity is constant or decreasing.
3.3. Learning Curve
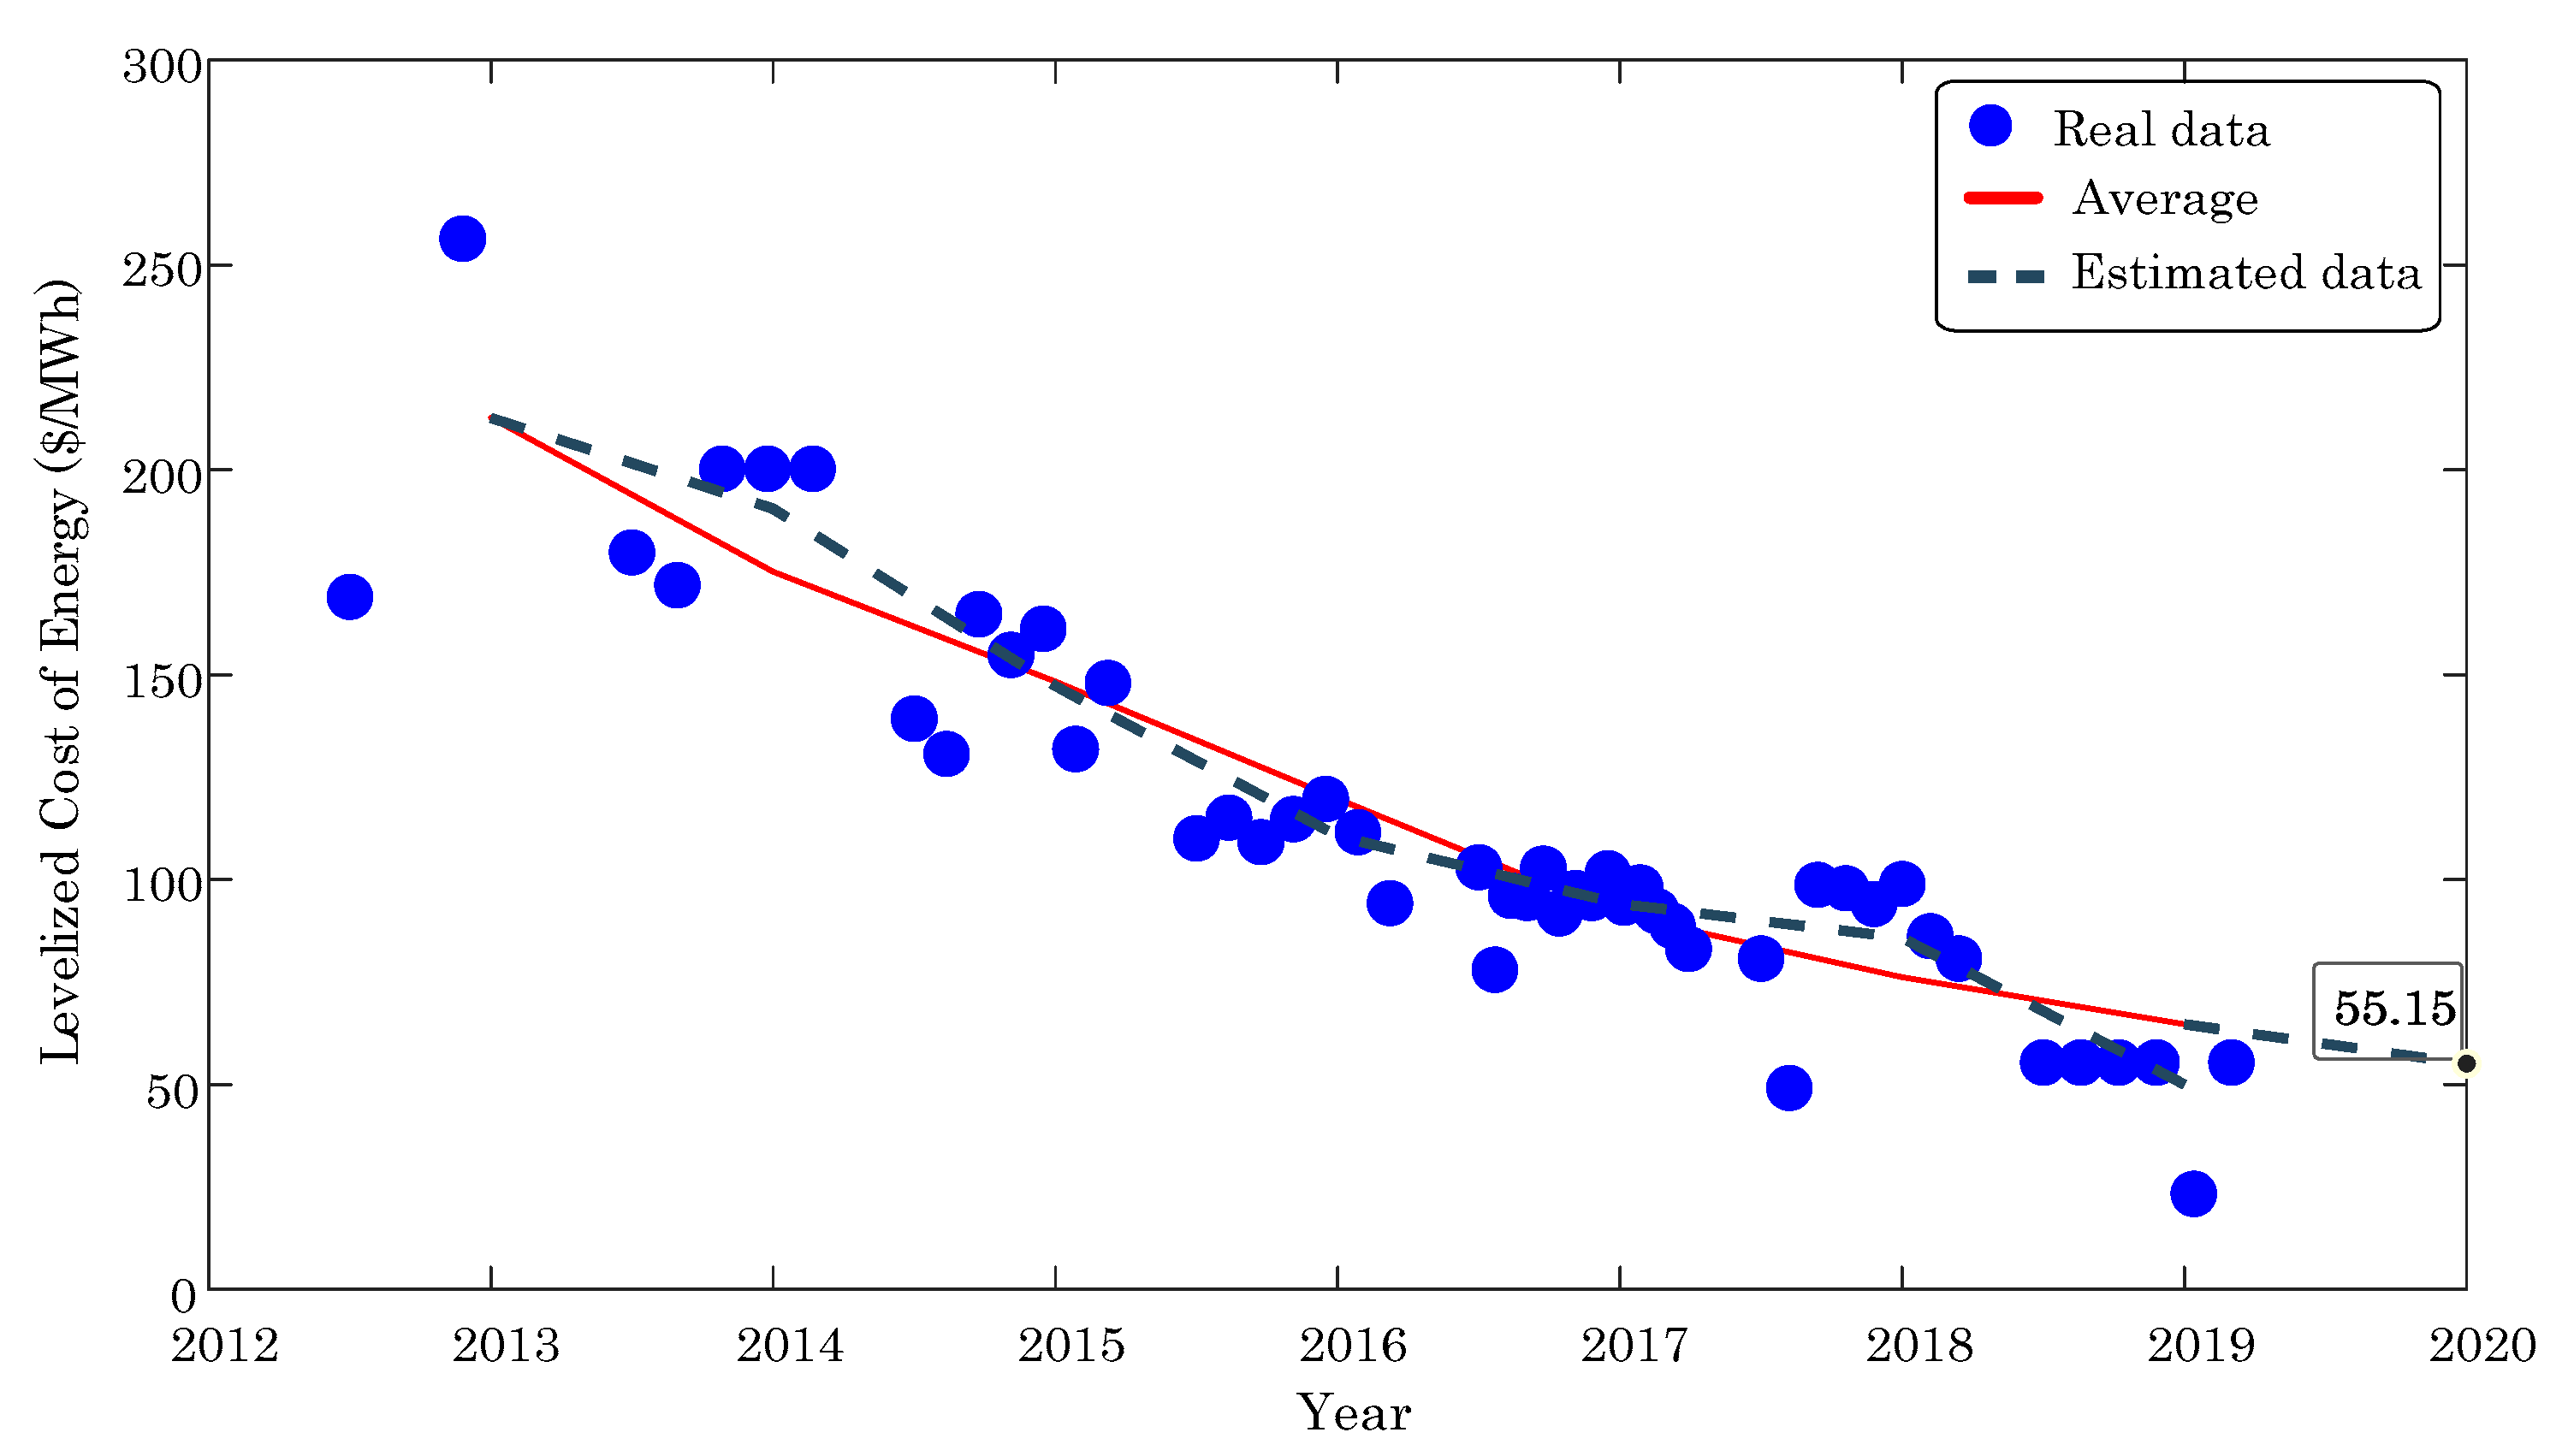
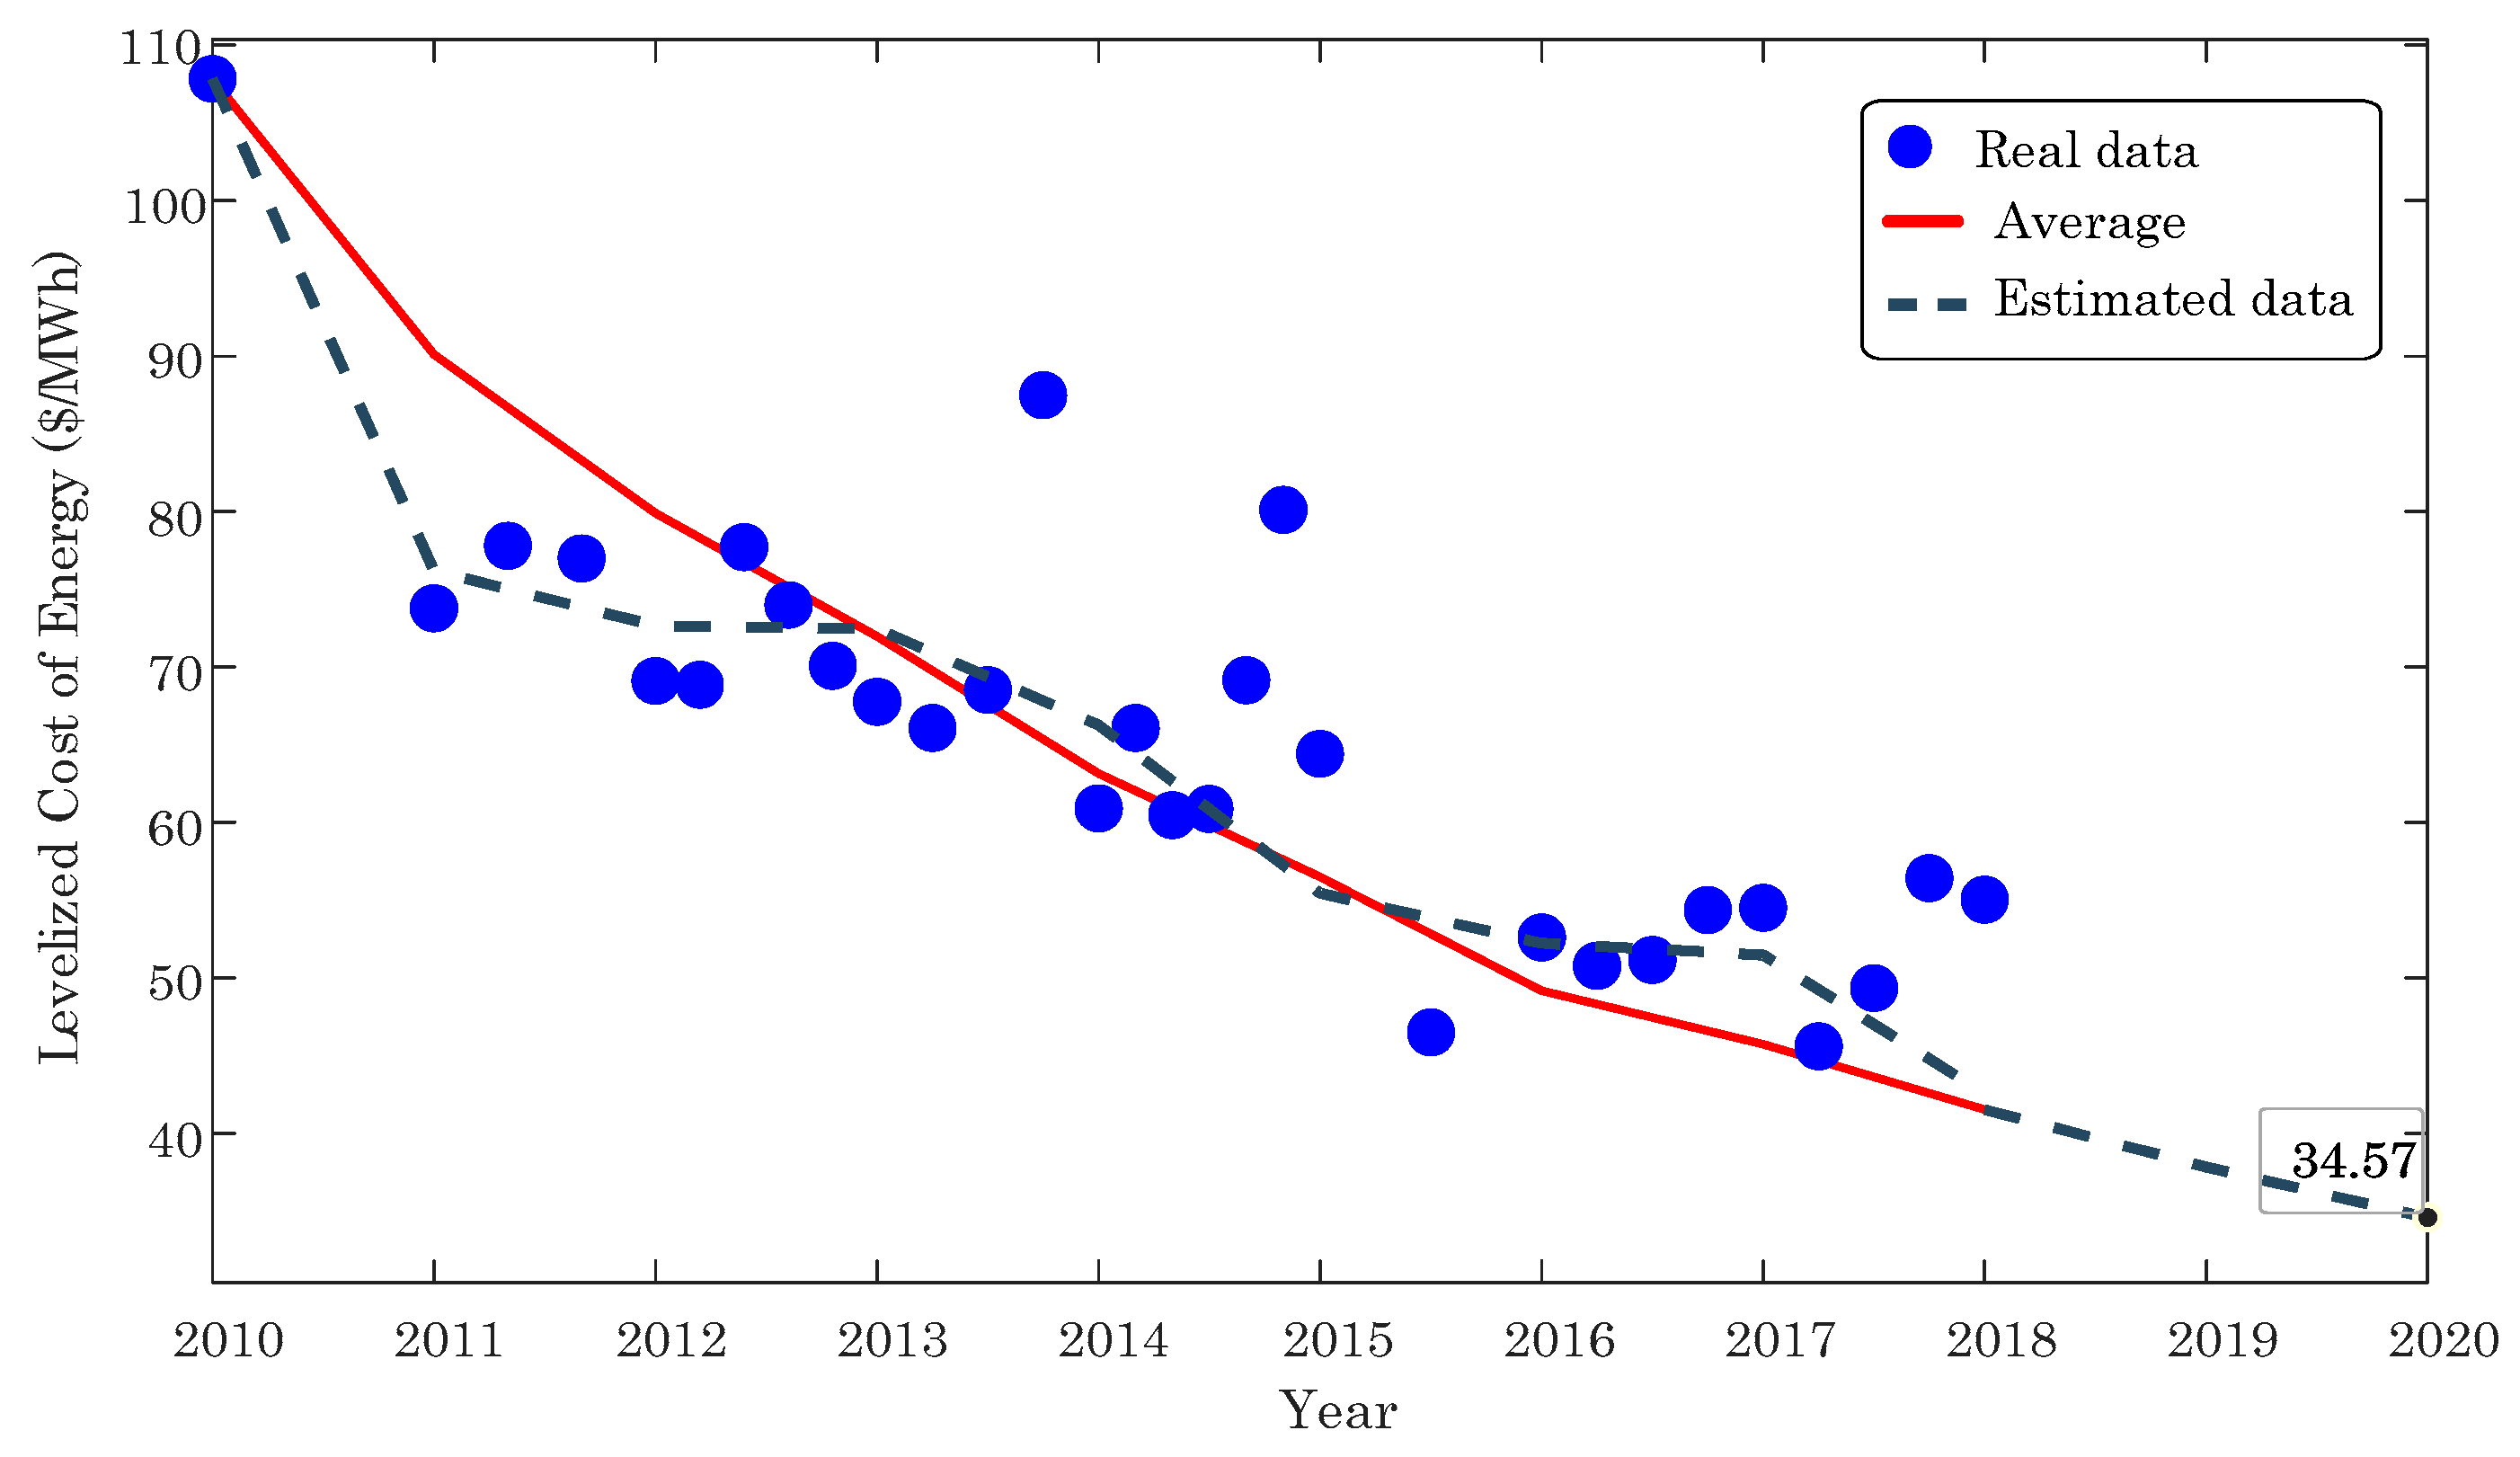
The parameters of the two-factor learning curve for utility-scale photovoltaic, wind, MED, and RO technologies have been estimated in the current study. The results of these estimations are illustrated in Figure 10, Figure 11 and Figure 12. The levelized cost and capacity factor of wind and photovoltaic supplies were obtained using data from 49 photovoltaic projects and 32 wind projects in the Middle East, as explained in detail in Appendix C.
The estimated LDR and LSR for the utility-scale photovoltaic industry between 2013 to 2019 in the Middle East were 15.3% and 33.9%, respectively, with a goodness of fit (R2) of 96.9% based on the average LCOE and 86.9% based on overall data. Figure 10 shows that the obtained LCOE of the utility-scale photovoltaic electricity is equal to 55.2 $/MWh in 2020. Previous studies [67] obtained an LDR of 18% for 26 regions in North Africa, South America, and Australia using the one-factor learning curve to estimate the LCOE of PV. Authors in other studies [68] adopting a similar two-factor learning curve found an LDR of 17% and an LSR of 10% for the photovoltaic technology. Other studies [55] (using data from 2009 to 2016 for the US) and [69] (using data from 1975 to 2000 using worldwide data) estimated these rates as 6.7% and 18.4% for LDR and 75.2% and 14.3% for LSR, respectively, by including a time lag between investment in R&D and subsequent declines in cost for the photovoltaic technology.
The estimated LDR and LSR for the wind industry between 2010 to 2018 in the Middle East were 13.5% and 36.6%, respectively, with a goodness of fit (R2) of 90.0% based on the average LCOE and 67.4% based on overall data. For the wind industry, the overall LDR span is a broad range, from −11% to 35% among studies [53]. As can be seen in Figure 11, the obtained LCOE of wind energy in this study reaches 34.6 $/MWh in 2020. Other studies, [55,69] adopting a similar two-factor learning curve to obtain future wind energy costs, estimated an LDR of 14.2% and an LSR of 18.0% using data from 1991–2000 and an LDR of 17.5% and LSR of 37.1% using data from 2009 to 2016.
The learning rates of the two-factor learning curve for the utility-scale photovoltaic and wind technologies in the Middle East, which are obtained in the current study, were higher than the previous studies. This indicates that, in this region with large-scale investments and commercialization, the learning ability of the utility-scale photovoltaic and wind technologies have substantially improved. Moreover, the estimated LSR rates were higher than the LDR rates for the technologies mentioned above, showing that these technologies are undergoing an explosion of knowledge-driven cost reductions. In consequence, investment in R&D can play a chief role in the development of these technologies in the Middle East.
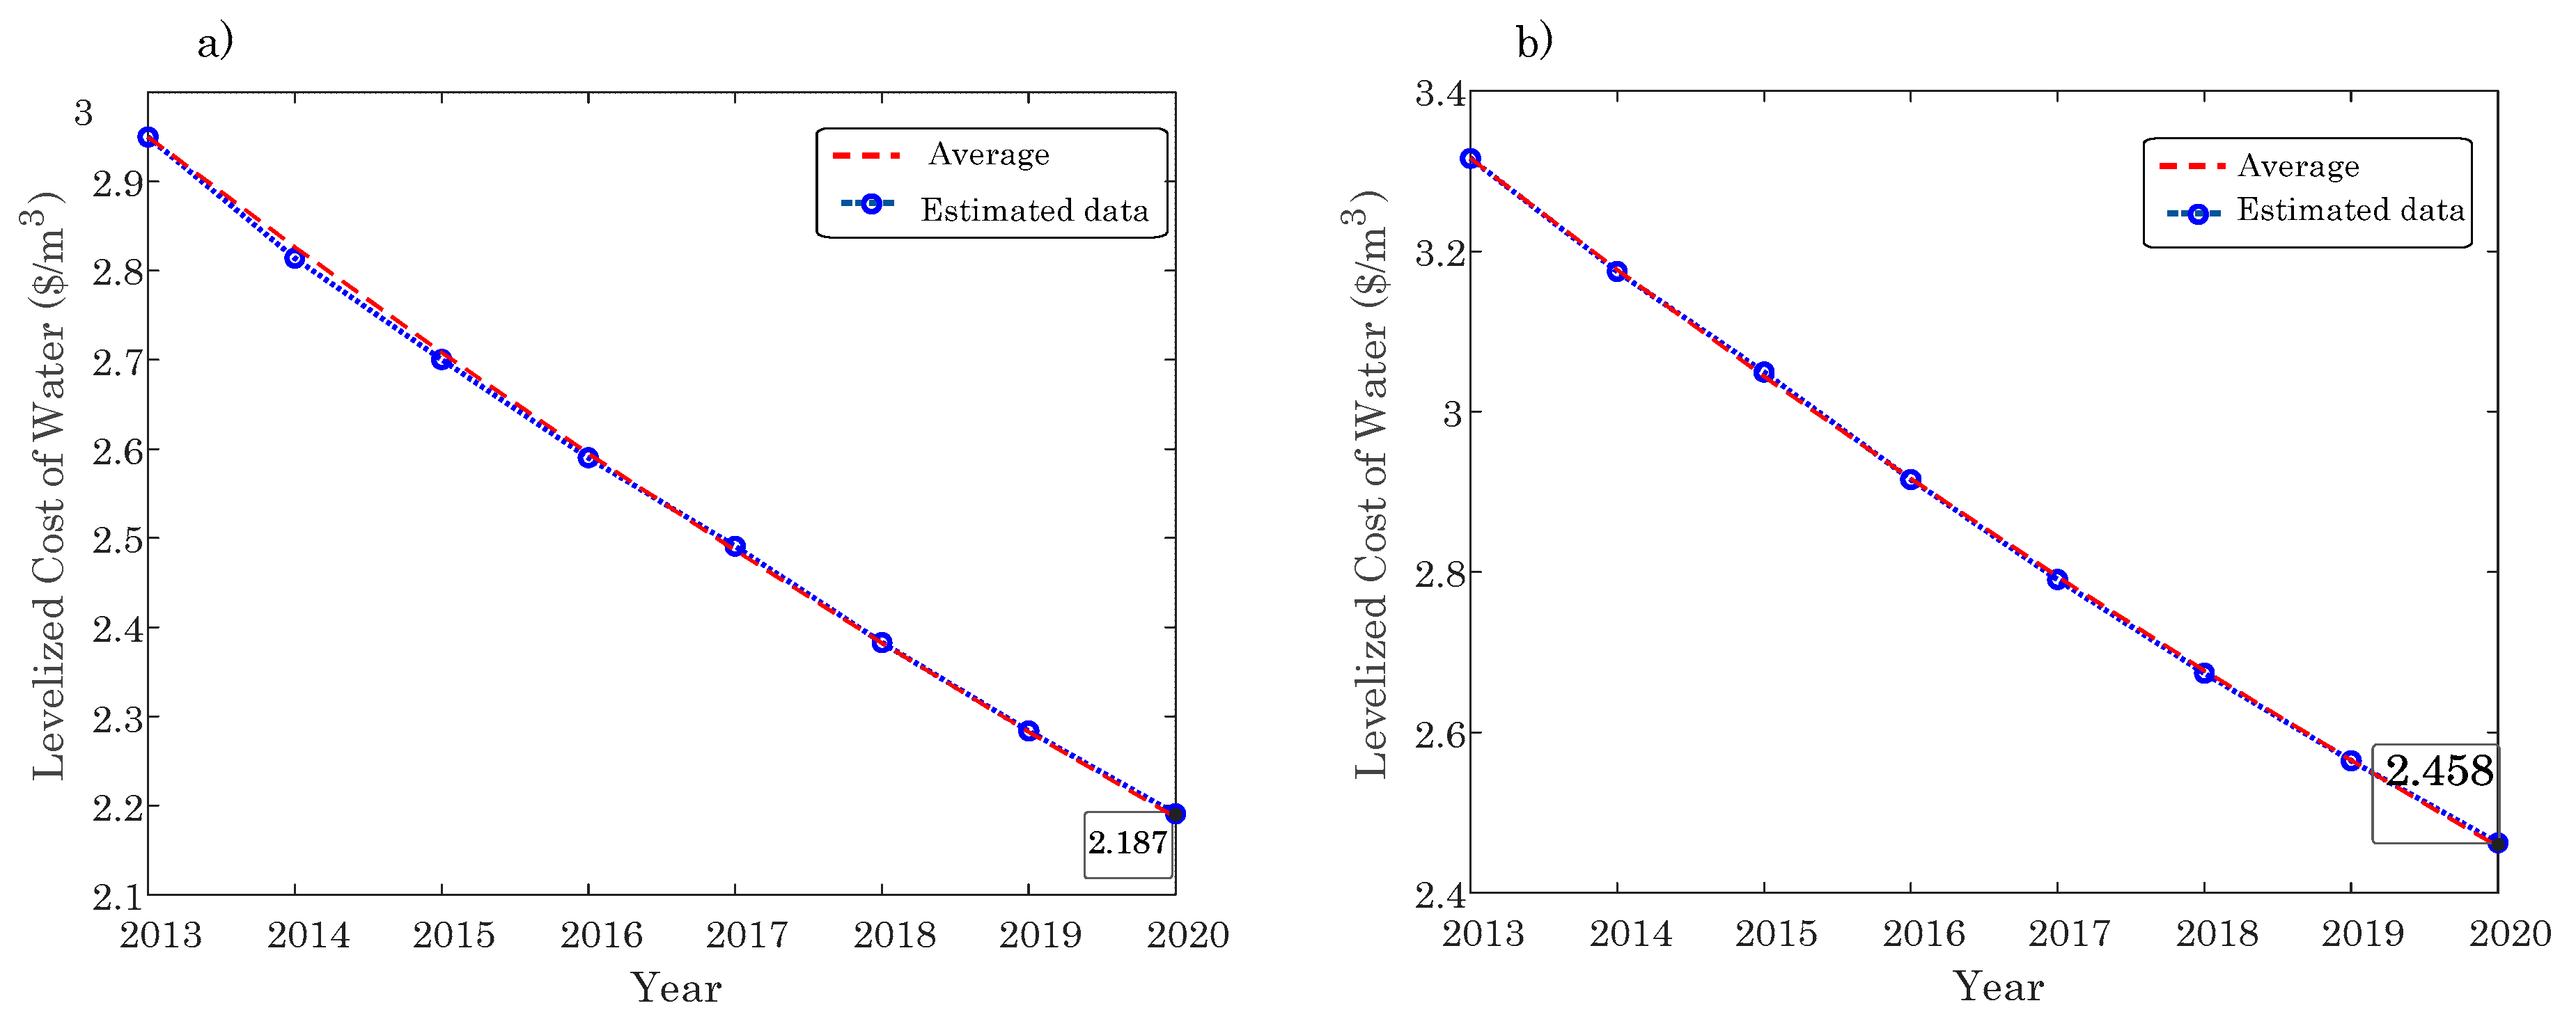
The estimated levelized cost of water for the RO and MED desalination technologies is also obtained by applying the two-factor learning curve, which is depicted in Figure 12. The estimations indicate that the LCOW for RO technology reaches 2.19 $/m3 and 2.46 $/m3 for the MED technology. The obtained LDR and LSR rates for the RO desalination technology are equal to 9.1% and 49.6% with a goodness of fit (R2) of 99.2% using data from 2012 to 2020 [70]. For the MED desalination technology using data between 2012 to 2020 [70,71], the obtained LDR is 12.9%, and the LSR is 57.2% with a goodness of fit (R2) of 98.9%. Previous studies, [72] adopting a one-factor learning curve to estimate the learning rate for the CAPEX of RO technology, found an LDR of 15% for RO desalination technology using worldwide empirical data. Other studies [73], estimated a range of 6% to 20% for LDR of the RO desalination technology with a goodness of fit (R2) of 98.0% and a range of 12% to 23% for LDR of the MED technology with a goodness of fit (R2) of 99.1%.
3.4. Economic Analysis and Emissions
Based on the results of the supply-demand module, storage module, and the estimated rates of the two-factor learning curve and costs of the utility-scale photovoltaic, wind, RO, and MED technologies from the previous sub-section, an economic analysis has been conducted for the region of the case study. Furthermore, the reduction of GHG emissions for the proposed scenarios has been calculated. Lastly, a sensitivity analysis has been conducted to investigate the role of R&D in the development of the mentioned technologies. The electricity and water demand in 2020–2040 have been obtained based on national predictions [59] and the World Bank’s population estimation [64] for the region of the case study.
The cost of batteries for a unit of VRE electricity generation (see Figure 9), which was obtained for the C_RO, D_RO, and D_MED scenarios due to a lower required capacity of batteries compared to the base scenario, is considered as a saved budget for the energy sector in these scenarios. Countries have pledged to increase public and private R&D spending substantially by 2030 as part of the Sustainable Development Goals. The latest available data from the UNESCO Institute for Statistics show that the current maximum R&D spending as a percentage of GDP is around 5% [74]. Therefore, 5% of this saved budget is assumed to be invested in R&D of the wind and photovoltaic technologies in proportion to the share of each supply in VRE electricity generation. It is assumed that the rest of this saved budget (95%) finances further generation of renewable electricity from utility-scale photovoltaic and wind. This budget covers all the fixed and variable costs of the VRE electricity generation during the lifetime of these technologies, which is 20 years.
Studies [3,49,75] showed that about 40% and 7% of LCOW of the RO desalination technology and the MED desalination technology goes to electricity consumption, respectively. As a result, a lower cost of electricity in the C_RO, D_RO, and D_MED scenarios compared to the levelized cost of electricity in the base scenario causes a cost-saving in the water sector. Moreover, the scenarios with the decentralized water sector benefit from energy-saving due to less electricity consumption for water distribution, causing additional cost-saving for these scenarios. These cost-savings are considered as a saved budget for the water sector in the C_RO, D_RO, and D_MED scenarios. Similar to the energy sector, it is assumed that 5% of this saved budget is invested in R&D of desalination technologies and 95% of this budget finances more water desalination to increase the share of desalination from water supplies. This budget covers all the fixed and variable costs of the desalination water production during the lifetime of the RO and MED technologies, which is considered 20 years in this study.
Table 4 summarizes the LCOE of renewable supplies and LCOW of the MED and RO desalination technologies for the proposed scenarios from 2020 to 2040 in the region of the case study.
Table 4 shows that the levelized cost of wind electricity generation will reach 17.8 $/MWh, 18.6 $/MWh, 17.5 $/MWh, and 17.4 $/MWh for the base, C_RO, D_RO, and D_MED scenarios, respectively. In the base, C_RO, D_RO, and D_MED scenarios, 94%, 92%, 89%, and 90% of this cost reduction in 2040, compared with the cost of wind electricity in 2020, is driven by the experience effect of cumulative production, and 6%, 8%, 11%, and 10% is driven by the knowledge stock of the cumulative increase in R&D spending, respectively. In the C_RO scenario, the share of wind electricity generation from the total VRE electricity production in 2040 is the lowest amongst the proposed scenarios, with 12% (see Figure 5) causing the highest LCOW for the wind supply in the C_RO scenario due to the effect of production experience.
For utility-scale photovoltaics, the LCOE in 2040 is equal to 17.3 $/MWh, 15.0 $/MWh, 13.5 $/MWh, and 14.1 $/MWh, for the base, C_RO, D_RO, and D_MED scenarios, respectively. About 96%, 83%, 76%, and 78% of this cost reduction in 2040 as compared with 2020 is caused by the experience of cumulative production, and 4%, 17%, 24%, and 22% comes from the knowledge stock of the cumulative increase in R&D spending for the base, C_RO, D_RO, and D_MED scenarios, respectively.
The cost reduction of wind electricity is lower than the cost reduction of photovoltaic electricity. For instance, in the D_MED scenario, the LCOE of photovoltaic electricity reduces from 55.2 $/MWh in 2020 to 14.1 $/MWh, while the wind electricity experiences a cost reduction from 34.7 $/MWh in 2020 to 17.4 $/MWh in 2040. Several factors cause this difference, including, first, the share of wind power from total renewable electricity generation varies from 11% to 15% in 2040, affecting the cost reduction by the experience of cumulative production. Moreover, in this proposed module, the VRE technologies are gaining budget from the saved budget for spending on R&D and adding new capacity in proportion to their share of total VRE generation (see Figure 5 and Figure 6) based on the results of the previous technical modules in this study. In other words, the photovoltaic technology gets more share from the saved budget because it is more attractive based on the technical modules.
Even though the LSR is higher than the LDR for both photovoltaic and wind technologies, the main percentage of the cost reduction is driven from the experience of cumulative production showing these technologies are facing an inadequate R&D budget for development. The circumstances are improved for the C_RO, D_RO, and D_MED compared to the base scenario. For example, the share of cost reduction due to knowledge stock increased from 4% in the base scenario to 22% for the D_RO scenario for the photovoltaic technology because a fraction of the saved budget is dedicated to spending on R&D.
Table 4 shows that the levelized cost of desalinated water for the base, C_RO, D_RO, and D_MED scenarios will reach 0.79 $/m3, 1.01 $/m3, 0.98 $/m3, and 0.74 $/m3, respectively. For MED desalination technology in the base and D_MED scenarios, about 55% and 56% of the cost reduction is caused by the knowledge stock in 2040 as compared with 2020 and around 45% and 44% is driven by the experience effect of cumulative production, respectively. Around 36% and 39% of the RO desalinated water reduction cost is driven by the experience of the cumulative production for the C_RO and D_RO scenarios, respectively. These results indicate that RO and MED desalination technologies received adequate R&D budget compared to photovoltaic and wind technologies.
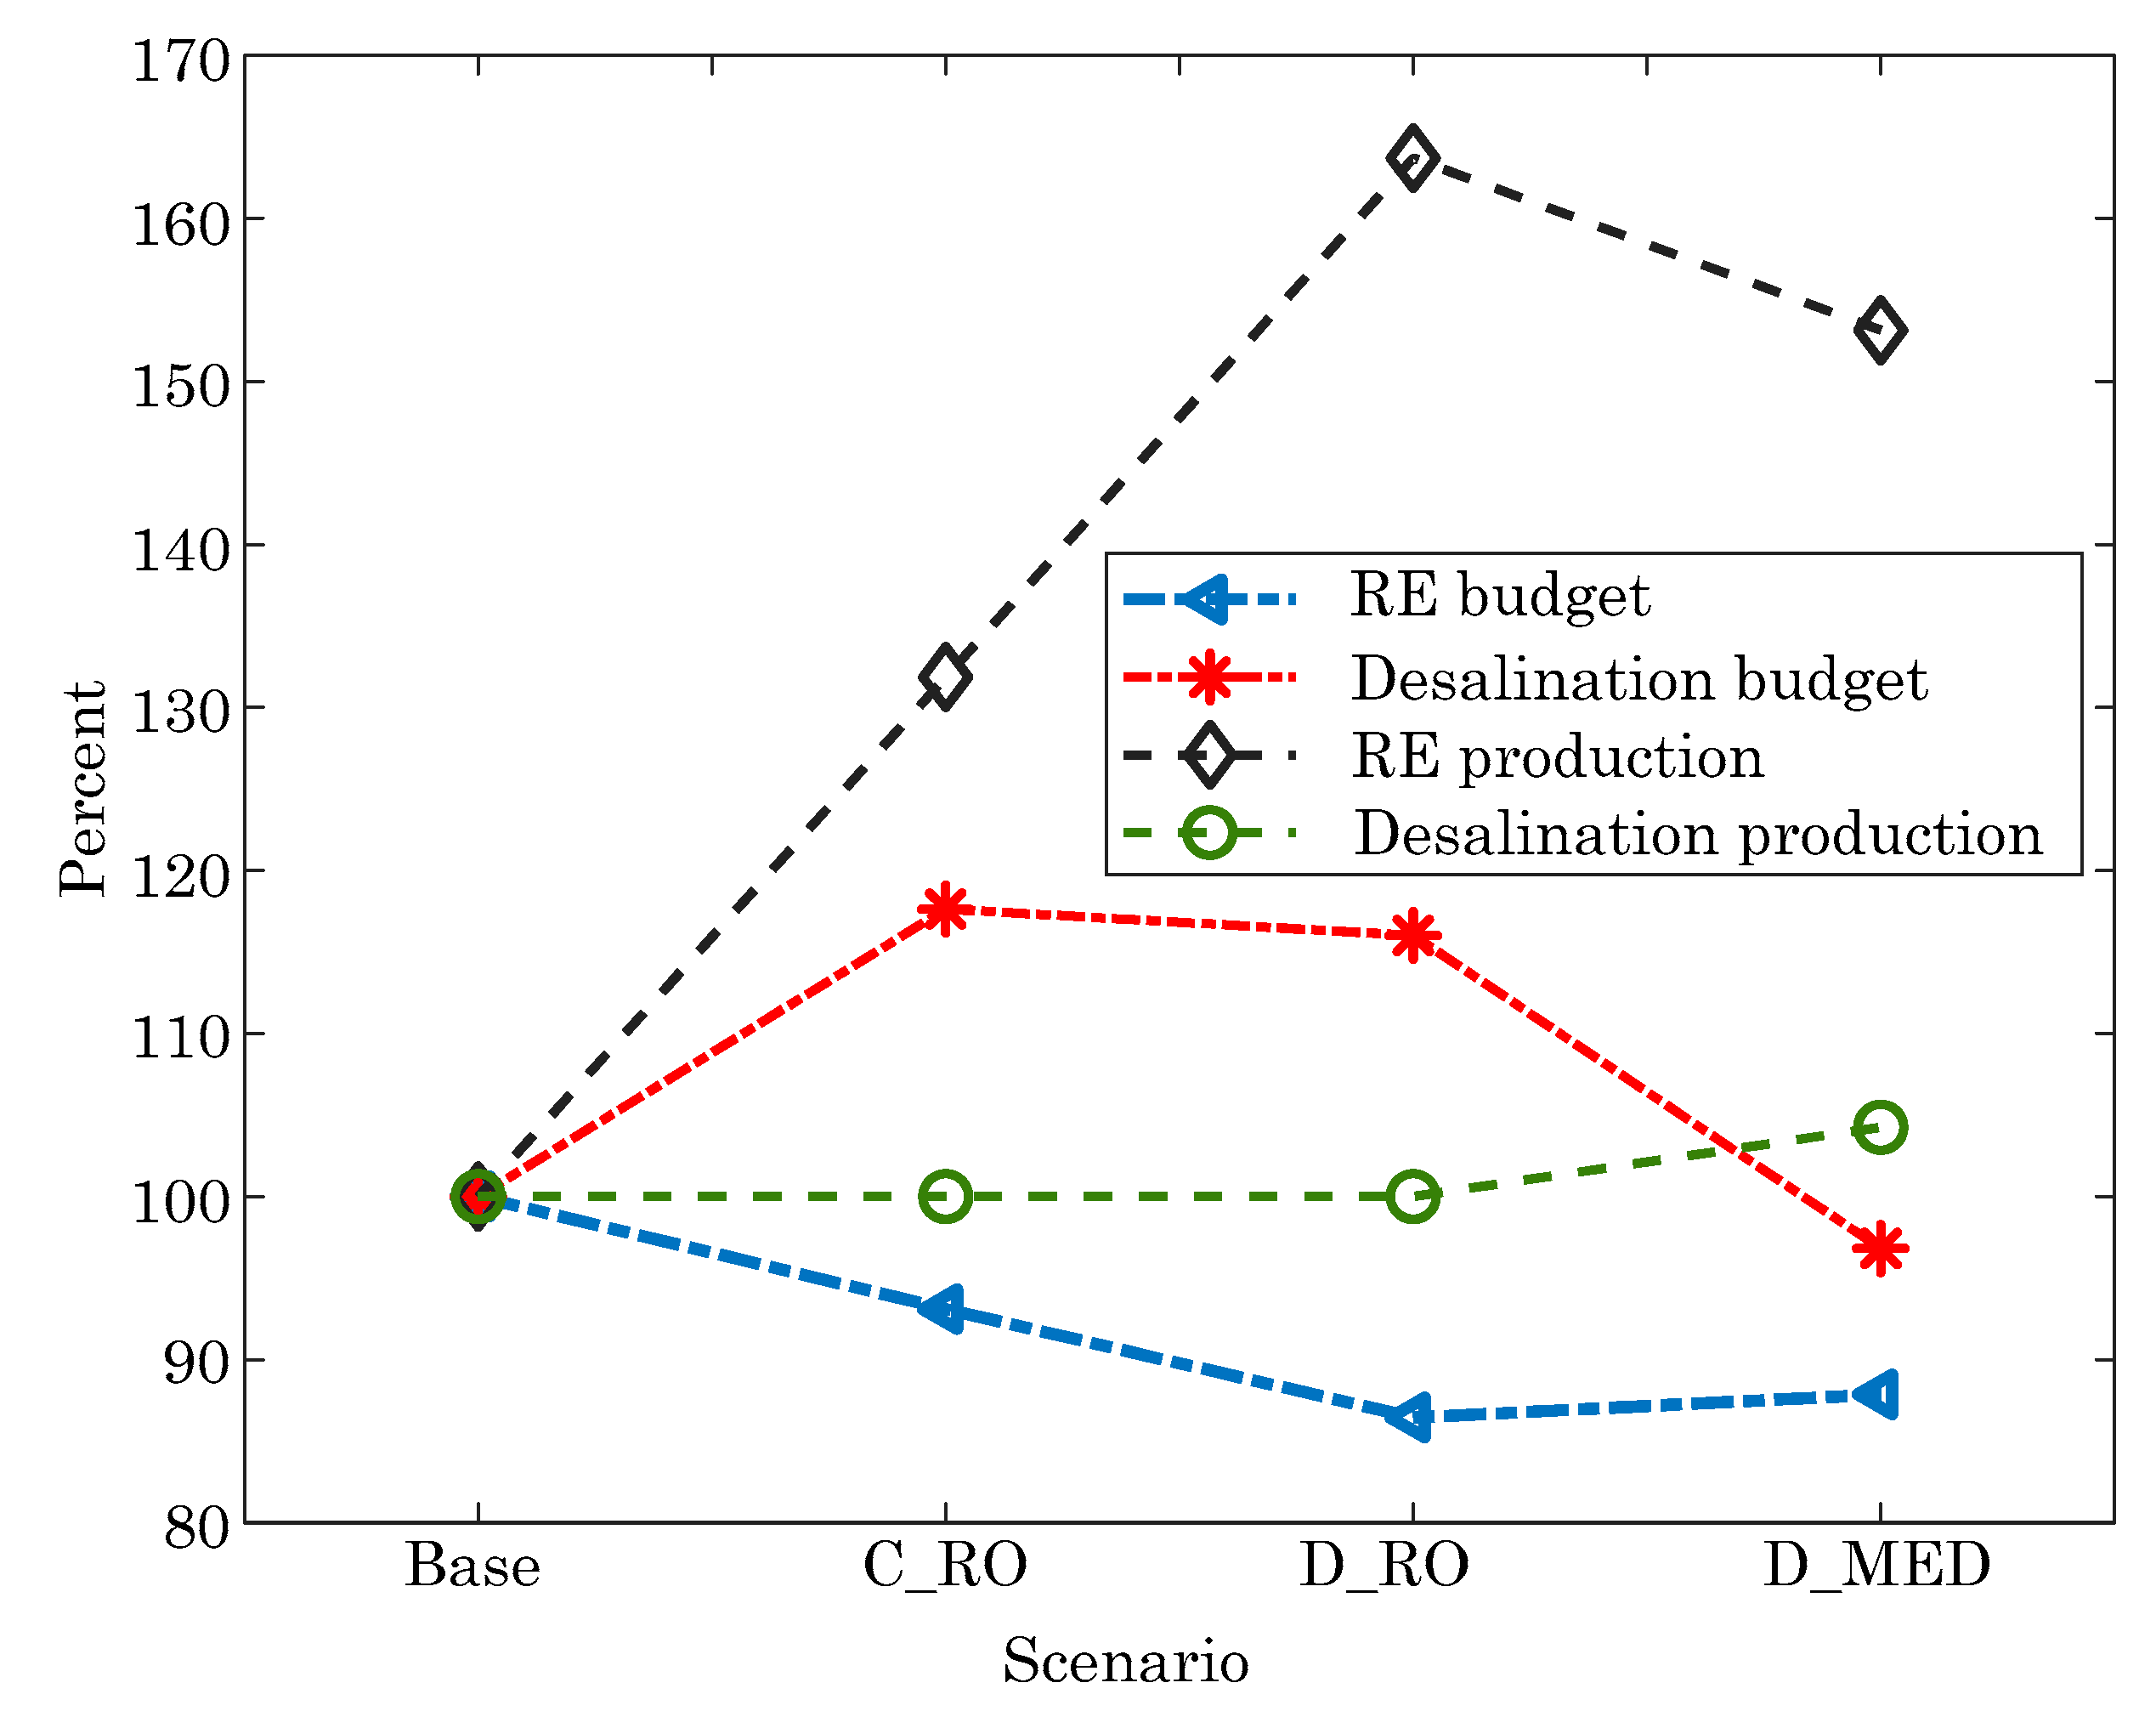
Figure 13 depicts the synergy results of the integration of the water and energy sectors for the energy sector. The C_RO, D_RO, and D_MED scenarios, with the integrated water and energy sectors, generate 32%, 64%, and 53% more renewable electricity, respectively, during the lifetime of the newly installed capacities in 2020–2040 compared to the renewable electricity generation of the base scenario with the separated water and energy sectors. These scenarios have 7%, 14%, and 12% less required budget, respectively, compared to the required budget for the base scenario. As can be seen in Figure 13, for the water sector, only the D_MED scenario shows a synergistic effect from the integration of the water and energy sector. This scenario produces 4% more desalinated water during the lifetime of the newly installed facilities with 3% less required budget compared to the desalinated water production and required budget in the base scenario while the C_RO and D_RO scenarios require 18% and 16% more budget compared to the budget in the base scenario to meet the same targets. Furthermore, the D_MED scenario reaches a levelized cost of desalinated water of 0.74 $/m3, which is 5% lower than the cost in the base scenario in 2040.
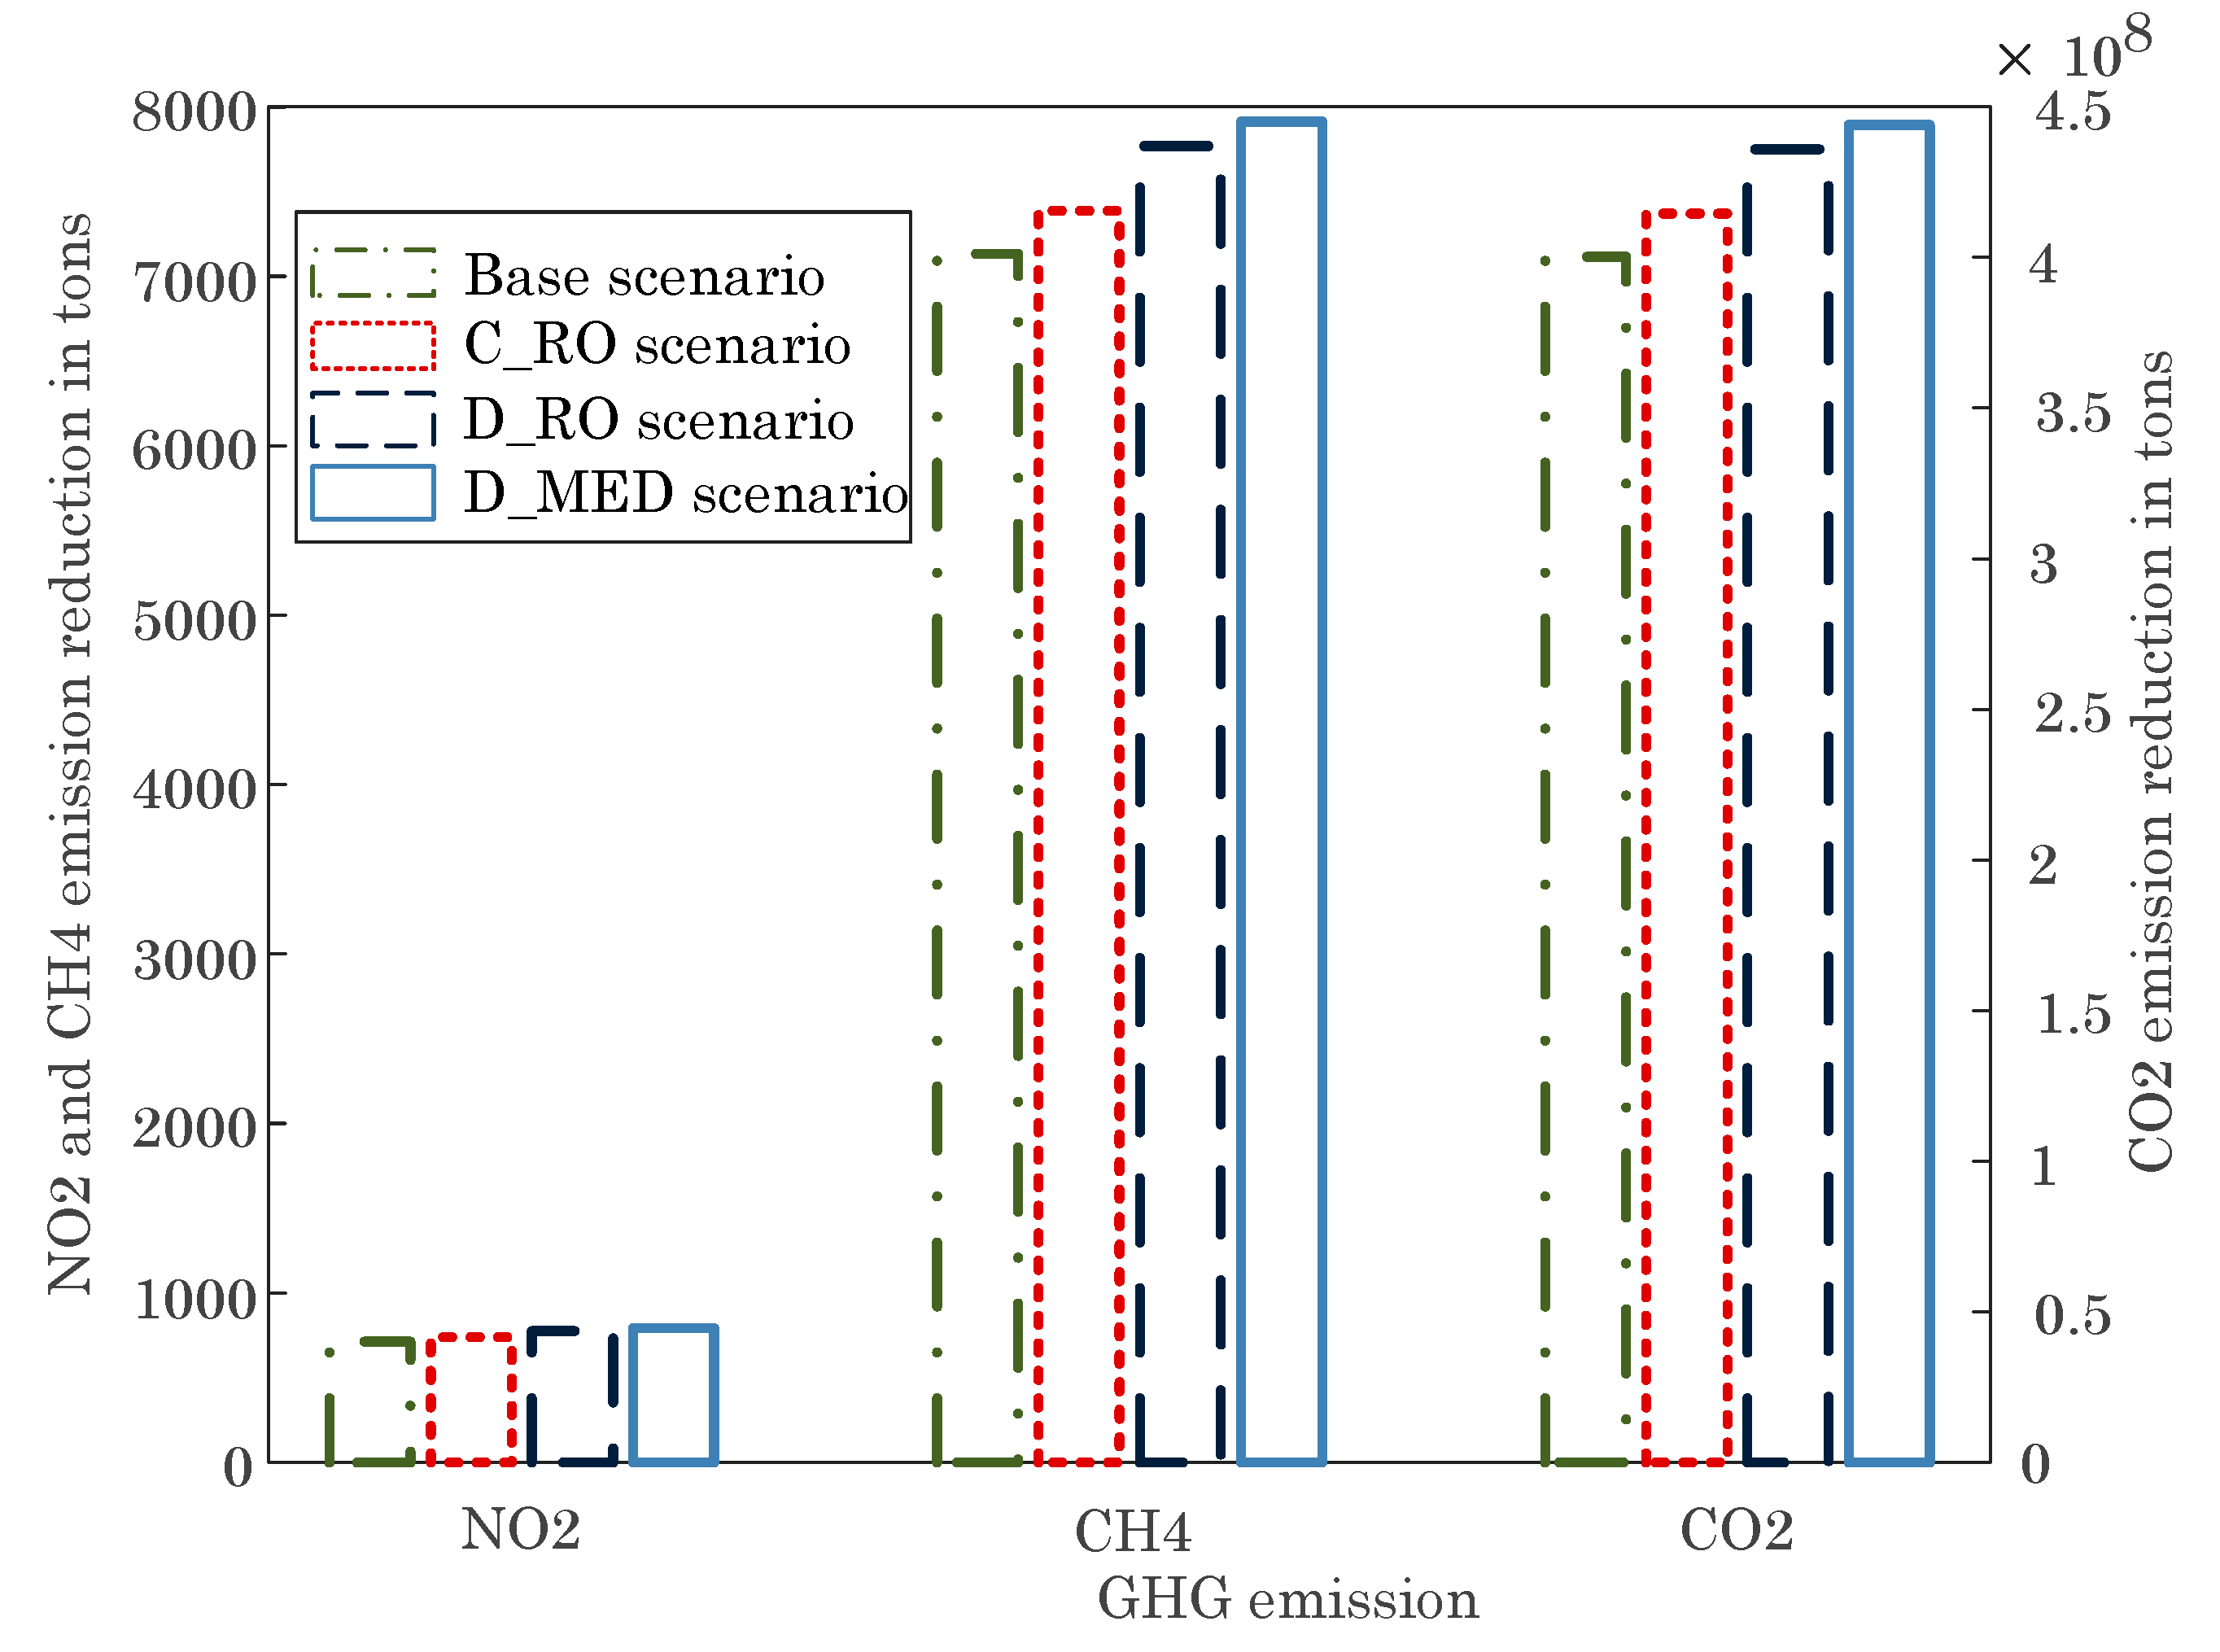
Figure 14 indicates that the D_MED scenario with 444 Mt of CO2, 7913 tons of CH4, and 794 tons of NO2 reduction by 2040 has a better performance in GHG emissions reduction compared to the other scenarios. These reductions were calculated based on the Iranian electricity mix and with an assumption of providing the thermal energy for the desalination process from Iranian natural gas in the base scenario and from solar thermal resources for the D_MED scenario [59,76]. Although the C_RO scenario generates more renewable electricity compared to the D_MED scenario (see Figure 13), the D_MED scenario, as explained in the introduction, has the potential to provide thermal energy for the desalination process from the solar thermal resources due to distributed water sector and its size compatibility.
As can be seen in Table 4, the obtained LCOE in the scenarios with the integrated water and energy sectors, the C_RO, D_RO, and D_MED is lower the LCOE in the base scenario with separated water and energy sectors. Even though the VRE costs are likely to decrease dramatically, these costs will remain more expensive than natural gas power plants in 2040 for Iran producing electricity with an LCOE of 10 $/MWh [60,77]. The levelized cost of renewable electricity is equal to 17.6 $/MWh, 16.8 $/MWh, 15.5 $/MWh, and 15.7 $/MWh for the base, C_RO, D_RO, and D_MED scenarios, respectively. Even though the D_RO reaches a cheaper LCOE and higher penetration of VRE (see Figure 13) compared to the D_MED scenario, in this scenario, the LCOW will be 13% more expensive than the base scenario, and the required budget to meet the same targets in the water sector is 16% higher than the base scenario.
The United Nations addressed water resource management and deployment of renewable energy among focal targets to achieve sustainable development goals (SDG) in Iran [78]. Currently, planning for the water and energy sector is being conducted separately in Iran [78]. This study shows the integrated planning of these sectors brings potential technical, economic, and environmental synergistic benefits while avoiding conflicts. Moreover, even when considering all cost reductions and developments, renewable power and desalination (as one of the proposed strategies to achieve SDGs in Iran [79]) remain expensive energy and water supplies compared to other conventional resources. It needs heavy national investment and subsidies from governments for the next few decades. The proposed renewable-powered desalination system in this study gives the rural areas of Iran an opportunity to benefit from these investments and subsidies. Such rural areas are given priority for development in the suggested strategies for achieving SDGs in Iran [79].
Sensitivity Analysis
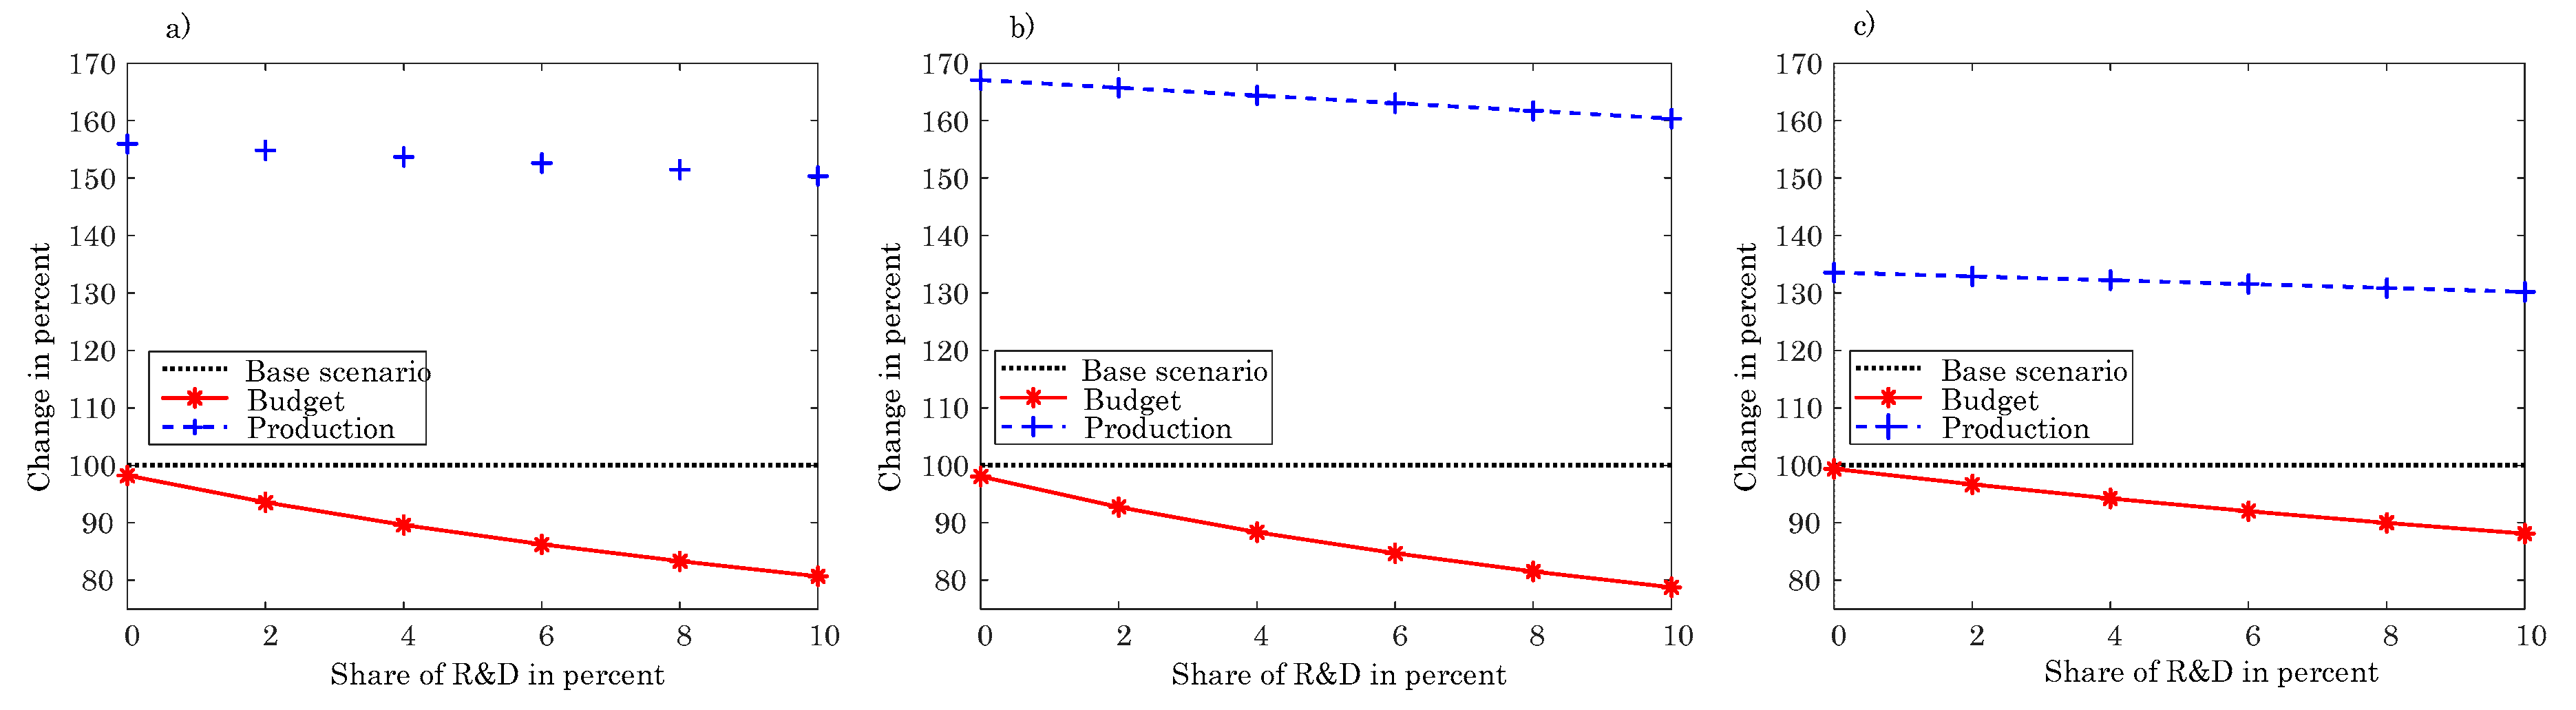
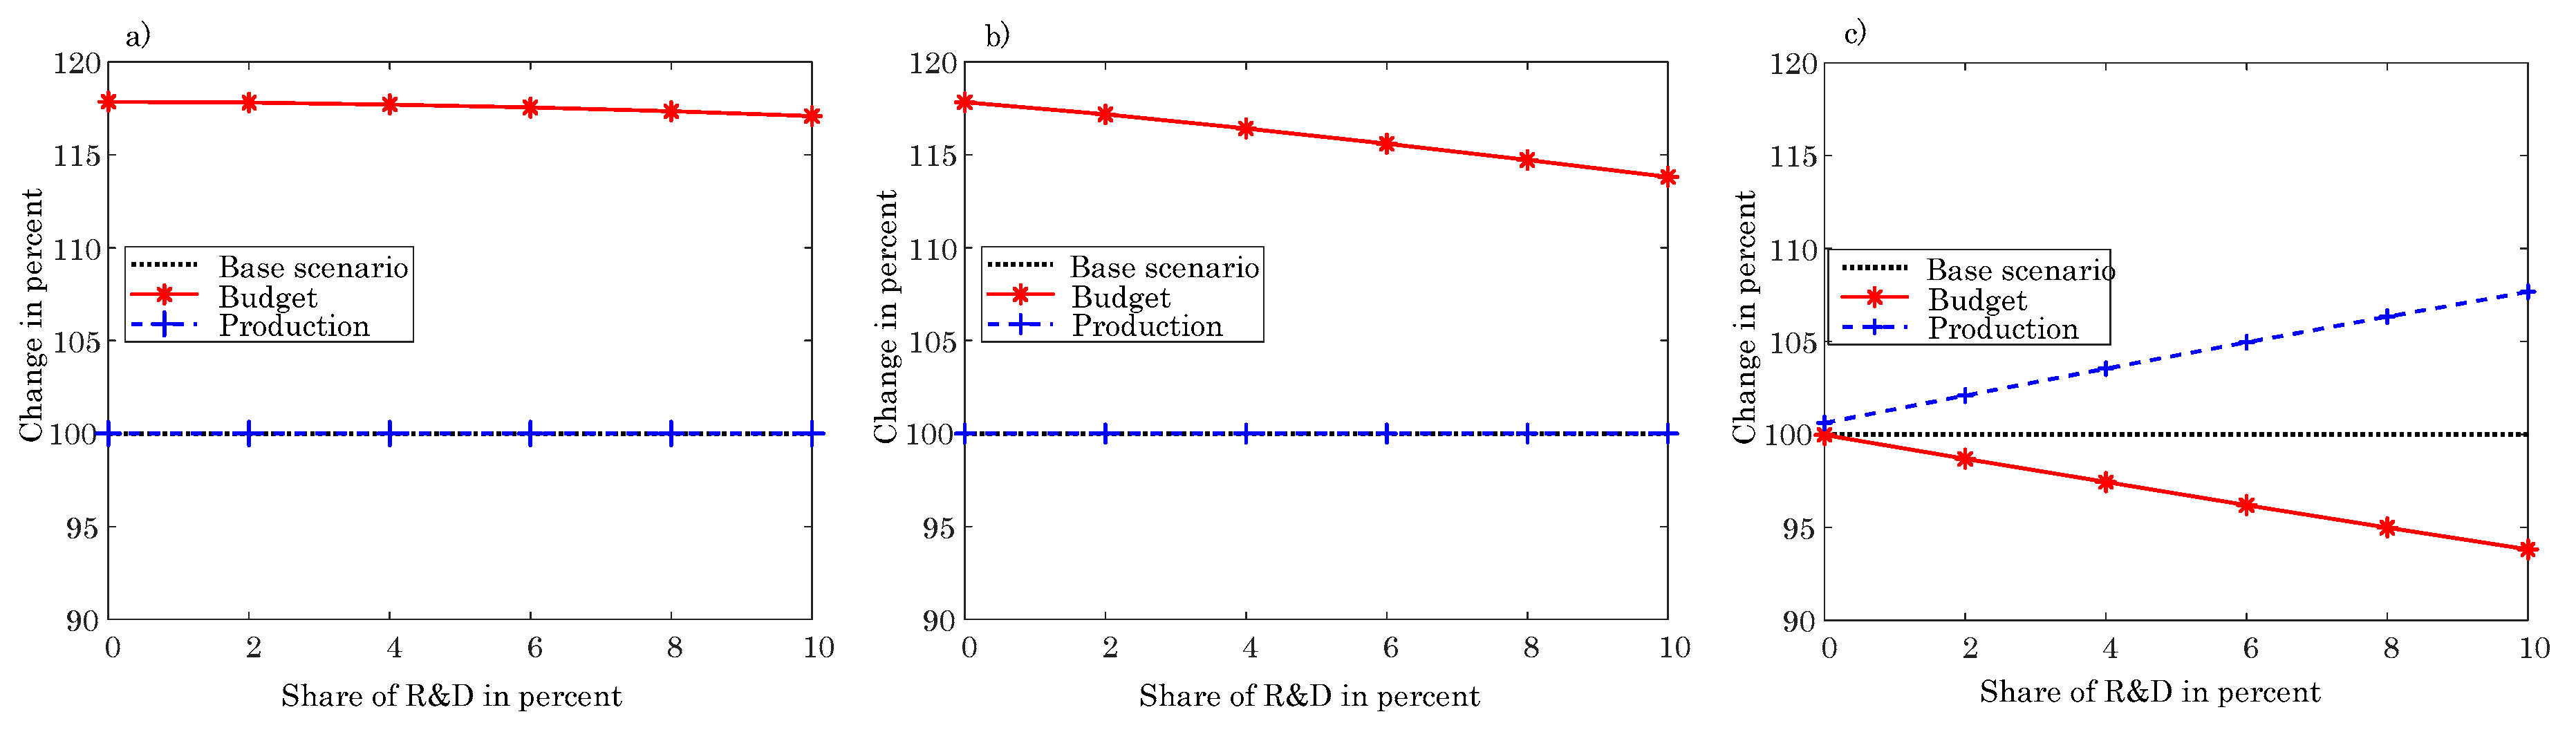
For investigating the role of R&D budget in the deployment wind, solar MED, and RO technologies, a sensitivity analysis has been conducted in this study. To this end, the share of R&D investment from the saved budgets (explained in the previous subsection) is assumed to differ by up to 10%. The resulting LCOE of VRE electricity and LCOW of desalination technologies in 2040 for the proposed scenarios are summarized in Table 5. The levelized cost of photovoltaic electricity (around 20% for the C_RO scenario, 32% for the D_RO scenario, and 28% cost reduction for the D_MED scenario) was most affected by increasing the share of R&D budget compared to the LCOE of wind power (around 2% for the C_RO scenario, 6% for the D_RO scenario, and 4% cost reduction for the D_MED scenario) and LCOW of MED and RO desalination technologies (around 1% for the C_RO scenario, 8% for the D_RO scenario, and 14% cost reduction for the D_MED scenario) due to the higher effect of cumulative production and receiving a higher share of the R&D budget. As mentioned, in the C_RO scenario, the share of wind electricity generation from the total VRE electricity production in 2040 is the lowest amongst the proposed scenarios causing higher LCOW for the wind supply as can be seen in Table 5.
As mentioned, it is assumed in this study that a share of the saved budget goes into the renewable and desalinated water production, adding new capacities to the supply sides of the water and energy sector. This budget covers all the fixed and variable costs of the VRE electricity generation and desalinated water production within the lifetime of these technologies, which is 20 years. The renewable generation and desalinated water production of these new capacities from the saved budget are described in Figure 15 and Figure 16 for the proposed scenarios. By increasing the share of R&D in Figure 16, as expected, the VRE electricity generation is diminished because the budget for the VRE generation is reduced and invested in R&D instead. For the water sector in the D_MED scenario, although the MED water production rises from 1% for no R&D share to 8% for 10% R&D share because of the same reason, the required budget decreases 17% because of the high cost reduction of photovoltaic electricity (around 28%). This reveals the role of LCOE in the cost of water desalination, indicating that with a 17% lower budget compared to the budget for no share of R&D in the D_MED scenario, the MED water production rises about 7%.
4. Conclusions
In the Middle East, the water and energy sectors are planning to transition towards a higher share of renewable resources and desalinated water supplies. A novel methodology is developed to model synergies of integrated planning of inter-linked sectors. The nexus approach in this study revealed that the configuration of each sector has direct impacts on the other sector. Designing the water sector and energy sector as endogenous parts of one system can decrease the cost of the fluctuating renewable power generation for the energy sector in all the proposed scenarios. Among these scenarios, in only one scenario, the scenario with the decentralized water sector and multiple effect distillation desalination technology, the water sector experienced synergistic results, causing a lower required budget and levelized cost of desalinated water compared to the base scenario with the separated water and energy sectors. On the other hand, other scenarios imposed a higher levelized cost of desalinated water and required budget on the water sector, revealing a conflict between the water and energy sectors. The synergy results for a 5% research and development share from the saved budget showed that by modeling the water and energy sectors at the same time, the levelized cost of variable renewable electricity decreased 4% for the scenario with the centralized reverse osmosis water sector, 12% for the scenario with reverse osmosis decentralized water sector, and 11% for the multiple effect distillation decentralized water sector compared to the 17.6 $/MWh for the base scenario with the separated sectors. Meanwhile, renewable electricity generation grows 32%, 64%, and 53% with 7%, 14%, and 12% less budget, respectively. Although the scenario with the reverse osmosis decentralized water sector has a better performance in the energy sector, this scenario requires 16% more budget for the water sector and reaches levelized cost of desalinated water of 0.98 $/m3, which is 24% higher compared to the base scenario to meet same targets. In the meantime, the scenario with the multiple effect distillation decentralized water sector reaches levelized cost of desalinated water of 0.74 $/m3, which is 6% lower the base scenario while producing 4% more desalinated water with 3% less required budget. Furthermore, this scenario showed a better performance in reducing greenhouse gas emissions due to its size compatibility with renewable-powered desalination facilities. As a result, the scenario with the decentralized water sector and renewable-powered multiple effect distillation desalination technology showed the best overall performance among the proposed scenarios. Moreover, the sensitivity analysis revealed the role of levelized cost of energy in the cost of water desalination, indicating that with a 17% lower budget compared to the budget for no share of research and development, the multiple effect distillation water production rises about 7%. In summary, the integrated planning of the water and energy sectors, as focal target sectors in sustainable development goals for Iran, could bring technical, economic, and environmental synergic benefits while it is necessary for avoiding conflicts.
It is noteworthy to mention that the estimated learning rates of the two-factor learning curves in this study showed that the research and development investment have a significant role in deployment and cost reduction of photovoltaic, wind, multiple effect distillation, and reverse osmosis technologies due to higher learning-by-searching rates comparing to learning-by-doing rate. Despite the fact that the learning-by-searching rate is higher than the learning-by-doing rate for all these technologies, the main percentage of the cost reduction is driven from the experience of production for the wind and photovoltaic technologies showing these technologies are facing an inadequate research and development budget for development. Nevertheless, in the proposed scenarios in this study, investing a portion of the saved budgets on research and development solved this issue to some extent.
Finally, considering all technology developments, renewable energy and desalination supplies remain more expensive than conventional resources for the next few decades. The proposed renewable-powered desalination system in this study enables the rural regions, as a priority area for development in the strategies for sustainable development goals in Iran, to benefit from required massive national investment and subsidies.
Author Contributions
E.A. designed, conceptualized, and developed the simulation model, analyzed the simulation results, visualized, and wrote the manuscript. B.M. reviewed, edited, and visualized. B.M., S.O., B.M.-I., and T.T. gave guidance, provided the materials, and helped to improve the quality of the work. All authors have read and agreed to the published version of the manuscript.
Funding
This research received no external funding.
Conflicts of Interest
The authors declare no conflict of interest.
Nomenclature
| Subscripts | Description |
| t | Set of time, hour |
| d | Set of time, day |
| y | Set of time, year |
| l | Set of location for the decentralized water sector |
| r | Reservoir |
| pmp | Pump |
| des | RO desalination |
| conv | Conventional |
| w | Water |
| Variables | Description |
| Amount of water in the reservoir | |
| Amount of water extraction from conventional water supplies | |
| Pumped water from the desalination plant’s reservoir | |
| Amount of water in the desalination reservoir | |
| Water production by the desalination plant | |
| Water production capacity of conventional water supplies | |
| Water production capacity of desalination plants | |
| Wind energy capacity | |
| Capacity of the photovoltaic panels | |
| Capacity of battery unit | |
| Electricity charge of battery unit | |
| Electricity discharge of battery unit | |
| Unit cost | |
| Cumulative production | |
| Cumulative investment | |
| Parameters | Description |
| Water demand | |
| Capacity of the water reservoir | |
| Capacity of the desalination unit’s reservoir | |
| Capacity of the pumping from the desalination’s reservoir | |
| Share of desalination from total water demand | |
| Required energy for producing a unit of desalinated water | |
| Required electricity for pumping unit of water from a desalination plant to the reservoir | |
| Energy needed to extract and transfer unit of water from conventional water resources | |
| Wind electricity production | |
| Wind speed | |
| Electricity production from photovoltaic panels | |
| Solar radiation | |
| Renewable energy production | |
| Target share of renewable energy production | |
| Electricity demand | |
| Electricity consumption of the water sector | |
| Electricity exchange with the national grid | |
| Efficiency of the battery storage | |
| Energy stored in the battery unit | |
| Initial unit cost | |
| Learning-by-doing elasticity | |
| Learning-by-searching elasticity | |
| Initial cumulative production | |
| Knowledge stock | |
| Investment expenditures | |
| Operations and maintenance expenditures | |
| Fixed expenditures | |
| Capacity factor | |
| Discount rate | |
| Lifetime of the technology |
Appendix A. Supply-Demand Module
Appendix A.1. Water Module
Appendix A.1.1. Integrated System
The amount of water in the water reservoir in each location should be more than the water demand for the next day, which is described as:
where is the daily water demand in each location and is the amount of water in the water reservoirs. For the centralized water sector, there is only one location.
For the decentralized water sector, the hourly amount of water in the water reservoir for each location is obtained as Equation (A2).
where describes the amount of water extraction from conventional water supplies, which are underground and surface water resources, and is the amount water production from the desalination supply.
For the centralized water sector, the hourly amount of water in the desalination reservoir follows Equation (A3).
where is the amount of pumped water from the centralized desalination plant’s reservoir.
The amount of stored water in each reservoir cannot exceed the capacity of the reservoir, which can be described as (A4) and (A5).
The capacity of water production from the desalination plant, conventional resources, and the amount of pumped water are limited based on (A6)–(A8).
The share of desalination from the total water demand needs to meet the target for each year, which is imposed on the model as Equation (A9).
To become economically and technically feasible, desalination facilities are required to operate more than 80% of their total capacity through a year [80]. This constraint is considered in the model as:
The hourly electricity consumption of the centralized water sector for each year is calculated as Equation (A11). It is assumed that for the decentralized water sector, the desalination is located exactly at the demand location; as a result, there is no need to transfer the desalinated water. The hourly electricity consumption of the decentralized water sector is obtained from Equation (A12).
where depicts the electricity demand of water sector, shows the required electricity to produce unit of desalinated water, is the amount of electricity required for extracting and transferring unit of water from conventional water supplies, and is the required electricity for pumping unit of water from the desalination facility to the reservoir.
Appendix A.1.2. Separated System
The water sector’s electricity demand is assumed to be constant for the separated system, which is obtained from Equation (A13).
Appendix A.2. Energy Module
In the proposed model, the hourly wind power generation is obtained from Equation (A14) [81]
where is the wind electricity generation in each hour, describes the capacity of wind supply, and is the normalized hourly wind speed (normalized based on maximum wind speed throughout each year ).
The hourly electricity production from photovoltaic panels follows Equation (A15) [82].
which depicts the solar electricity production, is the capacity of the solar electricity supply, and is the normalized hourly solar irradiation (normalized based on the maximum solar radiation throughout the year ).
As a result, the hourly renewable electricity generation is calculated as (A16).
where is the hourly renewable energy generation.
Equation (A17) ensures to meet the yearly target share of renewable energy generation of the total electricity demand.
where depicts the yearly target share of variable renewable energy generation and describes the hourly electricity demand.
Equation (A18) guarantees the balance to meet hourly electricity demand.
where is the absolute value of hourly electricity exchange with the electric grid. includes both negative (selling electricity to the grid) and positive values (purchasing electricity from the grid).
The objective function is to minimize the electricity exchange with the national grid, which is explained as:
For the integrated system, the capacity of solar supply, wind supply and desalination facilities, hourly water extraction from the conventional water supplies, hourly water production of each desalination facility, hourly pumped water from the desalination unit’s reservoir to the water reservoir (only for the integrated system with centralized water sector), and hourly electricity exchange with the national grid are the variables of the optimization problem. For the separated system, the capacity of solar supply, wind supply, and hourly electricity exchange with the national grid are considered as the variables of the optimization problem.
Appendix B. Energy Storage Module
The energy storage module is developed to find required batteries equivalent to the operational capacity of the flexible water sector. To this aim, the share of excess renewable electricity generation of the base scenario is required to be equal to the other proposed scenarios by installing new batteries, which is imposed on the model based on Equation (A20).
where depicts the share of excess renewable electricity generation for each scenario. This excess electricity generation refers to the portion of variable renewable power production, which exceeds electric load.
Equation (A21) describes the amount of stored energy in the battery storage.
where depicts the amount of hourly stored energy, which cannot exceed the capacity of the battery storage (see (A22)), is the amount of hourly electricity charge of the battery storage, and shows the amount of hourly discharged energy from the battery storage.
To limit the hourly amount of charged or discharged electricity based on charge and discharge rate limitation of battery storage, Equation (A23) is considered in the model.
In Equation (A23), is the maximum charge/discharge rate of the battery storage (share of the total capacity).
Equation (A24) ensures the electricity balance to meet hourly electricity demand in this model.
The objective function, which is depicted in (A25), is to minimize the capacity of batteries () equivalent to the operational capacity of the flexible water sector.
The new required battery storage capacity, hourly electricity exchange with the national grid, and charge/discharge of the battery storage are the variables of this optimization problem.
Appendix C. Learning Curve
Equation (A26) describes the two-factor learning curve in detail [55].
where depicts the unit cost, is the initial unit cost, is the initial cumulative production, describes the historical cumulative production, which is described in Equation (A27) [72], is the learning-by-doing elasticity, shows the knowledge stock, depicts the historical cumulative investment on R&D, which is obtained from Equation (A28) [55], and is the learning-by-searching elasticity.
where describes the yearly new production and refers to the production in the starting year of applying the technology.
Based on this learning curve, the technology cost decreases by increasing the cumulative production as well as investment in research and development (R&D). In the two-factor learning curve, learning-by-doing (LDR) and learning-by-searching (LSR) illustrate this decreasing technology cost, denoting the percentage of variation in cost as a result of doubling the cumulative production and R&D investment, respectively. The LDR is calculated as and the LSR is obtained as .
Due to a lack of data, a new approach is developed to estimate the learning-by-searching ratio of the two-factor learning curve and the average R&D budget using particle swarm optimization coded into MATLAB R2019b.
To validate this approach, the results for the United States residential photovoltaic [83] and the United States wind supply [84] are compared with the IEA R&D budget database [64] and other studies [55]. For residential photovoltaic using 17-year data from 2000 to 2016 for the US, with a time delay of one year for investment on R&D, the estimated learning-by-doing ratio is 9.5%, and the learning-by-searching ratio is 18.8% with a goodness of fit (R2) of 94.0%. For the United States residential photovoltaic, using real data from 2009 to 2016, a study [60] reached 94.9% for a goodness of fit (R2). The real yearly average investment on R&D in the United States residential photovoltaic [64] is 0.128 $Billion (2018 United States dollars) based on the IEA R&D budget database, and the estimated average by the proposed PSO (particle swarm optimization) approach in this study is 0.124 $Billion (2018 United States dollars).
For wind technology, using data from 2009 to 2018 for the US, with a time delay of three years for investment on R&D, the estimated LDR is 17.1%, and the LSR is 38.7% with a goodness of fit (R2) of 92.2%. For the United States wind technology, using real data from 2009 to 2016, a study [60] reached 97.4% for a goodness of fit (R2). The real yearly average investment on R&D in the United States wind industry [64] is 0.059 $Billion (2018 United States dollars) based on the IEA R&D budget database, and the estimated average by the proposed (particle swarm optimization) PSO approach in this study is 0.056 $Billion (2018 United States dollars).
Based on the literature [60], the decay factor for invested R&D on wind and photovoltaic technologies is between 2.5% and 10.5%. By considering this decay factor, the proposed approach is considered suitable to apply in this study. The parameters of two-factor learning curves for the levelized cost of desalinated water and levelized cost of utility-scale wind and photovoltaic electricity are estimated using the proposed approach.
Due to a lack of data for the levelized cost of wind and photovoltaic energy in the Middle East, 81 projects have been examined to estimate the LCOE, which are summarized in Table A1 and Table A2. The levelized cost of energy is obtained from study [81] as:
where describes the investment expenditures in each year, depicts the operations and maintenance expenditures in year y, is the fixed expenditures in year y, is the discount rate, shows the lifetime of the technology, is the installed capacity of the technology in each year, and is the capacity factor of the supply technology in each year.
The capital investment costs, fixed and variable costs, and the average capacity factor (see Table A3) of utility-scale wind and photovoltaic electricity supplies have been obtained using overall variable renewable electricity production of the countries [85,86,87] in the Middle East and the examined projects in Table A1 and Table A2. The capacity of wind and photovoltaic resources from 2000 to 2018 in the Middle East is shown in Figure A1.
The Middle East in this study refers to these countries: Islamic Republic of Iran, Iraq, Israel, Jordan, Kuwait Bahrain, Palestine, Turkey, Egypt, Syrian Arab Republic, Lebanon, Oman, Qatar, Kingdom of Saudi Arabia, United Arab Emirates, Yemen.

Table A1.
List utility-scale wind projects for obtaining LCOE.
| Project | Capacity in MW | Investment M$ 2018 | LCOE ($/MWh) | Year |
|---|---|---|---|---|
| Bahçe Wind Farm | 135 | 230.31 | 107.8 | 2010 |
| Sayalar Wind Power Plant | 23 | 32.93 | 73.8 | 2011 |
| Samurlu Wind Power Plant | 30 | 49.45 | 77.8 | 2011 |
| Kozbeyli Wind Power Plant | 29.9 | 47.97 | 77.0 | 2011 |
| Usak Wind Power Plant | 54 | 62.14 | 69.1 | 2012 |
| Sadilli Wind Power Plant | 38.5 | 54.75 | 68.8 | 2012 |
| Karadere Wind Power Plant | 15 | 29.75 | 77.7 | 2012 |
| Edincik Wind Power Plant | 30 | 52.43 | 74.0 | 2012 |
| Günaydın Wind Power Plant | 12.5 | 18.75 | 70.1 | 2012 |
| Geres Wind Power Plant | 27.5 | 38.156 | 67.8 | 2013 |
| Söke Wind Power Plant | 45 | 57.79 | 66.1 | 2013 |
| Salman Wind Power Plant | 27.5 | 39.43 | 68.5 | 2013 |
| Mocha Wind Park Project | 60 | 155.22 | 87.5 | 2013 |
| Geres Wind Power Plant | 27.5 | 37.57 | 60.9 | 2014 |
| Bozyaka Wind Power Plant | 4.8 | 8.64 | 66.1 | 2014 |
| Ova Wind Power Plant | 18 | 24.09 | 60.5 | 2014 |
| Edincik Ii Wind Power Plant | 26.4 | 36.01 | 60.9 | 2014 |
| Pitane Wind Power Plant | 4.8 | 9.10 | 69.2 | 2014 |
| Tafila Wind Farm | 117 | 304.06 | 80.1 | 2014 |
| Amasya Wind Power Plant | 42 | 76.77 | 64.4 | 2015 |
| Bozyaka Wind Power Plant | 12.5 | 8.66 | 46.5 | 2015 |
| Umurlar Ext Power Plant | 26.4 | 35.81 | 52.6 | 2016 |
| Soma Wind Power Plant | 30 | 36.55 | 50.8 | 2016 |
| Edincik Iii Wind Power Plant | 21 | 26.20 | 51.2 | 2016 |
| Incesu Wind Power Plant | 14 | 20.85 | 54.4 | 2016 |
| Çakıl Wind Power Plant | 31.55 | 50.53 | 54.5 | 2017 |
| Çamseki Plant (Extension) | 42.3 | 39.98 | 45.6 | 2017 |
| Alibey Adası Wind Power Plant | 30 | 36.64 | 49.3 | 2017 |
| Gulf Of El Zayt Farm, El Zayt | 200 | 348.30 | 56.4 | 2017 |
| Egypt - Development Project | 250 | 409.77 | 55.0 | 2018 |
| Lekela Egypt Power Boo S.A.E | 252 | 339 | 30.1 | 2018 |
| Yahşelli Wind Power Plant | 20 | 31.4 | 30.1 | 2018 |
Table A2.
List of large-scale PV projects for obtaining LCOE.
| Project | Capacity in MW | Investment M$ 2018 | LCOE ($/MWh) | Year |
|---|---|---|---|---|
| Belectric And Solel Boneh | 10 | - | 169.0 | 2013 |
| Talmei Bilu Solar Power Plant | 21 | 48.39 | 256.4 | 2013 |
| Falcon Ma An For Solar Energy | 10 | 50 | 179.8 | 2014 |
| Shamsuna Power Company Llc. | 10 | 21 | 171.9 | 2014 |
| Zahrat Al-Salam For Energy | 10 | 31 | 200.2 | 2014 |
| Al-Zanbaq For Energy Generation Psc | 10 | 31 | 200.2 | 2014 |
| Al-Ward Al-Joury For Energy Generation PSC | 40 | 31 | 200.2 | 2014 |
| Ketura Solar Facility | 200 | 83.7 | 139.3 | 2015 |
| Mohammed Bin Rashid Almaktoum Solar Park Phase II | 10 | 345.38 | 130.7 | 2015 |
| Maan Development Area | 10 | 31.78 | 164.8 | 2015 |
| Martifer Solar | 52.5 | 27.55 | 154.8 | 2015 |
| First Solar | 28.3 | 158.92 | 161.2 | 2015 |
| Scatec Solar Asa | 43 | 50.3 | 131.9 | 2015 |
| Sunedison | 12.9 | 105.94 | 148.0 | 2015 |
| Zaatari Syrian Refugee Camp | 50 | 15.69 | 110.1 | 2016 |
| Al Sharika Al Mahaliya Li Aamal Al Miya Wa Al Taka Al Shamsia Psc | 85 | 72 | 115.2 | 2016 |
| Akfen Solar Power Project | 17.9 | 100 | 109.2 | 2016 |
| Soho Solar PV Power Plant | 200 | 25.46 | 114.8 | 2016 |
| Mohammed Bin Rashid Al Maktoum Solar Park II | 29.68 | 327.82 | 119.7 | 2016 |
| Hipot Solar PV Power Plant | 500 | 38.07 | 111.6 | 2016 |
| MGES Power | 200 | 261.56 | 94.3 | 2016 |
| Baynouna Solar Energy Company Psc | 66.6 | 266.35 | 103.1 | 2017 |
| Alsafawi For Green Energy PSC | 5.814 | 35 | 78.1 | 2017 |
| İven Solar PV Power Plant | 17.988 | 7.84 | 96.1 | 2017 |
| Caba Solar PV Power Plant | 7 | 23.77 | 95.5 | 2017 |
| Stars Solar PV Power Plant | 48.946 | 11.56 | 102.8 | 2017 |
| Met-Gün Solar PV Power Plant | 34.5 | 56.49 | 91.8 | 2017 |
| Çiftay Solar PV Power Plant | 10.3 | 47.48 | 96.7 | 2017 |
| Başarı Solar PV Power Plant | 35.9 | 13.65 | 95.6 | 2017 |
| Zen Solar PV Power Plant | 15.25 | 57.37 | 101.6 | 2017 |
| Aktaş Solar PV Power Plant | 10.59 | 19.40 | 94.4 | 2017 |
| Zigana Solar PV Power Plant | 8.15 | 15.23 | 98.1 | 2017 |
| Koyuncu Nevşehir Solar PV Power Plant | 950 | 9.62 | 92.4 | 2017 |
| Mohammed Bin Rashid Al Maktoum Park | 1177 | 962.96 | 88.8 | 2017 |
| Noor Abu Dhabi Solar PV Plant in Sweihan | 100 | 891.25 | 83.1 | 2017 |
| Pdo Amin PV Plant | 100 | 100.00 | 80.8 | 2018 |
| Askar Landfill | 9.98 | - | 49.2 | 2018 |
| Mt Dogal Solar PV Power Plant | 9.95 | 18.93 | 98.8 | 2018 |
| Omicron Engil Solar PV Power Plant | 9.9 | 18.45 | 97.9 | 2018 |
| Me - Se Solar PV Power Plant | 9.98 | 16.46 | 94.1 | 2018 |
| Yaysun Solar PV Power Plant | 12.2 | 19 | 99.0 | 2018 |
| Sunfarming Eurasia Asset Enerji Yat | 500 | 16 | 86.2 | 2018 |
| Ibri PV Plant | 9.95 | 500.00 | 80.8 | 2018 |
| Omicron Ercis Solar PV Power Plant | 9.95 | 17.47 | 55.4 | 2019 |
| Iota Solar PV Power Plant | 9.95 | 17.91 | 55.4 | 2019 |
| Psi Engil Solar PV Power Plant | 26 | 17.80 | 55.4 | 2019 |
| Cingilli Solar PV Power Plant (Licensed) | - | 38.35 | 55.4 | 2019 |
| Sakaka Project | 200 | 300.00 | 23.4 | 2019 |
| Al-Muwaqqar Solar Energy Project | 10 | 253.83 | 55.4 | 2019 |
Table A3.
Average capacity factor and LCOE of wind and PV electricity resources in the Middle East.
| Year | Wind CF | Photovoltaic CF | Wind LCOE ($/MWh) | Photovoltaic LCOE ($/MWh) |
|---|---|---|---|---|
| 2000 | 0.19 | 0.17 | - | - |
| 2001 | - | 0.17 | - | - |
| 2002 | 0.21 | 0.21 | - | - |
| 2003 | - | 0.17 | - | - |
| 2004 | 0.23 | 0.16 | - | - |
| 2005 | 0.23 | 0.19 | - | - |
| 2006 | 0.20 | 0.15 | - | - |
| 2007 | 0.17 | 0.21 | - | - |
| 2008 | 0.25 | 0.19 | - | - |
| 2009 | 0.18 | 0.16 | - | - |
| 2010 | 0.26 | 0.20 | 107.8 | - |
| 2011 | 0.31 | 0.17 | 76.2 | - |
| 2012 | 0.29 | 0.17 | 72.7 | - |
| 2013 | 0.28 | 0.20 | 72.5 | 212.7 |
| 2014 | 0.29 | 0.20 | 66.3 | 190.5 |
| 2015 | 0.29 | 0.19 | 55.4 | 147.2 |
| 2016 | 0.34 | 0.20 | 52.2 | 110.7 |
| 2017 | 0.34 | 0.21 | 51.5 | 94.2 |
| 2018 | 0.37 | 0.23 | 42.5 | 85.8 |
| 2019 | - | 0.23 | - | 50.1 |
Appendix D. Location of Rural Districts
The name and location of 19 rural districts in Jask county, which are selected in this study, are summarized in Table A4.
Table A4.
List of rural locations selected as the case study.
Appendix E. Renewable-Powered Desalination Technologies
Table A5.
List of the reference studies to outline the development state of renewable-powered desalination technologies.
Table A5.
List of the reference studies to outline the development state of renewable-powered desalination technologies.
| Technology | Size (m3/day) | Cost ($/m3) | Year | Ref. |
|---|---|---|---|---|
| PV RO | 1–250 | 3.6–33.0 | 2017 | [88] |
| PV RO | 400 | 1.5–3.4 | 2015 | [89] |
| PV RO | <100 | 6.5–15.6 | 2013 | [90] |
| PV RO | - | 12.5–16.8 | 2017 | [91] |
| PV RO | <100 | 11.7–15.6 | 2017 | [92] |
| Wind RO | 80 | - | 2017 | [91] |
| Wind RO | 2400–3360 | 0.7–2.0 | 2017 | [88] |
| Wind RO | - | 1.8–5.4 | 2015 | [89] |
| Wind RO | 50–2000 | 1.9–9.0 | 2013 | [90] |
| Wind RO | 50–2000 | 2.0–5.2 | 2017 | [92] |
| Solar thermal MED | 20 | - | 2017 | [91] |
| Solar thermal MED | > 5000 | 2.4–2.8 | 2017 | [88] |
| Solar thermal MED | >5000 | 2.5–3.0 | 2017 | [91] |
| Solar thermal MED | >5000 | 2.0–2.5 | 2017 | [92] |
| Solar thermal MED | - | 1.0–7.3 | 2015 | [89] |
| Solar still | 0.01–0.2 | 1.3–6.5 | 2017 | [88,93] |
| Solar still | <1.2 | - | 2019 | [94] |
| Solar still | <1.0 | 1.3–6.5 | 2013 | [90] |
| PV ED | <1.0 | 5.8–16.0 | 2017 | [88] |
| PV ED | <1.0 | 1.2–12.6 | 2017 | [91] |
| PV ED | 0.001–0.2 | 0.2–13.0 | 2015 | [95] |
| Geothermal MED | 200 | - | 2017 | [91] |
| Geothermal MED | 1920 | 1.7 | 2017 | [88] |
| Geothermal MED | 80 | 2.0–2.8 | 2013 | [90] |
| Geothermal MED | 50–1000 | - | 2017 | [92] |
| Geothermal MED | 3.8–5.7 | 2018 | [96] | |
| Geothermal MED | 1440 | 1.7 | 2019 | [97] |
| Solar HDH | 0.005–1.2 | 3.0–7.0 | 2016 | [98] |
| Solar HDH | - | 8.6–9.7 | 2017 | [88] |
| Solar HDH | - | 2.8–7.0 | 2017 | [91] |
| Solar HDH | 0.001–0.1 | 2.6–6.5 | 2017 | [92] |
| Solar thermal MSF | - | 1.0–5.0 | 2017 | [88] |
| Solar thermal MSF | 0.2–10 | - | 2011 | [99] |
| Solar thermal MSF | 1–10 | - | 2019 | [100] |
| Solar MD | 0.002–0.1 | 10.5–19.5 | 2017 | [88] |
| Solar MD | 0.002–0.1 | 10.5–19.5 | 2013 | [90] |
| Wind/MVC | < 100 | 5.2–7.8 | 2017 | [88] |
| Wind/MVC | <100 | 5.2–7.8 | 2013 | [90] |
| Wind MVC | <100 | 5.6–8.4 | 2017 | [91] |
| Ocean-based RO | 1000–3000 | 0.7–1.2 | 2017 | [92] |
| Ocean-based RO | 500–1800 | 0.9–1.0 | 2014 | [101] |
| Wind ED | 72–192 | - | 2011 | [102] |
| Wind ED | - | 2.0–3.5 | 2018 | [96] |
| Geothermal MD | 17 | 13 | 2018 | [103] |
| Geothermal MD | 20,000 | 0.5 | 2018 | [96] |
| Geothermal HDH | 3 | 1.2 | 2005 | [104] |
| Geothermal HDH | - | 1.2 | 2007 | [105] |
| Geothermal HDH | - | 1.2 | 2019 | [97] |
| Geothermal HDH | - | 1.2 | 2016 | [106] |
References
- UN Water. Sustainable Development Goal 6: Synthesis report 2018 on Water and Sanitation; United Nations: New York, NY, USA, 2018; ISBN 978-92-1-101370-2. [Google Scholar]
- The United Nations World Water Development Report 2019: Leaving no one Behind; UNESCO World Water Assessment Programme; UNESCO: Paris, France, 2019.
- World Bank. The Role of Desalination in an Increasingly Water-Scarce World; Water Papers; World Bank: Washington, DC, USA, 2019. [Google Scholar]
- Aliewi, A.; El-Sayed, E.; Akbar, A.; Hadi, K.; Al-Rashed, M. Evaluation of desalination and other strategic management options using multi-criteria decision analysis in Kuwait. Desalination 2017, 413, 40–51. [Google Scholar] [CrossRef]
- Vakilifard, N.; Anda, M.; Bahri, A.P.; Ho, G. The role of water-energy nexus in optimising water supply systems—Review of techniques and approaches. Renew. Sustain. Energy Rev. 2018, 82, 1424–1432. [Google Scholar] [CrossRef]
- Li, Z.; Siddiqi, A.; Anadon, L.D.; Narayanamurti, V. Towards sustainability in water-energy nexus: Ocean energy for seawater desalination. Renew. Sustain. Energy Rev. 2018, 82, 3833–3847. [Google Scholar] [CrossRef] [Green Version]
- Reverse Osmosis (RO) Membrane Desalination Driven by Wind and Solar Photovoltaic (PV) Energy: State of the Art and Challenges for Large-Scale Implementation—ScienceDirect. Available online: https://www.sciencedirect.com/science/article/pii/S1364032119303995?via%3Dihub (accessed on 12 January 2020).
- IRENA, IEA-ETSAP Energy: Water Desalination Using Renewable Energy—Google Scholar. Available online: https://scholar.google.com/scholar_lookup?title=Water%20desalination%20using%20renewable%20energy%3A%20insights%20for%20policy%20makers&publication_year=2013&author=IRENA%2C%20IEA-ETSAP (accessed on 12 January 2020).
- Ghaffour, N.; Bundschuh, J.; Mahmoudi, H.; Goosen, M.F.A. Renewable energy-driven desalination technologies: A comprehensive review on challenges and potential applications of integrated systems. Desalination 2015, 356, 94–114. [Google Scholar] [CrossRef] [Green Version]
- Khan, M.A.M.; Rehman, S.; Al-Sulaiman, F.A. A hybrid renewable energy system as a potential energy source for water desalination using reverse osmosis: A review. Renew. Sustain. Energy Rev. 2018, 97, 456–477. [Google Scholar] [CrossRef]
- Al-Kaabi, A.H.; Mackey, H.R. Environmental assessment of intake alternatives for seawater reverse osmosis in the Arabian Gulf. J. Environ. Manag. 2019, 242, 22–30. [Google Scholar] [CrossRef]
- Birge, D.; Berger, A.M. Transitioning to low-carbon suburbs in hot-arid regions: A case-study of Emirati villas in Abu Dhabi. Build. Environ. 2019, 147, 77–96. [Google Scholar] [CrossRef]
- Ghorbani, N.; Aghahosseini, A.; Breyer, C. Transition towards a 100% Renewable Energy System and the Role of Storage Technologies: A Case Study of Iran. Energy Proc. 2017, 135, 23–36. [Google Scholar] [CrossRef]
- Caldera, U.; Bogdanov, D.; Afanasyeva, S.; Breyer, C. Role of Seawater Desalination in the Management of an Integrated Water and 100% Renewable Energy Based Power Sector in Saudi Arabia. Water 2018, 10, 3. [Google Scholar] [CrossRef] [Green Version]
- Caldera, U.; Breyer, C. Impact of Battery and Water Storage on the Transition to an Integrated 100% Renewable Energy Power System for Saudi Arabia. Energy Proc. 2017, 135, 126–142. [Google Scholar] [CrossRef]
- Abdelshafy, A.M.; Hassan, H.; Jurasz, J. Optimal design of a grid-connected desalination plant powered by renewable energy resources using a hybrid PSO–GWO approach. Energy Convers. Manag. 2018, 173, 331–347. [Google Scholar] [CrossRef]
- Salama, L.T.A.; Abdalla, K.Z. Design and analysis of a solar photovoltaic powered seawater reverse osmosis plant in the southern region of the gaza strip. Desalin. Water Treat. 2019, 143, 96–101. [Google Scholar] [CrossRef] [Green Version]
- Li, Q.; Loy-Benitez, J.; Nam, K.; Hwangbo, S.; Rashidi, J.; Yoo, C. Sustainable and reliable design of reverse osmosis desalination with hybrid renewable energy systems through supply chain forecasting using recurrent neural networks. Energy 2019, 178, 277–292. [Google Scholar] [CrossRef]
- Jaime Sadhwani, J.; Sagaseta de Ilurdoz, M. Primary energy consumption in desalination: The case of Gran Canaria. Desalination 2019, 219–229. [Google Scholar] [CrossRef]
- Marini, M.; Palomba, C.; Rizzi, P.; Casti, E.; Marcia, A.; Paderi, M. A multicriteria analysis method as decision-making tool for sustainable desalination: The asinara island case study. Desalin. Water Treat. 2017, 61, 274–283. [Google Scholar] [CrossRef]
- Katz, D.; Shafran, A. Transboundary exchanges of renewable energy and desalinatedwater in the Middle East. Energies 2019, 12, 1455. [Google Scholar] [CrossRef] [Green Version]
- Corsini, A.; Tortora, E.; Cima, E. Preliminary assessment of wave energy use in an off-grid minor island desalination plant. Energy Proc. 2015, 82, 789–796. [Google Scholar] [CrossRef] [Green Version]
- Mentis, D.; Karalis, G.; Zervos, A.; Howells, M.; Taliotis, C.; Bazilian, M.; Rogner, H. Desalination using renewable energy sources on the arid islands of South Aegean Sea. Energy 2016, 94, 262–272. [Google Scholar] [CrossRef]
- Fornarelli, R.; Shahnia, F.; Anda, M.; Bahri, P.A.; Ho, G. Selecting an economically suitable and sustainable solution for a renewable energy-powered water desalination system: A rural Australian case study. Desalination 2018, 435, 128–139. [Google Scholar] [CrossRef]
- Shahabi, M.P.; McHugh, A.; Anda, M.; Ho, G. Environmental life cycle assessment of seawater reverse osmosis desalination plant powered by renewable energy. Renew. Energy 2014, 67, 53–58. [Google Scholar] [CrossRef] [Green Version]
- Nagaraj, R.; Murthy, D.T.; Rajput, M.M. Modeling Renewables Based Hybrid Power System with Desalination Plant Load Using Neural Networks. Distrib. Gener. Altern. Energy J. 2019, 34, 32–46. [Google Scholar] [CrossRef]
- Sadiqa, A.; Gulagi, A.; Breyer, C. Energy transition roadmap towards 100% renewable energy and role of storage technologies for Pakistan by 2050. Energy 2018, 147, 518–533. [Google Scholar] [CrossRef]
- Hamilton, J.; Negnevitsky, M.; Wang, X.; Lyden, S. High penetration renewable generation within Australian isolated and remote power systems. Energy 2019, 684–692. [Google Scholar] [CrossRef]
- Cavalcante, R.G., Jr.; Freitas, M.A.V.; da Silva, N.F.; de Azevedo Filho, F.R. Sustainable groundwater exploitation aiming at the reduction of water vulnerability in the Brazilian semi-arid region. Energies 2019, 12, 904. [Google Scholar] [CrossRef] [Green Version]
- Stokes, J.R.; Horvath, A. Energy and air emission effects of water supply. Environ. Sci. Technol. 2009, 43, 2680–2687. [Google Scholar] [CrossRef] [Green Version]
- Gençer, E.; Agrawal, R. Toward supplying food, energy, and water demand: Integrated solar desalination process synthesis with power and hydrogen coproduction. Resour. Conserv. Recycl. 2018, 133, 331–342. [Google Scholar] [CrossRef]
- Aminfard, S.; Davidson, F.T.; Webber, M.E. Multi-layered spatial methodology for assessing the technical and economic viability of using renewable energy to power brackish groundwater desalination. Desalination 2019, 450, 12–20. [Google Scholar] [CrossRef]
- Gold, G.M.; Webber, M.E. The energy-water nexus: An analysis and comparison of various configurations integrating desalination with renewable power. Resources 2015, 4, 227–276. [Google Scholar] [CrossRef] [Green Version]
- Kim, J.S.; Chen, J.; Garcia, H.E. Modeling, control, and dynamic performance analysis of a reverse osmosis desalination plant integrated within hybrid energy systems. Energy 2016, 112, 52–66. [Google Scholar] [CrossRef] [Green Version]
- De Barbosa, L.S.N.S.; Bogdanov, D.; Vainikka, P.; Breyer, C. Hydro, wind and solar power as a base for a 100% renewable energy supply for South and Central America. PLoS ONE 2017, 12. [Google Scholar] [CrossRef] [Green Version]
- Mata-Torres, C.; Escobar, R.A.; Cardemil, J.M.; Simsek, Y.; Matute, J.A. Solar polygeneration for electricity production and desalination: Case studies in Venezuela and northern Chile. Renew. Energy 2017, 101, 387–398. [Google Scholar] [CrossRef]
- Aghahosseini, A.; Bogdanov, D.; Barbosa, L.S.N.S.; Breyer, C. Analysing the feasibility of powering the Americas with renewable energy and inter-regional grid interconnections by 2030. Renew. Sustain. Energy Rev. 2019, 187–205. [Google Scholar] [CrossRef]
- Vakilifard, N.; Bahri, P.A.; Anda, M.; Ho, G. An interactive planning model for sustainable urban water and energy supply. Appl. Energy 2019, 332–345. [Google Scholar] [CrossRef]
- Gyalai-Korpos, M.; Zentkó, L.; Hegyfalvi, C.; Detzky, G.; Tildy, P.; Hegedűsné Baranyai, N.; Pintér, G.; Zsiborács, H. The Role of Electricity Balancing and Storage: Developing Input Parameters for the European Calculator for Concept Modeling. Sustainability 2020, 12, 811. [Google Scholar] [CrossRef] [Green Version]
- IEA. Global Energy Review 2020—Analysis and Key Findings. A Report by the International Energy Agency; International Energy Agency: Paris, France, 2020. [Google Scholar]
- Gude, V.G. Energy storage for desalination processes powered by renewable energy and waste heat sources. Appl. Energy 2015, 137, 877–898. [Google Scholar] [CrossRef]
- Ali, A.; Tufa, R.A.; Macedonio, F.; Curcio, E.; Drioli, E. Membrane technology in renewable-energy-driven desalination. Renew. Sustain. Energy Rev. 2018, 81, 1–21. [Google Scholar] [CrossRef]
- Mohamed, E.S.; Papadakis, G.; Mathioulakis, E.; Belessiotis, V. A direct coupled photovoltaic seawater reverse osmosis desalination system toward battery based systems—A technical and economical experimental comparative study. Desalination 2008, 221, 17–22. [Google Scholar] [CrossRef]
- Qiblawey, H.; Banat, F.; Al-Nasser, Q. Laboratory setup for water purification using household PV-driven reverse osmosis unit. Desalin. Water Treat. 2009, 7, 53–59. [Google Scholar] [CrossRef]
- Alghoul, M.A.; Poovanaesvaran, P.; Mohammed, M.H.; Fadhil, A.M.; Muftah, A.F.; Alkilani, M.M.; Sopian, K. Design and experimental performance of brackish water reverse osmosis desalination unit powered by 2 kW photovoltaic system. Renew. Energy 2016, 93, 101–114. [Google Scholar] [CrossRef]
- Freire-Gormaly, M.; Bilton, A.M. Experimental quantification of the effect of intermittent operation on membrane performance of solar powered reverse osmosis desalination systems. Desalination 2018, 435, 188–197. [Google Scholar] [CrossRef]
- Kharraz, J.A.; Richards, B.S.; Schäfer, A.I. Autonomous Solar-Powered Desalination Systems for Remote Communities. In Desalination Sustainability: A Technical, Socioeconomic, and Environmental Approach; Elsevier: Amsterdam, The Netherlands, 2017; pp. 75–125. [Google Scholar]
- Tomaszewska, A.; Chu, Z.; Feng, X.; O’Kane, S.; Liu, X.; Chen, J.; Ji, C.; Endler, E.; Li, R.; Liu, L.; et al. Lithium-ion battery fast charging: A review. eTransportation 2019, 1, 100011. [Google Scholar] [CrossRef]
- Gude, V.G. Desalination and sustainability—An appraisal and current perspective. Water Res. 2016, 89, 87–106. [Google Scholar] [CrossRef] [PubMed]
- Zhou, Y.; Tol, R.S.J. Evaluating the costs of desalination and water transport. Water Resour. Res. 2005, 41. [Google Scholar] [CrossRef]
- Hoff, H. Understanding the Nexus; SEI: Oaks, PA, USA, 2011. [Google Scholar]
- Allan, T.; Keulertz, M.; Woertz, E. The water-food-energy nexus: An introduction to nexus concepts and some conceptual and operational problems. Int. J. Water Resour. Dev. 2015, 31, 301–311. [Google Scholar] [CrossRef]
- Rubin, E.S.; Azevedo, I.M.L.; Jaramillo, P.; Yeh, S. A review of learning rates for electricity supply technologies. Energy Policy 2015, 86, 198–218. [Google Scholar] [CrossRef]
- Shahabi, M.P.; McHugh, A.; Anda, M.; Ho, G. A framework for planning sustainable seawater desalination water supply. Sci. Total Environ. 2017, 575, 826–835. [Google Scholar] [CrossRef]
- Zhou, Y.; Gu, A. Learning Curve Analysis of Wind Power and Photovoltaics Technology in US: Cost Reduction and the Importance of Research, Development and Demonstration. Sustainability 2019, 11, 2310. [Google Scholar] [CrossRef] [Green Version]
- Statistical Center of Iran > Iran Statistical Yearbook > Statistical Yearbook 2011–2012. Available online: https://www.amar.org.ir/english/Iran-Statistical-Yearbook/Statistical-Yearbook-2011-2012 (accessed on 10 January 2020).
- Google Maps. Available online: https://www.google.com/maps/@35.0167912,135.7805384,15z (accessed on 16 March 2020).
- Jask Wind and Solar Radiation Data. Available online: http://www.satba.gov.ir/suna_content/media/image/2015/09/3790_orig.xlsx (accessed on 10 January 2020).
- Statistical Center of Iran > Iran Statistical Yearbook > Statistical-Yearbook-2016–2017. Available online: https://www.amar.org.ir/english/Iran-Statistical-Yearbook/Statistical-Yearbook-2016-2017 (accessed on 18 January 2020).
- Noorollahi, Y.; Shabbir, M.S.; Siddiqi, A.F.; Ilyashenko, L.K.; Ahmadi, E. Review of two decade geothermal energy development in Iran, benefits, challenges, and future policy. Geothermics 2019, 77, 257–266. [Google Scholar] [CrossRef]
- Iran’s Sixth Five-Year Development Plan. Available online: https://rc.majlis.ir/fa/law/show/1014547 (accessed on 5 March 2020).
- Omid, S.K. Iran’s Transition to Renewable Energy: Challenges and Opportunities. Middle East Policy 2019, 26. [Google Scholar] [CrossRef]
- General Algebraic Modeling System (GAMS). Available online: https://www.gams.com/download/ (accessed on 1 May 2020).
- Population Estimates and Projections, World Bank Group. Available online: https://datacatalog.worldbank.org/dataset/population-estimates-and-projections (accessed on 8 October 2019).
- Cole, W.J.; Frazier, A. Cost Projections for Utility-Scale Battery Storage; Technical Report NREL/TP-6A20-73222; National Renewable Energy Laboratory: Golden, CO, USA, 2019; p. 1529218. [Google Scholar]
- Battke, B.; Schmidt, T.S. Cost-efficient demand-pull policies for multi-purpose technologies—The case of stationary electricity storage. Appl. Energy 2015, 155, 334–348. [Google Scholar] [CrossRef]
- Köberle, A.C.; Gernaat, D.E.H.J.; van Vuuren, D.P. Assessing current and future techno-economic potential of concentrated solar power and photovoltaic electricity generation. Energy 2015, 89, 739–756. [Google Scholar] [CrossRef] [Green Version]
- Miketa, A.; Schrattenholzer, L. Experiments with a methodology to model the role of R&D expenditures in energy technology learning processes; first results. Energy Policy 2004, 32, 1679–1692. [Google Scholar] [CrossRef]
- Kobos, P.H.; Erickson, J.D.; Drennen, T.E. Technological learning and renewable energy costs: Implications for US renewable energy policy. Energy Policy 2006, 34, 1645–1658. [Google Scholar] [CrossRef]
- ALMAR Water Solution Desalination Technologies and Economics: CAPEX, OPEX & Technological Game Changers to Come. Available online: https://www.cmimarseille.org/knowledge-library/desalination-technologies-and-economics-capex-opex-technological-game-changers-0 (accessed on 18 January 2020).
- Atlas Desalination Powered by Renewable Energy. Available online: https://waterscarcityatlas.org/desalination-powered-by-renewable-energy/ (accessed on 10 February 2020).
- Caldera, U. Learning Curve for Seawater Reverse Osmosis Desalination Plants: Capital Cost Trend of the Past, Present and Future. Water Resour. Res. 2017, 53, 10523–10538. [Google Scholar] [CrossRef] [Green Version]
- Mayor, B. Multidimensional Analysis of Nexus Technologies I: Diffusion, Scaling and Cost Trends of Desalination; IIASA: Laxenburg, Austria, 2018. [Google Scholar]
- UNESCO Institute for Statistic How Much Does Your Country Invest in R&D? Available online: http://www.uis.unesco.org/_LAYOUTS/UNESCO/research-and-development-spending/index-en.html (accessed on 15 April 2020).
- Sood, A.; Smakhtin, V. Can Desalination and Clean Energy Combined Help to Alleviate Global Water Scarcity? JAWRA J. Am. Water Resour. Assoc. 2014, 50, 1111–1123. [Google Scholar] [CrossRef]
- National Petrochemical Company GHG Emission in Iran. Available online: https://hse.nipc.ir/uploads/mop-307.pdf (accessed on 20 March 2020).
- Azadi, P.; Sarmadi, A.; Mahmoudzadeh, A.; Shirvani, T. The Outlook for Natural Gas, Electricity, and Renewable Energy in Iran; Elsevier: Amsterdam, The Netherlands, 2017. [Google Scholar]
- United Nations Development Assistance Framework (UNDAF) for Iran. Available online: https://www.unodc.org/islamicrepublicofiran/en/undaf-2017-2021.html (accessed on 16 May 2020).
- Sustainable Development Goals (SDG), Iran: Sustainable Development Knowledge Full Report. Available online: https://sustainabledevelopment.un.org/memberstates/iran (accessed on 16 May 2020).
- Alonso, G.; Valle, E.D.; Ramirez, J.R. Desalination in Nuclear Power Plants; Woodhead Publishing: Sawston, UK, 2020; ISBN 978-0-12-822644-5. [Google Scholar]
- Ahmadi, E.; McLellan, B.; Ogata, S.; Tezuka, T. Modelling the water-energy-nexus to assist the design of economic and regulatory support instruments towards sustainability. In Proceedings of the Chemeca 2019: Chemical Engineering Megatrends and Elements, Sydney NSW, Australia, 29 September–2 October 2019; p. 550. [Google Scholar]
- Mehrpooya, M.; Mohammadi, M.; Ahmadi, E. Techno-economic-environmental study of hybrid power supply system: A case study in Iran. Sustain. Energy Technol. Assess. 2018, 25, 1–10. [Google Scholar] [CrossRef]
- Barbose, G.; Darghouth, N.; Millstein, D.; LaCommare, K.; DiSanti, N.; Widiss, R. Tracking the Sun X: The Installed Price of Residential and Non-Residential Photovoltaic Systems in the United States; Berkeley Lab: Berkeley, CA, USA, 2015. [Google Scholar]
- Electricity Markets and Policy Group Wind Technologies Market Report. Available online: https://emp.lbl.gov/wind-technologies-market-report (accessed on 18 January 2020).
- Data and Statistics—IRENA REsource. Available online: http://resourceirena.irena.org/gateway/dashboard/?topic=4&subTopic=17 (accessed on 18 January 2020).
- IRENA Renewable Power Generation Costs in 2018. Available online: /publications/2019/May/Renewable-power-generation-costs-in-2018 (accessed on 18 January 2020).
- IRENA Renewable Power Generation Costs in 2017. Available online: /publications/2018/Jan/Renewable-power-generation-costs-in-2017 (accessed on 18 January 2020).
- Manju, S.; Sagar, N. Renewable energy integrated desalination: A sustainable solution to overcome future fresh-water scarcity in India. Renew. Sustain. Energy Rev. 2017, 73, 594–609. [Google Scholar] [CrossRef]
- Renewable Desalination: Technology Options for Islands. Available online: https://www.irena.org/publications/2015/Dec/Renewable-Desalination-Technology-Options-for-Islands (accessed on 16 September 2019).
- Al-Karaghouli, A.; Kazmerski, L.L. Energy consumption and water production cost of conventional and renewable-energy-powered desalination processes. Renew. Sustain. Energy Rev. 2013, 24, 343–356. [Google Scholar] [CrossRef]
- Alkaisi, A.; Mossad, R.; Sharifian-Barforoush, A. A Review of the Water Desalination Systems Integrated with Renewable Energy. Energy Procedia 2017, 110, 268–274. [Google Scholar] [CrossRef]
- Shahzad, M.W.; Burhan, M.; Ang, L.; Ng, K.C. Energy-water-environment nexus underpinning future desalination sustainability. Desalination 2017, 413, 52–64. [Google Scholar] [CrossRef]
- Manchanda, H.; Kumar, M. Study of water desalination techniques and a review on active solar distillation methods. Environ. Prog. Sustain. Energy 2018, 37, 444–464. [Google Scholar] [CrossRef]
- Gopi, G.; Arthanareeswaran, G.; AF, I. Perspective of renewable desalination by using membrane distillation. Chem. Eng. Res. Des. 2019, 520–537. [Google Scholar] [CrossRef]
- Fernandez-Gonzalez, C.; Dominguez-Ramos, A.; Ibañez, R.; Irabien, A. Sustainability assessment of electrodialysis powered by photovoltaic solar energy for freshwater production. Renew. Sustain. Energy Rev. 2015, 47, 604–615. [Google Scholar] [CrossRef]
- Khalilpour, K.R. Polygeneration with Polystorage: For Chemical and Energy Hubs; Academic Press: Cambridge, MA, USA, 2018; ISBN 0-12-813307-4. [Google Scholar]
- Kucera, J. Desalination: Water from Water; John Wiley & Sons: Hoboken, NJ, USA, 2019; ISBN 1-119-40789-3. [Google Scholar]
- Giwa, A.; Akther, N.; Housani, A.A.; Haris, S.; Hasan, S.W. Recent advances in humidification dehumidification (HDH) desalination processes: Improved designs and productivity. Renew. Sustain. Energy Rev. 2016, 57, 929–944. [Google Scholar] [CrossRef]
- Ali, M.T.; Fath, H.E.S.; Armstrong, P.R. A comprehensive techno-economical review of indirect solar desalination. Renew. Sustain. Energy Rev. 2011, 15, 4187–4199. [Google Scholar] [CrossRef]
- Darawsheh, I.; Islam, M.D.; Banat, F. Experimental characterization of a solar powered MSF desalination process performance. Therm. Sci. Eng. Prog. 2019, 10, 154–162. [Google Scholar] [CrossRef]
- Ylänen, M.M.M.; Lampinen, M.J. Determining optimal operating pressure for AaltoRO – A novel wave powered desalination system. Renew. Energy 2014, 69, 386–392. [Google Scholar] [CrossRef]
- Ma, Q.; Lu, H. Wind energy technologies integrated with desalination systems: Review and state-of-the-art. Desalination 2011, 277, 274–280. [Google Scholar] [CrossRef]
- Gude, G. Emerging Technologies for Sustainable Desalination Handbook; Butterworth-Heinemann: Oxford, UK, 2018; ISBN 0-12-816712-2. [Google Scholar]
- Bourouni, K.; Chaibi, M.T. Application of geothermal energy for brackish water desalination in the south of Tunisia. Ground Water 2005, 2185, 225. [Google Scholar]
- Rizzuti, L.; Ettouney, H.M.; Cipollina, A. Solar Desalination for the 21st Century: A Review of Modern Technologies and Researches on Desalination Coupled to Renewable Energies; Springer Science & Business Media: Berlin, Germany, 2007; ISBN 1-4020-5508-0. [Google Scholar]
- Gude, V.G. Geothermal source potential for water desalination—Current status and future perspective. Renew. Sustain. Energy Rev. 2016, 57, 1038–1065. [Google Scholar] [CrossRef]
Figure 1.
The status of renewable-powered desalination technologies.

Figure 2.
(a) Centralized water sector (base and C_RO scenarios). (b) Decentralized water sector (D_RO and D_MED scenarios).
Figure 2.
(a) Centralized water sector (base and C_RO scenarios). (b) Decentralized water sector (D_RO and D_MED scenarios).

Figure 3.
The proposed model for an energy system with variable renewable resources (VRE) and water supply with desalination.
Figure 3.
The proposed model for an energy system with variable renewable resources (VRE) and water supply with desalination.

Figure 4.
Iran’s main drainage basins (adapted from Iran Water Statistical Yearbook 2011-2012 [56]) and the county of study [57].

Figure 5.
Share of photovoltaic (PV) in the total VRE electricity production.

Figure 6.
Share of wind in the total VRE electricity production.

Figure 7.
Share of self-consumption from VRE electricity production and amount of excess renewable electricity generation.
Figure 7.
Share of self-consumption from VRE electricity production and amount of excess renewable electricity generation.

Figure 8.
Water sector’s electricity consumption and share of total electricity demand.

Figure 9.
Capacity and cost of the battery unit to reach the same VRE self-consumption for: (a) C_RO scenario; (b) D_RO scenario; (c) D_MED scenario. (d) The required total capacity of batteries in each year.
Figure 9.
Capacity and cost of the battery unit to reach the same VRE self-consumption for: (a) C_RO scenario; (b) D_RO scenario; (c) D_MED scenario. (d) The required total capacity of batteries in each year.

Figure 10.
Learning-curve model fitting of photovoltaic (PV) investment cost.

Figure 11.
Learning-curve model fitting of wind-power investment-cost reduction.

Figure 12.
Learning-curve model fitting of the desalination industry investment cost: (a) Reverse osmosis (RO) technology; (b) multi-effect desalination (MED) technology.
Figure 12.
Learning-curve model fitting of the desalination industry investment cost: (a) Reverse osmosis (RO) technology; (b) multi-effect desalination (MED) technology.

Figure 13.
Share of lifetime VRE electricity production from the saved budgets out of the total VRE electricity production of the base scenario and required budget. Share of lifetime RO water production from the saved budgets out of the total RO production of the base scenario and required budget.
Figure 13.
Share of lifetime VRE electricity production from the saved budgets out of the total VRE electricity production of the base scenario and required budget. Share of lifetime RO water production from the saved budgets out of the total RO production of the base scenario and required budget.

Figure 14.
Reduction in greenhouse gas (GHG) emissions for each scenario.

Figure 15.
Sensitivity analysis on the share of R&D from the saved budgets for the share and budget of VRE power production for: (a) The C_RO scenario; (b) the D_RO scenario; (c) the D_MED scenario.
Figure 15.
Sensitivity analysis on the share of R&D from the saved budgets for the share and budget of VRE power production for: (a) The C_RO scenario; (b) the D_RO scenario; (c) the D_MED scenario.

Figure 16.
Sensitivity analysis on the share of R&D from the saved budgets for share and budget of desalination water production for: (a) the C_RO scenario; (b) the D_RO scenario; (c) the D_MED scenario.
Figure 16.
Sensitivity analysis on the share of R&D from the saved budgets for share and budget of desalination water production for: (a) the C_RO scenario; (b) the D_RO scenario; (c) the D_MED scenario.

Figure A1.
The capacity of wind and PV resources from 2000 to 2018 in the Middle East.

Table 1.
Desalination technologies.
| Phase-Change Processes | Membrane-Based Processes |
|---|---|
| Multi-stage flash (MSF) | Reverse osmosis (RO) |
| Multiple effect distillation (MED) | Electrodialysis (ED) |
| Vapor compression (VC) | Membrane distillation (MD) |
| Freezing | |
| Humidification/dehumidification (HDH) | |
| Solar stills |
Table 2.
Renewable energy resources used for desalination purposes.
| Energy Sector Description | Energy Resource | Ref. | ||||||||
|---|---|---|---|---|---|---|---|---|---|---|
| Model Type | Desalination Technology | Solar Electricity | Solar Thermal | Wind Turbine | Geothermal | Ocean Energy | Hydropower | Diesel Generator | Hydrogen | |
| Centralized | RO | ✓ | ✓ | [10] | ||||||
| RO | ✓ | [11] | ||||||||
| RO | ✓ | [12] | ||||||||
| RO | ✓ | [13] | ||||||||
| RO, MED | ✓ | ✓ | [14] | |||||||
| RO | ✓ | [15] | ||||||||
| RO | ✓ | ✓ | ✓ | ✓ | [16] | |||||
| RO | ✓ | [17] | ||||||||
| RO | ✓ | ✓ | [18] | |||||||
| RO | ✓ | ✓ | [19] | |||||||
| RO, MVC | ✓ | ✓ | [20] | |||||||
| RO | ✓ | ✓ | [21] | |||||||
| RO | ✓ | [22] | ||||||||
| RO | ✓ | ✓ | [23] | |||||||
| RO | ✓ | ✓ | [24] | |||||||
| RO | ✓ | ✓ | [25] | |||||||
| RO | ✓ | ✓ | ✓ | ✓ | [26] | |||||
| RO | ✓ | [27] | ||||||||
| RO | ✓ | ✓ | [28] | |||||||
| RO | ✓ | [29] | ||||||||
| RO | ✓ | ✓ | [30] | |||||||
| MSF | ✓ | ✓ | ✓ | [31] | ||||||
| RO | ✓ | ✓ | ✓ | [32] | ||||||
| RO | ✓ | ✓ | ✓ | [33] | ||||||
| RO | ✓ | ✓ | [34] | |||||||
| RO | ✓ | ✓ | ✓ | [35] | ||||||
| MED | ✓ | ✓ | [36] | |||||||
| MED | ✓ | ✓ | ✓ | ✓ | [37] | |||||
| Decentralized | RO | ✓ | [38] | |||||||
Table 3.
Transport costs of desalinated water.
| City, Country | Distance (km) | Elevation Increase (m) | Transport Cost (US D/m3) |
|---|---|---|---|
| Beijing, China | 135 | 100 | 1.13 |
| New Delhi, India | 1050 | 500 | 1.90 |
| Yemen, Sana | 135 | 2500 | 2.38 |
| Riyadh, Saudi Arabia | 350 | 750 | 1.60 |
| Crateus, Brazil | 240 | 350 | 1.33 |
| Mexico City, Mexico | 225 | 2500 | 2.44 |
| Zaragoza, Spain | 163 | 500 | 1.36 |
| Mexico City, Mexico | 280 | 320 | 2.44 |
Table 4.
Estimated future levelized cost of energy (LCOE) of renewable and levelized cost of desalinated water (LCOW) of the desalination technologies.
Table 4.
Estimated future levelized cost of energy (LCOE) of renewable and levelized cost of desalinated water (LCOW) of the desalination technologies.
| Year/Scenario | LCOE of Wind Electricity ($/MWh) | LCOE of Solar Photovoltaic ($/MWh) | Levelized cost of Desalinated Water ($/m3) | |||||||||
|---|---|---|---|---|---|---|---|---|---|---|---|---|
| Base | C_RO | D_RO | D_MED | Base | C_RO | D_RO | D_MED | Base | C_RO | D_RO | D_MED | |
| 2020 | 34.7 | 34.7 | 34.7 | 34.7 | 55.2 | 55.2 | 55.2 | 55.2 | 2.46 | 2.19 | 2.19 | 2.46 |
| 2021 | 34.6 | 34.6 | 25.7 | 26.3 | 37.8 | 37.8 | 49.5 | 46.8 | 2.19 | 2.05 | 2.05 | 2.19 |
| 2022 | 34.5 | 34.5 | 25.7 | 26.2 | 34.4 | 34.4 | 39.8 | 38.9 | 1.99 | 1.94 | 1.94 | 1.99 |
| 2023 | 34.5 | 34.5 | 25.7 | 26.2 | 31.9 | 31.9 | 35.2 | 34.7 | 1.83 | 1.84 | 1.84 | 1.83 |
| 2024 | 34.4 | 34.4 | 25.6 | 26.2 | 30.0 | 30.0 | 32.2 | 31.9 | 1.70 | 1.75 | 1.75 | 1.70 |
| 2025 | 32.1 | 34.4 | 25.6 | 26.1 | 28.5 | 28.3 | 29.9 | 29.7 | 1.59 | 1.67 | 1.67 | 1.58 |
| 2026 | 32.0 | 34.3 | 25.5 | 26.0 | 27.1 | 26.8 | 28.0 | 27.8 | 1.49 | 1.60 | 1.60 | 1.48 |
| 2027 | 32.0 | 30.4 | 25.4 | 25.9 | 25.8 | 25.6 | 26.3 | 26.2 | 1.40 | 1.54 | 1.53 | 1.40 |
| 2028 | 28.2 | 30.3 | 25.2 | 25.8 | 25.0 | 24.2 | 24.7 | 24.6 | 1.33 | 1.48 | 1.47 | 1.32 |
| 2029 | 28.1 | 30.2 | 25.1 | 25.6 | 24.0 | 23.0 | 23.1 | 23.0 | 1.26 | 1.42 | 1.42 | 1.25 |
| 2030 | 27.4 | 26.9 | 24.9 | 25.5 | 23.1 | 22.1 | 21.6 | 21.6 | 1.20 | 1.37 | 1.36 | 1.18 |
| 2031 | 27.4 | 26.8 | 24.7 | 25.3 | 22.2 | 21.1 | 20.2 | 20.3 | 1.14 | 1.32 | 1.31 | 1.12 |
| 2032 | 27.3 | 26.8 | 24.6 | 25.2 | 21.4 | 20.2 | 19.0 | 19.2 | 1.09 | 1.28 | 1.27 | 1.06 |
| 2033 | 25.1 | 26.7 | 24.4 | 25.1 | 20.8 | 19.3 | 17.9 | 18.1 | 1.04 | 1.24 | 1.22 | 1.01 |
| 2034 | 25.1 | 25.3 | 24.0 | 25.0 | 20.1 | 18.5 | 17.0 | 17.2 | 1.00 | 1.20 | 1.18 | 0.97 |
| 2035 | 22.9 | 23.6 | 23.9 | 24.8 | 19.6 | 17.8 | 16.1 | 16.4 | 0.96 | 1.16 | 1.14 | 0.92 |
| 2036 | 21.1 | 23.5 | 23.7 | 24.7 | 19.2 | 17.1 | 15.3 | 15.6 | 0.92 | 1.13 | 1.11 | 0.88 |
| 2037 | 20.0 | 20.9 | 19.8 | 19.5 | 18.7 | 16.6 | 14.9 | 15.4 | 0.88 | 1.10 | 1.07 | 0.84 |
| 2038 | 19.8 | 19.9 | 19.0 | 19.3 | 18.2 | 16.1 | 14.4 | 14.8 | 0.85 | 1.07 | 1.04 | 0.80 |
| 2039 | 19.0 | 19.2 | 18.6 | 18.3 | 17.7 | 15.5 | 13.9 | 14.4 | 0.82 | 1.04 | 1.01 | 0.77 |
| 2040 | 17.8 | 18.6 | 17.5 | 17.4 | 17.3 | 15.0 | 13.5 | 14.1 | 0.79 | 1.01 | 0.98 | 0.74 |
Table 5.
Sensitivity analysis on the share of research and development (R&D) from the saved budgets for LCOE of solar and electricity, and LCOW of desalination in 2040.
Table 5.
Sensitivity analysis on the share of research and development (R&D) from the saved budgets for LCOE of solar and electricity, and LCOW of desalination in 2040.
| Share of R&D (%)/Scenario | LCOE of Wind Electricity ($/MWh) | LCOE of Solar Electricity ($/MWh) | Levelized Cost of Desalinated Water ($/m3) | |||||||||
|---|---|---|---|---|---|---|---|---|---|---|---|---|
| Base | C_RO | D_RO | D_MED | Base | C_RO | D_RO | D_MED | Base | C_RO | D_RO | D_MED | |
| 0 | 17.8 | 18.8 | 18.0 | 17.8 | 17.3 | 17.0 | 16.9 | 17.0 | 0.79 | 1.01 | 1.01 | 0.79 |
| 2 | 17.8 | 18.7 | 17.8 | 17.6 | 17.3 | 16.1 | 15.3 | 15.7 | 0.79 | 1.01 | 1.00 | 0.77 |
| 4 | 17.8 | 18.6 | 17.6 | 17.4 | 17.3 | 15.4 | 14.1 | 14.6 | 0.79 | 1.01 | 0.99 | 0.75 |
| 6 | 17.8 | 18.5 | 17.4 | 17.3 | 17.3 | 14.7 | 13.0 | 13.7 | 0.79 | 1.01 | 0.97 | 0.72 |
| 8 | 17.8 | 18.4 | 17.2 | 17.1 | 17.3 | 14.1 | 12.2 | 12.9 | 0.79 | 1.00 | 0.95 | 0.70 |
| 10 | 17.8 | 18.4 | 17.0 | 17.0 | 17.3 | 13.6 | 11.5 | 12.2 | 0.79 | 1.00 | 0.93 | 0.68 |
© 2020 by the authors. Licensee MDPI, Basel, Switzerland. This article is an open access article distributed under the terms and conditions of the Creative Commons Attribution (CC BY) license (http://creativecommons.org/licenses/by/4.0/).
Share and Cite
MDPI and ACS Style
Ahmadi, E.; McLellan, B.; Ogata, S.; Mohammadi-Ivatloo, B.; Tezuka, T. An Integrated Planning Framework for Sustainable Water and Energy Supply. Sustainability 2020, 12, 4295. https://doi.org/10.3390/su12104295
AMA Style
Ahmadi E, McLellan B, Ogata S, Mohammadi-Ivatloo B, Tezuka T. An Integrated Planning Framework for Sustainable Water and Energy Supply. Sustainability. 2020; 12(10):4295. https://doi.org/10.3390/su12104295
Chicago/Turabian StyleAhmadi, Esmaeil, Benjamin McLellan, Seiichi Ogata, Behnam Mohammadi-Ivatloo, and Tetsuo Tezuka. 2020. "An Integrated Planning Framework for Sustainable Water and Energy Supply" Sustainability 12, no. 10: 4295. https://doi.org/10.3390/su12104295
Note that from the first issue of 2016, this journal uses article numbers instead of page numbers. See further details here.