Article

The Association between Urban Public Transport Infrastructure and Social Equity and Spatial Accessibility within the Urban Environment: An Investigation of Tramlink in London

1
Bartlett School of Planning, University College London, London WC1H 0NN, UK
2
Department of Planning and Transport, University of Westminster, London NW1 5LS, UK
3
Department of Urban Planning and Design, The University of Hong Kong, Hong Kong, China
*
Author to whom correspondence should be addressed.
Sustainability 2019, 11(5), 1229; https://doi.org/10.3390/su11051229
Submission received: 28 December 2018 / Revised: 12 February 2019 / Accepted: 20 February 2019 / Published: 26 February 2019
(This article belongs to the Special Issue Sustainability in Transportation and the Built Environment)

Abstract

:
The pursuit of sustainability has been at the forefront of contemporary planning initiatives. However, most recent research has focused on the environmental and economic aspects of developing sustainable urban environment, whilst largely neglecting the social aspects. Contemporary political thinking in the UK often disregards the potential of the urban infrastructure to improve social equity. The aim of this study was to analyse the impact of transport infrastructure on a variety of social measures, in an empirical and ideologically unbiased fashion, using both quantitative and qualitative methods. We selected “Tramlink” as a case study: a light-rail system in the London Borough of Croydon which began operation in 2000. We used quantitative methods, including advanced spatial statistics, to produce a more detailed analysis of social equity than has been previously published. This acknowledges that determining localised issues can produce more informed and effective policy interventions. Our results demonstrate that the physical properties of transport infrastructure and the non-physical attributes of society, in combination, help to create opportunities for individuals to succeed. We also find that in order to reduce the negative effects of austerity, public money could be more effectively spent if diverted to areas that are most in need which can be highlighted through localised investigations.

1. Introduction

The pursuit of sustainability has been at the forefront of contemporary planning initiatives. However, the majority of recent research has focused on the environmental and economic aspects of developing a sustainable urban environment, whilst neglecting the social issues [1,2,3,4]. Recent trends highlight increased social division within cities [5,6,7,8], reminding us of the importance of considering the social sustainability of future projects.
To some extent, investigating the role of transport within the urban environment can provide answers regarding social sustainability [9,10,11,12]. It is acknowledged that public transport investments can increase accessibility to opportunities, such as education, leisure, employment and retail [13,14,15], through a reduction in the “friction of distance”, as well as through “time–space compression” [16,17,18,19]. Yet there is little empirical evidence that infrastructure interventions, particularly those involving transport infrastructure, can improve social sustainability and even less investigation of the influence at a localised level testing for spatial accessibility [20]. An association is generally assumed, as evidenced by the new urbanism, for compact city and urban design movements [20,21,22]. However, for large investments in transport infrastructure to be politically viable (especially following the financial crash and subsequent squeeze on public spending), such evidence is required [23]. This is particularly pertinent within the UK context where spending on public goods, such as transport, has reduced significantly due to austerity measures. For example, between 2010 (when the Conservative–Liberal Democrat coalition came into power) and 2012, there was a 20 per cent reduction in public spending on transport [24]. With budgets squeezed, investing at the localised level can promote more efficient spending regimes and, therefore, negate the destructive effects of austerity. However, decisions on funding public transport in the future will require empirical evidence regarding their impacts on local communities and wider society [25]. Spatial statistics are becoming prominent within academia with the likes of Fotheringham pioneering methods [26,27] in many respects, however this has yet to fully penetrate academic city planning. Therefore, the aim of this research was to evaluate equity in the association between spatial accessibility and the distribution of socio-economic groups using Tramlink in the London Borough of Croydon as a case study to identify if localised results could help to pinpoint policy interventions.

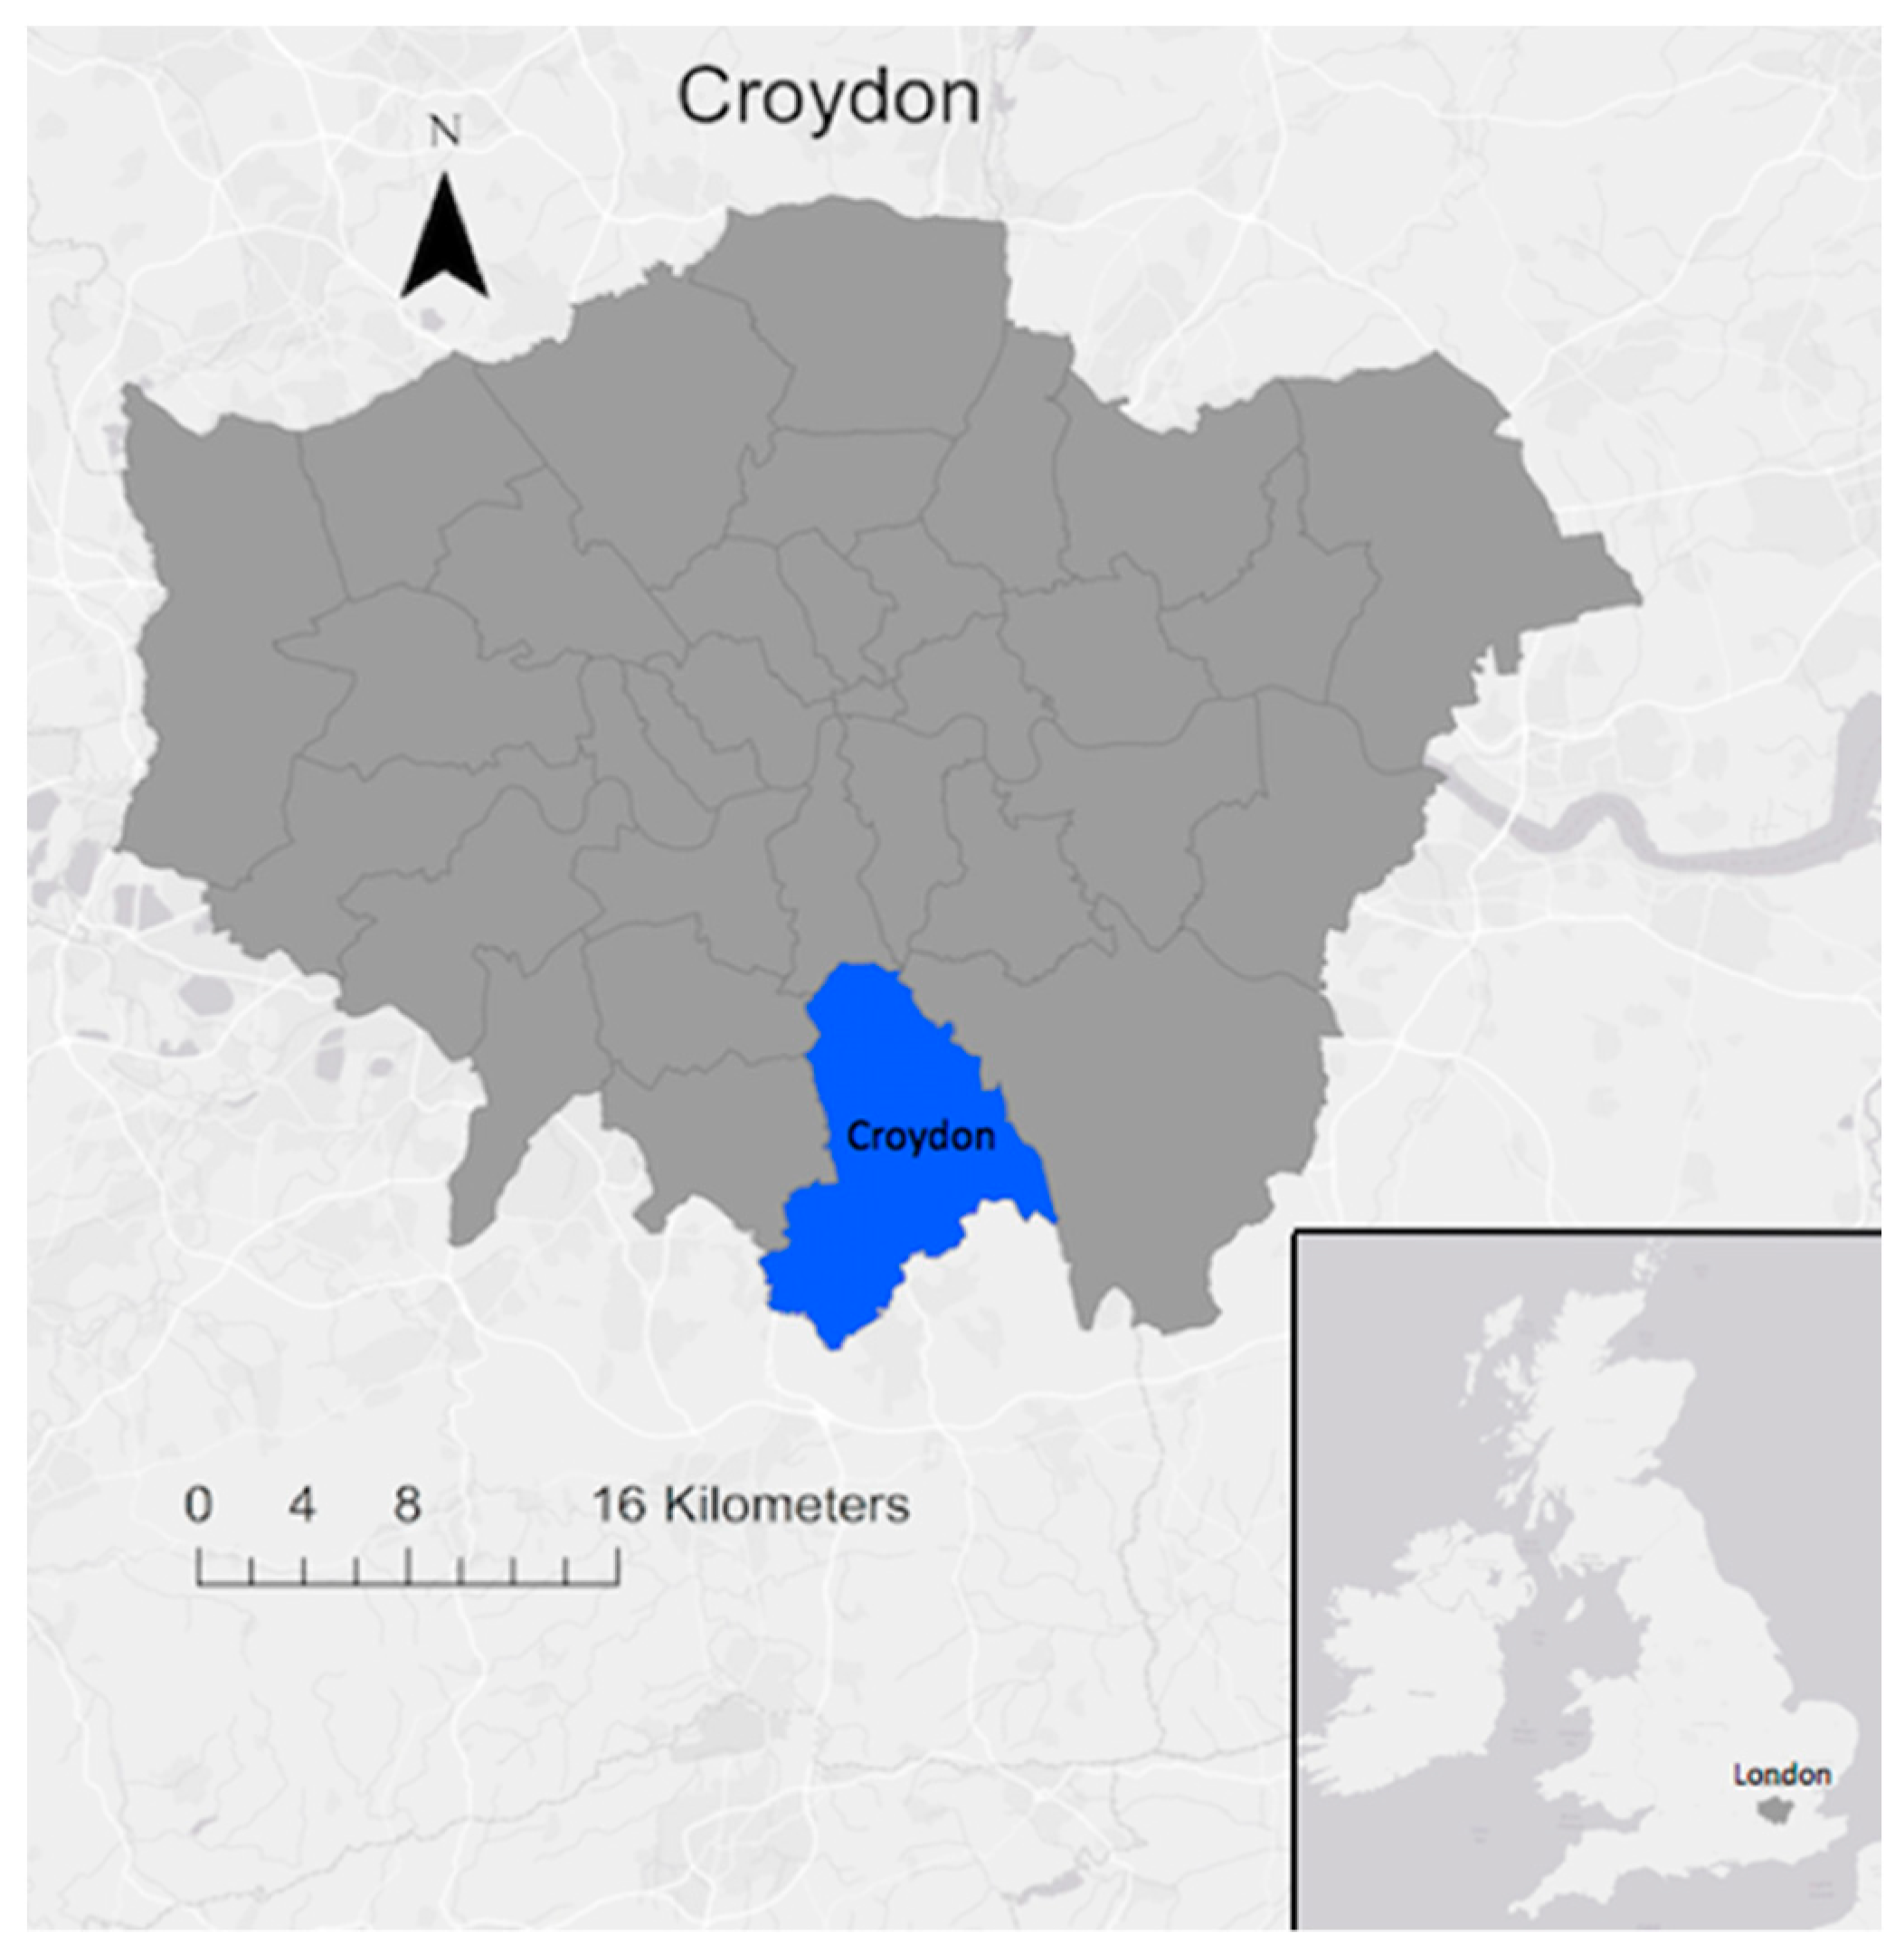
2. Case Study Context

The London Borough of Croydon is situated on the southern edge of Greater London (Figure 1). Prior to Tramlink, the Borough lacked reliable public transport, with one third of Croydon falling into the “least accessible” classification of London Boroughs [28]. Tramlink was introduced as part of the comprehensive “Croydon 2020” regeneration plan which saw the reintroduction of light-rail onto the streets of London after an absence of nearly 50 years [29]. The system currently serves a population of around 180,000 people and its ridership is high, with around 16 million passengers per year, with 20 per cent of these journeys transferring from cars over time [28]. It has yet to be determined whether the introduction of Tramlink has improved social equity and if its prevalence varies across space. When selecting this case study, it was important to find a public transport project that had been completed sufficiently long ago for new habits to have formed in order to provide an insight into how social equity through accessibility intertwines with human agency. Croydon fulfilled this requirement as over 15 years had passed since Tramlink began operation in 2000 [29], and data from 2015 was used. It also offered a rich dataset with data provided at the Lower Super Output Area (LSOA) for all 220 zones in Croydon.

3. Materials and Methods

The literature has so far ignored spatial autocorrelation among locally produced data relating to the urban environment [30,31] and therefore overlooked Waldo Tobler’s [32] first law of geography: “[e]verything is related to everything. But near things are more related than distant things” [33,34]. With the influx of open source data now available [35], Fotheringham and Rogerson [36] and Openshaw [37] have called for more localised modelling in an attempt to take account of Tobler and this paper heeds these calls and has thus implemented statistical models that allow for localised modelling through distance decay. It was determined that creating localised results could focus the debate, allowing for issues to be pinpointed across space instead of a “one size fits all” attitude which is currently adopted within the “top down” governance structure.
In this study, we used localised modelling methods that accounted for local variations in data produced by the heterogeneity of the urban environment. To do this, we used geographically weighted regression (GWR), a tool for exploring spatial data [38].

3.1. Initial Variable Selection

The first step was to define the term “social equity” as we use it here. Social equity is rooted within the concepts of social justice, distributional justice and equality [4,39,40]. Social equity is also linked to personal mobility as it includes the ability of residents to access services and opportunities [41,42]. Consequently, this paper’s definition of social equity is embedded within personal accessibility and therefore an improvement in social equity would occur through an improvement in an individual’s connectivity to education, leisure and employment [13,40,43]. As this paper is investigating the association between spatial accessibility and social equity, the dependent variable is accessibility. To describe an area’s accessibility, we used public transport accessibility level (PTAL) data from Transport for London (TfL). PTALs have been rigorously tested and provide accurate and detailed measures of the accessibility of public transport in London, taking into account reliability and availability of services [44]. They do not, however, consider some factors that may be significant, such as ease of interchange and overcrowding [44,45,46], therefore PTALs are not an all-encompassing measurement.
We identified candidate independent variables for our model through a review of literature. In order to create greater social equity, it is important to understand how to implement successful measures to counteract disparities. However, there is contradictory evidence on the relationship between the infrastructure and the urban environment in this respect. Some see public transport as an influencer, creating a “common wealth” to help the population meet their needs and, accordingly, providing everyone with a certain level of mobility to reduce barriers to entry to local amenities, jobs and education and create a more inclusive society [41]. However, in most literature, this is not a prominent theme, as it promotes public transport’s environmental qualities over its social sustainability potential and fails to evaluate transport infrastructure from a social equity perspective [47,48,49].
One approach to identifying the transport infrastructure’s association with society is the use of “structuration theory”. Originally conceptualised by Anthony Giddens [50], structuration theory identified power relations between social activities and structures, and the theory has subsequently been developed more generally within urban planning and the social sciences [51]. The concept of “structure-agency” is often used within social science to capture the ways in which structures can affect the agency of individuals [52,53,54], although the association between the two is disputed. This concept should be fundamental to planning theory as it highlights the power of both humans as agents that have a relationship to their outcomes and infrastructure within the urban environment as a structure in which human agency is restricted or enhanced [51,55,56]. Nevertheless, arguments emphasising the importance of demographic characteristics and socio-economic status over infrastructure interventions have dominated the majority of modern academic and political spheres see [22,57,58,59]. Unfortunately, producing effective policy in this area is currently challenging due to this lack of agreement over whether, how and to what extent the urban environment has a relationship to human agency [45]. In this context, human agency means humans’ ability to create actions. This is the structure agency debate, in other words humans’ ability against the structures - both physical and non-physical - that they find themselves within.
From a political perspective, an infamous criticism of investment in public goods came from former Prime Minister, Margaret Thatcher, who stated that, “there is no such thing as society” [20]. This statement implied that structural forces of infrastructure were redundant and that there was no need for public goods, such as public transport, as private enterprise could successfully provide for the needs of individuals [20,45]. This idea has been further developed by prominent sociologist Emile Durkheim who stated that social phenomena were the all-encompassing influencer on human activities and thus, “… suggested that the physical environment should be ignored… for it was deemed unimportant in social life”.
This disregard for the urban environment fails to recognise its role in enhancing or restricting individuals as agents in their activities as these always occur within physical structures [19,20,50]. Furthermore, human social characteristics are themselves a product of the physical environment in which they are created [19,20]. Therefore, human agency is still being restricted or enhanced within current physical structures, which are neglected in the debate. Physical structures also create habits in human behaviour which over time become challenging to delineate from other factors. Also, interventions can create new habits that need to be acknowledged within critiques of urban planning [60].
Beyond structuration theory, a “critical realist” approach offers a philosophical platform to create an understanding of how structural conditions, such as transport infrastructure, influence human action. As Allan Pred explains: “… people do not produce history and places under conditions of their own choosing, but in the context of already existing, directly encountered social and spatial structures” [45,61,62]. This theoretical position assumes that both structures and agents have properties that influence behaviour [45,63,64].
A critical realist perspective theorises that the urban environment and our physical surroundings are simply social constructs, thus encompassing the limitations of the urban environment and its association with human agency in the structure–agency debate. Therefore, material structures (such as buildings and roads), as well as immaterial structures (such as non-physical property relations, cultural factors and prevailing beliefs) all affect human agency. Both material and immaterial structures hold power which in turn creates power for human actions [45]. These structures are then reproduced, modified and altered through human agency, yet these changes occur slowly due to the inflexibility of the physical structures, as well as habitus [65,66].
The question therefore revolves around accessibility’s association with qualities defined through socio-economic attributes such as: employment, education, housing and services. These attributes have been described as a human’s basic needs and therefore the state’s welfare regime should provide these to an adequate standard as a right [45]. However, few empirical studies have emphasised transport-related social equity issues e.g., [47,48].
Through this literature review, we identified 13 candidate variables (Table 1), however these were then refined, as described in the following sections.

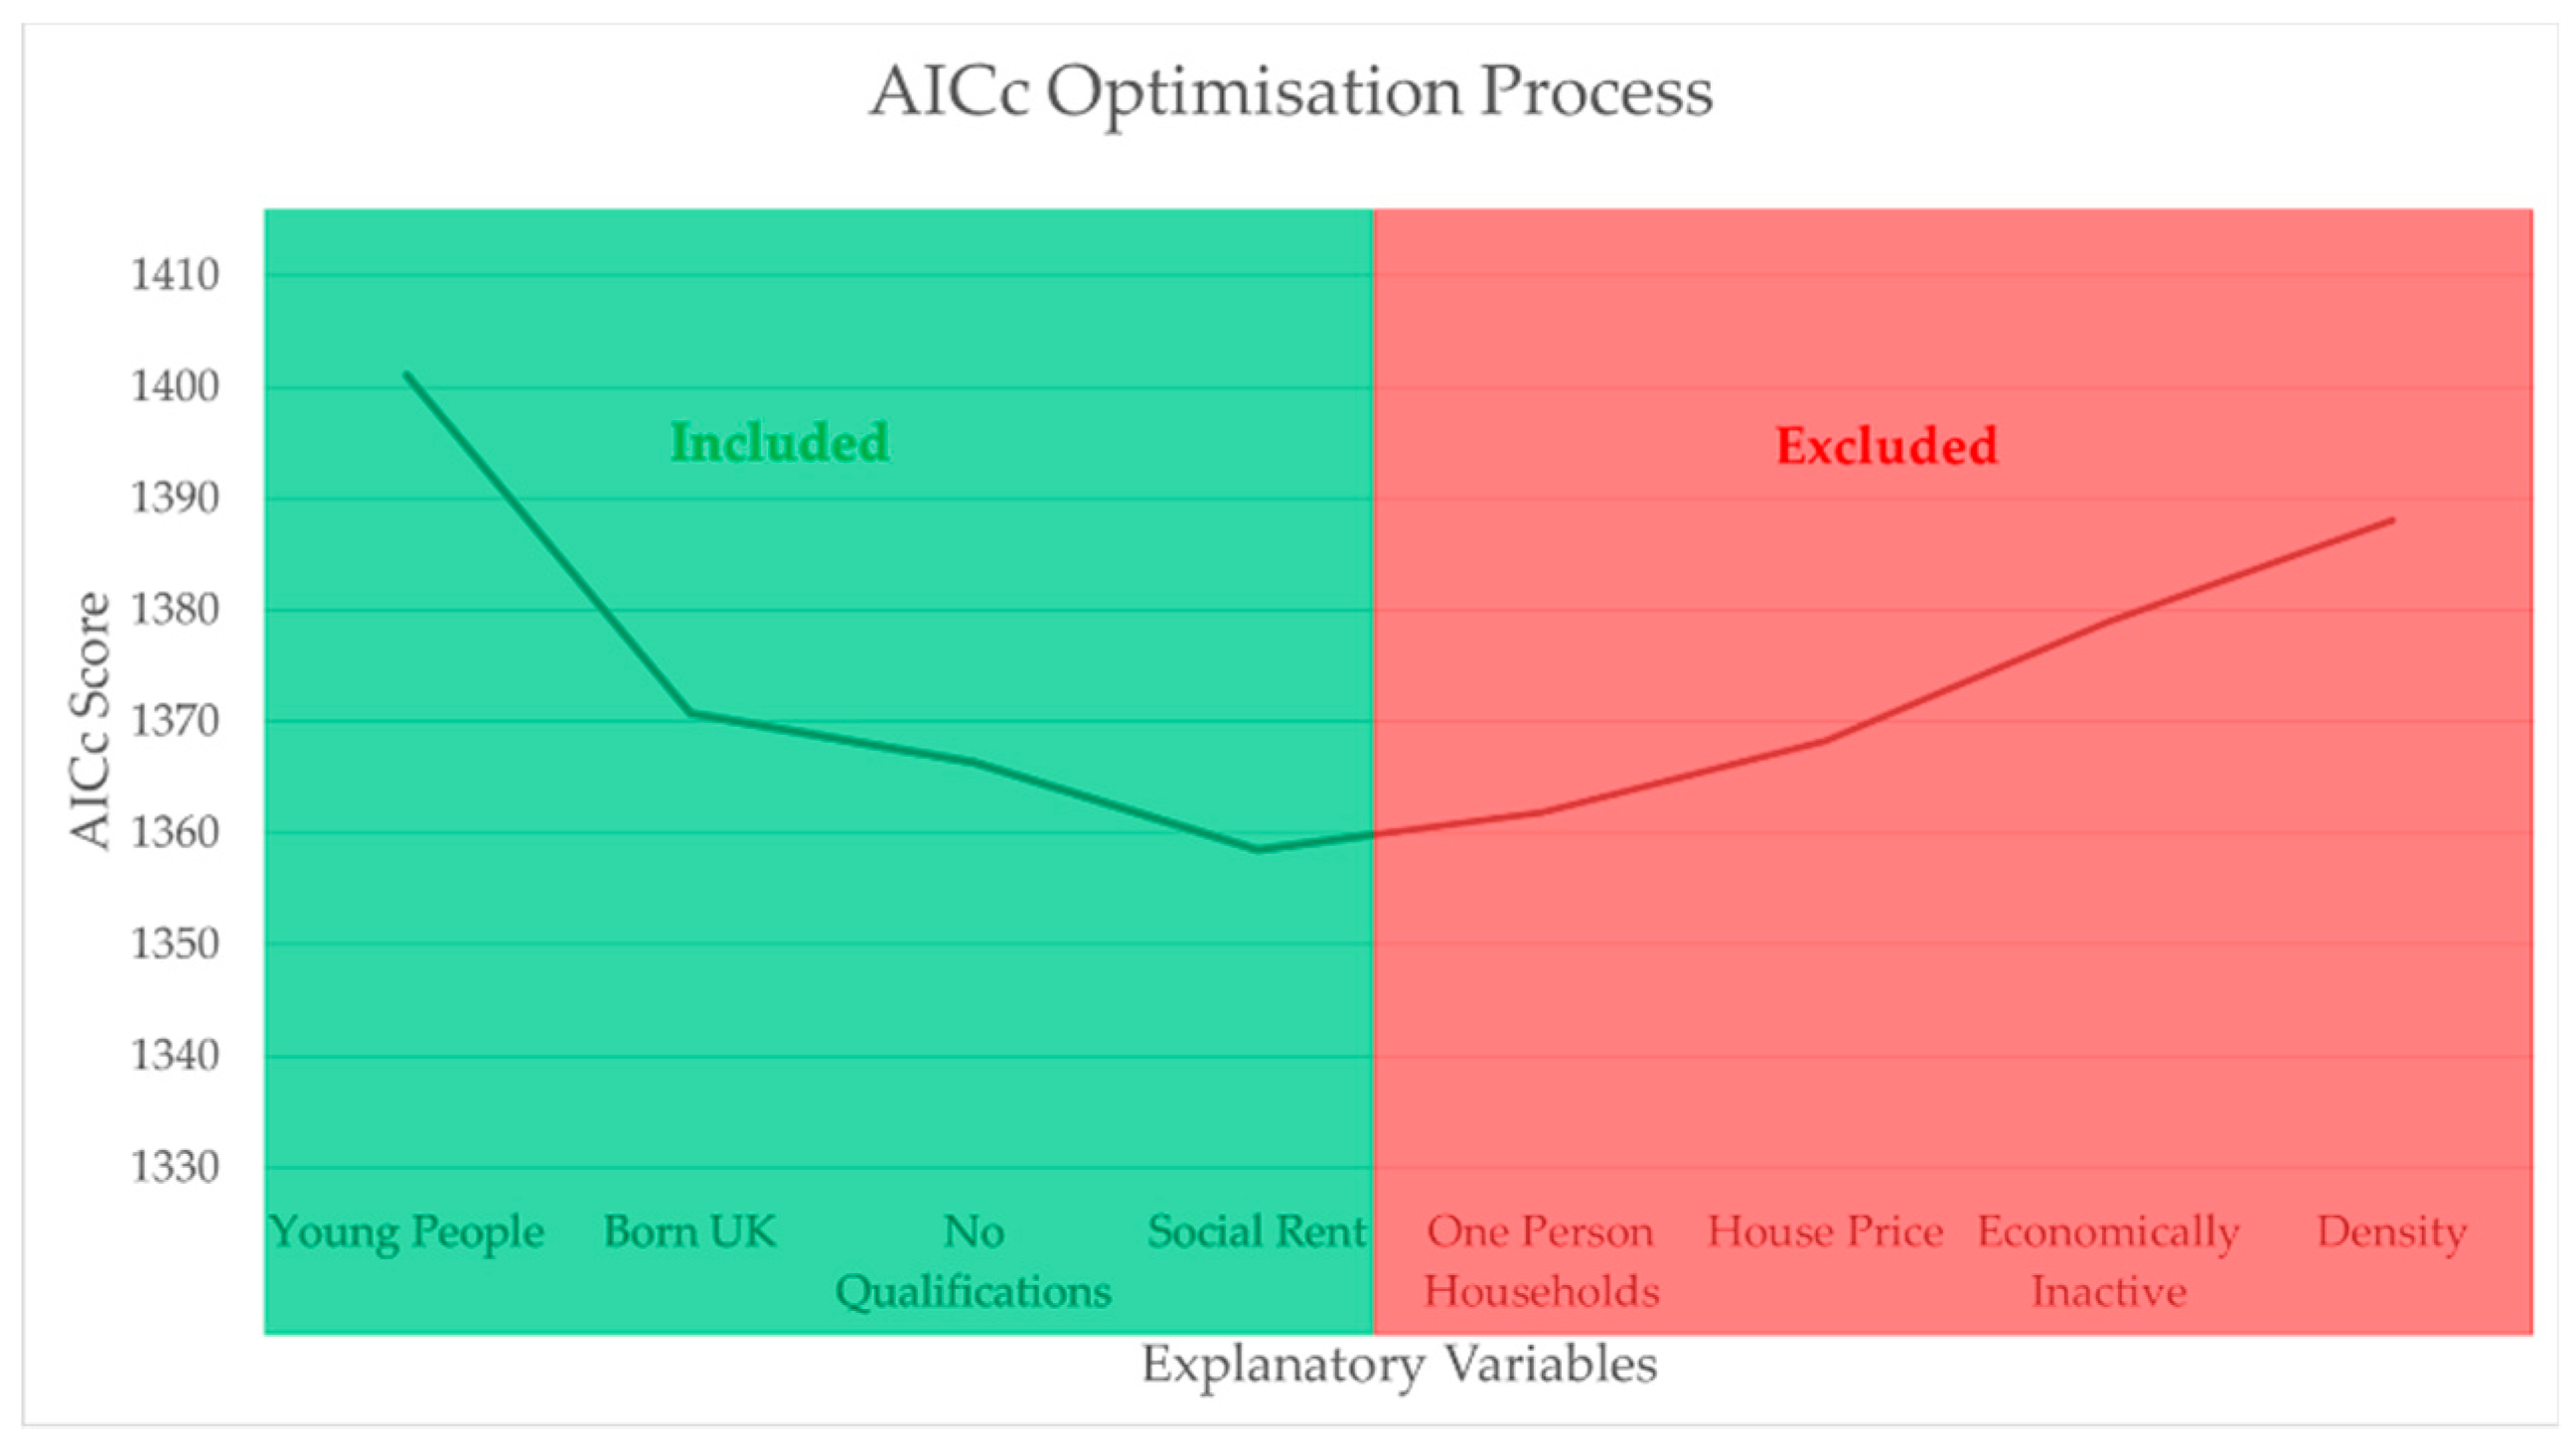
3.2. Correlation Analyses and AICc Model Optimisation

Having identified the candidate independent variables, we then reduced them to a smaller number of variables using two methods: (i) by removing any highly correlated independent variables; and (ii) by using the stepwise corrected Akaike Information Criterion (AICc) method of model optimisation, where the correction was for a finite sample size [69]. Local modelling is particularly susceptible to multicollinearity issues compared to global modelling [70]; therefore, it was of utmost importance to rigorously test for this in our study. We tested the correlation between independent variables using Pearson product–moment correlation coefficient (r) as all variables were continuous. We excluded those independent variables with a p-value below 0.05 from further analysis [71], leaving eight candidate variables (Table 1).
Secondly, we refined the possible independent variables in our model using AICc model optimisation. The AICc is a calculated score which measures the quality of a statistical model given a particular set of data and can also be used to compare local and global models. When the AICc values of two separate models differ by more than three, they are considered significantly different [69,72,73]. To do this, we built eight separate GWR models (as per Equation (1)), each including only one of the remaining eight independent variables (and excluding all others). From these, we selected the variable which produced the model with the lowest AICc. We then increased the number of independent variables in the model to two and tested all seven combinations with the remaining variables. From these, we again selected the model with the lowest AICc. We then increased the number of independent variables in the model to three and tested all six combinations with the remaining variables. From these, we again selected the model with the lowest AICc. We continued this iterative process of adding independent variables until the AICc value no longer fell by more than three from one iteration to the next. This occurred when we added a fifth variable, so we therefore excluded the fifth to eighth variables and retained only four variables for further analysis (Table 1). Figure 2 illustrates those variables that were included and excluded.

3.3. Geographically Weighted Regression (GWR) Model

We used the following GWR model throughout this study:
Y = β 1 [ i ] X 1 + β 2 [ i ] X 2 + + β n [ i ] X n + ε
where Y is the dependent variable (accessibility); Xn is the independent variables in the model (see Table 1); βn is the estimate of the regression parameters; and ε is an error term. The parameter estimate displays the empirical data as an estimate of the sample used within this research. The GWR model produces models where data is obtained from each individual location [i]. This means that each parameter estimate βn[i] will become a function of its location [i] and will display the spatial variability of accessibility and the independent variables Xn across the study area [69].

3.4. Semi-Parametric Model Testing

We tested our resulting model (with four independent variables) for geographic homogeneity in order to test whether the model was semi-parametric (some variables varying spatially with others homogeneous over space) or fully localised (all variables varying over space). To do this, a full GWR model was compared to four semi-parametric models in which one variable was artificially kept constant over space. We found no significant difference between the aicc score of the full GWR model and the aicc score of any of the individual semi-parametric models. This suggested that all four selected variables varied over space [69] and they were therefore all included in the model for further analysis.

3.5. Significance and Goodness-of-Fit

In the output of our GWR analysis, a significant relationship was indicated by a regression parameter estimate at a particular location (βn[i]) being significantly different from zero. We evaluated this using the t-statistic of that parameter at that location. Our significance threshold (for type 1 error) was p < 0.05 (two-tailed) and, therefore, values of the t-statistic greater than 1.96 or less than −1.96 at a given location were considered significant. We quantified the goodness-of-fit of our model at a given location using the “adjusted local R2 value” [69].

3.6. Spatial Autocorrelation

Residuals were also produced to test the difference between the observed and predicated values [44]. It was expected that the local models would produce a more randomly dispersed outcome when compared to the global model. Moran’s I, which tests for spatial autocorrelation (SAC), was implemented in this case [31,71,74].

3.7. Interviews (Qualitative Data)

We used the findings from our quantitative analyses to identify local areas of interest. The interview guide can be found in Appendix A. We targeted these areas with qualitative interviews in order to better understand the detailed issues behind our findings, as well as the localisation of these issues [75]. We undertook seven face-to-face semi-structured interviews, with interviewees including civil servants, local stakeholders (commuters, employees and residents in Croydon) and TfL employees. Whilst the sample size of these interviews was small (and clearly not representative of the entire population), the richness of the data helped us to understand stakeholders’ viewpoints and experiences [76].

4. Results

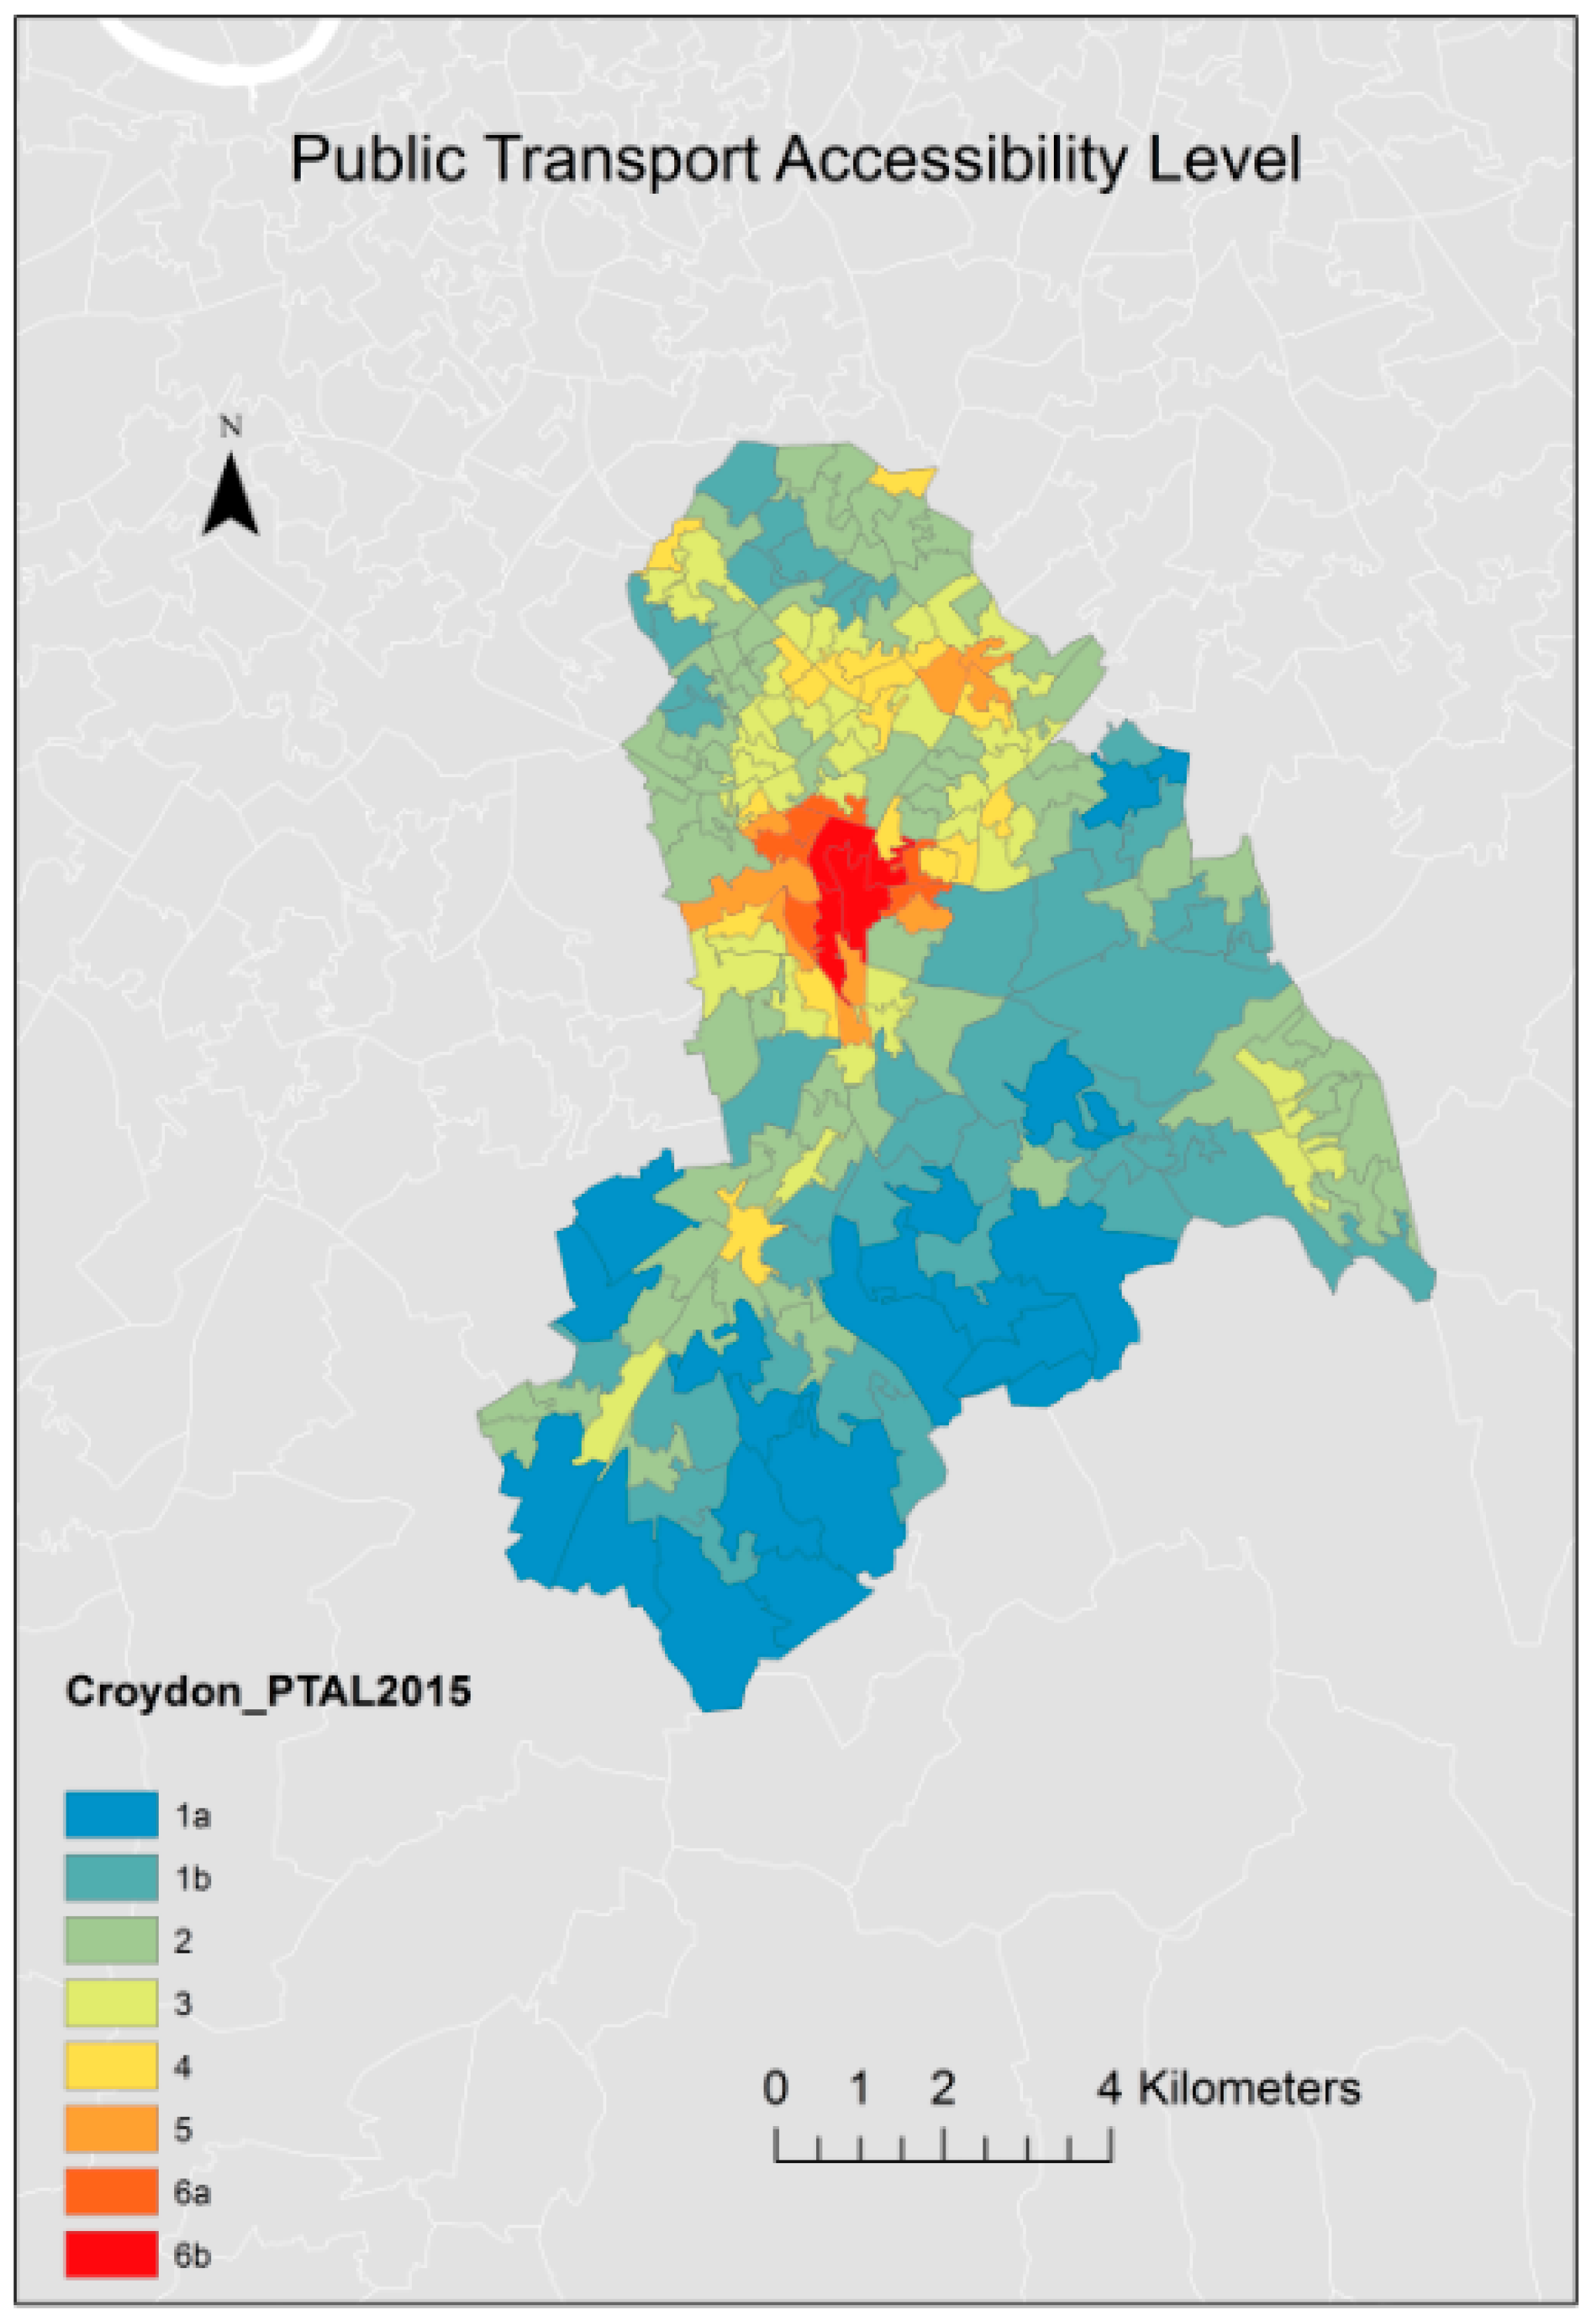
4.1. Public Transport Accessibility Level in Croydon

Public transport accessibility level (PTAL) has been efficiently used in different transport planning processes and applied in measuring how well a place is connected to public transport services (i.e., assessing the access level of geographical areas) in London for many years [44,49]. The range of PTAL values are measured between 0 and 6b, where the lowest value represents poor connectivity, while the highest value indicates the best connectivity for the access level to local public transport. The conversion of PTAL to the access index is shown below. 0 (worst)—0; 1a—0.01 ~ 2.50; 1b ~ 2.51 ~ 5.0; 2—5.01 ~ 10.0; 3—10.01 ~ 15.0; 4—15.01 ~ 20.0; 5—20.01 ~ 25.0; 6a—25.01 ~ 40; 6b (best)—40.01 + [49]. Figure 3 shows the PTAL values for Croydon. The overall median access index value is 7.86 (min 0.19, max 60.9, SD 9.29), which is equivalent to the PTAL value 2, thus showing a relatively poor accessibility level to public transport services in Croydon. Furthermore, not surprisingly, residents living in central areas had excellent access to public transport (shown in red on the map), whereas people had poor access to public transport if they live in suburban areas in Croydon (shaded in blue). It can be argued that although PTAL is one of the essential approaches for measuring the accessibility and density of the public transport network in London, social impacts and more complicated spatial autocorrelations have not been taken into consideration in the PTAL analysis, which are therefore included and applied in this study.

4.2. Global Versus Local Regression Models

We first fitted our data with a standard “global” (non-spatial) regression model (Table 2, left). However, we found that the goodness-of-fit (R2) of this global regression model was only 0.34. We therefore next fitted the data using our GWR model (Table 2, right). This provided us with an adjusted local R2 value for each of the LSOAs, and these R2 values varied greatly across the study area (range 0.00 to 0.85), with the best model fits (highest R2 values, > 0.7) found in the more central, urbanised parts of Croydon, and the worst model fits (lowest R2 values, < 0.1) found in the more easterly parts of Croydon where there is lower population density (Figure 4). The mean local adjusted R2 value for the GWR model was 0.74.
There are extreme variations for all independent variables in the local results, with these variations highlighting that spatial heterogeneity is occurring, while also suggesting that certain locations are outliers.

4.3. Spatial Autocorrelation

Moran’s I was implemented on both the global and local models, with two tests being undertaken for robustness: Inverse Distance Squared and Queen’s Case (Table 3). It can be seen through the higher Moran’s I score that there was more variation in the global models when compared to the local models, which suggests that GWR was the correct tool for this analysis [77].

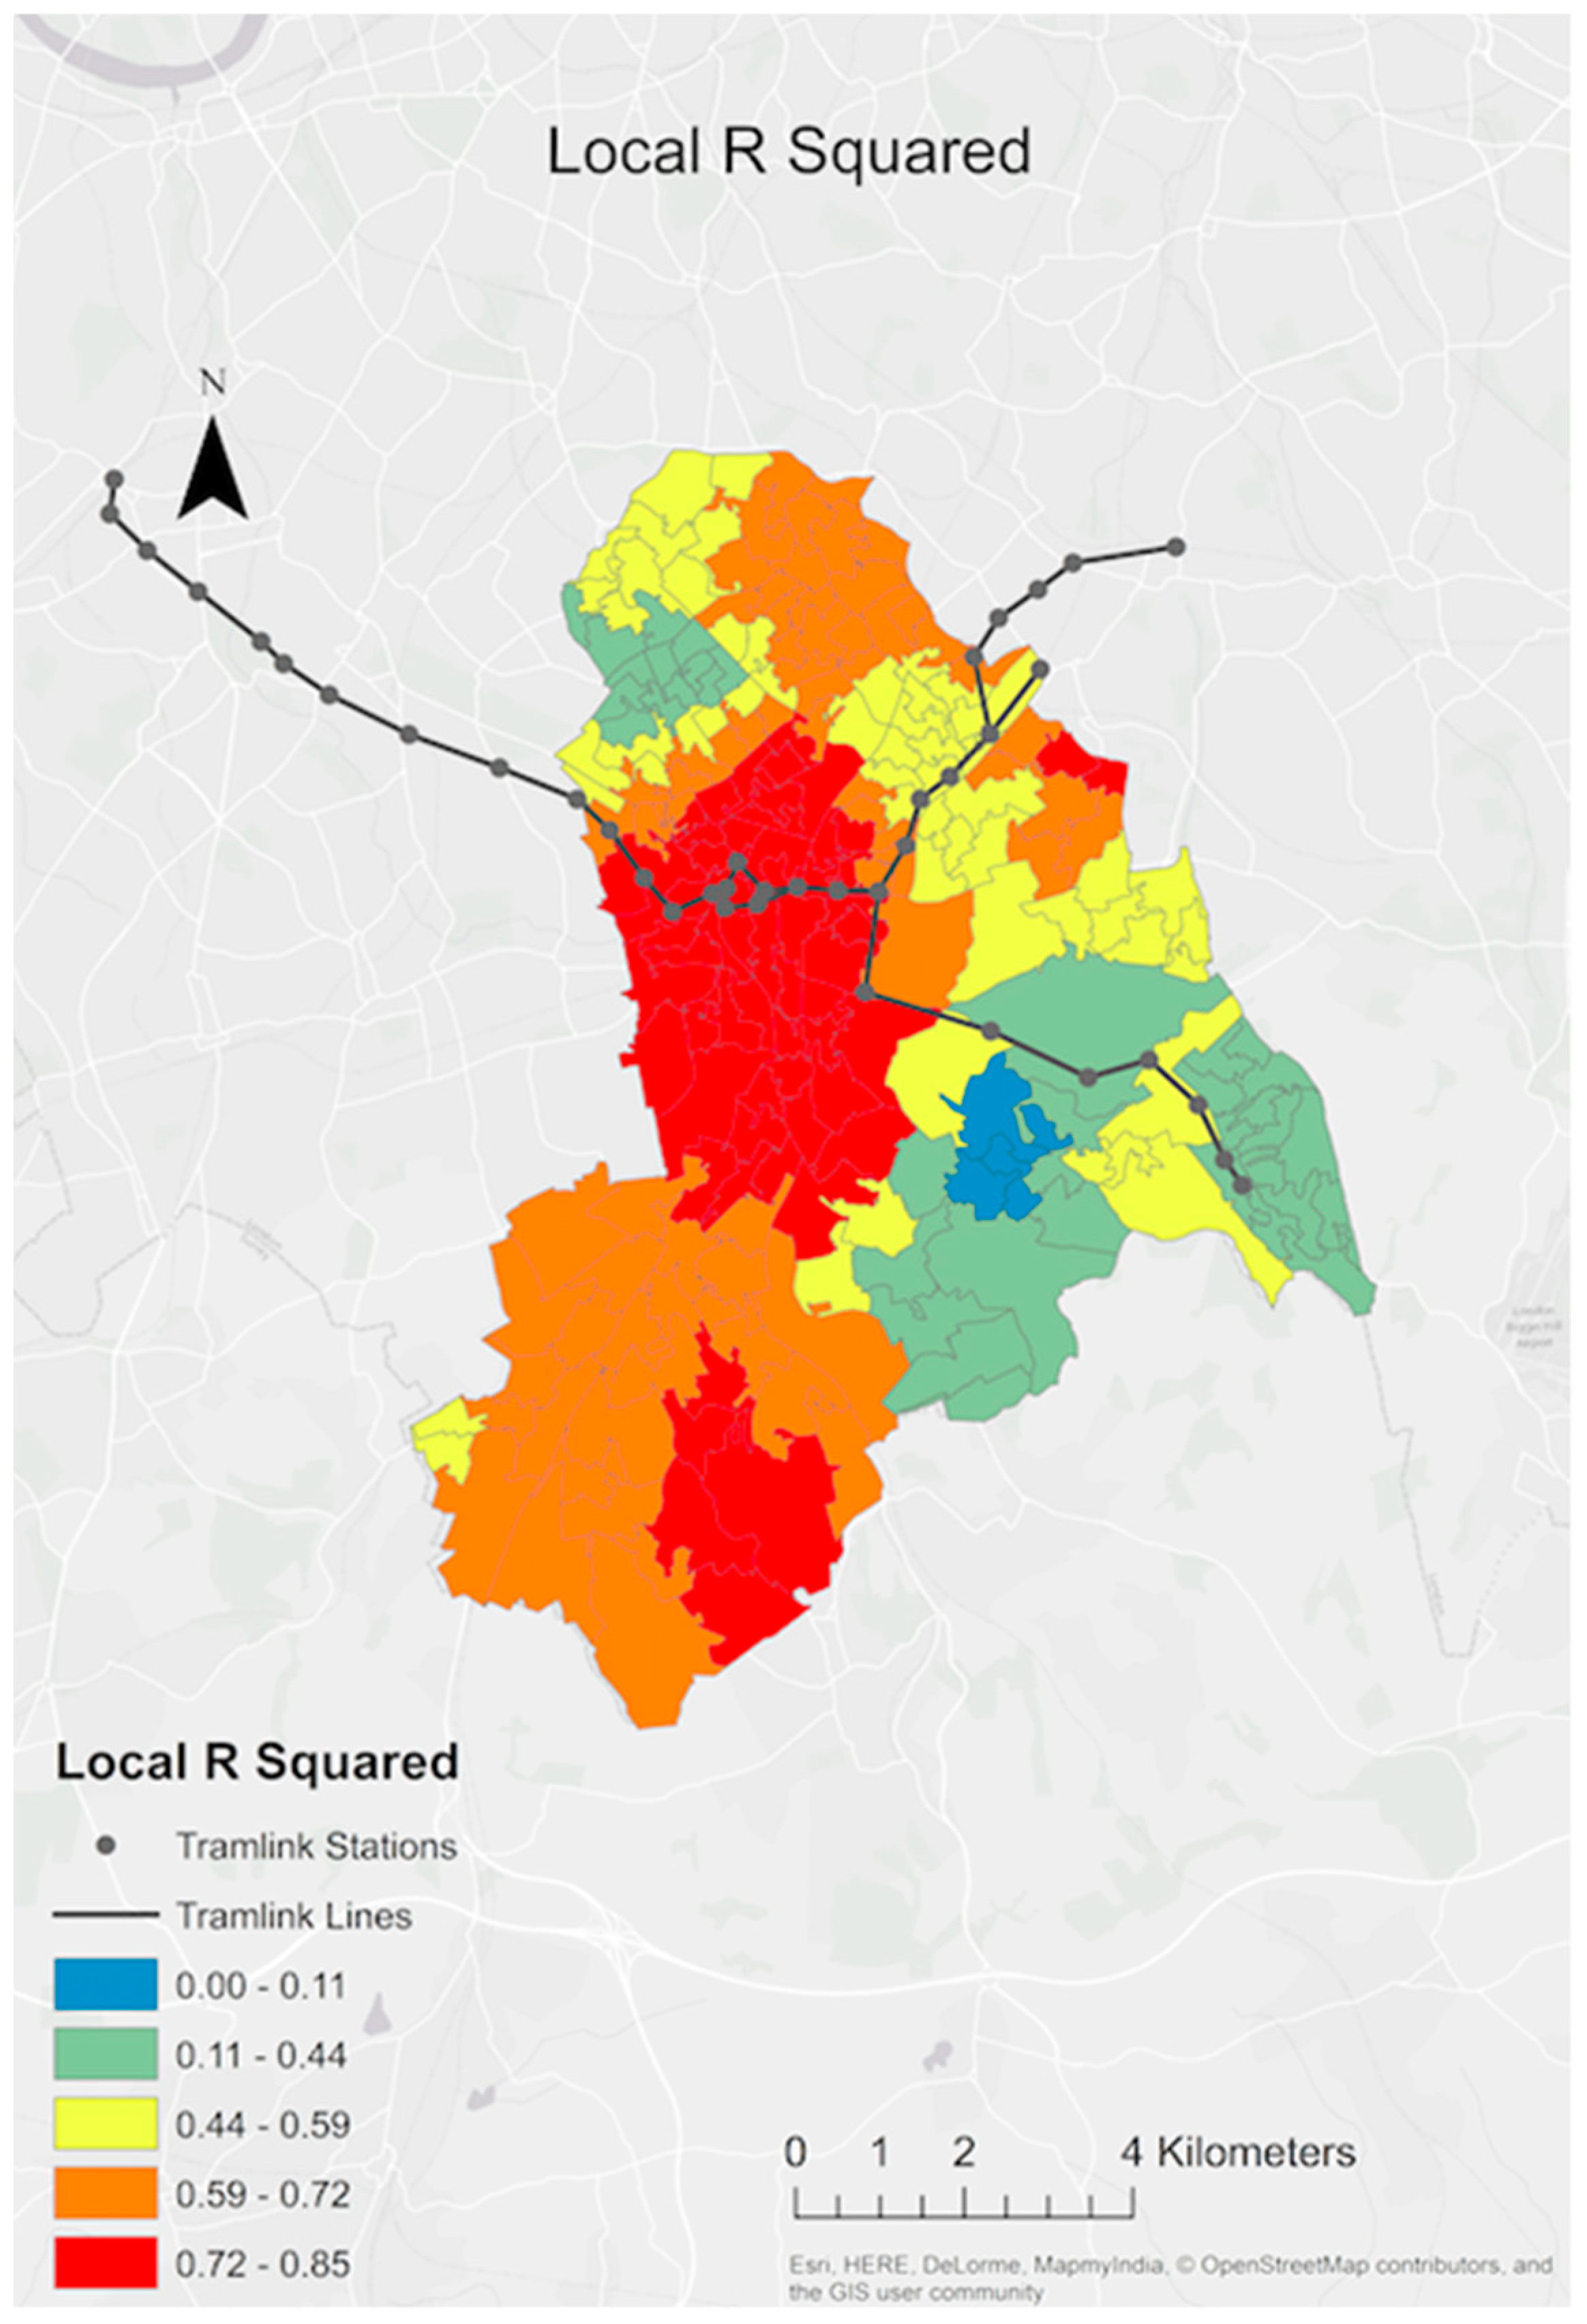
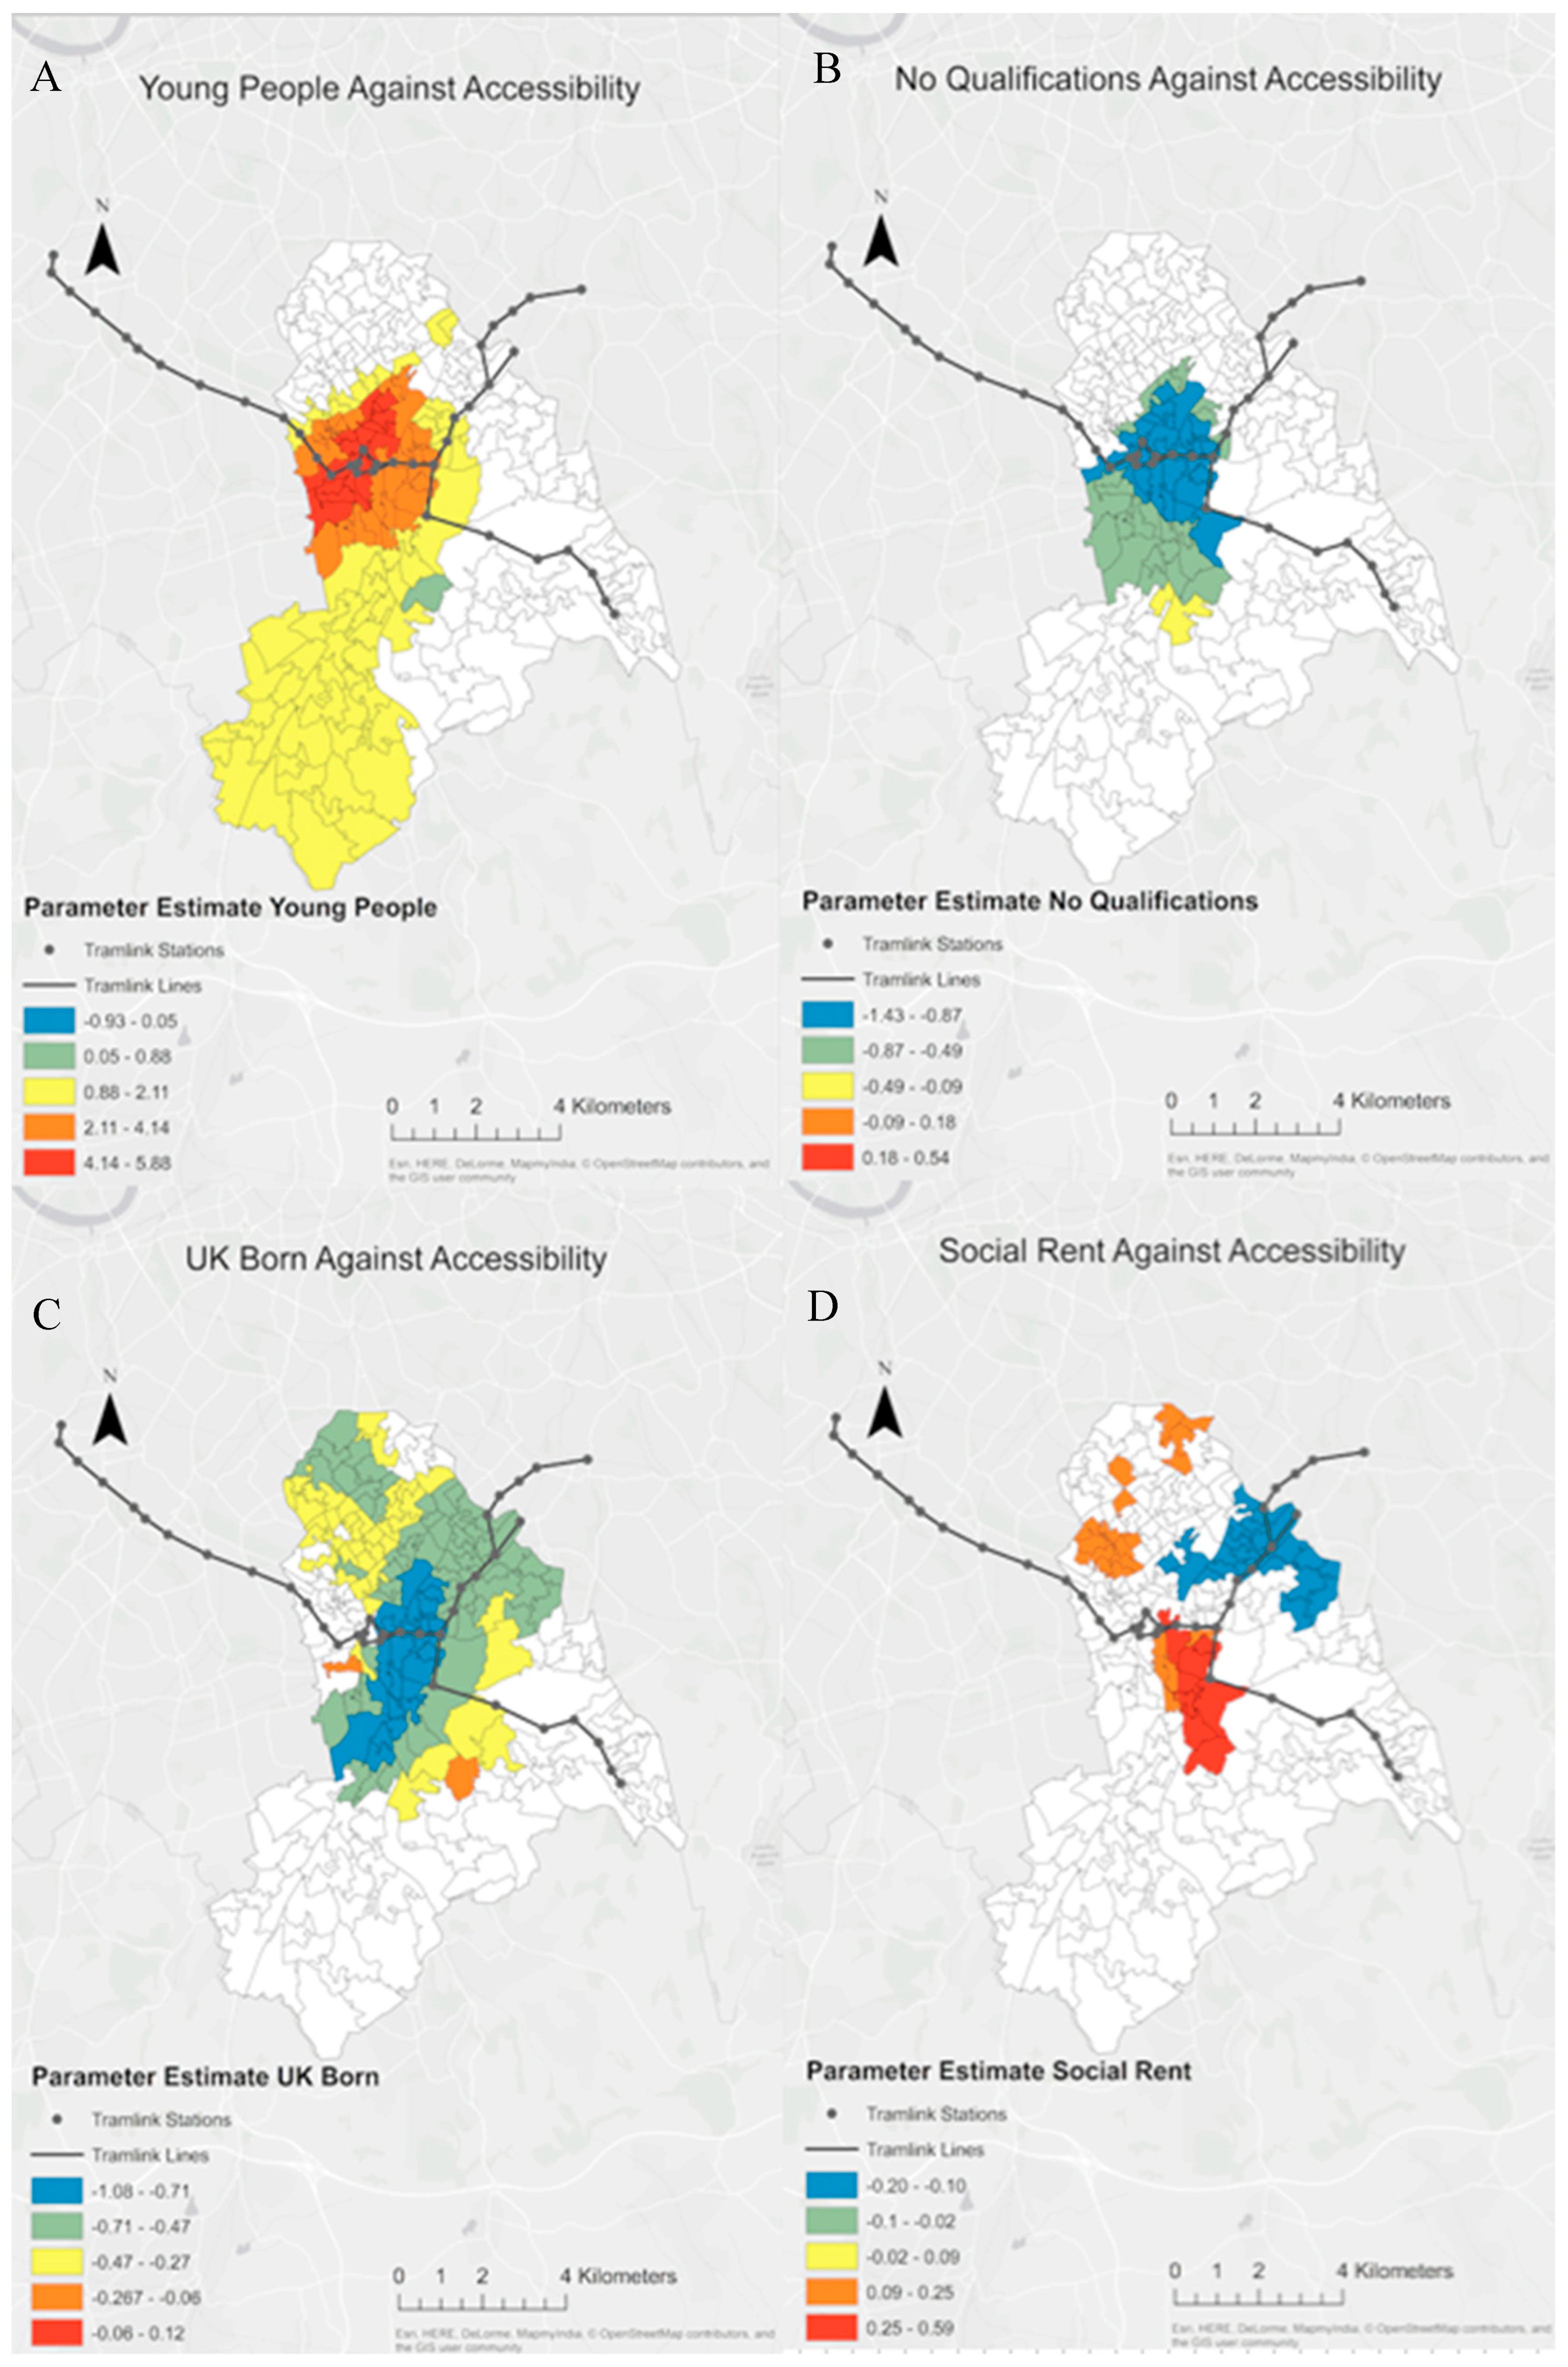
4.4. Results of Geographically Weighted Regression (GWR) Modelling

The remaining four variables were then included in the GWR process. A Gaussian model was run, with an adaptive bi-squared kernel, which produced an optimum bandwidth of 50. This bandwidth means that a local model was produced for each of the 220 data zones. The local AICc, which tests the model optimisation, was 1358, which is a significant reduction from the global model which had a value of 1521, indicating that the model quality was much improved [69].
We next plotted the values of our local parameter estimates, from the GWR model, against their respective geographical locations on a map of the study area. Areas which had parameters below the significance threshold (p > 0.05) were excluded and plotted as white (Figure 5).
From the figures, we found that being a young person had a strong positive relationship with accessibility (mean parameter value, 1.47; range −0.93–5.88; Figure 5A). The impact was strongest along the western side of Croydon and was most strongly concentrated on the areas around the “interchange spine” (Figure 6), which is a transport hub in the central business district of Croydon where passengers can interchange between trams and to other forms of public transport. Secondly, having no qualifications had a negative relationship with accessibility (mean parameter value, −0.18; range −1.43–0.54), and this impact was again focused around the interchange spine (Figure 5B). Thirdly, we found that being born in the UK was negatively associated with accessibility (mean parameter value, −0.18; range −1.08–0.12), and this impact was mainly focused in the northern central areas of Croydon and around the “interchange spine” (Figure 5C). Finally, we found that living in socially rented accommodation had a largely positive association with accessibility (mean parameter value, 0.03; range −0.20–0.59). Again, this was mainly focused around the interchange spine, however with the north-east LSOAs of Croydon showing a slightly negative relationship with accessibility.

5. Discussion

The results show some positive and some negative outcomes for transport infrastructure as a liberating force against actors seeking to dominate the work of others [51] and, thus, emphasise that transport infrastructure alone cannot provide solutions for a more egalitarian society. Even so, in general, the results do show an overall positive impact and thus highlight transport infrastructure as a power neutraliser, creating human agency even if it does not guarantee justice for all [51]. It also shows variations across space which can be investigated in greater detail.
From several of the interviews, there was a feeling that the light-rail system did help human agency, especially from young people. It provided an opportunity to live in a relatively cheap area (£200-£300 less in rent compared to zone 2 of London) and then commute into London (albeit with potentially less convenience) or work within Croydon, as there are many opportunities through the large companies that already have established offices in the area. The fact that companies were already based in Croydon is a very important aspect of Croydon’s success, as this provided the foundations on which regeneration could be successful. Therefore, when looking at the success of introducing young people to an area, the context is important. Through attracting young people, Croydon has attempted to reduce the intergenerational inequality that we have witnessed through years of failed housing policies, making homeownership more accessible to young people relative to the rest of London. This must be furthered as there was still a belief that the young people would not have this opportunity as the prices remain beyond what young people can realistically afford.
This young creative class have flocked to the area with the new job opportunities as well as the improved accessibility to central London [78]. This also links to the incumbent population though, who are getting pushed out of certain areas by these young incomers and explains the mixed results for those with no qualifications or living in socially rented accommodation [78]. With regards to this young creative class, it must also be acknowledged that it was not purely the pull of Croydon itself that brought them to the area, however the job opportunities that were available, with several stating that they would still prefer to work closer to central London as they felt isolated in Croydon.
Through several interviews, it became clear that the negative association between being born in the UK and public transport accessibility was potentially a result of Croydon being so ethnically diverse, with 47.3% of the population white British, rather than issues of inclusivity [79]. The area now attracts young people and so it is not necessarily an issue of the native born leaving the area, however a realisation that London is a globalised city and Croydon is a more affordable area in which to live. As a result, Croydon is attractive to this influx of new transient migrants who see the borough as an affordable area with strong transport links within Croydon itself, however also to the rest of London. Native born residents’ desires will also vary with a greater desire for quieter neighbourhoods or more open space than the immigrants entering the borough for work, for example. In other words, the negative association between accessibility and the share of native-born individuals could also imply that the native-born are not sensitive to spatial accessibility; they probably value other amenities.
This ethnic diversity was discussed by several interviewees who believed that communities were forming to a certain extent; however, there were still enclaves of isolation based upon ethnicity and more should be done to create inclusion within Croydon which could be identified within the GWR mapping. Inclusivity was not seen to be a major issue as many people lived in Croydon on a short-term basis while they set up opportunities within more established communities. This emphasises that material structures, such as the Tramlink, are not sufficient on their own and therefore must be complemented by immaterial measures if social equity in the form of an inclusive society is to be created.
Interviewees proposed that there were several reasons for the variation in accessibility’s association with socially rented accommodation. The first reason identified was due to the cost of the interchange between modes of transport. Although transfer friction between public transport modes had already been reduced through the use of contactless and oyster card payment systems, creating more streamlined interchanges, the fiscal cost of the interchange was still an issue. For example, if people lived in the east of Croydon, where there was a negative association with social renters, then there was the additional cost of the tram itself before subsequently using another transport mode to complete their journey outside of Croydon. This was highlighted locally through the GWR and could be focused on within the interviews. Therefore, there was an added financial burden on a population that was already struggling, unlike those around the interchange spine who could save on the initial transport cost by walking to the interchange spine. Consequently, the improvement in accessibility has only occurred in theory as the cost means it is still relatively inaccessible. Policymakers are aware of this and ideas such as the London Hopper Fare [80], allowing unlimited journeys within one hour on the tram and bus, does reduce this friction when travelling within Croydon, yet the commuter trains would still increase the fiscal burden and, therefore, we see the negative association within the east of Croydon.
A further opinion that was touched upon in the interviews was the fiscal burden of road building and maintenance which is also important in Croydon’s context, especially due to the prolonged austerity measures. Without strong public transport offerings, there would be a greater amount of transport on the roads, which requires more money to maintain and therefore less public money for other projects and policies. Reducing the travel load will reduce the public spending burden, allowing public money to be spent on other means, such as immaterial structures to improve social equity through improved low-income accommodation [45]. This also highlights the ideals of the compact city and Transit Oriented Development (TOD), through to new urbanism, which would reduce road building and maintenance costs through the prevention of urban sprawl, while allowing a critical density for public transport to be realised [21,22].
Looking elsewhere for solutions, it can be seen that immaterial and material policies across Europe, particularly the Nordic countries, provide a strong foundation for policy in the UK. These countries slowed urban sprawl down in the 1980s and stopped it almost entirely in the early 1990s, with densification programs occurring in the largest cities in Sweden and Norway [45,80]. There is evidence of this occurring within Croydon, however fragmented policy due to varying agendas across the different tiers within government means that progress has been modest and poorly implemented. If more integrated policy measures were in place, it would help to increase public transport competitiveness [45]. Through localised results, areas that could utilise densification programmes would be able to do so, focusing on the local level, which would improve the effectiveness of “bottom-up” governance.
It can be argued that this densification is against the wishes of the free market, yet interviewees suggested that it is cramped conditions that people attempted to alleviate themselves from when choosing suburban living within Croydon and not necessarily densification. The localised results highlight the success of the TOD around the intercept spine of Croydon, with mixed-use facilities currently in place [81,82,83]. It should be noted that to make these denser living environments liveable, there should be a rejection of “town cramming” with selective building producing areas that are of walking scale for everyday amenities to help those lower income households with the fiscal burden of transport [84]. This increased density will also increase the modal split to public transport [85], as we have seen in Croydon, if these lower-income families can also walk or cycle to opportunities as it reduces the financial cost of everyday life. Further use of GWR analysis could highlight areas that would benefit from walkable neighbourhood interventions and improved cycle infrastructure.
Building on the lessons from the Nordic countries, we can actually see that Croydon is a more sustainable concept than the new plans for eco-towns, espousing Ebenezer Howard’s garden city concept which is still popular within the current UK national government [82,86,87]. Instead of these new towns, effective retrofitting of sprawl through localised mapping allows for developments to be created within an existing community. In Croydon, the number of multinational companies that already have offices within the Borough provides opportunity to encourage even more companies into the area. This is far more sustainable—socially, environmentally and economically—than creating new towns that, in turn, create new travel demands as people seek to commute from these urban extensions to locations that already have employment, entertainment and retail opportunities [88]. It must be noted that with the new influx of opportunity comes the risk of an area losing its identity. Context is also important as there is no one single solution for every city or urban environment [62]. What Croydon has highlighted is that integrating and retrofitting can be more effective than the creation of new towns beyond the greenbelt (which cause greater travel demand to and from the established urban centres). Producing localised results could be the answer to effective retrofitting instead of blanket proposals within diverse urban spaces.
Although Tramlink identifies a relationship between social equality and spatial accessibility, more must be done. This is not just in the form of new tramlines, although certain interviewees believed lines in the southern districts of the Borough would be beneficial, however also through immaterial structures. Ideas about how to facilitate those who struggle to pay commuting fares, such as the free feeder buses seen in the Bus Rapid Transit (BRT) system of Bogota [89], would relieve the financial burden on those that commute outside of Croydon through the commuter trains, alleviating the double cost of transport. In this sense, a system that cancels the tram payment if an individual makes a further journey on national rail services could allow low income households to enjoy the improved accessibility of Croydon without the added financial cost. Where there is a lack of critical density to support regular shuttle buses, smart scheduling such as that detailed in Banyai et al.’s [90] analysis for delivery services could be adapted to produce methods that would allow those living outside an active travel zone to gain access to such services. This would help to reduce unnecessary movements in providing free services as the demand for such services would fluctuate, especially where there is a lack of density to make formalized public transport feasible; this would be a method of adapting suburbia without costly retrofitting [90,91]. Reducing demand for travel through effective intervention in the local context to encourage neighbourhoods to offer a greater selection of services could also be beneficial, with localised results highlighting areas that lack such facilities.

6. Conclusions

In general, there is an association between social equity (such as factors relating to young people, having no qualifications, being born in the UK and living in socially rented accommodation) and urban infrastructure within Croydon, however this was not homogeneous. Localised variations across space have been realized through demographic and socio-economic considerations of the urban environment. It was found that being a young person and living in socially rented accommodation had a largely positive relationship with accessibility, whereas having no qualifications and being born in the UK had a negative association with accessibility. This paper has furthered current research with a unique marriage of advanced spatial statistics and qualitative analysis, helping to create empirical evidence with regards to the urban environment’s power in society. It takes the view that material and immaterial structures are essential in society and can help or hinder human agency, which has been disregarded by neoliberal political thinking. It has also proven that to promote effective “bottom-up” governance, localised analysis that varies across space is essential. If collectivism can regain its standing in society against neoliberal individualism, a “common wealth”, such as light-rail systems, must be created. If implemented correctly, with interventions localised to effectively spend public money, regeneration projects will then be more inclusive and not be tainted with the negative connotations of gentrification.
Material structures such as Tramlink have helped some in society, yet many have not realised this improvement due to the financial cost of accessing the tram and, therefore, immaterial structures need to accompany the material projects to complement their achievements. The current governmental structure is flawed in this sense due to the fragmentation across several tiers in creating policy. These measures are top-down in nature and thus do not acknowledge the failings in projects as the decision-makers are isolated from the real effects of the projects. Through localised analysis, variations across space can be identified, helping to inform policy decisions and infrastructure interventions.
A regeneration plan looking beyond the material transport infrastructure is required to help society. Greater emphasis must focus on social equity aspects when evaluating the sustainability of planning practices, instead of merely focusing on the environmental and economic values. In the end, material structures alone cannot make or break a city, however in combination with immaterial structures, they can. If implemented correctly, we can witness the true power of the urban infrastructure, as a power neutraliser, which can help create greater social equity.
The findings of this research contradict the majority of current thinking which disregards the ability of the urban environment to prevent the perpetuity of growing social inequity. It realises that both the material structure of the transport infrastructure, as well as the immaterial attributes of society, in combination, help to create avenues for individuals to succeed and, therefore, the current UK government should be cautious with their continued austerity measures which negatively affect transport and help to perpetuate social inequity. It also believes that public money can be more efficiently spent if there are localised policy interventions that are informed by localised analysis which can pinpoint issues across space instead of blanket interventions across nonhomogeneous areas.
There are some limitations to this research. First, more attributes could be added and tested using the model if the relevant data are available. Second, comparative studies could be conducted using more boroughs and cities. Finally, this study only examined the association between spatial accessibility and the distributions of socio-economic groups, so further research could examine causal relationships.

Author Contributions

N.C. primarily ran the GWR modelling, produced maps, conducted the interviews and co-wrote the paper. M.C. further interpreted the modelling results, produced maps, commented on the interview results and edited the paper. Y.L. contributed to the GWR modelling and commented on and edited the paper. X.G. and Y.Z. commented on and edited the paper.

Funding

This research is partly funded by the National Natural Science Foundation of China (Project No. 51808392).

Acknowledgments

The authors would like to thank the special issue editor Justin Bishop and the five anonymous reviewers for their suggestions regarding the improvement of the paper. In addition, the authors also would like to extend their appreciation to Robin Hickman, Iqbal Hamiduddin, John Ward, Andy Ho, Cheng Shi, Ye Liu and Dongho Han for their comments and suggestions. Thanks also to Adam Dennett, Lixun Liu and Yingcheng Li for sharing their ideas regarding using GWR model on this topic. The responsibility for all analysis, interpretation and conclusions drawn from the data lies entirely with the authors.

Conflicts of Interest

The authors declare no conflict of interest.

Appendix A

Interview guide
General:
  • Knowledge of Tramlink and Croydon
  • Have you noticed the trams affecting people’s general quality of life?
UK Born:
  • How have accessibility changes influenced the behaviour of native born residents?
Social Rent:
  • With the introduction of Tramlink, has there been an impact on those living in socially rented accommodation?
  • Any connection to policies regarding mixed tenure?
  • Focusing on the variation between the central part of Croydon and the north east, what things vary between these areas?
No Qualifications:
  • The relationship between accessibility and not having qualifications appears to be different to other socioeconomic variables. Have you any thoughts on why this might be?
Young People:
  • What characteristics does Croydon have which makes it attractive to young people?

References

  1. Buchanan, C. Traffic in Towns. A Study of the Long-Term Problems of Traffic in Urban Areas. Ministry of Transport; HMSO: London, UK, 1963. [Google Scholar]
  2. Jensen, O.B.; Richardson, T. Making European Space Mobility, Power and Territorial Identity; Routledge: London, UK, 2004. [Google Scholar]
  3. Rydin, Y. Governing for Sustainable Urban Development; Abingdon: Earthscan, UK, 2010. [Google Scholar]
  4. Hamiduddin, I. Social sustainability, residential design and demographic balance: Neighbourhood planning strategies in Freiburg, Germany. Town Plan. Rev. 2015, 86, 29–52. [Google Scholar] [CrossRef]
  5. Institute of Fiscal Studies (IFS). Incomes in the UK. Available online: https://www.ifs.org.uk/tools_and_resources/incomes_in_uk (accessed on 17 August 2017).
  6. Liu, Y.; Zhang, F.; Wu, F.; Liu, Y.; Li, Z. The subjective wellbeing of migrants in Guangzhou, China: The impacts of the social and physical environment. Cities 2017, 60, 333–342. [Google Scholar] [CrossRef]
  7. Liu, Y.; Zhang, F.; Liu, Y.; Li, Z.; Wu, F. Economic disadvantages and migrants’ subjective well-being in China: The mediating effects of relative deprivation and neighbourhood deprivation. Popul. Space Place 2018, e2173. [Google Scholar] [CrossRef]
  8. Liu, Y.; Zhang, F.; Liu, Y.; Li, Z.; Wu, F. The effect of neighbourhood social ties on migrants’ subjective wellbeing in Chinese cities. Habitat Int. 2017, 66, 86–94. [Google Scholar] [CrossRef]
  9. Sun, G.; Zacharias, J.; Ma, B.; Oreskovic, N.M. How do metro stations integrate with walking environments? Results from walking access within three types of built environment in Beijing. Cities 2016, 56, 91–98. [Google Scholar] [CrossRef]
  10. Wang, Y.; Chau, C.K.; Ng, W.Y.; Leung, T.M. A review on the effects of physical built environment attributes on enhancing walking and cycling activity levels within residential neighborhoods. Cities 2016, 50, 1–15. [Google Scholar] [CrossRef]
  11. Ding, C.; Liu, C.; Zhang, Y.; Yang, J.; Wang, Y. Investigating the impacts of built environment on vehicle miles travelled and energy consumption: Differences between commuting and non-commuting trips. Cities 2017, 68, 25–36. [Google Scholar] [CrossRef]
  12. Zhu, Z.; Li, Z.; Chen, H.; Liu, Y.; Zeng, J. Subjective well-being in China: How much does commuting matter? Transportation 2017, 1–20. [Google Scholar] [CrossRef]
  13. Thiagarajan, M.; Newman, G.; Van Zandt, S. The projected impact of a neighborhood-scaled green-infrastructure retrofit. Sustainability 2018, 10, 3665. [Google Scholar] [CrossRef] [PubMed]
  14. Baum-Snow, N.; Kahn, M.E. The effects of new public projects to expand urban rail transit. J. Public Econ. 2000, 77, 241–263. [Google Scholar] [CrossRef]
  15. Gibbons, S.; Machin, S. Valuing rail access using transport innovations. J. Urban Econ. 2005, 57, 148–169. [Google Scholar] [CrossRef] [Green Version]
  16. Janelle, D.G. Spatial reorganisation: A model and concept. Ann. Assoc. Am. Geogr. 1969, 58, 348–364. [Google Scholar] [CrossRef]
  17. Harvey, D. The Limits of Capital; Blackwell: London, UK, 1982. [Google Scholar]
  18. Harvey, D. The Geo-Politics of Capitalism. In Social Relations and Spatial Structures; Gregory, D., Urray, J., Eds.; Blackwell: Oxford, UK, 1985; pp. 422–443. [Google Scholar]
  19. Næss, P. Built environment, causality and travel. Transp. Rev. 2015, 35, 275–291. [Google Scholar] [CrossRef]
  20. Næss, P. Built environment, causality and urban planning. Plan. Theory Pract. 2016, 17, 52–71. [Google Scholar] [CrossRef]
  21. Jacobs, J. The Death and Life of Great American Cities; Random House: New York, NY, USA, 1961. [Google Scholar]
  22. Breheny, M. The contradictions of the compact city: A review. In Sustainable Development and Urban Form; Breheny, M.J., Ed.; European Research in Regional Science: London, UK, 1992; pp. 138–159. [Google Scholar]
  23. Mulley, C. Accessibility and Residential Land Value Uplift: Identifying Spatial Variations in the Accessibility Impacts of a Bus Transitway. Urban Stud. 2014, 51, 1707–1724. [Google Scholar] [CrossRef]
  24. UK Public Spending Design. Time Series Chart of Public Spending. Available online: http://www.ukpublicspending.co.uk/spending_chart_2008_2015UKb_17c1li011lbn_65t (accessed on 17 August 2017).
  25. Blainey, S.P.; Preston, J.M. A geographically weighted regression based analysis of rail commuting around Cardiff, South Wales. In Proceedings of the 12th World Conference on Transportation Research, Lisbon, Portugal, 11–15 July 2010. [Google Scholar]
  26. Forheringham, A.S.; Brunsdon, C.; Charlton, M. Quantitative Geography: Perspectives on Spatial Data Analysis; SAGE: London, UK, 2000. [Google Scholar]
  27. Forheringham, A.S.; Rogerson, P.A. The SAGE Handbook of Spatial Analysis; SAGE: London, UK, 2009. [Google Scholar]
  28. Siraut, J. Economic and Regeneration Impacts of Croydon Tramlink. Available online: https://www.witpress.com/Secure/elibrary/papers/UT04/UT04085FU.pdf (accessed on 1 August 2017).
  29. Copley, G.; Thomas, M.; Murphy, P.; Georgeson, N. Croydon Tramlink Impact Study. In Proceedings of the European Transport Conference, Cambridge, UK, 9–11 September 2002. [Google Scholar]
  30. Paez, A. Exploring contextual variations in land use and transport analysis using probit model with geographical weights. J. Transp. Geogr. 2006, 14, 167–176. [Google Scholar] [CrossRef]
  31. Cardozo, O.D.; Garcia-Palomares, J.C.; Gutierrez, J. Application of geographically weighted regression to the direct forecasting of transit ridership at station-level. Appl. Geogr. 2012, 34, 548–558. [Google Scholar] [CrossRef]
  32. Tobler, W. A computer movie simulating urban growth in the Detroit region. Econ. Geogr. 1970, 46, 234–240. [Google Scholar] [CrossRef]
  33. Fotheringham, A.S. Exploratory spatial data analysis and GIS. Environ. Plan. A 1992, 25, 156–158. [Google Scholar]
  34. Fotheringham, A.S. On the future of spatial analysis: The role of GIS. Environ. Plan. A 1993, 30–34. [Google Scholar] [CrossRef]
  35. Kamrowska-Zaluska, D.; Obracht-Prondzyńska, H. The use of big data in regenerative planning. Sustainability 2018, 10, 3668. [Google Scholar] [CrossRef]
  36. Fotheringham, A.S.; Rogerson, P.A. GIS and spatial analytical problems. Int. J. Geogr. Inf. Syst. 1993, 7, 3–19. [Google Scholar] [CrossRef]
  37. Openshaw, S. Exploring Space-Time-Attribute Pattern Analysers. In Spatial Analysis and GIS; Fotheringham, A.S., Fotheringham, A.S., Eds.; Taylor and Francis: London, UK, 1993; pp. 147–167. [Google Scholar]
  38. Brundson, C.F. Estimating probability surfaces for geographical point data: An adaptive kernel algorithm. Comput. Geosci. 1991, 21, 877–894. [Google Scholar]
  39. Dempsey, N.; Bramley, G.; Power, S.; Brown, C. The social dimension of sustainable development: Defining urban social sustainability. Sustain. Dev. 2011, 19, 289–300. [Google Scholar] [CrossRef]
  40. Martens, K. Transport Justice: Designing Fair Transportation Systems; Routledge: New York, NY, USA, 2017. [Google Scholar]
  41. Banister, D. Transport Planning; Spon: London, UK, 2002. [Google Scholar]
  42. Bramley, G.; Dempsey, N.; Power, S.; Brown, C.; Watkins, D. Social sustainability and urban form: Evidence from five British cities. Environ. Plan. A 2009, 41, 2125–2142. [Google Scholar] [CrossRef]
  43. Knowles, R.D.; Ferbrache, F. Evaluation of economic impacts of light rail investment on cities. J. Transp. Geogr. 2016, 54, 430–439. [Google Scholar] [CrossRef]
  44. Transport for London (TfL) PTALs. Available online: https://data.london.gov.uk/dataset/public-transport-accessibility-levels (accessed on 28 August 2017).
  45. Næss, P. Urban Structure Matters: Residential Location, Car Dependence and Travel Behaviour; Routledge: London, UK, 2006. [Google Scholar]
  46. Waqas, M.; Dong, Q.; Ahmad, N.; Zhu, Y.; Nadeem, M. Understanding acceptability towards Sustainable Transportation Behavior: A Case Study of China. Sustainability 2018, 10, 3686. [Google Scholar] [CrossRef]
  47. Hickman, R.; Cao, M.; Mella-Lira, B.; Fillone, A.; Biona, J.B. Understanding capabilities, functionings and travel in high and low income neighbourhoods in Manila. Soc. Incl. 2017, 5, 161–174. [Google Scholar] [CrossRef]
  48. Cao, M.; Hickman, R. Transport, Social Equity and Capabilities in East Beijing. In Handbook on Transport and Urban Transformation in Contemporary China; Chen, C.-L., Pan, H., Shen, Q., Wang, J.X., Eds.; Edward Elgar: London, UK, 2019. [Google Scholar]
  49. Cao, M.; Zhang, Y.; Zhang, Y.; Li, S.; Hickman, R. Using Different Inequality Methods to Evaluate Individual Social Equity in Transport. In Transport, Space and Equity; Hickman, R., Mella-Lira, B., Givoni, M., Geurs, K., Eds.; Edward Elgar: London, UK, 2019. [Google Scholar]
  50. Giddens, A. The Constitution of Society: Outline of the Theory of Structuration; Polity Press: Cambridge, MA, USA, 1984. [Google Scholar]
  51. Healey, P. Collaborative planning in perspective. Plan. Theor. 2003, 2, 101–123. [Google Scholar] [CrossRef]
  52. Bourdieu, P.; Wacquant, L. An Invitation to Reflexive Sociology; Polity Press: Cambridge, MA, USA, 2002. [Google Scholar]
  53. Baker, C. Cultural Studies: Theory and Practice; Sage: London, UK, 2005. [Google Scholar]
  54. Gregory, D.; Johnston, R.; Pratt, G.; Watts, M.; Whatmore, S. Dictionary of Human Geography; Blackwell: London, UK, 2009. [Google Scholar]
  55. Flyvbjerg, B. Empowering Civil Society: Habermas, Foucault and the Question of Conflict. In Cities of Citizens: Planning and the Rise of Civil Society in a Global Age; Douglass, M., Friedmann, J., Eds.; Wiley: London, UK, 1998; pp. 185–211. [Google Scholar]
  56. Flyvbjerg, B. Rationality and Power: Democracy in Practice; University of Chicago Press: Chicago, IL, USA, 1998. [Google Scholar]
  57. Gordon, I. Densities, urban form and travel behaviour. Town Country Plan. 1997, 23, 239–241. [Google Scholar]
  58. Dunlap, R.E.; Catton, W.R. What environmental sociologists have in common (whether concerned with “built” or “natural” environments). Sociol. Inq. 1983, 53, 113–135. [Google Scholar] [CrossRef]
  59. Frey, H. Designing the City: Towards a More Sustainable Urban Form; Spon: London, UK, 1999. [Google Scholar]
  60. Schwanen, T.; Banister, D.; Anable, J. Rethinking habits and their role in behaviour change: The case of low-carbon mobility. J. Transp. Geogr. 2012, 24, 522–532. [Google Scholar] [CrossRef]
  61. Pred, A. Interpenetrating processes: Human agency and the becoming of regional spatial and social structures. Pap. Reg. Sci. Assoc. 1985, 57, 7–17. [Google Scholar] [CrossRef]
  62. Hickman, R.; Banister, D. Transport, Climate Change and the City; Routledge: Abingdon, UK, 2014. [Google Scholar]
  63. Archer, M.S. Being Human: The Problem of Agency; Cambridge University Press: Cambridge, MA, USA, 2000. [Google Scholar]
  64. Danermark, B.; Ekstrom, M.; Jacobsen, L.; Karlsson, J.C. Explaining Society: Critical Realism in the Social Sciences; Routledge: London, UK, 2001. [Google Scholar]
  65. Bourdieu, P. Distinction; Routledge: Oxon, UK, 1984. [Google Scholar]
  66. Wacquant, L. Habitus. In International Encyclopaedia of Economic Sociology; Beckert, J., Zafirovski, M., Eds.; Routledge: London, UK, 2004; pp. 317–321. [Google Scholar]
  67. Office for National Statistics (ONS). Super Output Areas: Introduction. Available online: http://www.neighbourhood.statistics.gov.uk (accessed on 7 August 2018).
  68. Cao, M.; Hickman, R. Car dependence and housing affordability: An emerging social deprivation issue in London? Urban Stud. 2018, 55, 2088–2105. [Google Scholar] [CrossRef]
  69. Fotheringham, A.S.; Brundsdon, C.E.; Charlton, M.M. Geographically Weighted Regression: The Analysis of Spatially Varying Relationships; John Wiley and Sons: West Sussex, UK, 2002. [Google Scholar]
  70. Wheeler, D.; Tiefelsdorf, M. Multicollinearity and correlation among local regression coefficients in geographically weighted regression. J. Geogr. Syst. 2005, 7, 161–187. [Google Scholar] [CrossRef]
  71. O’Sullivan, D.; Unwin, D. Geographic Information Analysis; Wiley and Sons: Chichester, UK, 2010. [Google Scholar]
  72. Zhao, F.; Park, N. Using Geographically Weighted Regression Models to Estimate Annual Average Daily Traffic. Transp. Res. Rec. 2004, 1879, 99–107. [Google Scholar] [CrossRef]
  73. Konishi, S.; Kitagawa, G. Information Criteria and Statistical Modelling; Springer: New York, NY, USA, 2008. [Google Scholar]
  74. Moran, P.A.P. Notes on continuous stochastic phenomena. Biometrika 1950, 37, 17–23. [Google Scholar] [CrossRef] [PubMed]
  75. Mouratidis, K. Built environment and social well-being: How does urban form affect social life and personal relationships? Cities 2018, 74, 7–20. [Google Scholar] [CrossRef]
  76. Valentine, G. Tell Me About…: Using Interviews as a Research Methodology. In Methods in Human Geography: A Guide for Students Doing a Research Project; Flowerdew, R., Martin, D., Eds.; Essex: Longman, UK, 2005; pp. 110–127. [Google Scholar]
  77. Mansley, E.; Demsar, U. Space Matters: Geographic Variability of Electoral Turnout Determinants in the 2012 London Mayoral Election. Available online: https://research-repository.st-andrews.ac.uk/bitstream/handle/10023/10642/GWR_LondonElection_Accepted_20151015.pdf?sequence=1&isAllowed=y (accessed on 27 August 2017).
  78. Florida, R. Cities and the Creative Class; Routledge: London, UK, 2005. [Google Scholar]
  79. Office of National Statistics (ONS). 2011 Census. Available online: http://www.ons.gov.uk/ons/rel/census/2011-census/key-statistics-for-local-authorities-in-england-and-wales/rft-table-ks201ew.xls (accessed on 7 September 2017).
  80. Transport for London (TfL). Hopper Fare. Available online: https://tfl.gov.uk/campaign/hopper-fare (accessed on 28 August 2017).
  81. UN/ECE (United Nations’ Economic Commission for Europe). Major Trends Characterising Human Settlements Development in the ECE Region; United Nations: New York, NY, USA, 1998. [Google Scholar]
  82. Calthorpe, P. The Next American Metropolis: Ecology, Community, and the American Dream; Princeton Architectural Press: New York, NY, USA, 1993. [Google Scholar]
  83. Hall, P.; Ward, C. Sociable Cities: The Legacy of Ebenezer Howard; Wiley and Sons: Hoboken, NJ, USA, 1998. [Google Scholar]
  84. Montgomery, C. Happy City: Transforming Our Lives through Urban Design; Farrar, Straus and Giroux: New York, NY, USA, 2013. [Google Scholar]
  85. Banister, D.; Watson, S.; Wood, C. Sustainable Cities: Transport, energy and urban form. Environ. Plan. B 1997, 24, 125–143. [Google Scholar] [CrossRef]
  86. BBC. ‘Eco-Towns’ Target Doubled by PM. Available online: http://news.bbc.co.uk/1/hi/uk_politics/7010888.stm (accessed on 2 October 2017).
  87. Howard, E. To-Morrow: A Peaceful Path to Real Reform; Cambridge University Press: New York, NY, USA, 2010. [Google Scholar]
  88. Hall, P. Good Cities, Better Lives: How Europe Discovered the Lost Art of Urbanism; Routledge: Abingdon, UK, 2014. [Google Scholar]
  89. Department for International Development. Sustainable Transport in Colombia: Bogotá and the Transmilenio. Available online: https://www.ids.ac.uk/files/dmfile/LHcasestudy05-BogotaBRT.pdf (accessed on 1 January 2017).
  90. Bányai, T.; Illés, B.; Bányai, Á. Smart scheduling: An integrated first mile and last mile supply approach. Complexity 2018, 2018. [Google Scholar] [CrossRef]
  91. Juhász, J.; Bányai, T. Last Mile Logistics: An Integrated View. Available online: https://iopscience.iop.org/article/10.1088/1757-899X/448/1/012026/pdf (accessed on 1 February 2019).
Figure 1. Map of Greater London (grey area), showing boundaries of London Boroughs. The area of interest for this study was the Borough of Croydon (blue area) in South London. Inset map shows the location of Greater London within the United Kingdom (Source: authors).
Sustainability 11 01229 g001
Figure 2. Plot of AICc score for each of the eight explanatory variables. Variables included in the model are shown to the left of the vertical blue line. Variables excluded are to the right of the blue line.
Sustainability 11 01229 g002
Figure 3. PTAL (public transport accessibility level) in Croydon (Source: authors—reproduced from London Datastore—TfL).
Sustainability 11 01229 g003
Figure 4. Local R2 results (Goodness-of-fit of GWR model across LSOAs in Croydon) (Source: authors—reproduced from London Datastore).
Sustainability 11 01229 g004
Figure 5. Local parameter estimates for each of the independent variables in the GWR model. Note: Spatial plot showing: (A): young people; (B): no qualifications; (C): born in the UK; (D): social rent (Source: authors).
Sustainability 11 01229 g005
Figure 6. Photograph of the Croydon “interchange spine”. Notes: Photo taken looking eastwards with East Croydon Train Station on the left and the NLA Tower in the centre, taken July 2017.
Sustainability 11 01229 g006
Table 1. The dependent and independent variables and those excluded throughout the selection process.
Dependent VariableDescription of MeasureData Sources
AccessibilityPublic Transport Accessibility LevelsLondon Datastore (2015)
Independent VariablesDescription of Measure
Born UKPercentage of LSOA born in UK
No QualificationsPercentage of LSOA with no qualifications
Social RentPercentage of LSOA living in socially rented accommodation
Young PeoplePercentage of LSOA aged between 16–29
One Person Households *Percentage of LSOA living alone
Health *Percentage of LSOA with poor health
Density *Density of LSOA
House Price *Median house price of LSOA
Economically Inactive *Percentage of LSOA economically inactive
Annual Income **Median annual income of LSOA
Lone Parents **Percentage of LSOA that are lone parents
Homeowner **Percentage of LSOA that own home outright
Flat/Apartment **Percentage of LSOA that live in flat/apartment
* removed after AICc (Akaike Information Criterion) stepwise optimisation; ** removed due to multicollinearity. Note: The Lower Layer Super Output Areas (LSOAs) were originally constructed using 2001 Census data from groups of Output Areas (typically four to six) and were constrained by the standard table wards used for 2001 Census outputs. In 2011, these LSOAs had an average of 700 households and 1700 residents. Measures of proximity (to give a reasonably compact shape) and social homogeneity (to encourage areas of similar social background) were also included [67]. There were 4835 LSOAs in Greater London in 2011. The 2011 LSOA map is used as a basic boundary map in the analysis, which is in line with the previous study conducted in London by Cao and Hickman [68]. The resolutions of all data sets provided are at LSOA level.
Table 2. Global regression results.
VariablesGlobal RegressionGWR (Geographically Weighted Regression) Parameter Estimates β[i]
BSEMinMaxMeanSD
Young People1.47 *0.300.935.881.311.48
No Qualifications−0.180.1−1.430.54−0.160.42
Born in the UK−0.18 *0.05−1.080.12−0.360.28
Social Rent0.030.03−0.200.580.030.13
* variables are statistically significant at a 95% confidence interval for the global model.
Table 3. SAC (spatial autocorrelation) results.
SAC Model SAC Results
Model 1: Global Residuals
Inverse Distance SquaredMoran’s IZ-scorep-value
0.5915.840.00001
Local Residuals
Moran’s IZ-scorep-value
0.123.380.0007
Model 2: Global Residuals
Queen’s CaseMoran’s IZ-scorep-value
0.5915.210.00001
Local Residuals
Moran’s IZ-scorep-value
0.143.610.0003

