
Development and Earliest Validation of a Portable Device for Quantification of Hallux Extension Strength (QuHalEx)

Abstract
:1. Introduction
2. Materials and Methods
Device Conceptualization: Design Requirements
- Allow testing of either the right or left foot.
- Accommodate adult feet as large as United States Men’s size 14 and variations in toe size (length, width) and shape.
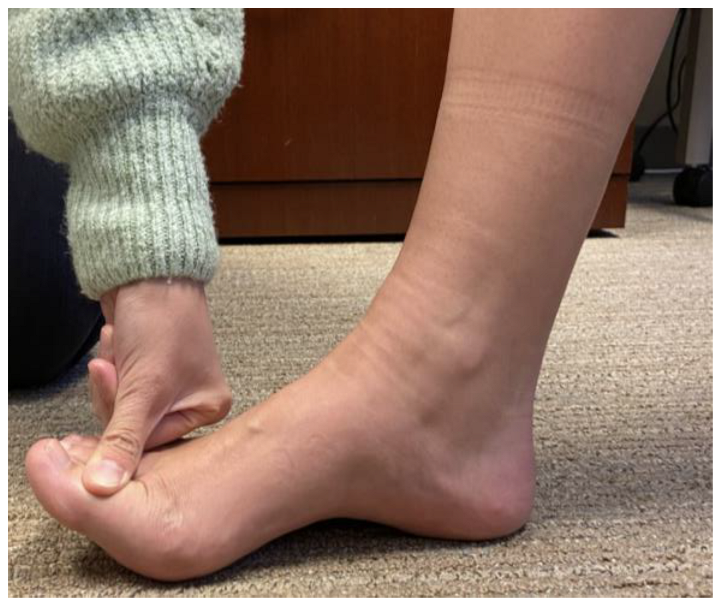
- Restrain the foot proximal to the metatarsophalangeal (MTP) joint to isolate hallux extension and discourage ankle dorsiflexion, a secondary action of the extrinsic hallux extensor muscle, extensor hallucis longus [34].
- Include markings (e.g., ruler-like) or another mechanism to guide the tester in reproducing a patient’s foot position in subsequent serial assessments.
- Sample the output for at least 5 s, and at a frequency sufficient to capture intra- and inter-individual variability in initial and sustained voluntary muscle recruitment. (Most extremity muscles have a recruitment frequency of about 10–11 Hz [35])
- Record force output over time and present key results (peak force) to the tester immediately so they may confirm the collection of a valid trial.
3. Device Prototype
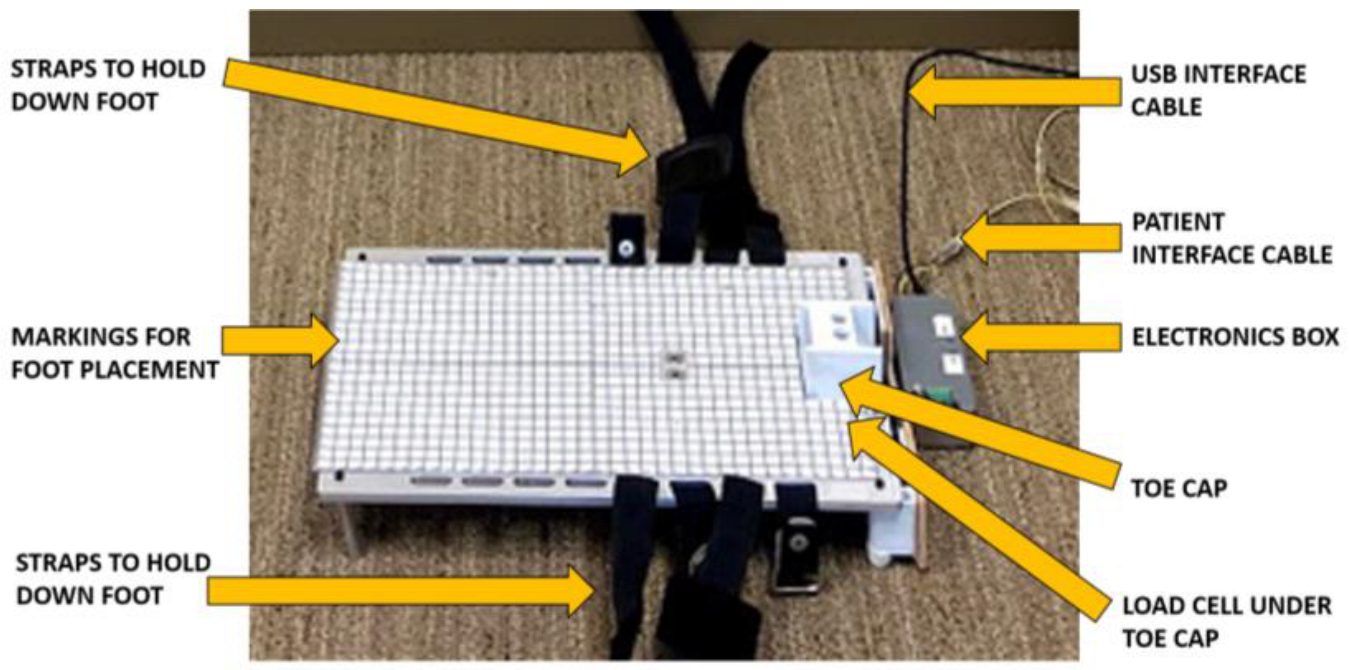
3.1. Hardware
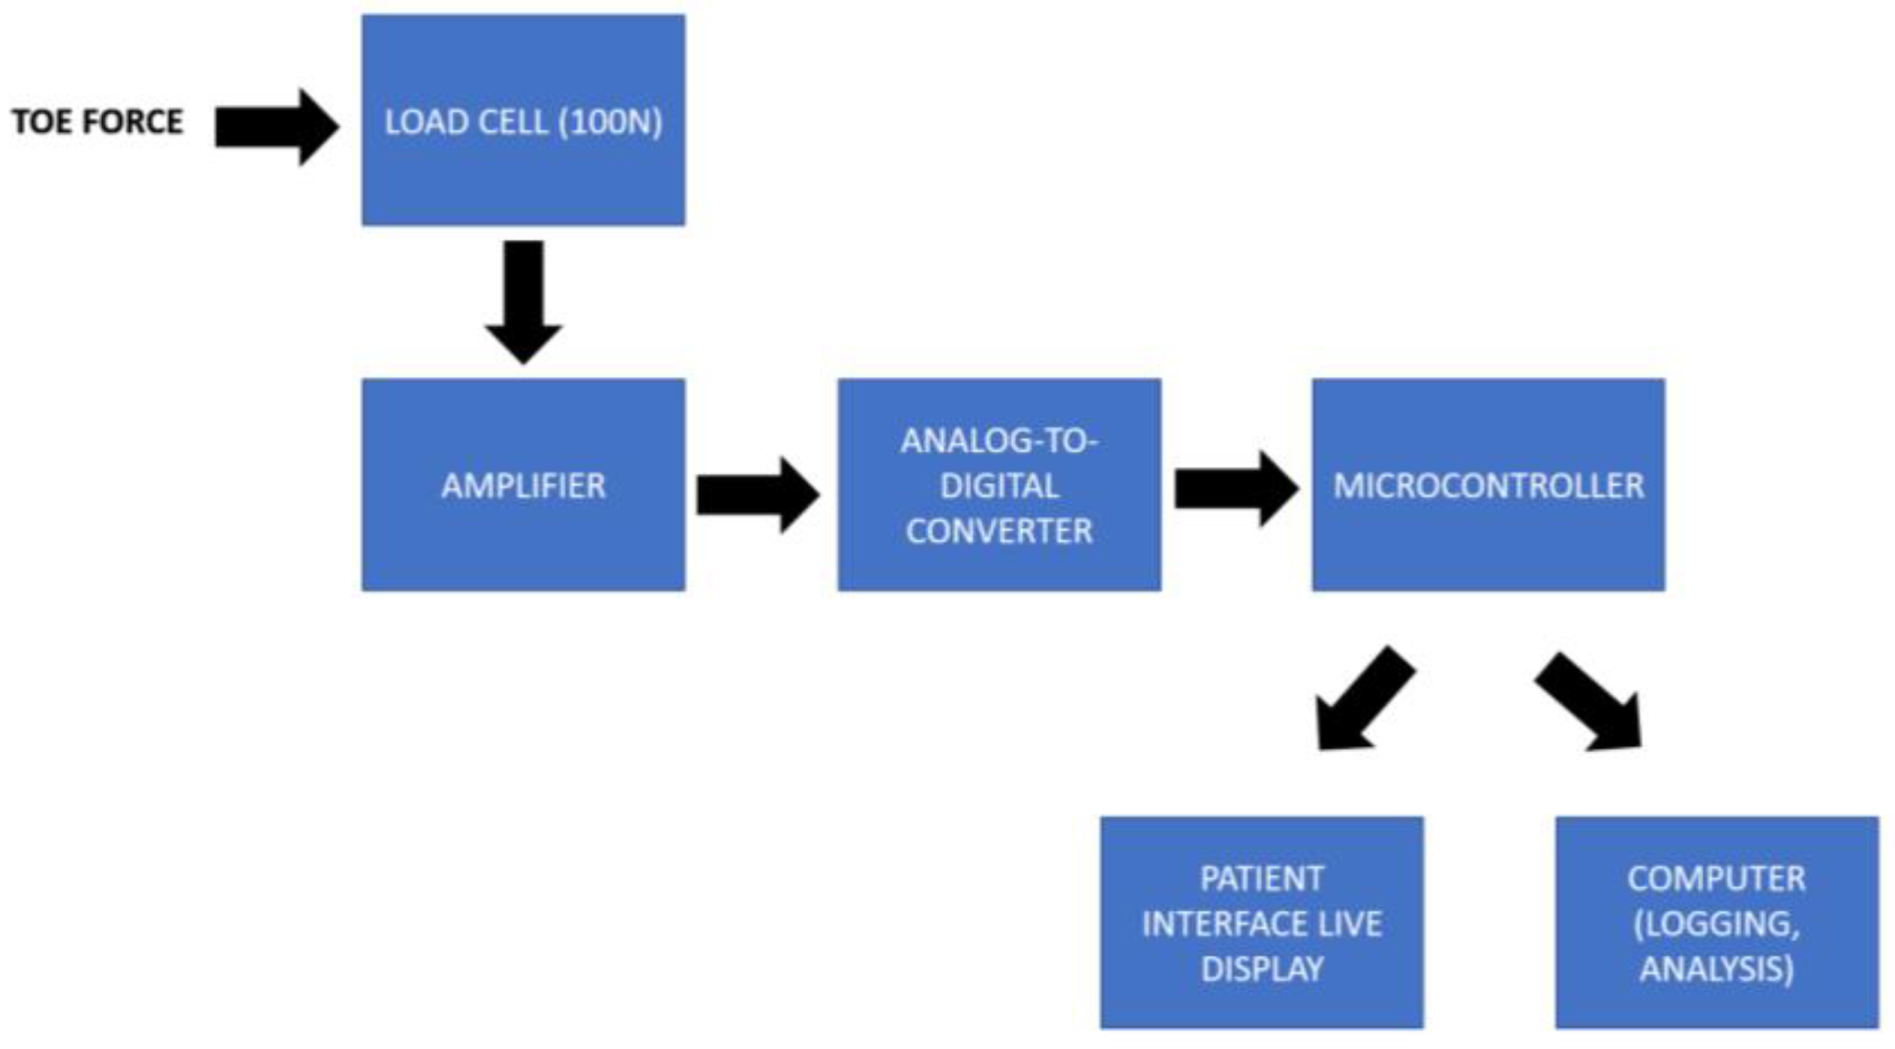
3.2. Electronics
3.3. Software
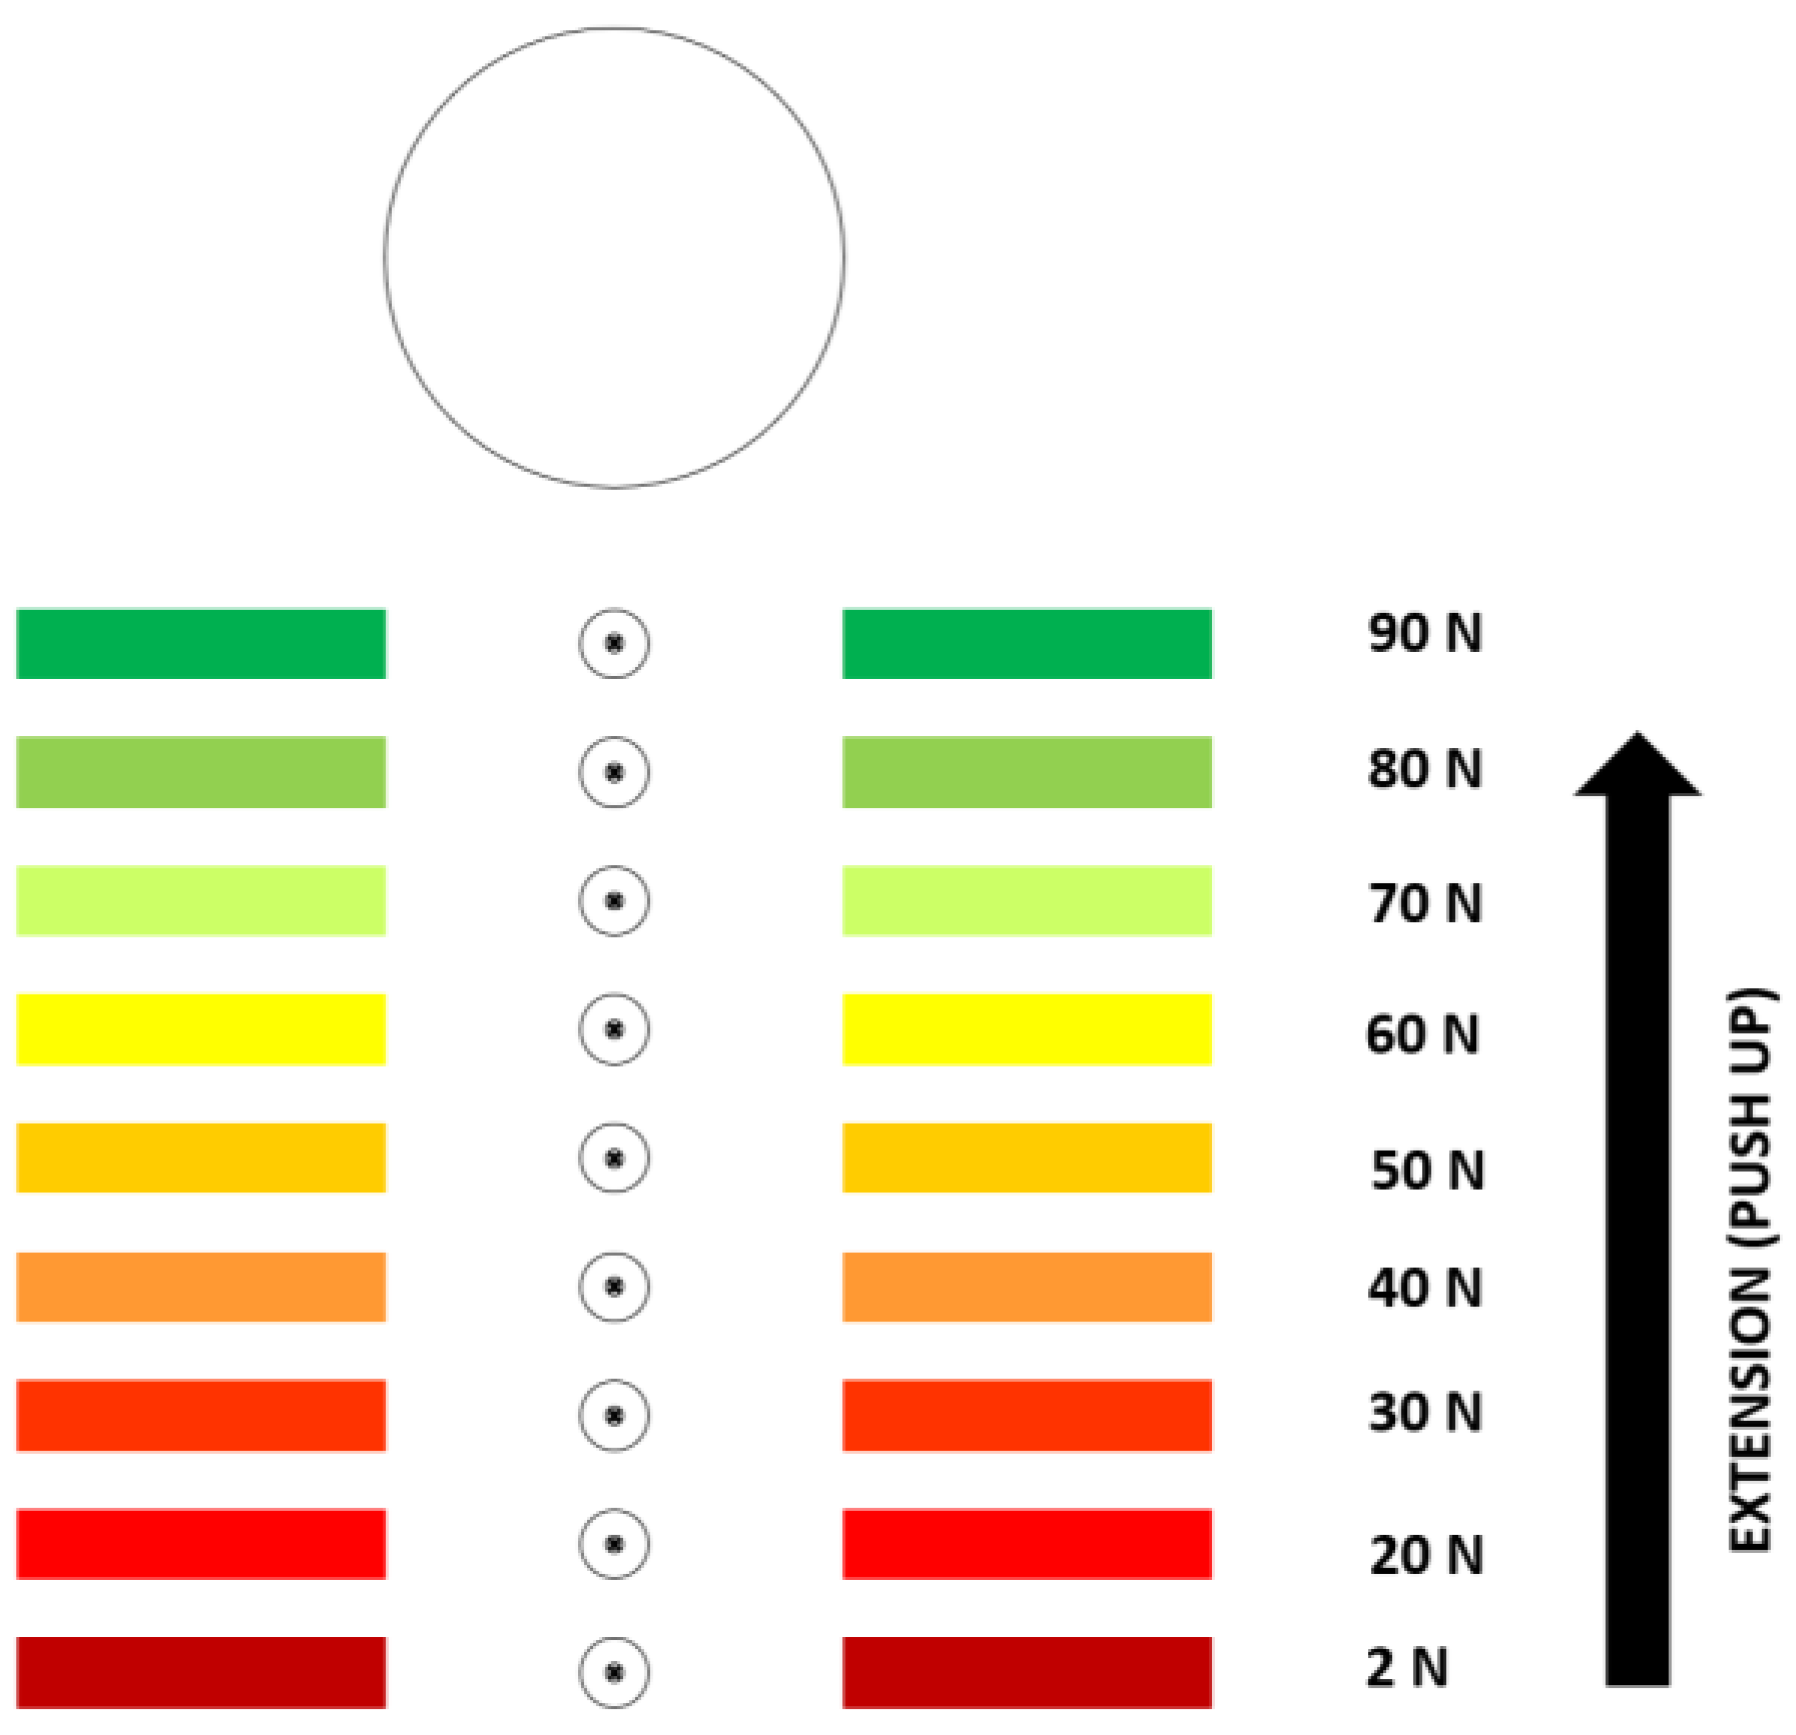
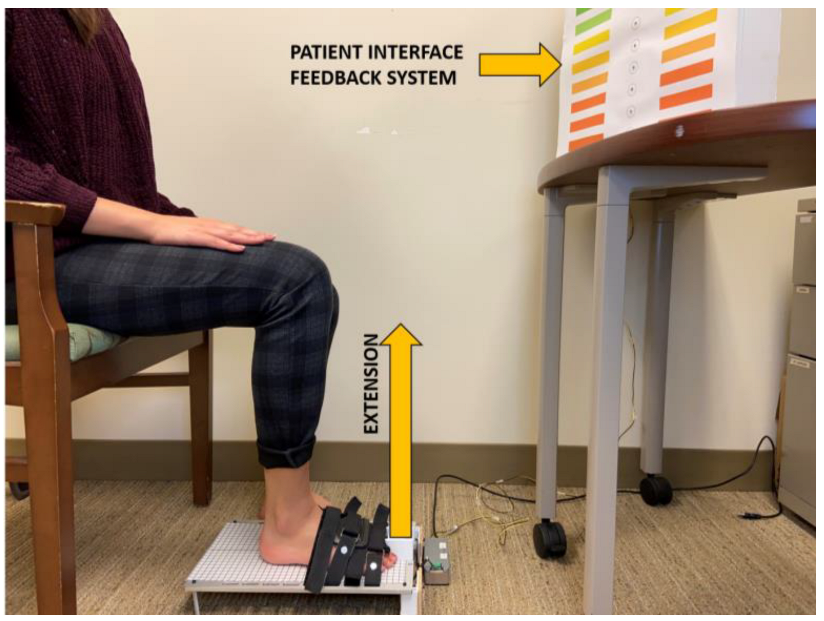
3.4. Patient Interface
4. Data Collection for QuHalEx Device Validation
4.1. Benchtop Calibration
4.2. Human QuHalEx Testing
5. Data Processing and Analysis for Device Validation
5.1. Benchtop
5.2. Humans
6. Results
6.1. Benchtop Validation
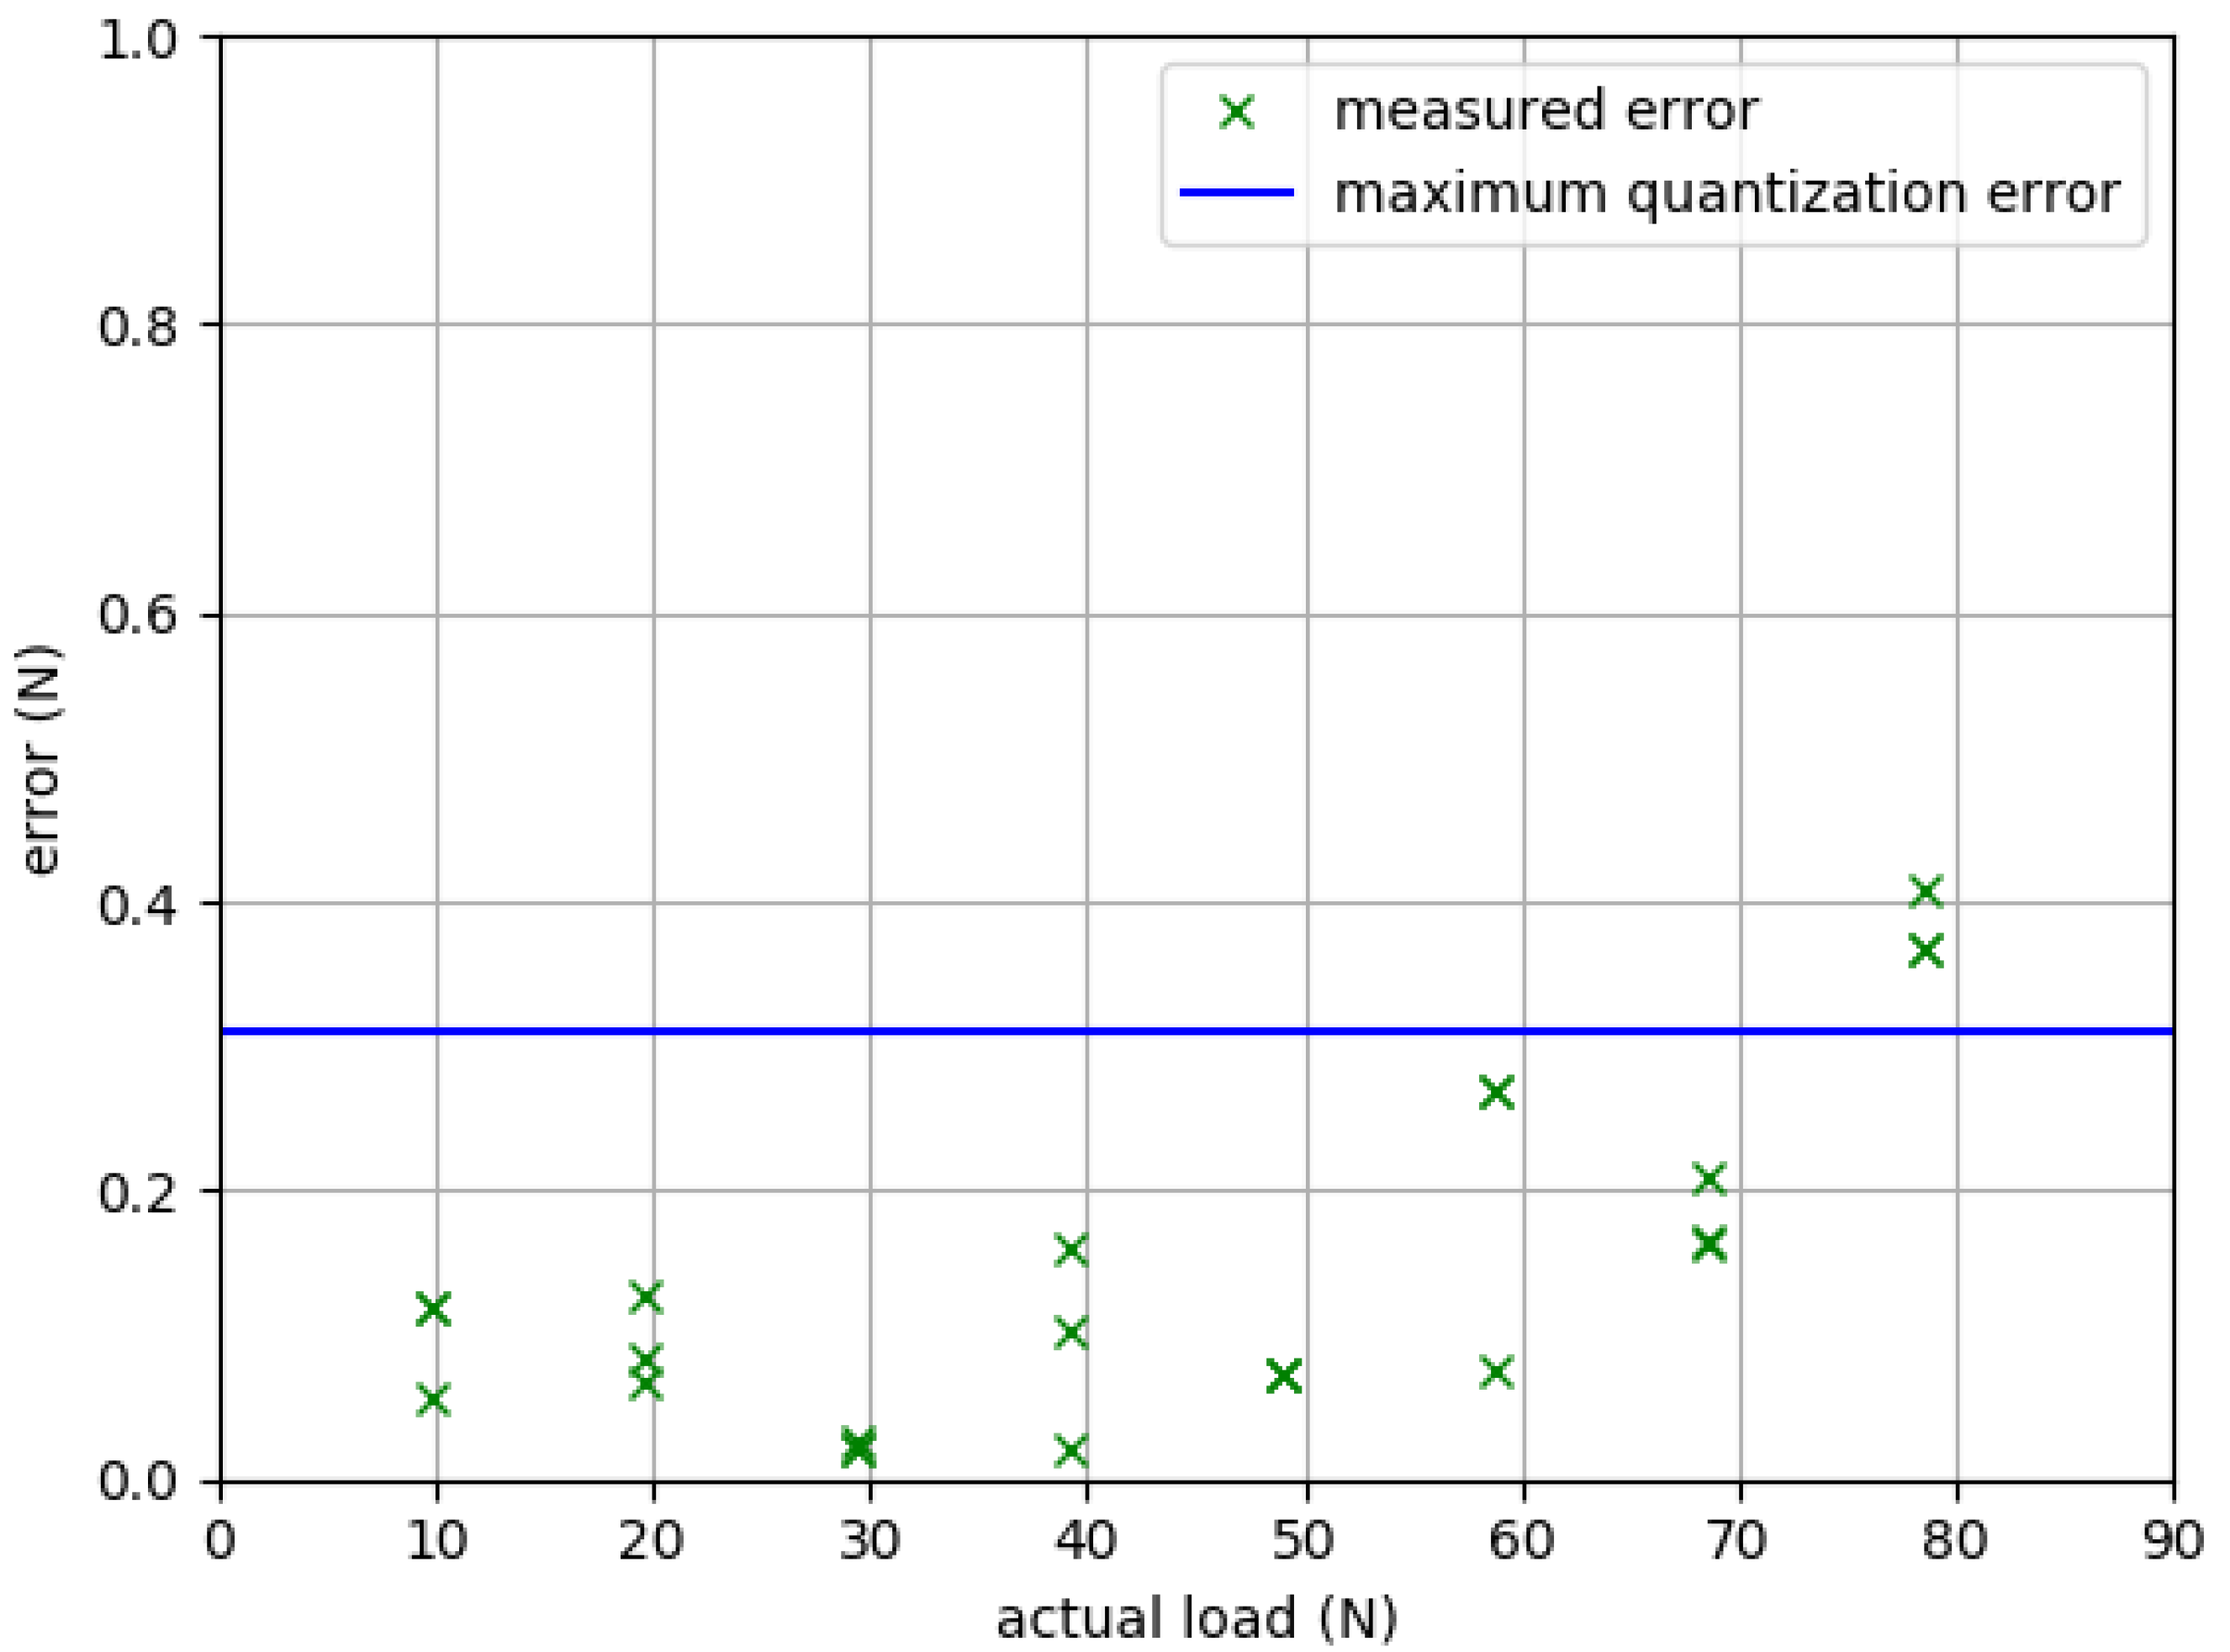
6.1.1. Accuracy
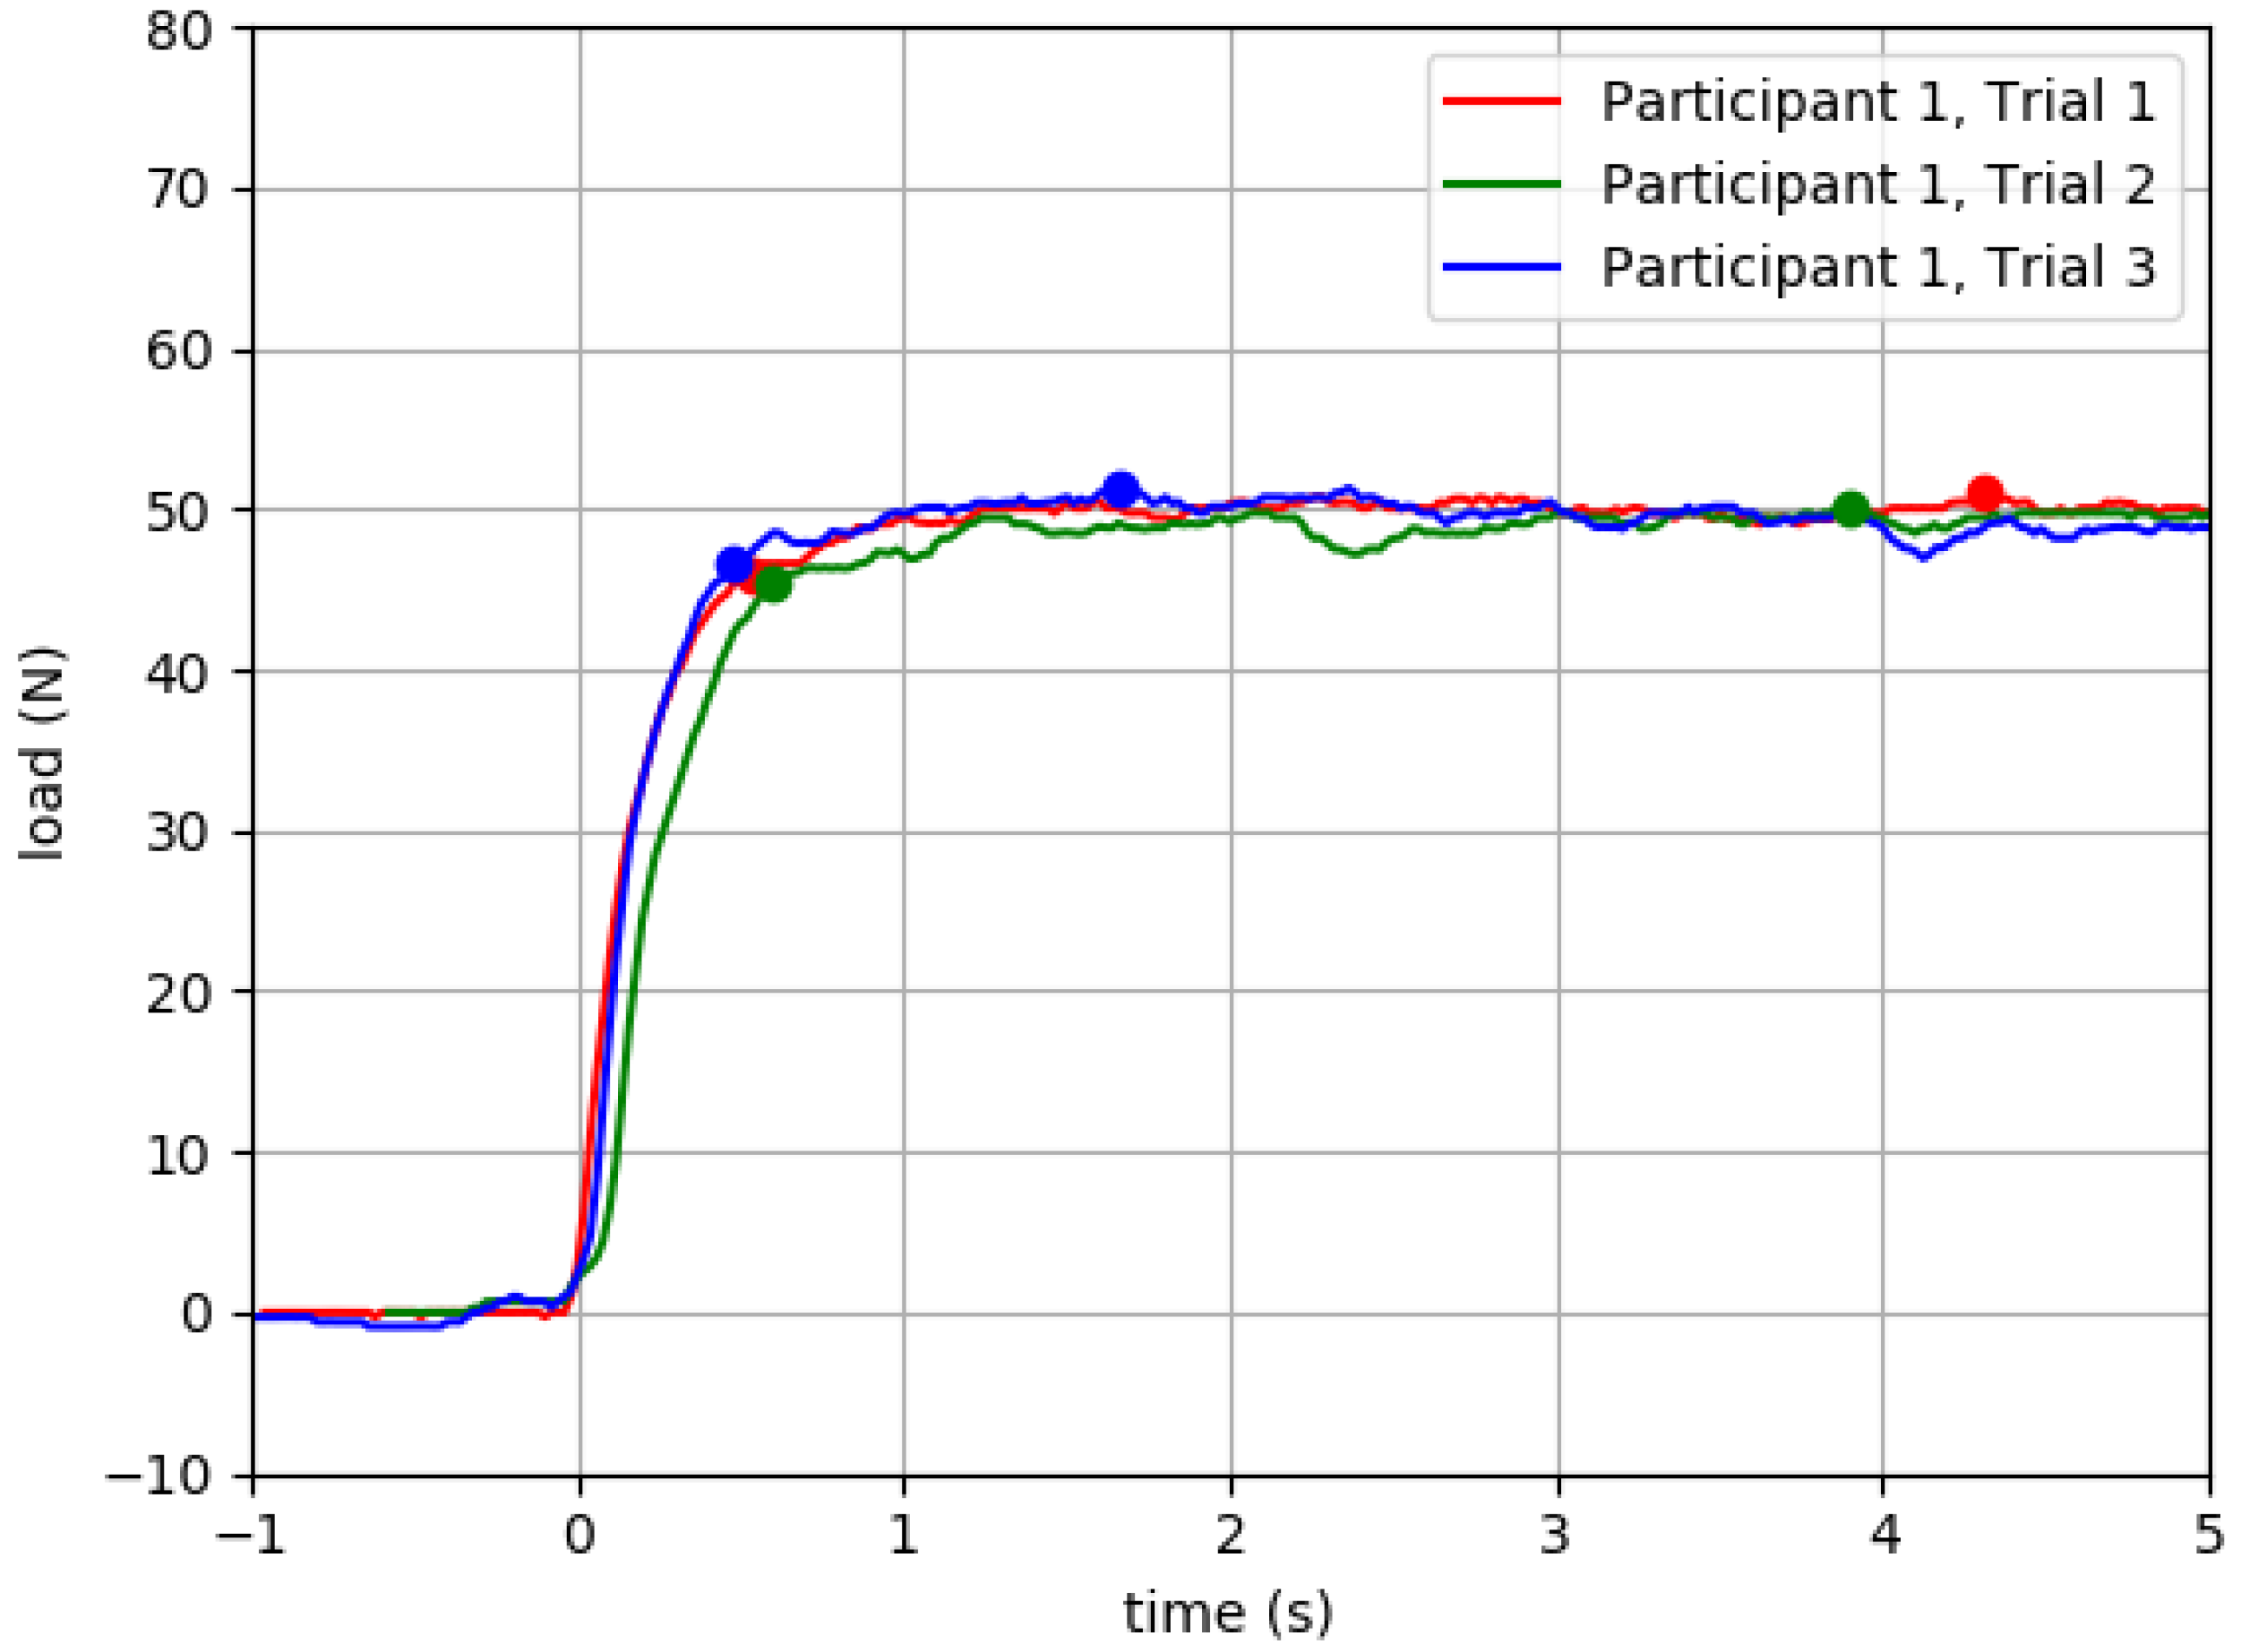
6.1.2. Intrasession Test–Retest Reliability
6.2. Human Validation
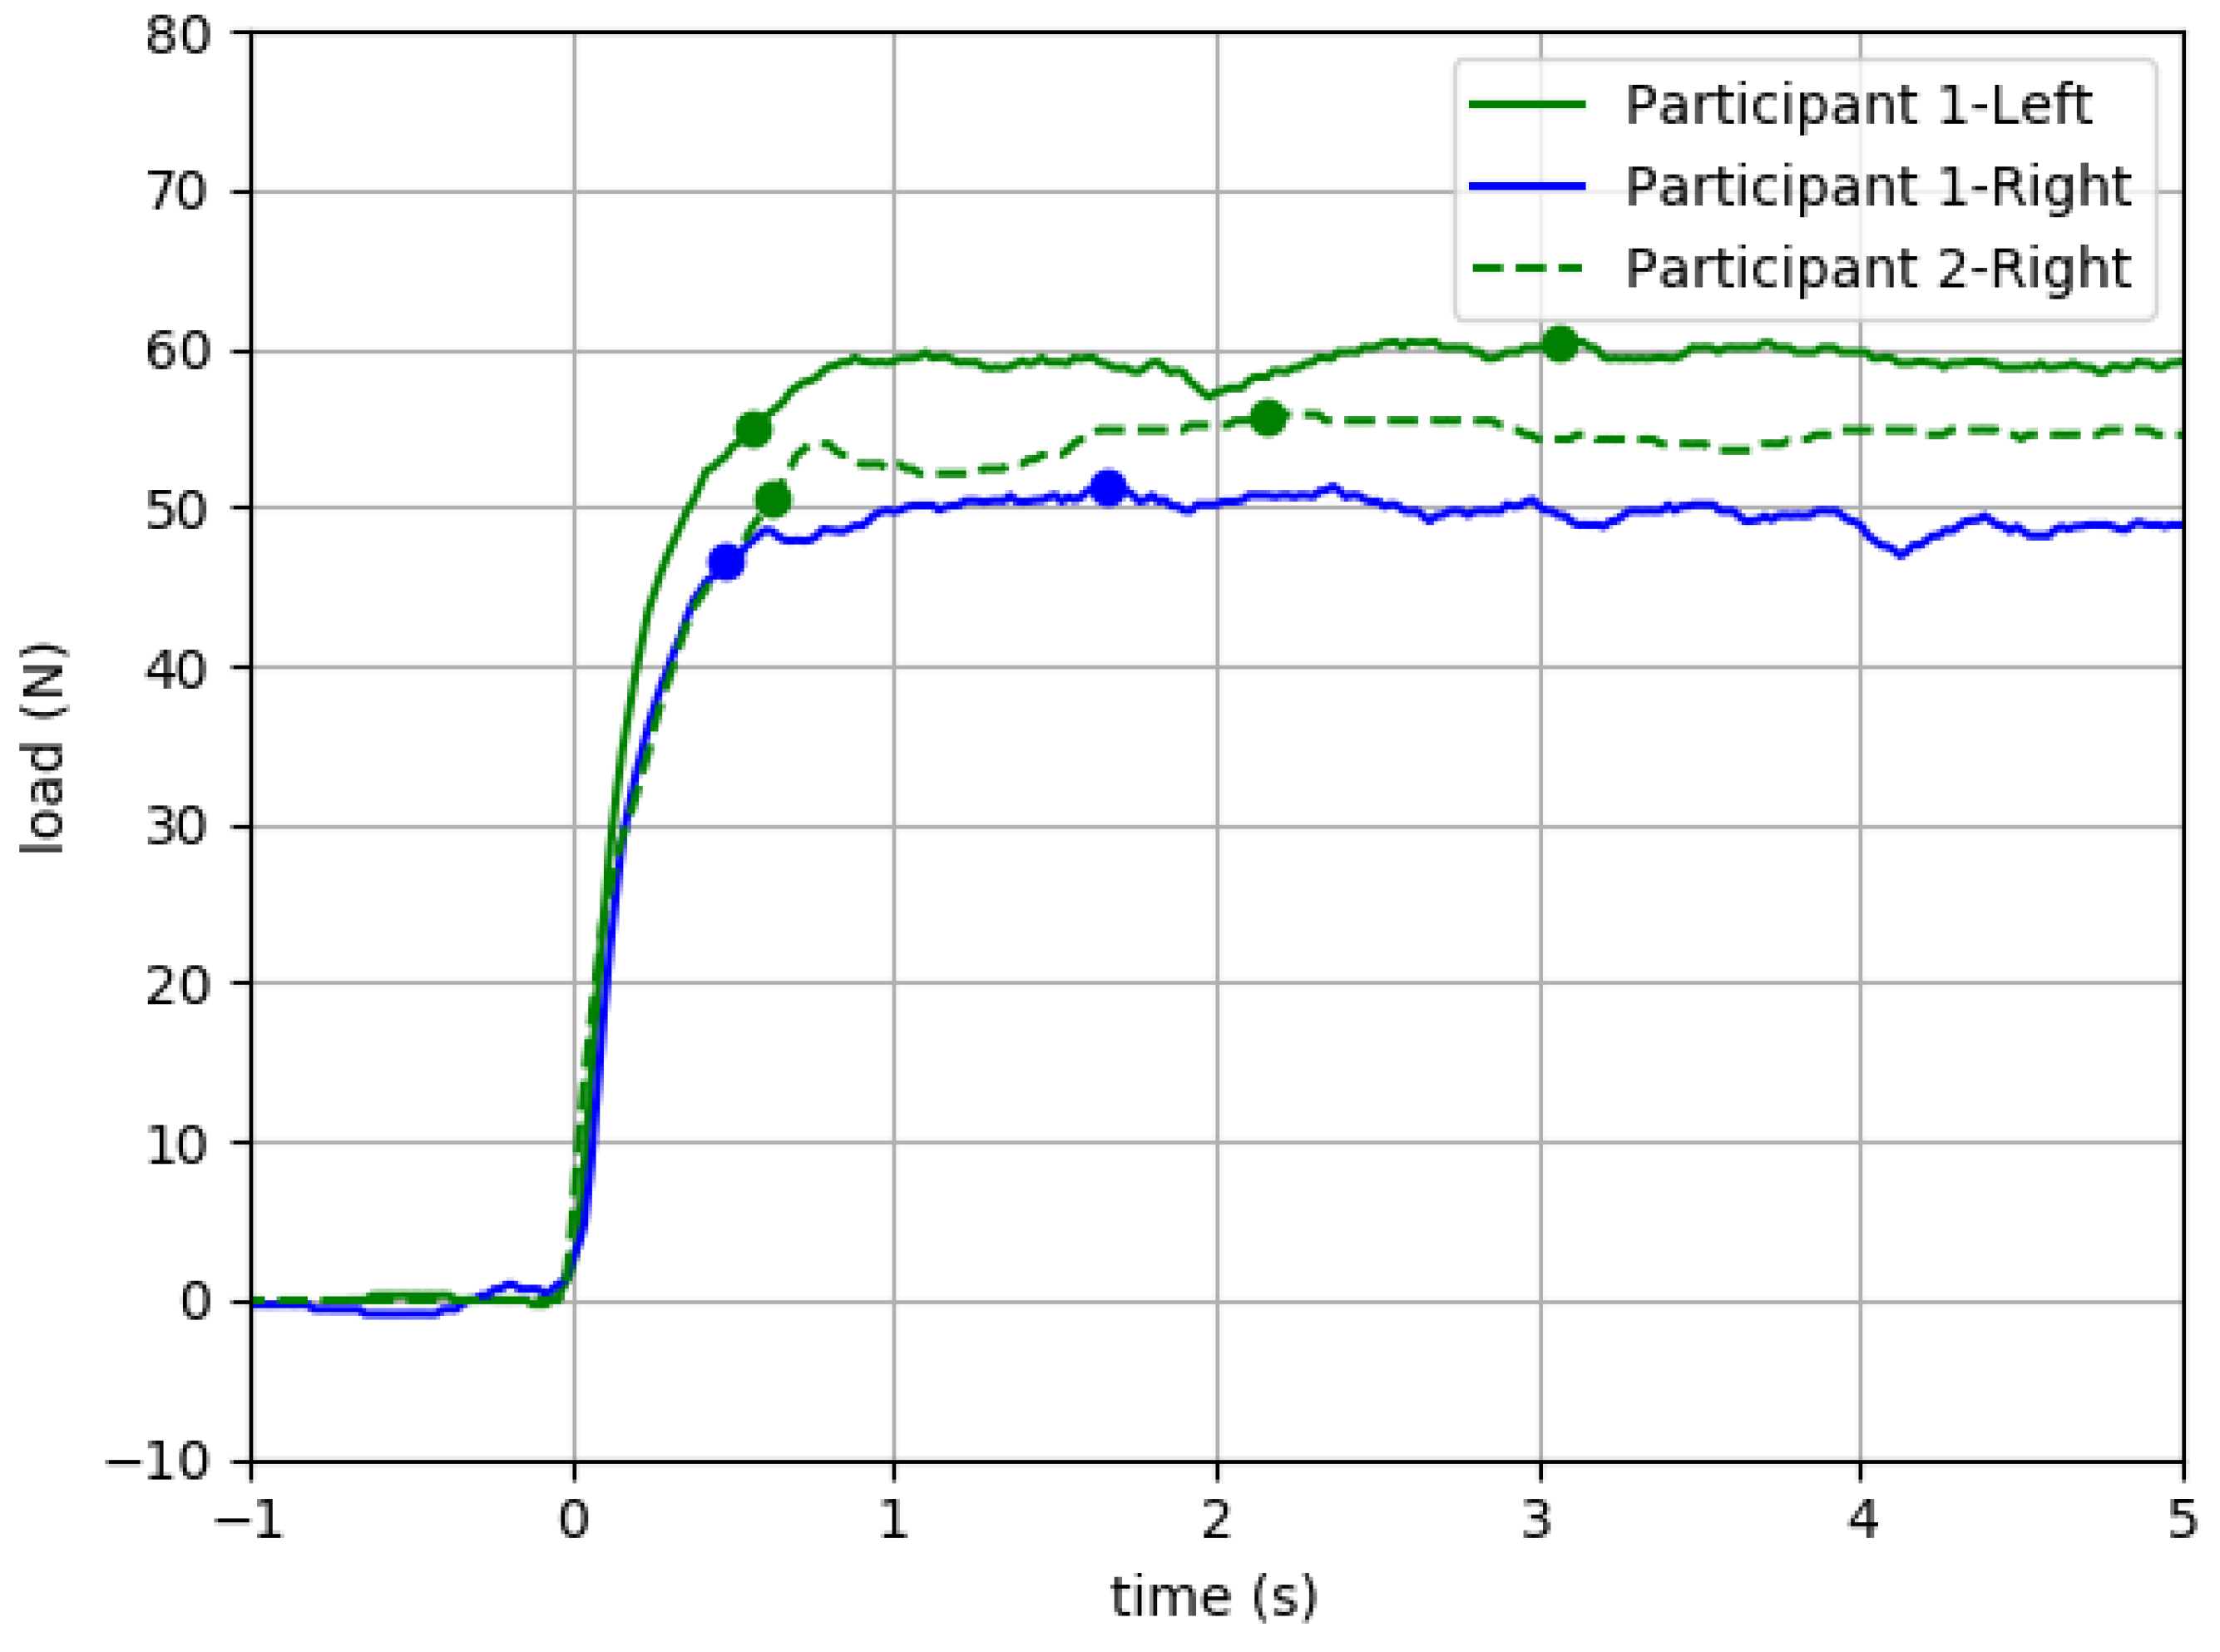
6.2.1. Intrasession Reliability and Construct Validity
6.2.2. Potential to Mitigate Ceiling Effects of Manual Muscle Testing
7. Discussion
7.1. Initial Validation
7.2. Limitations
7.3. Future Directions
8. Conclusions
9. Patents
Author Contributions
Funding
Institutional Review Board Statement
Informed Consent Statement
Data Availability Statement
Acknowledgments
Conflicts of Interest
References
- Yamauchi, J.; Koyama, K. Importance of toe flexor strength in vertical jump performance. J. Biomech. 2020, 104, 109719. [Google Scholar] [CrossRef] [PubMed]
- Endo, M.; Ashton-Miller, J.A.; Alexander, N.B. Effects of age and gender on toe flexor muscle strength. J. Gerontol. A Biol. Sci. Med. Sci. 2002, 57, M392–M397. [Google Scholar] [CrossRef] [PubMed]
- Chou, S.W.; Cheng, H.Y.; Chen, J.H.; Ju, Y.Y.; Lin, Y.C.; Wong, M.K. The role of the great toe in balance performance. J. Orthop. Res. 2009, 27, 549–554. [Google Scholar] [CrossRef] [PubMed]
- Tanaka, T.; Hashimoto, N.; Nakata, M.; Ito, T.; Ino, S.; Ifukube, T. Analysis of toe pressures under the foot while dynamic standing on one foot in healthy subjects. J. Orthop. Sports Phys. Ther. 1996, 23, 188–193. [Google Scholar] [CrossRef]
- Menz, H.B.; Morris, M.E.; Lord, S.R. Foot and ankle characteristics associated with impaired balance and functional ability in older people. J. Gerontol. A Biol. Sci. Med. Sci. 2005, 60, 1546–1552. [Google Scholar] [CrossRef]
- Menz, H.B.; Morris, M.E.; Lord, S.R. Foot and ankle risk factors for falls in older people: A prospective study. J. Gerontol. A Biol. Sci. Med. Sci. 2006, 61, 866–870. [Google Scholar] [CrossRef]
- Mickle, K.J.; Munro, B.J.; Lord, S.R.; Menz, H.B.; Steele, J.R. ISB Clinical Biomechanics Award 2009: Toe weakness and deformity increase the risk of falls in older people. Clin. Biomech. 2009, 24, 787–791. [Google Scholar] [CrossRef]
- Goldmann, J.P.; Sanno, M.; Willwacher, S.; Heinrich, K.; Bruggemann, G.P. The potential of toe flexor muscles to enhance performance. J. Sports Sci. 2013, 31, 424–433. [Google Scholar] [CrossRef]
- Soysa, A.; Hiller, C.; Refshauge, K.; Burns, J. Importance and challenges of measuring intrinsic foot muscle strength. J. Foot Ankle Res. 2012, 5, 29. [Google Scholar] [CrossRef]
- Chatzistergos, P.E.; Healy, A.; Balasubramanian, G.; Sundar, L.; Ramachandran, A.; Chockalingam, N. Reliability and validity of an enhanced paper grip test; A simple clinical test for assessing lower limb strength. Gait Posture 2020, 81, 120–125. [Google Scholar] [CrossRef]
- Menz, H.B.; Zammit, G.V.; Munteanu, S.E.; Scott, G. Plantarflexion strength of the toes: Age and gender differences and evaluation of a clinical screening test. Foot Ankle Int. 2006, 27, 1103–1108. [Google Scholar] [CrossRef] [PubMed]
- Kwon, O.Y.; Tuttle, L.J.; Johnson, J.E.; Mueller, M.J. Muscle imbalance and reduced ankle joint motion in people with hammer toe deformity. Clin. Biomech. 2009, 24, 670–675. [Google Scholar] [CrossRef] [PubMed]
- Bruening, D.A.; Ridge, S.T.; Jacobs, J.L.; Olsen, M.T.; Griffin, D.W.; Ferguson, D.H.; Bassett, K.E.; Johnson, A.W. Functional assessments of foot strength: A comparative and repeatability study. BMC Musculoskelet. Disord. 2019, 20, 608. [Google Scholar] [CrossRef] [PubMed]
- Unger, C.L.; Wooden, M.J. Effect of Foot Intrinsic Muscle Strength Training on Jump Performance. J. Strength Cond. Res. 2000, 14, 373–378. [Google Scholar]
- Xiao, S.; Zhang, X.; Deng, L.; Zhang, S.; Cui, K.; Fu, W. Relationships between Foot Morphology and Foot Muscle Strength in Healthy Adults. Int. J. Environ. Res. Public Health 2020, 17, 1274. [Google Scholar] [CrossRef] [PubMed]
- Uritani, D.; Fukumoto, T.; Matsumoto, D. Intrarater and Interrater Reliabilities for a Toe Grip Dynamometer. J. Phys. Ther. Sci. 2012, 24, 639–643. [Google Scholar] [CrossRef]
- de Win, M.M.; Theuvenet, W.J.; Roche, P.W.; de Bie, R.A.; van Mameren, H. The paper grip test for screening on intrinsic muscle paralysis in the foot of leprosy patients. Int. J. Lepr. Other Mycobact. Dis. 2002, 70, 16–24. [Google Scholar]
- Mahieu, R.; Coenen, M.N.; van Bemmel, T.; van der Zaag-Loonen, H.J.; Theuvenet, W.J. Detecting intrinsic muscle weakness of the hallux as an addition to early-stage screening of the feet in patients with diabetes. Diabetes Res. Clin. Pract. 2016, 119, 83–87. [Google Scholar] [CrossRef]
- Healy, A.; Naemi, R.; Sundar, L.; Chatzistergos, P.; Ramachandran, A.; Chockalingam, N. Hallux plantar flexor strength in people with diabetic neuropathy: Validation of a simple clinical test. Diabetes Res. Clin. Pract. 2018, 144, 1–9. [Google Scholar] [CrossRef]
- Henderson, A.D.; Johnson, A.W.; Rasmussen, L.G.; Peine, W.P.; Symons, S.H.; Scoresby, K.A.; Ridge, S.T.; Bruening, D.A. Early-Stage Diabetic Neuropathy Reduces Foot Strength and Intrinsic but Not Extrinsic Foot Muscle Size. J. Diabetes Res. 2020, 2020, 9536362. [Google Scholar] [CrossRef]
- Drouin, J.M.; Valovich-mcLeod, T.C.; Shultz, S.J.; Gansneder, B.M.; Perrin, D.H. Reliability and validity of the Biodex system 3 pro isokinetic dynamometer velocity, torque and position measurements. Eur. J. Appl. Physiol. 2004, 91, 22–29. [Google Scholar] [CrossRef] [PubMed]
- MacAvoy, M.C.; Green, D.P. Critical reappraisal of Medical Research Council muscle testing for elbow flexion. J. Hand Surg. Am. 2007, 32, 149–153. [Google Scholar] [CrossRef] [PubMed]
- Baschung Pfister, P.; de Bruin, E.D.; Sterkele, I.; Maurer, B.; de Bie, R.A.; Knols, R.H. Manual muscle testing and hand-held dynamometry in people with inflammatory myopathy: An intra- and interrater reliability and validity study. PLoS ONE 2018, 13, e0194531. [Google Scholar] [CrossRef] [PubMed]
- Bohannon, R.W. Make tests and break tests of elbow flexor muscle strength. Phys. Ther. 1988, 68, 193–194. [Google Scholar] [CrossRef] [PubMed]
- O’Brien, M.; on behalf of the Guarantors of Brain (Eds.) Aids to the Examination of the Peripheral Nervous System, 6th ed.; Elsevier Ltd.: Chennai, India, 2023. [Google Scholar]
- Aitkens, S.; Lord, J.; Bernauer, E.; Fowler, W.M., Jr.; Lieberman, J.S.; Berck, P. Relationship of manual muscle testing to objective strength measurements. Muscle Nerve 1989, 12, 173–177. [Google Scholar] [CrossRef]
- Medical Research Council. Aids to the Examination of the Peripheral Nervous System; Medical Research Council Memorandum No. 45; Nerve Injuries Research Committee Her Majesty’s Stationery Office: London, UK, 1976. [Google Scholar]
- Bohannon, R.W. Manual muscle testing: Does it meet the standards of an adequate screening test? Clin. Rehabil. 2005, 19, 662–667. [Google Scholar] [CrossRef]
- Conroy, V.M.; Murray, B.; Alexopulos, Q.; McCreary, J. Kendall’s Muscles: Testing and Function, with Posture and Pain, 6th ed.; Wolters Kluwer: Mexico City, Mexico, 2023; p. 528. [Google Scholar]
- Hayes, K.W.; Falconer, J. Reliability of hand-held dynamometry and its relationship with manual muscle testing in patients with osteoarthritis in the knee. J. Orthop. Sports Phys. Ther. 1992, 16, 145–149. [Google Scholar] [CrossRef] [PubMed]
- Mentiplay, B.F.; Perraton, L.G.; Bower, K.J.; Adair, B.; Pua, Y.H.; Williams, G.P.; McGaw, R.; Clark, R.A. Assessment of Lower Limb Muscle Strength and Power Using Hand-Held and Fixed Dynamometry: A Reliability and Validity Study. PLoS ONE 2015, 10, e0140822. [Google Scholar] [CrossRef]
- Jackson, S.M.; Cheng, M.S.; Smith, A.R., Jr.; Kolber, M.J. Intrarater reliability of hand held dynamometry in measuring lower extremity isometric strength using a portable stabilization device. Musculoskelet. Sci. Pract. 2017, 27, 137–141. [Google Scholar] [CrossRef]
- Gonzalez-Rosalen, J.; Benitez-Martinez, J.C.; Medina-Mirapeix, F.; Cuerda-Del Pino, A.; Cervello, A.; Martin-San Agustin, R. Intra- and Inter-Rater Reliability of Strength Measurements Using a Pull Hand-Held Dynamometer Fixed to the Examiner’s Body and Comparison with Push Dynamometry. Diagnostics 2021, 11, 1230. [Google Scholar] [CrossRef]
- Velan, G.J.; Hendel, D. Degenerative tear of the tibialis anterior tendon after corticosteroid injection—Augmentation with the extensor hallucis longus tendon, case report. Acta Orthop. Scand. 1997, 68, 308–309. [Google Scholar] [CrossRef] [PubMed]
- Dhand, U.K. Motor Unit Potential. In Encyclopedia of the Neurological Sciences, 2nd ed.; Aminoff, M.J., Daroff, R.B., Eds.; Elsevier Ltd.: Amsterdam, The Netherlands, 2014; Volume 3, pp. 117–119. [Google Scholar]
- Graves, J.E.; James, R.J. Concurrent augmented feedback and isometric force generation during familiar and unfamiliar muscle movements. Res. Q. Exerc. Sport 1990, 61, 75–79. [Google Scholar] [CrossRef] [PubMed]
- Jung, M.-C.; Hallbeck, M.S. Quantification of the effects of instruction type, verbal encouragement, and visual feedback on static and peak handgrip strength. Int. J. Ind. Ergon. 2004, 34, 367–374. [Google Scholar] [CrossRef]
- Kimura, I.F.; Gulick, D.; Lukasiewicz, W.C., III. Effect of visual feedback and verbal encouragement on eccentric quadriceps and hamstrings peak torque. Sport. Med. Train. Rehabil. 1999, 9, 61–70. [Google Scholar] [CrossRef]
- Nuzzo, J.L.; Taylor, J.L.; Gandevia, S.C. CORP: Measurement of upper and lower limb muscle strength and voluntary activation. J. Appl. Physiol. 1985 2019, 126, 513–543. [Google Scholar] [CrossRef] [PubMed]
- Stratford, P.W.; Balsor, B.E. A comparison of make and break tests using a hand-held dynamometer and the Kin-Com. J. Orthop. Sports Phys. Ther. 1994, 19, 28–32. [Google Scholar] [CrossRef]
- Seddon, H.J. Methods of investigating nerve injuries. Spec. Rep. Ser. Med. Res. Counc. G B 1954, 282, 1–15. [Google Scholar]
- Graven-Nielsen, T.; Lund, H.; Arendt-Nielsen, L.; Danneskiold-Samsoe, B.; Bliddal, H. Inhibition of maximal voluntary contraction force by experimental muscle pain: A centrally mediated mechanism. Muscle Nerve 2002, 26, 708–712. [Google Scholar] [CrossRef]
- Yamauchi, J.; Koyama, K. Relation between the ankle joint angle and the maximum isometric force of the toe flexor muscles. J. Biomech. 2019, 85, 1–5. [Google Scholar] [CrossRef]
- Ferris, L.; Sharkey, N.A.; Smith, T.S.; Matthews, D.K. Influence of extrinsic plantar flexors on forefoot loading during heel rise. Foot Ankle Int. 1995, 16, 464–473. [Google Scholar] [CrossRef]
- Belkhiria, C.; De Marco, G.; Driss, T. Effects of verbal encouragement on force and electromyographic activations during exercise. J. Sports Med. Phys. Fitness 2018, 58, 750–757. [Google Scholar] [CrossRef] [PubMed]
- Johansson, C.A.; Kent, B.E.; Shepard, K.F. Relationship between verbal command volume and magnitude of muscle contraction. Phys. Ther. 1983, 63, 1260–1265. [Google Scholar] [CrossRef]
- Wang, C.Y.; Olson, S.L.; Protas, E.J. Test-retest strength reliability: Hand-held dynamometry in community-dwelling elderly fallers. Arch. Phys. Med. Rehabil. 2002, 83, 811–815. [Google Scholar] [CrossRef] [PubMed]
- Bohannon, R.W. Testing isometric limb muscle strength with dynamometers. Crit. Rev. Phys. Med. Rehabil. 1990, 2, 75–86. [Google Scholar]
- Chatzistergos, P.E.; Healy, A.; Naemi, R.; Sundar, L.; Ramachandran, A.; Chockalingam, N. The relationship between hallux grip force and balance in people with diabetes. Gait Posture 2019, 70, 109–115. [Google Scholar] [CrossRef]
- Zemkova, E.; Poor, O.; Pecho, J. Peak Rate of Force Development and Isometric Maximum Strength of Back Muscles Are Associated with Power Performance during Load-Lifting Tasks. Am. J. Mens Health 2019, 13, 1557988319828622. [Google Scholar] [CrossRef]
- Christou, E.A.; Carlton, L.G. Old adults exhibit greater motor output variability than young adults only during rapid discrete isometric contractions. J. Gerontol. A Biol. Sci. Med. Sci. 2001, 56, B524–B532. [Google Scholar] [CrossRef] [PubMed]
- Bohannon, R.W. Grip Strength: An Indispensable Biomarker for Older Adults. Clin. Interv. Aging 2019, 14, 1681–1691. [Google Scholar] [CrossRef]
- Miura, S.; Seko, T.; Himuro, N.; Koyama, M.; Saitoh, S.; Ohnishi, H. Toe Grip strength declines earlier than hand grip strength and knee extension strength in community-dwelling older men: A cross sectional study. J. Foot Ankle Res. 2022, 15, 79. [Google Scholar] [CrossRef]
- Ruas, C.V.; Pinto, R.S.; Haff, G.G.; Lima, C.D.; Pinto, M.D.; Brown, L.E. Alternative Methods of Determining Hamstrings-to-Quadriceps Ratios: A Comprehensive Review. Sports Med. Open 2019, 5, 11. [Google Scholar] [CrossRef]


| Feature | Value |
|---|---|
| Dimensions L × W × H (mm) | 419 × 229 × 89 |
| Weight (kg) | 1.80 |
| Maximum Load (N) | ±100 |
| Resolution (N) | 0.31 |
| Accuracy (N) | 0.02–0.42 |
| Actual Load (N) | |Error T1| (N) | |Error T2| (N) | |Error T3| (N) |
|---|---|---|---|
| 9.81 | 0.118 | 0.118 | 0.0561 |
| 19.6 | 0.0671 | 0.127 | 0.0825 |
| 29.4 | 0.0217 | 0.0258 | 0.0206 |
| 39.2 | 0.159 | 0.103 | 0.0207 |
| 49.1 | 0.0716 | 0.0729 | 0.072 |
| 58.9 | 0.0747 | 0.268 | 0.269 |
| 68.7 | 0.208 | 0.165 | 0.162 |
| 78.5 | 0.367 | 0.407 | 0.366 |
| Variable | Unit or Category | Mean (SD) Min–Max | Frequency Count (%) |
|---|---|---|---|
| Age | Years | 33.5 (9.6) 20–54 | |
| Height | Inches | 66.0 (6.8) 32–75 | |
| Weight | Pounds | 159.1 (34.3) 94–249 | |
| Sex | Female Male | 20 (52.6) 18 (47.4) | |
| Ethnicity | Hispanic or Latinx Not Hispanic or Latinx | 3 (7.9) 35 (92.1) | |
| Race | Asian Black or African American More than One Race White Not Specified | 11 (28.9) 2 (5.3) 2 (5.3) 21 (55.3) 2 (5.3) | |
| Shoe Size | United States Unisex | 8.9 (1.9) 5.5–15 | |
| Kicking Foot * | Right Left Not Specified | 35 (92.1) 2 (5.3) 1 (2.6) |
| Hallux Test | Side | Peak Force | ||
|---|---|---|---|---|
| Mean (SD) Min–Max | Median [IQR] | ICC [95% CI] * | ||
| Extension (n = 38) | Right | 52.8 (12.6) | 52.9 | 0.907 |
| 29.6–82.0 | [19.9] | [0.848–0.947] | ||
| Left | 51.3 (12.0) | 51.7 | 0.916 | |
| 23.1–80.3 | [17.4] | [0.862–0.952] | ||
| Flexion (n = 37) | Right | 90.1 (28.9) | 89.4 | 0.905 |
| 39.0–140.6 | [46.2] | [0.842–0.946] | ||
| Left | 88.0 (30.9) | 86.8 | 0.910 | |
| 32.0–142.4 | [41.2] | [0.851–0.950] | ||
Disclaimer/Publisher’s Note: The statements, opinions and data contained in all publications are solely those of the individual author(s) and contributor(s) and not of MDPI and/or the editor(s). MDPI and/or the editor(s) disclaim responsibility for any injury to people or property resulting from any ideas, methods, instructions or products referred to in the content. |
© 2023 by the authors. Licensee MDPI, Basel, Switzerland. This article is an open access article distributed under the terms and conditions of the Creative Commons Attribution (CC BY) license (https://creativecommons.org/licenses/by/4.0/).
Share and Cite
Hile, E.S.; Ghazi, M.; Chandrashekhar, R.; Rippetoe, J.; Fox, A.; Wang, H. Development and Earliest Validation of a Portable Device for Quantification of Hallux Extension Strength (QuHalEx). Sensors 2023, 23, 4654. https://doi.org/10.3390/s23104654
Hile ES, Ghazi M, Chandrashekhar R, Rippetoe J, Fox A, Wang H. Development and Earliest Validation of a Portable Device for Quantification of Hallux Extension Strength (QuHalEx). Sensors. 2023; 23(10):4654. https://doi.org/10.3390/s23104654
Chicago/Turabian StyleHile, Elizabeth S., Mustafa Ghazi, Raghuveer Chandrashekhar, Josiah Rippetoe, Ashley Fox, and Hongwu Wang. 2023. "Development and Earliest Validation of a Portable Device for Quantification of Hallux Extension Strength (QuHalEx)" Sensors 23, no. 10: 4654. https://doi.org/10.3390/s23104654