
Surface Deformation Associated with the 22 August 1902 Mw 7.7 Atushi Earthquake in the Southwestern Tian Shan, Revealed from Multiple Remote Sensing Data

Abstract
:1. Introduction
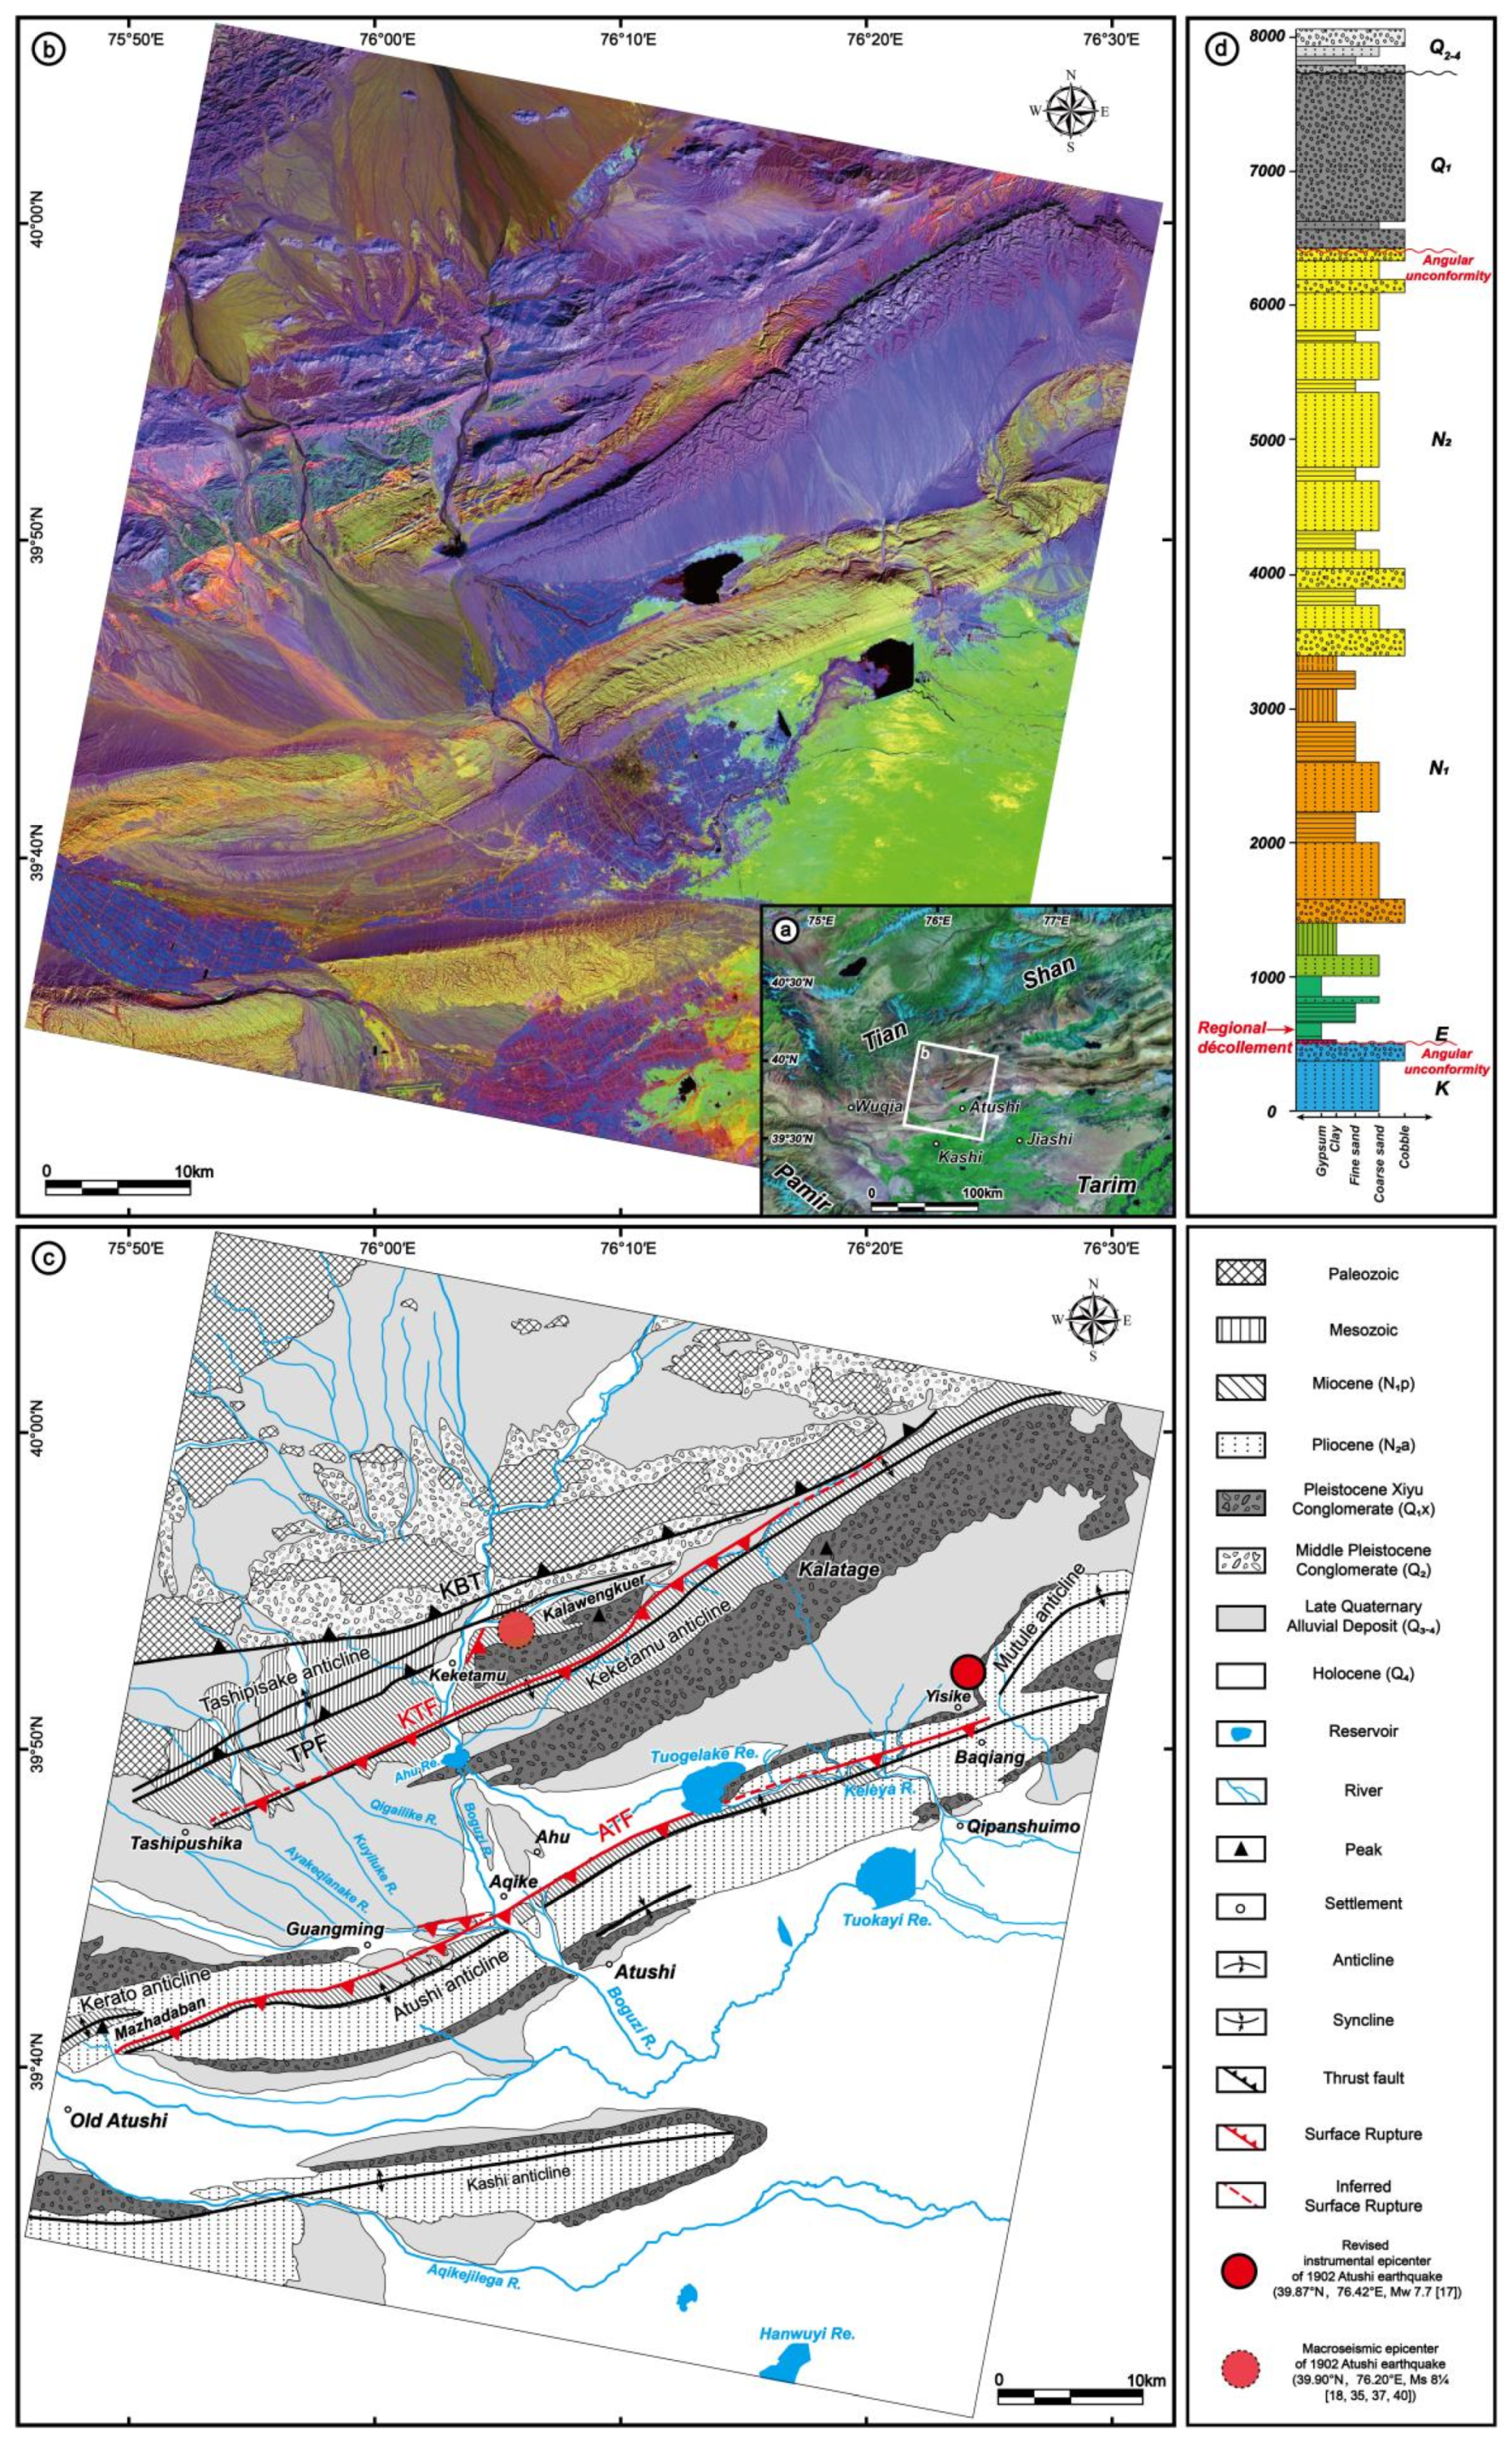
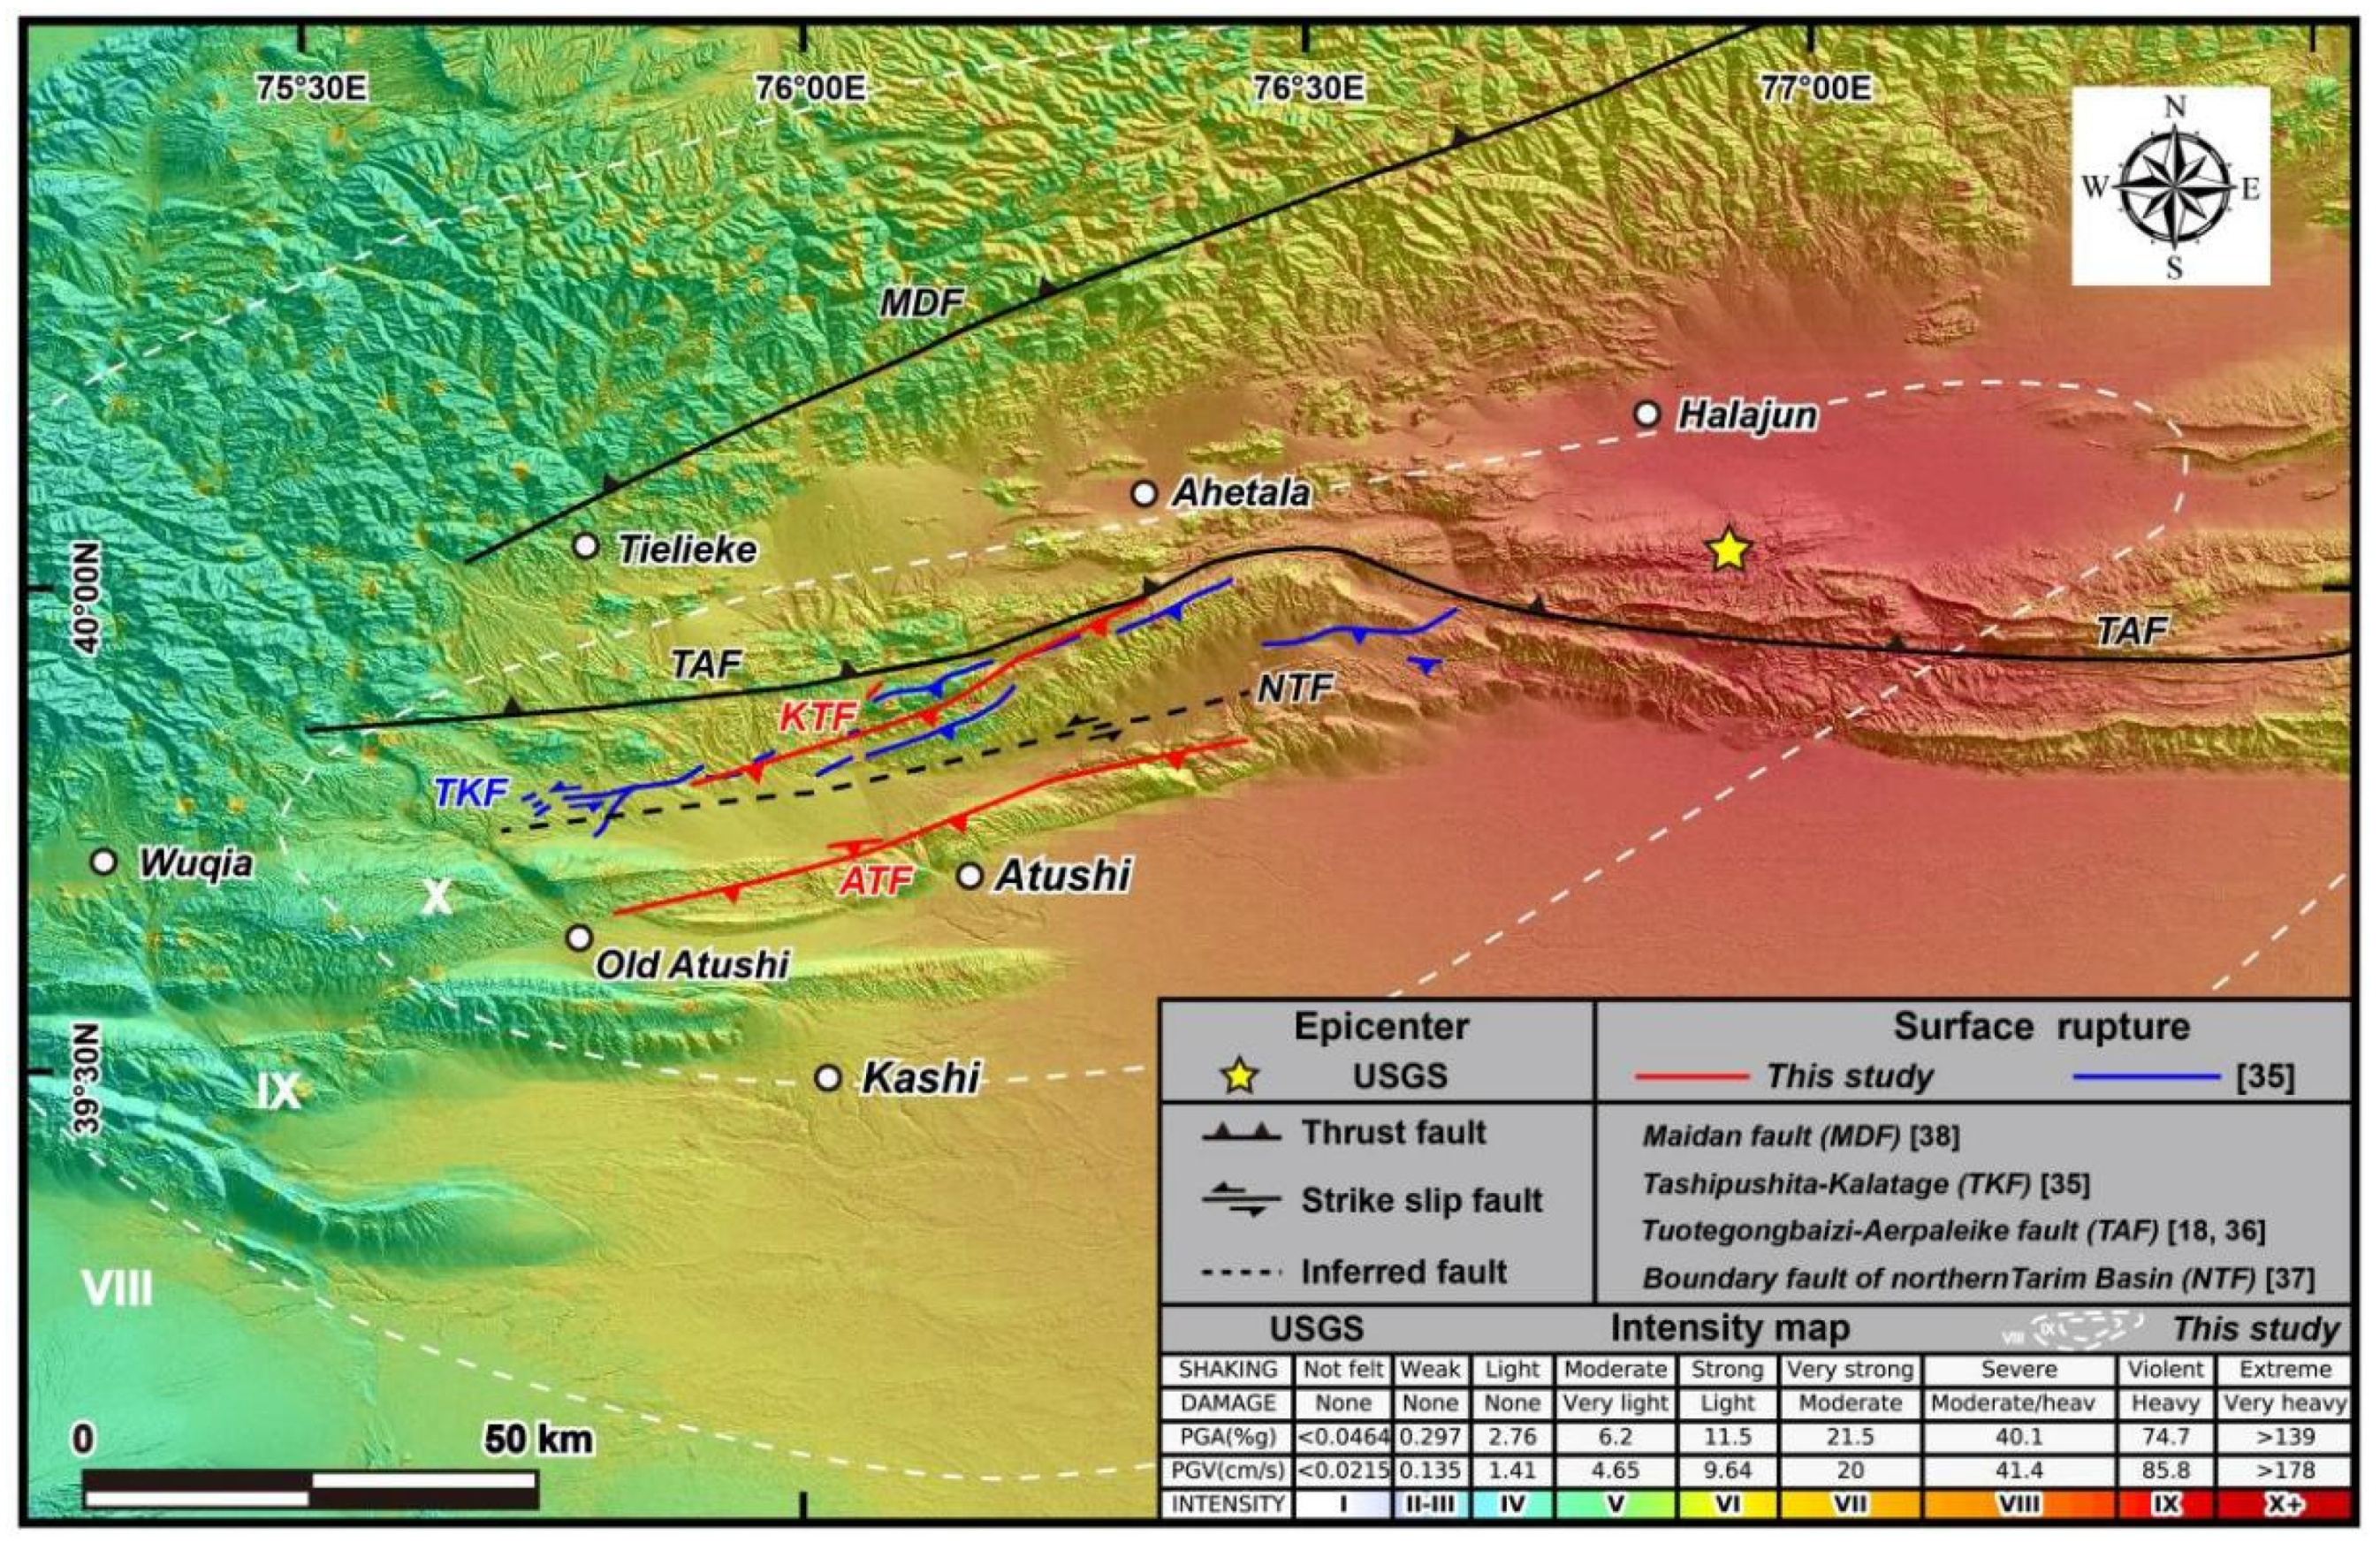
2. Tectonic Setting

3. Method and Data
3.1. Remote Sensing Data and Image Processing Methods
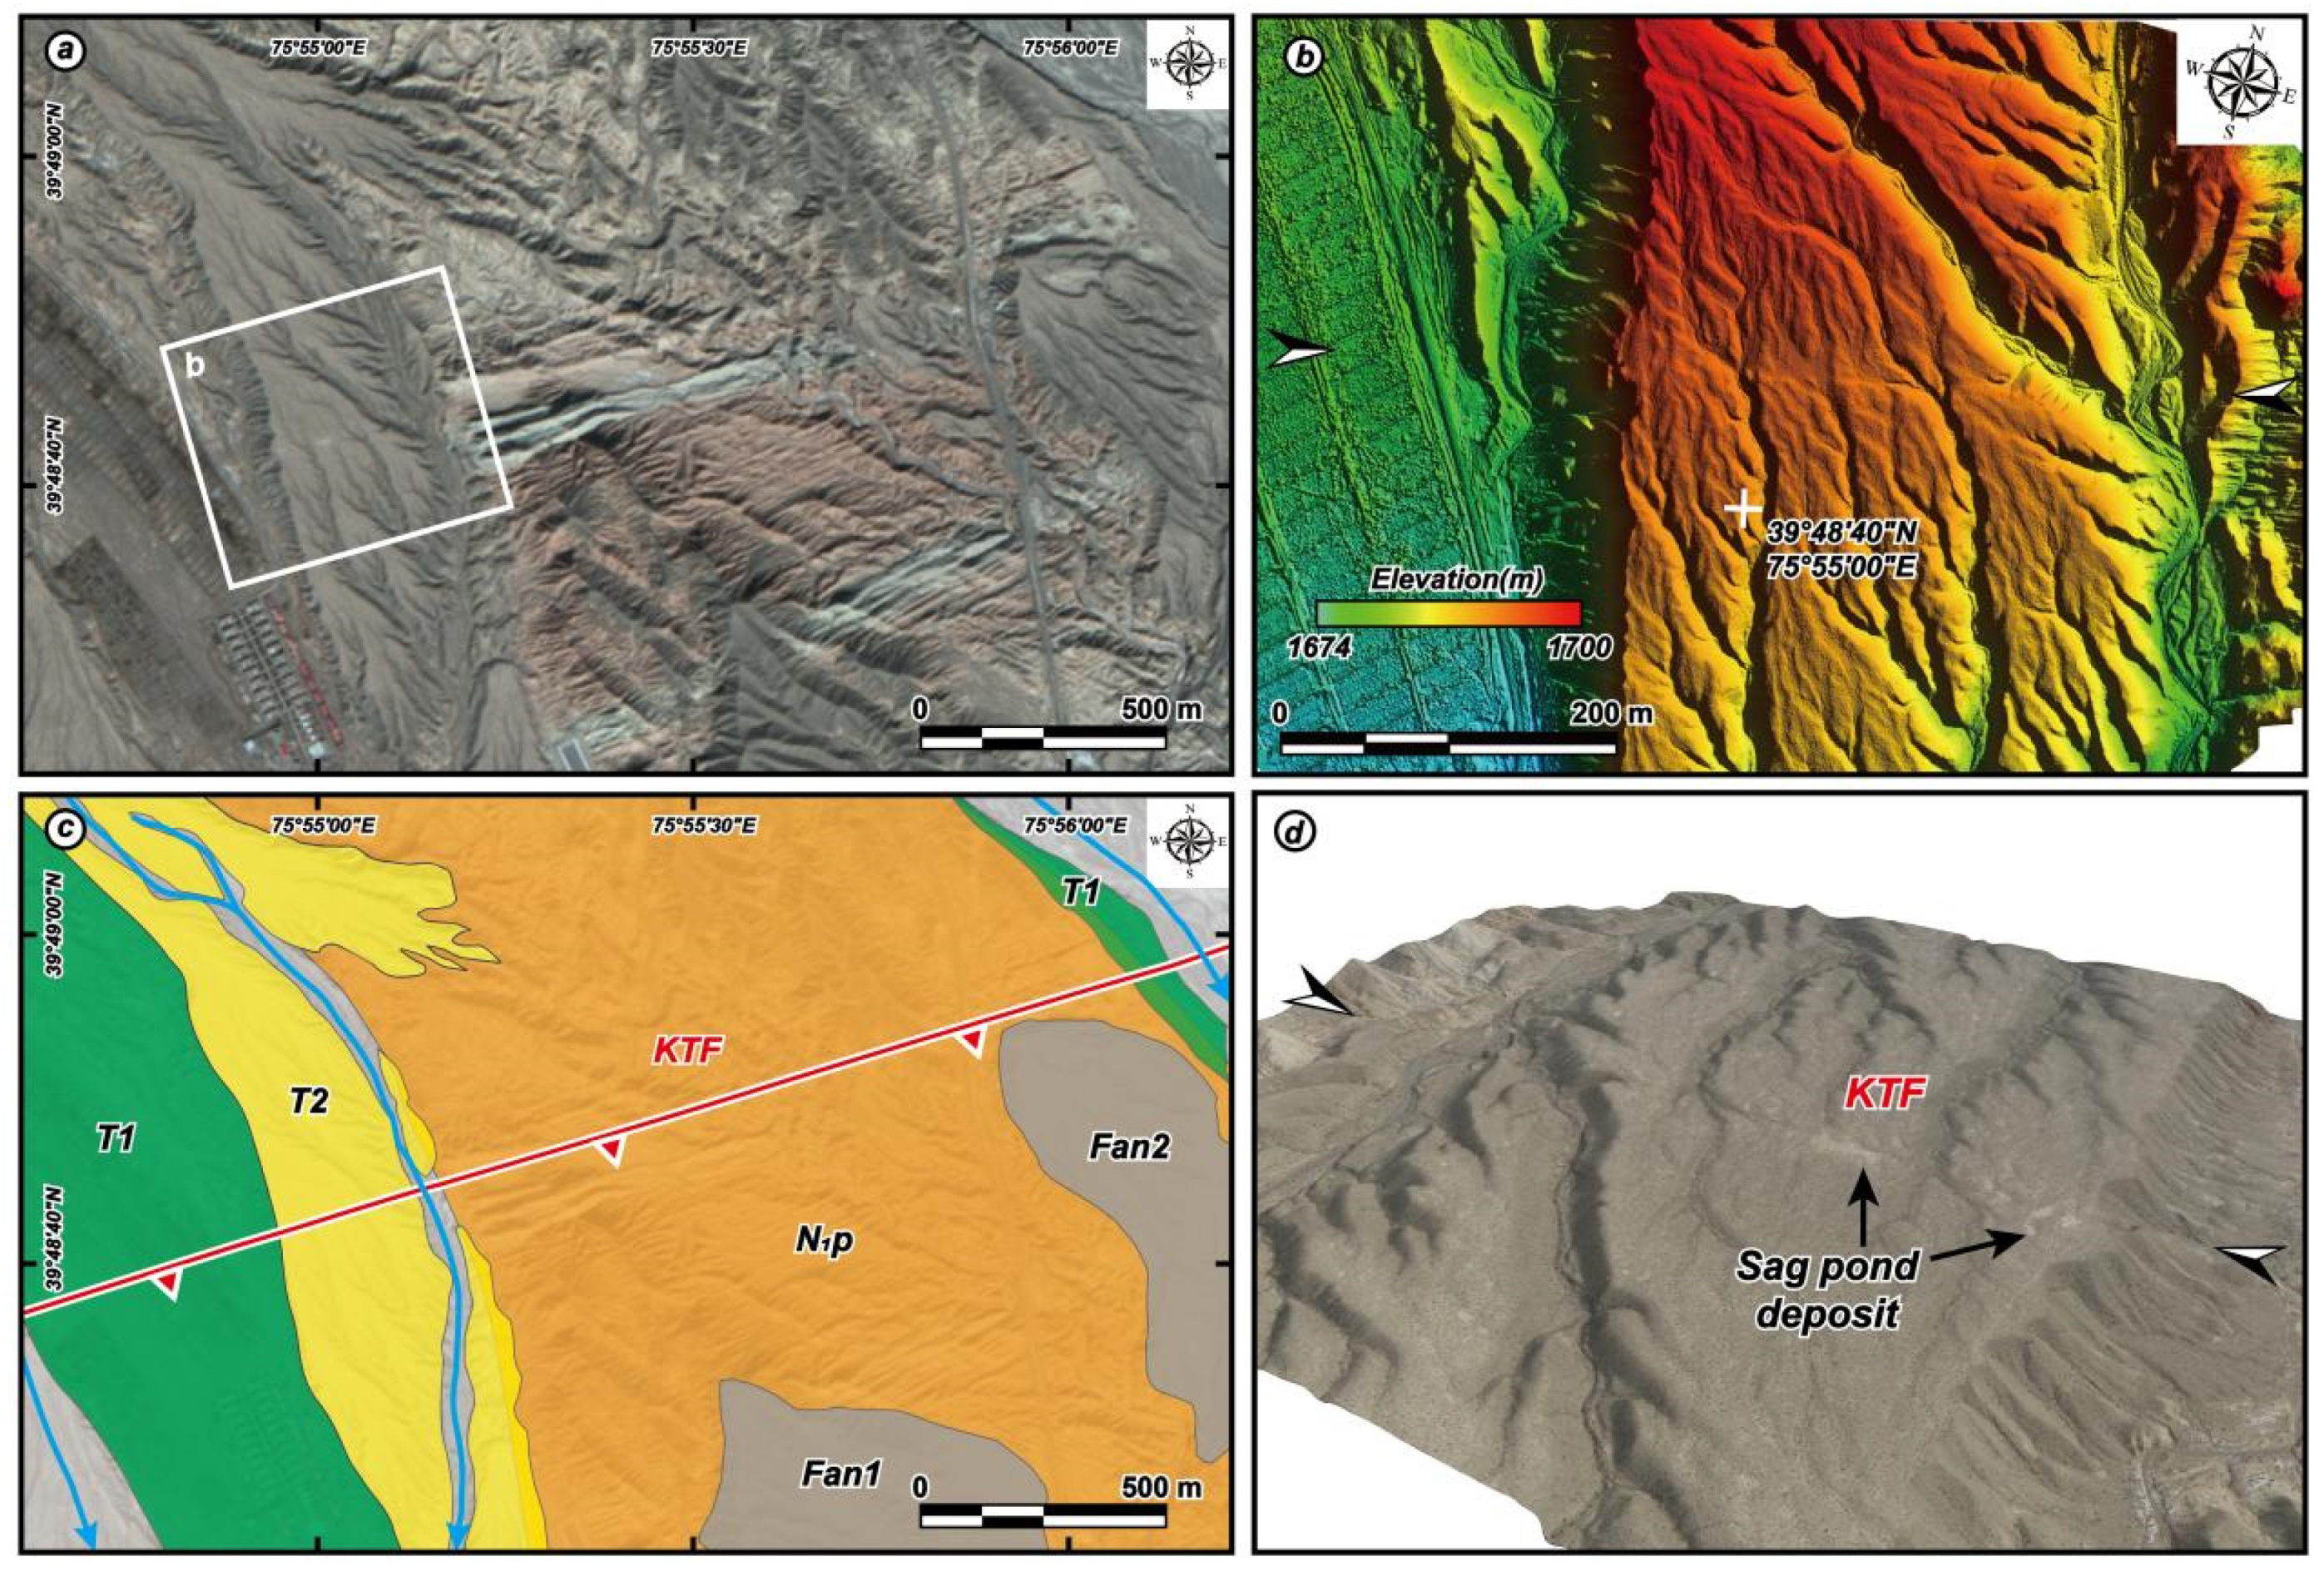
3.2. Throw Measurements by the UAV
4. Results
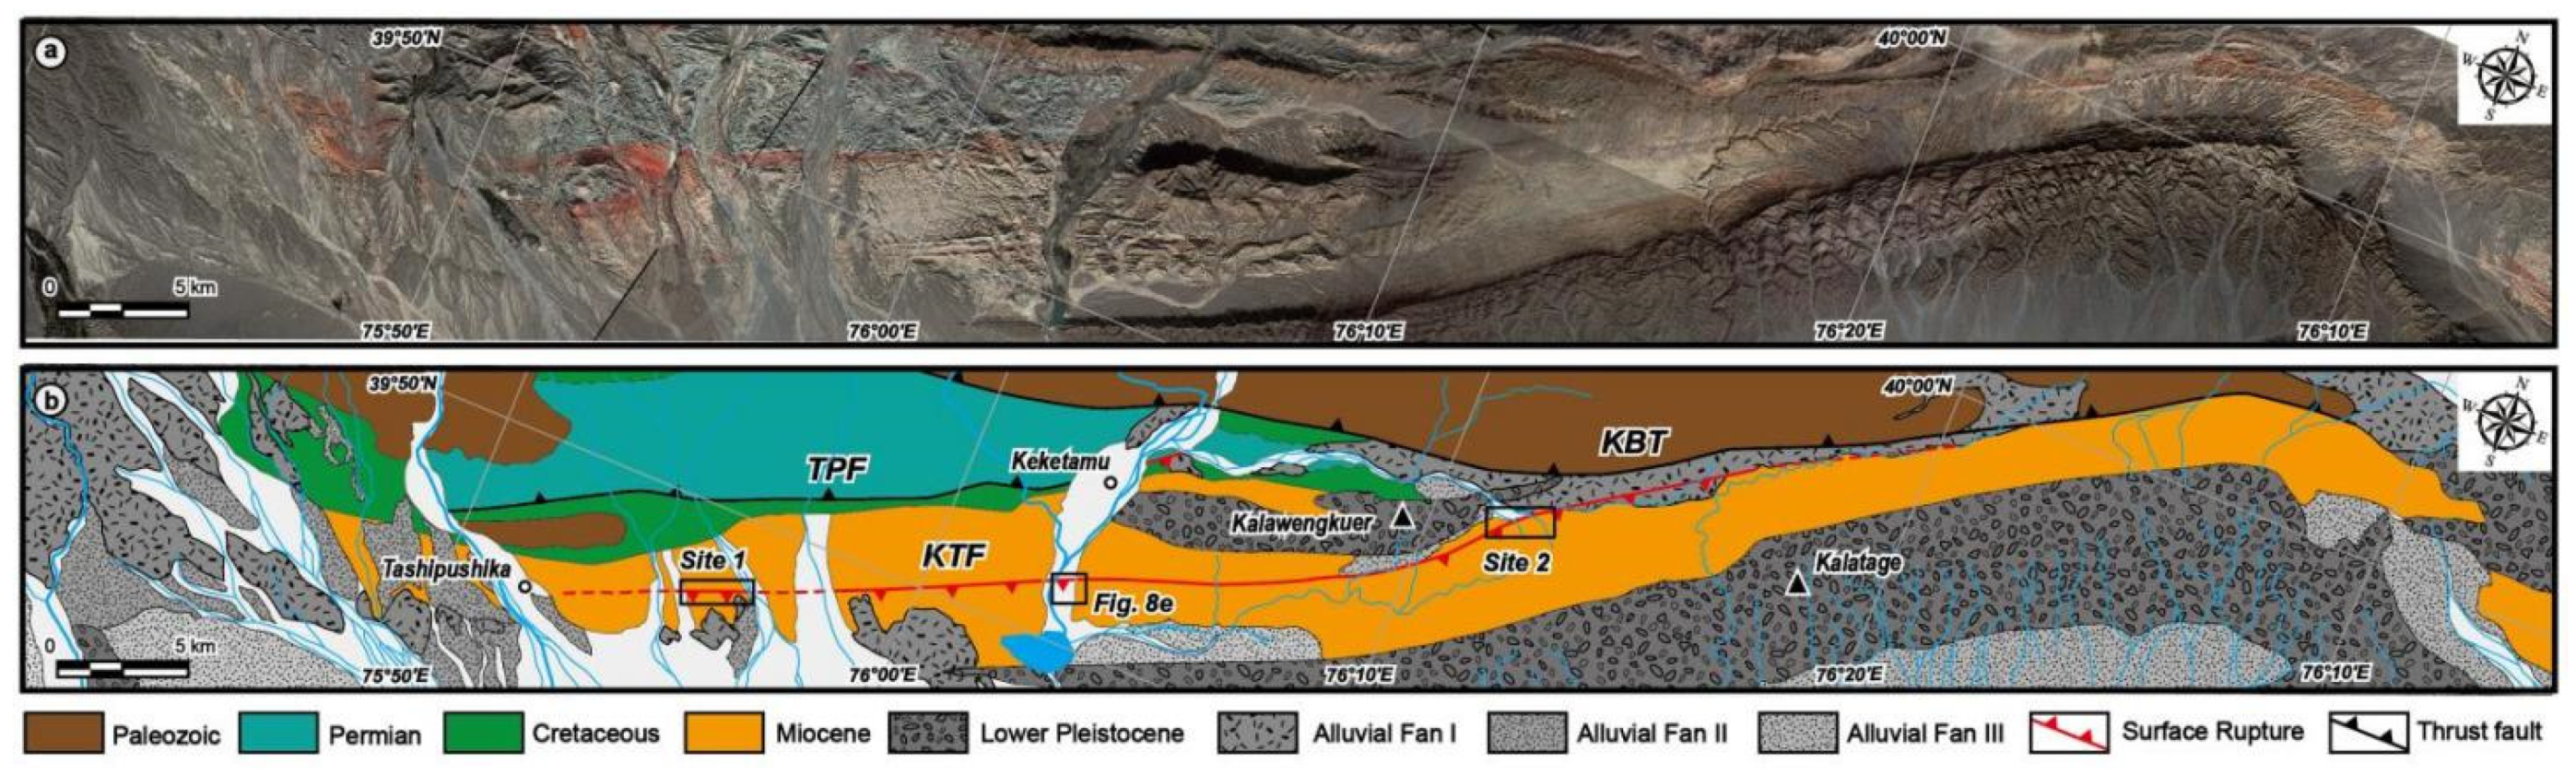
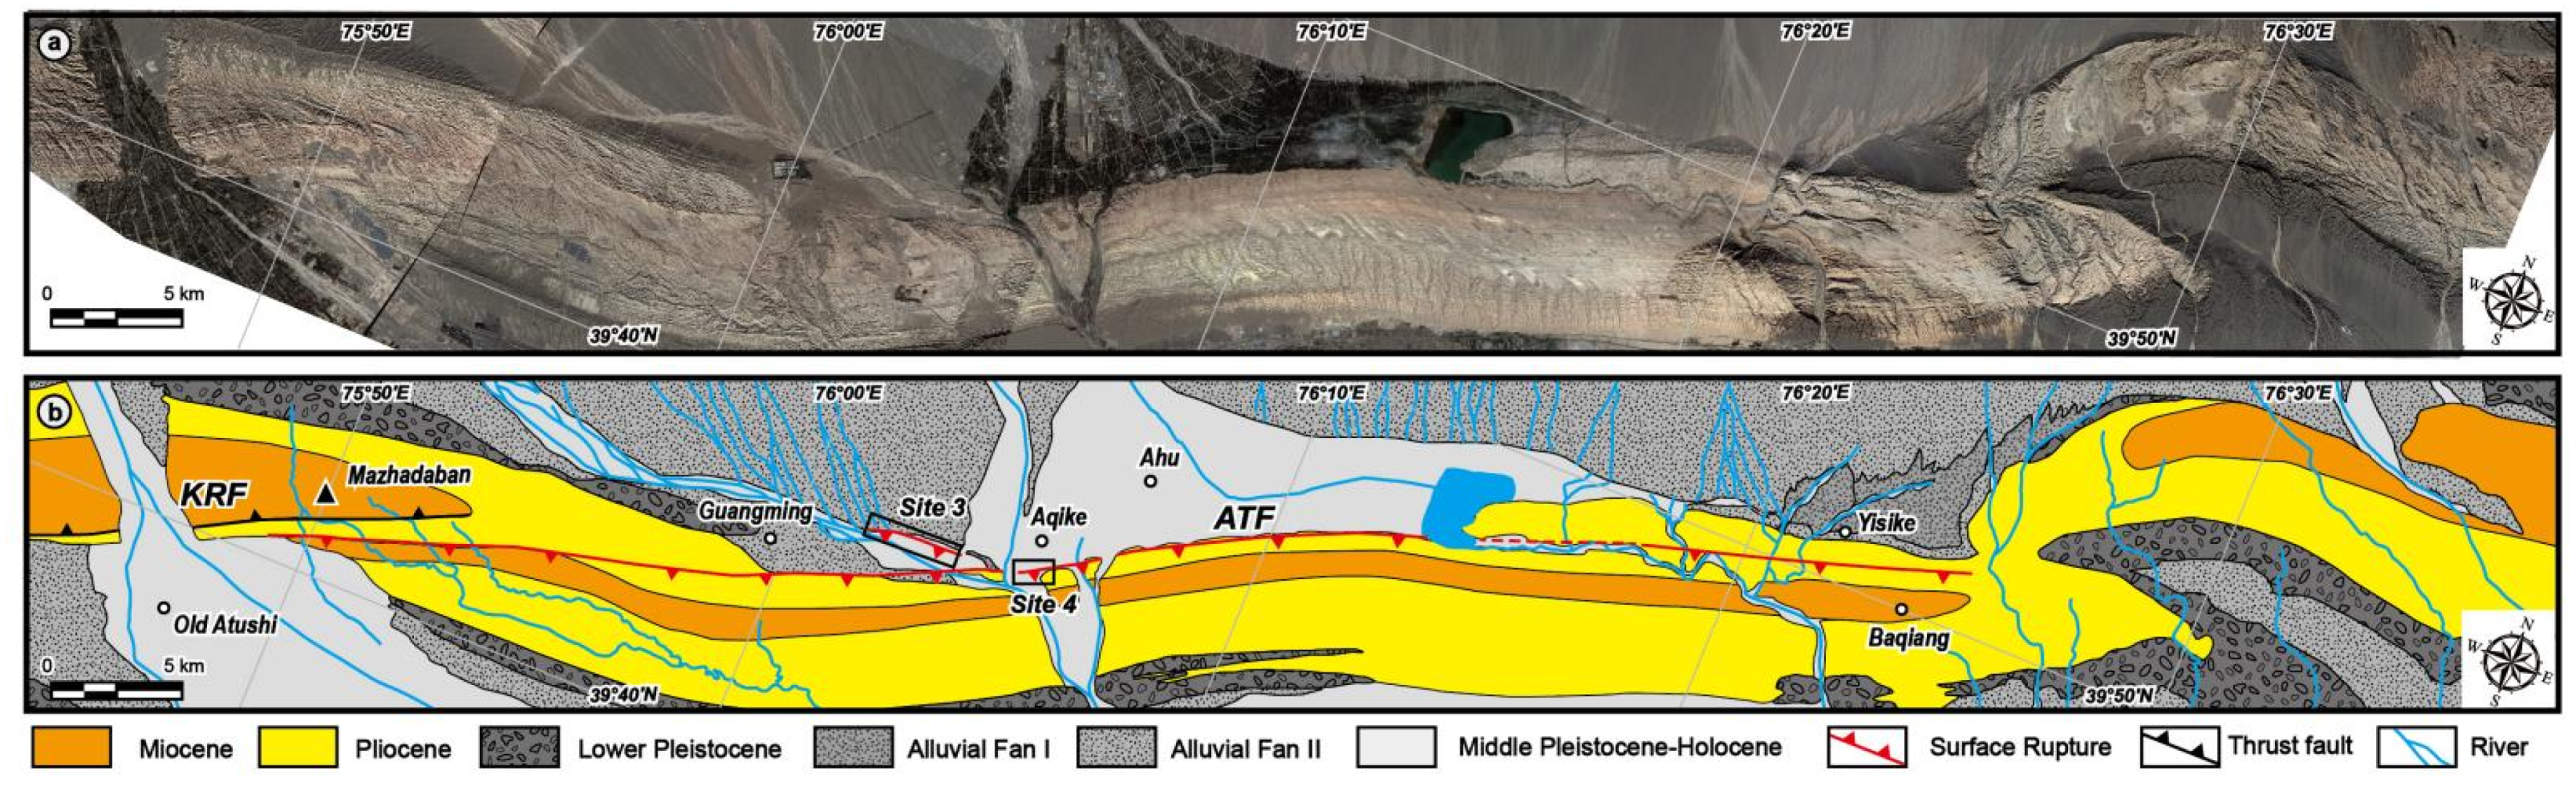
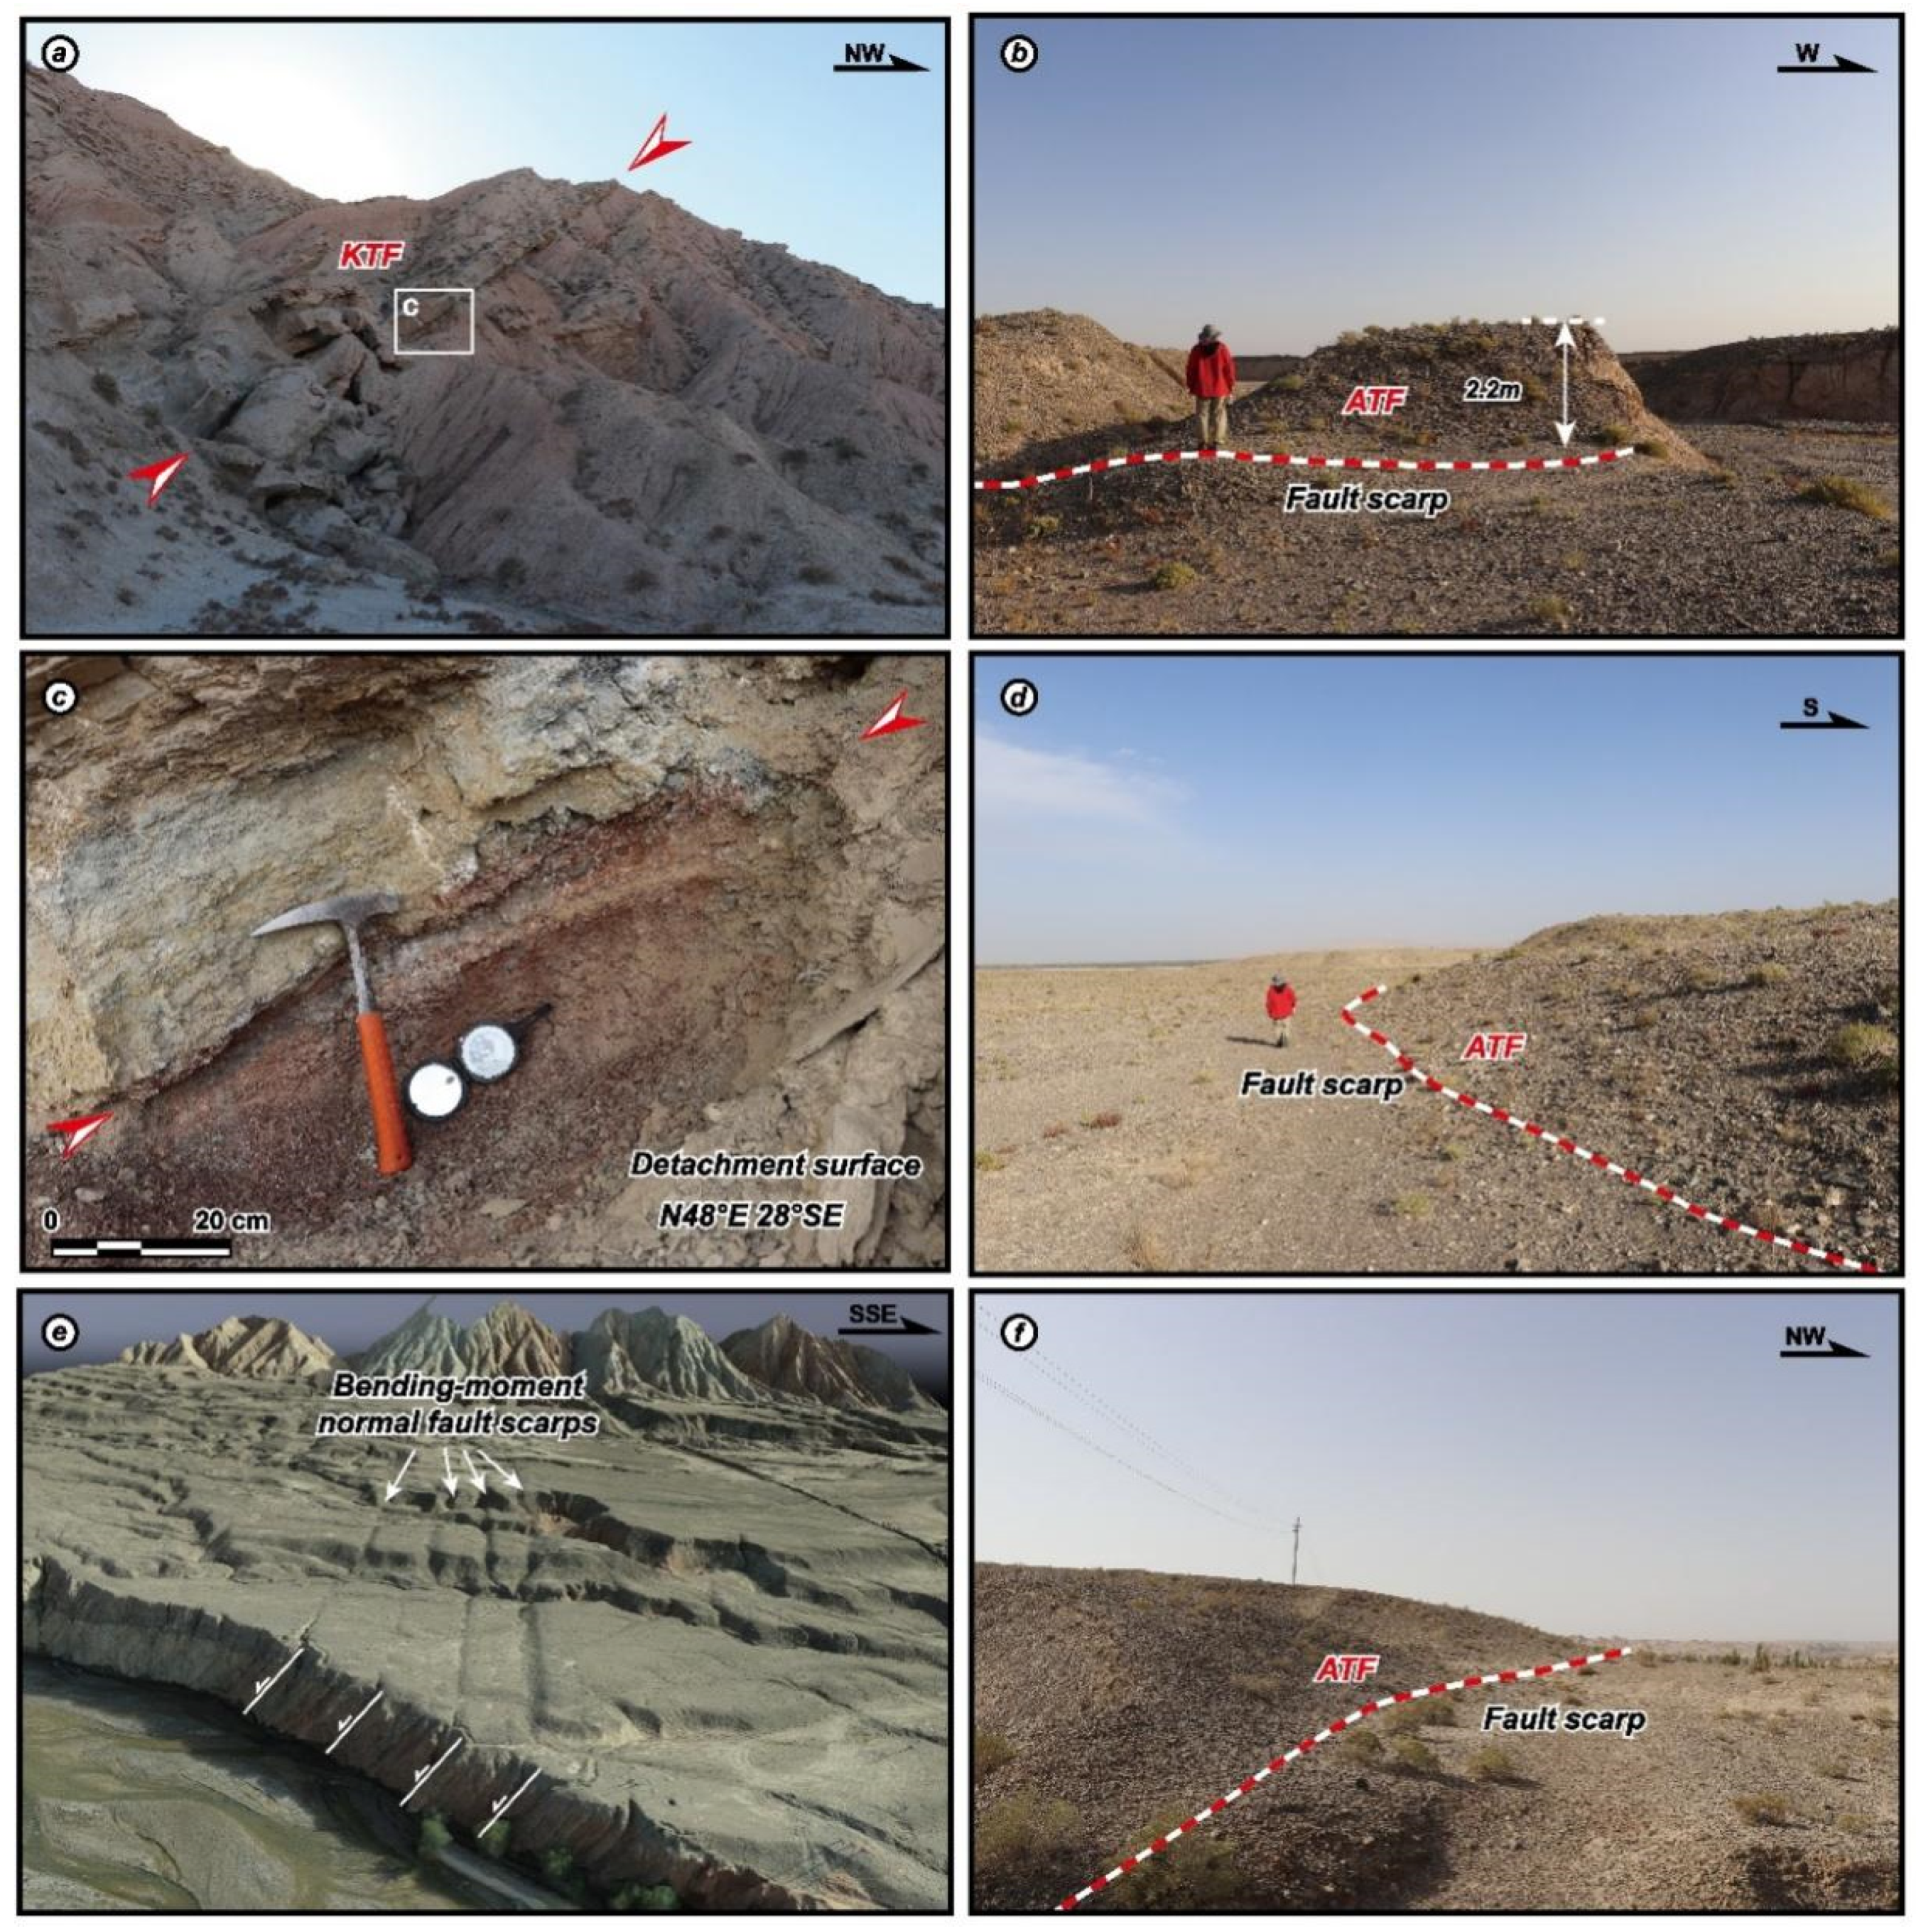
4.1. Spatial Distribution and Geometric Features of Surface Rupture Zones
4.1.1. Spatial Distribution along the KTF

4.1.2. Spatial Distribution along the ATF

4.2. Surface Deformation and Vertical Displacement
5. Discussion
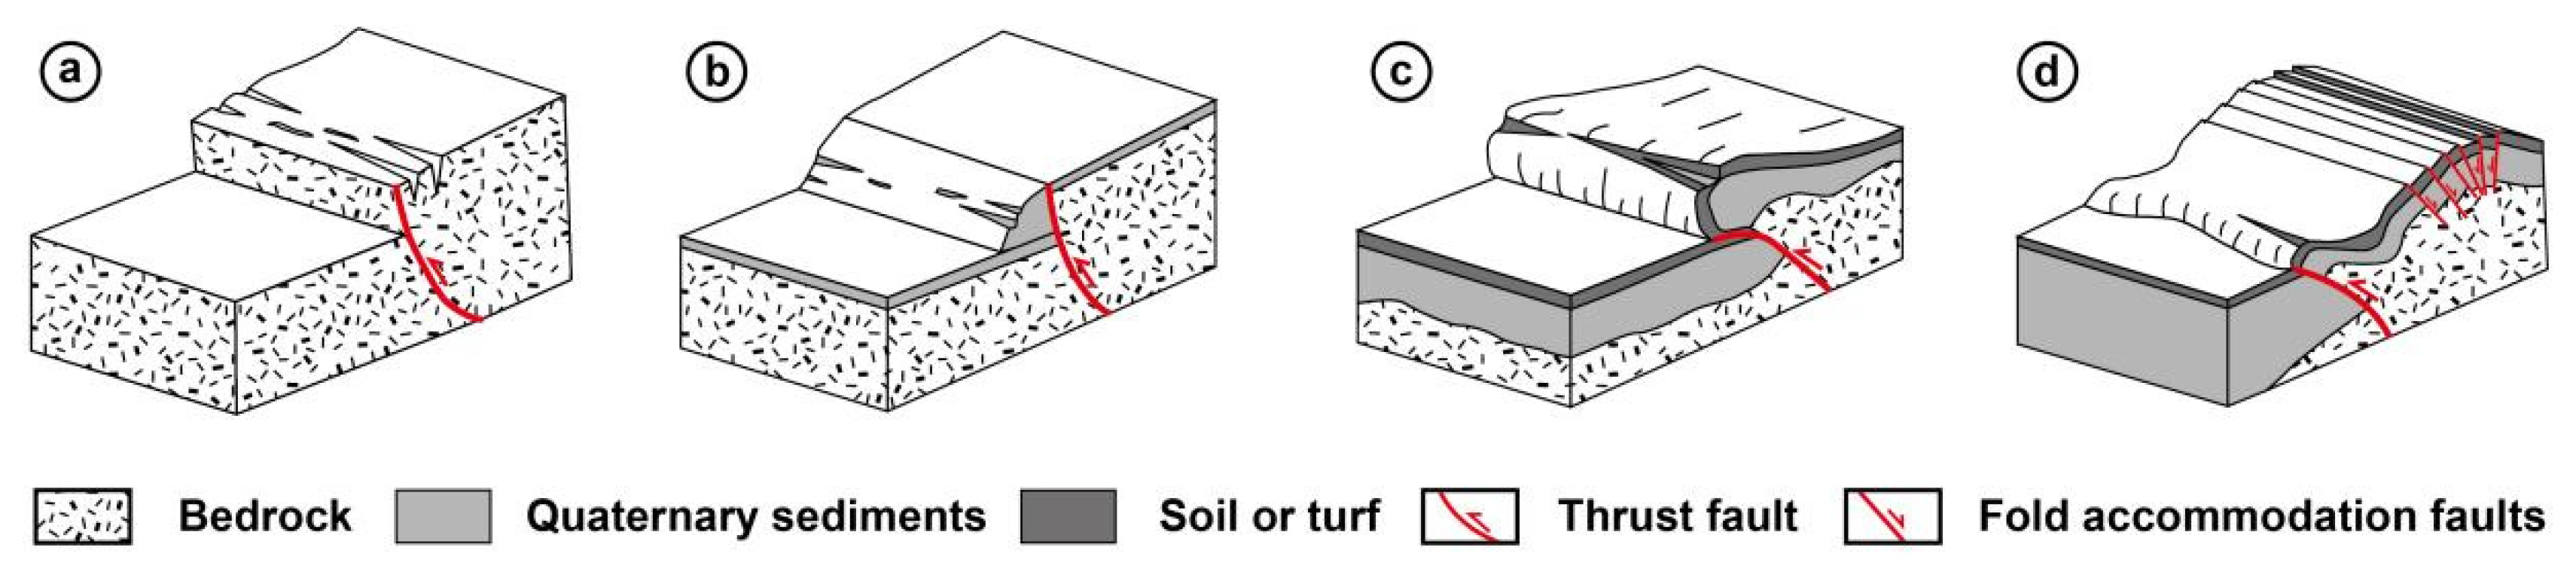
5.1. Geometric Feature and Surface Deformation of the Surface Rupture Zones
5.2. Rupture Length and Kinematics of the 1902 Mw 7.7 Atushi Earthquake
6. Conclusions
Author Contributions
Funding
Data Availability Statement
Acknowledgments
Conflicts of Interest
References
- Ainscoe, E.A.; Abdrakhmatov, K.E.; Baikulov, S.; Carr, A.S.; Elliott, A.J.; Grützner, C.; Walker, R.T. Variability in surface rupture between successive earthquakes on the Suusamyr Fault, Kyrgyz Tien Shan: Implications for palaeoseismology. Geophys. J. Int. 2019, 216, 703–725. [Google Scholar] [CrossRef]
- Allen, M.B.; Walters, R.J.; Song, S.; Saville, C.; De Paola, N.; Ford, J.; Hu, Z.; Sun, W. Partitioning of oblique convergence coupled to the fault locking behavior of fold-and-thrust belts: Evidence from the Qilian Shan, northeastern Tibetan Plateau. Tectonics 2017, 36, 1679–1698. [Google Scholar] [CrossRef] [Green Version]
- Avouac, J.P.; Tapponnier, P.; Bai, M.; You, H.; Wang, G. Active thrusting and folding along the northern Tien Shan and Late Cenozoic rotation of the Tarim relative to Dzungaria and Kazakhstan. J. Geophys. Res. Solid Earth 1993, 98, 6755–6804. [Google Scholar] [CrossRef] [Green Version]
- Coudurier-Curveur, A.; Tapponnier, P.; Okal, E.; Van der Woerd, J.; Kali, E.; Choudhury, S.; Baruah, S.; Etchebes, M.; Karakaş, Ç. A composite rupture model for the great 1950 Assam earthquake across the cusp of the East Himalayan Syntaxis. Earth Planet. Sci. Lett. 2020, 531, 115928. [Google Scholar] [CrossRef]
- Guo, P.; Han, Z.; Gao, F.; Zhu, C.; Gai, H. A New Tectonic Model for the 1927 Ms 8.0 Gulang Earthquake on the NE Tibetan Plateau. Tectonics 2020, 39, e2020TC006064. [Google Scholar] [CrossRef]
- Sapkota, S.N.; Bollinger, L.; Klinger, Y.; Tapponnier, P.; Gaudemer, Y.; Tiwari, D. Primary Surface Ruptures of the Great Himalayan Earthquakes in 1934 and 1255. Nat. Geosci. 2012, 6, 71–76. [Google Scholar] [CrossRef]
- Xu, X.; Wen, X.; Yu, G.; Chen, G.; Klinger, Y.; Hubbard, J.; Shaw, J. Coseismic Reverse- and Oblique-slip Surface Faulting Generated by the 2008 Mw 7.9 Wenchuan Earthquake, China. Geology 2009, 37, 515–518. [Google Scholar] [CrossRef]
- Yeats, R.S.; Sieh, K.E.; Allen, C.R. The Geology of Earthquakes; Oxford University Press: New York, NY, USA, 1997. [Google Scholar]
- Burtman, V.S. Cenozoic crustal shortening between the Pamir and Tien Shan and a reconstruction of the Pamir–Tien Shan transition zone for the Cretaceous and Palaeogene. Tectonophysics 2000, 319, 69–92. [Google Scholar] [CrossRef]
- Chen, J.; Burbank, D.W.; Schare, K.M.; Sobel, E.; Yin, J.; Rubin, C.; Zhao, R. Magnetochronology of the Upper Cenozoic strata in the Southwestern Chinese Tian Shan: Rates of Pleistocene folding and thrusting. Earth Planet. Sci. Lett. 2001, 195, 113–130. [Google Scholar] [CrossRef]
- Fu, B.; Ninomiya, Y.; Guo, J. Slip partitioning in the northeast Pamir–Tian Shan convergence zone. Tectonophysics 2010, 483, 344–364. [Google Scholar] [CrossRef]
- Heermance, R.V.; Chen, J.; Burbank, D.W.; Miao, J. Temporal Constraints and Pulsed Late Cenozoic Deformation during the Structural Disruption of the Active Kashi Foreland, Northwest China. Tectonics 2008, 27, TC6012. [Google Scholar] [CrossRef] [Green Version]
- Shen, J.; Wang, Y.; Zhao, R.; Chen, J.; Qu, G. Propagation of Cenozoic Arcuate Structures in northeast Pamir and northwest Tarim Basin. Seismol. Geol. 2001, 23, 381–389. [Google Scholar]
- Yin, A.; Nie, S.; Craig, P.; Harrison, T.M.; Ryerson, F.J.; Xianglin, Q.; Geng, Y. Late Cenozoic Tectonic Evolution of the Southern Chinese Tian Shan. Tectonics 1998, 17, 1–27. [Google Scholar] [CrossRef]
- Tapponnier, P.; Molnar, P. Active Faulting and Cenozoic Tectonics of the Tien Shan, Mongolia, and Baykal Regions. J. Geophys. Res. Solid Earth 1979, 84, 3425–3459. [Google Scholar] [CrossRef]
- Yang, X.; Chen, L.; Li, A.; Du, L.; Deng, Q. The Uplifting of Artux Anticline by Stages in the Late Quaternary, Southwest Tianshan. Earth Sci. Front. 2009, 16, 160–170. [Google Scholar]
- Kulikova, G.; Krüger, F. Historical Seismogram Reproductions for the Source Parameters Determination of the 1902, Atushi (Kashgar) Earthquake. J. Seismol. 2017, 21, 1577–1597. [Google Scholar] [CrossRef]
- Bai, M.; Ge, S. The 1902 Artux earthquake of MS 8 1/4 in Xinjiang Uygur Autonomous Region. Res. Extraordinarily Big Earthq. China 1988. [Google Scholar]
- Bi, H.; Zheng, W.; Ge, W.; Zhang, P.; Zeng, J.; Yu, J. Constraining the Distribution of Vertical Slip on the South Heli Shan Fault (Northeastern Tibet) From High-Resolution Topographic Data. J. Geophys. Res. Solid Earth 2018, 123, 2484–2501. [Google Scholar] [CrossRef]
- Avouac, J.-P.; Ayoub, F.; Leprince, S.; Konca, O.; Helmberger, D.V. The 2005, Mw 7.6 Kashmir earthquake: Sub-pixel correlation of ASTER images and seismic waveforms analysis. Earth Planet. Sci. Lett. 2006, 249, 514–528. [Google Scholar] [CrossRef] [Green Version]
- DuRoss, C.B.; Bunds, M.P.; Gold, R.D.; Briggs, R.W.; Reitman, N.G.; Personius, S.F.; Toké, N.A. Variable normal-fault rupture behavior, northern Lost River fault zone, Idaho, USA. Geosphere 2019, 15, 1869–1892. [Google Scholar] [CrossRef]
- Fu, B.; Awata, Y.; Du, J.; Ninomiya, Y.; He, W. Complex geometry and segmentation of the surface rupture associated with the 14 November 2001 great Kunlun earthquake, northern Tibet, China. Tectonophysics 2005, 407, 43–63. [Google Scholar] [CrossRef]
- Fu, B.; Lei, X.; Hessami, K.; Ninomiya, Y.; Azuma, T.; Kondo, H. A new fault rupture scenario for the 2003 Mw 6.6 Bam earthquake, SE Iran: Insights from the high-resolution QuickBird imagery and field observations. J. Geodyn. 2007, 44, 160–172. [Google Scholar] [CrossRef]
- Fu, B.; Ninomiya, Y.; Lei, X.; Toda, S.; Awata, Y. Mapping active fault associated with the 2003 Mw 6.6 Bam (SE Iran) earthquake with ASTER 3D images. Remote Sens. Environ. 2004, 92, 153–157. [Google Scholar] [CrossRef]
- Fu, B.; Shi, P.; Guo, H.; Okuyama, S.; Ninomiya, Y.; Wright, S. Surface Deformation Related to the 2008 Wenchuan Earthquake, and Mountain Building of the Longmen Shan, Eastern Tibetan Plateau. J. Asian Earth Sci. 2011, 40, 805–824. [Google Scholar] [CrossRef]
- Hossler, T.; Bollinger, L.; Sapkota, S.N.; Lavé, J.; Gupta, R.M.; Kandel, T.P. Surface Ruptures of Large Himalayan Earthquakes in Western Nepal: Evidence along a Reactivated Strand of the Main Boundary Thrust. Earth Planet. Sci. Lett. 2016, 434, 187–196. [Google Scholar] [CrossRef]
- Li, Z.; Xu, X.; Tapponnier, P.; Chen, G.; Li, K.; Luo, J.; Cheng, J.; Kang, W. Post-20 ka Earthquake Scarps Along NE-Tibet’s Qilian Shan Frontal Thrust: Multi-Millennial Return, ∼Characteristic Co-Seismic Slip, and Geological Rupture Control. J. Geophys. Res. Solid Earth 2021, 126, e2021JB021889. [Google Scholar] [CrossRef]
- Liu, J.; Ren, Z.; Min, W.; Ha, G.; Lei, J. The advance in obtaining fault slip rate of strike slip fault-A review. Earthq. Res. Adv. 2021, 1, 100032. [Google Scholar] [CrossRef]
- Ren, Z.; Zhang, Z.; Chen, T.; Yan, S.; Yin, J.; Zhang, P.; Zheng, W.; Zhang, H.; Li, C. Clustering of offsets on the Haiyuan fault and their relationship to paleoearthquakes. Geol. Soc. Am. Bull. 2015, 128, 3–18. [Google Scholar] [CrossRef]
- Ren, Z.; Zielke, O.; Yu, J. Active tectonics in 4D high-resolution. J. Struct. Geol. 2018, 117, 264–271. [Google Scholar] [CrossRef]
- Wang, S.; Jiao, R.; Ren, Z.; Wu, C.; Ren, G.; Zhang, H.; Lei, Q. Active Thrusting in an Intermontane Basin: The Kumysh Fault, Eastern Tian Shan. Tectonics 2020, 39, e2019TC006029. [Google Scholar] [CrossRef]
- Wang, S.; Ren, Z.; Wu, C.; Lei, Q.; Gong, W.; Ou, Q.; Zhang, H.; Ren, G.; Li, C. DEM generation from Worldview-2 stereo imagery and vertical accuracy assessment for its application in active tectonics. Geomorphology 2019, 336, 107–118. [Google Scholar] [CrossRef]
- Du, J.; Fu, B.; Guo, Q.; Shi, P.; Xue, G.; Xu, H. Segmentation and termination of the surface rupture zone produced by the 1932 Ms 7.6 Changma earthquake: New insights into the slip partitioning of the eastern Altyn Tagh fault system. Lithosphere 2020, 12, 19–39. [Google Scholar] [CrossRef] [Green Version]
- Huang, X.; Yang, X.; Yang, H.; Hu, Z.; Zhang, L. Re-Evaluating the Surface Rupture and Slip Distribution of the AD 1609 M7 1/4 Hongyapu Earthquake Along the Northern Margin of the Qilian Shan, NW China: Implications for Thrust Fault Rupture Segmentation. Front. Earth Sci. 2021, 9, 98. [Google Scholar] [CrossRef]
- Hu, W.; Chang, X.; Abuliz, Y.; Zhang, Y.; Huang, S.; He, J. Surface Rupture Zone and Tectonic Patterns at Southwest Tianshan Piedmont of Atushi Ms8.25 Earthquake on August 22, 1902. Inland Earthq. 2018, 32, 289–309. [Google Scholar]
- Luan, C.; Bai, M.; Xiang, Z. Evaluation of Seismic Sturcture in the near Field of Autx of Xinjiang. Xinjiang Geol. 1998, 16, 76–88. [Google Scholar]
- Tian, Q.; Ding, G.; Hao, P. Seismotectonic Study on West Part of the Interaction Zone between Southern Tianshan and Northern Tarim. Seismol. Geol. 2006, 28, 213–223. [Google Scholar]
- Yang, X.; Ran, H. The Boundary and Upper Limit Magnitude of Potential Seismic Source Zone in Active Nappe Structure Region—An Example from M8¼ Atushi Seismic Structure Region. Technol. Earthq. Disaster Prev. 2010, 5, 145–156. [Google Scholar]
- Zhao, R.; Li, J.; Shen, J. The Preliminary Study on Active Faults and Paleoearthquakes in the North Fringe of Kashi Depression. Acta Seismol. Sin. 2000, 22, 327–331. [Google Scholar]
- Zhao, R.; Shen, J.; Li, J. Preliminary Study on the Deformation Features and Seismogenic Model of the 1902 Artux, Xinjiang Earthquake Ms 8.25. Seismol. Geol. 2001, 23, 581–587. [Google Scholar]
- Gao, R.; Hou, H.; Cai, X.; Knapp, J.H.; He, R.; Liu, J.; Xiong, X.; Guan, Y.; Li, W.; Zeng, L.; et al. Fine Crustal Structure Beneath the Junction of the Southwest Tian Shan and Tarim Basin, NW China. Lithosphere 2013, 5, 382–392. [Google Scholar] [CrossRef] [Green Version]
- Qu, G.; Chen, J.; Chen, X.; Canerot, J.; Li, Y. A Study on the Back-Thrusting System at Atushi-Bapanshuimo in Tarim Basin. Seismol. Geol. 2001, 23, 1–14. [Google Scholar]
- Scharer, K.M.; Burbank, D.W.; Chen, J.; Weldon, R.J.; Rubin, C.; Zhao, R.; Shen, J. Detachment Folding in the Southwestern Tian Shan–Tarim foreland, China: Shortening Estimates and Rates. J. Struct. Geol. 2004, 26, 2119–2137. [Google Scholar] [CrossRef]
- Sobel, E.; Chen, J.; Heermance, R. Late Oligocene–Early Miocene Initiation of Shortening in the Southwestern Chinese Tian Shan: Implications for Neogene Shortening Rate Variations. Earth Planet. Sci. Lett. 2006, 247, 70–81. [Google Scholar] [CrossRef]
- Thompson, J.A.; Burbank, D.W.; Li, T.; Chen, J.; Bookhagen, B. Late Miocene northward propagation of the northeast Pamir thrust system, northwest China. Tectonics 2015, 34, 510–534. [Google Scholar] [CrossRef] [Green Version]
- Thompson Jobe, J.A.; Li, T.; Bookhagen, B.; Chen, J.; Burbank, D. Dating Growth Strata and Basin Fill by Combining 26Al/10Be Burial Dating and Magnetostratigraphy: Constraining Active Deformation in the Pamir–Tian Shan Convergence Zone, NW China. Lithosphere 2018, 10, 806–828. [Google Scholar] [CrossRef] [Green Version]
- Thompson Jobe, J.A.; Li, T.; Chen, J.; Burbank, D.W.; Bufe, A. Quaternary tectonic evolution of the Pamir-Tian Shan convergence zone, Northwest China. Tectonics 2017, 36, 2748–2776. [Google Scholar] [CrossRef]
- Heermance, R.V.; Chen, J.; Burbank, D.W.; Wang, C. Chronology and Tectonic Controls of Late Tertiary Deposition in the Southwestern Tian Shan Foreland, NW China. Basin Res. 2007, 19, 599–632. [Google Scholar] [CrossRef]
- Jia, Y.; Fu, B.; Jolivet, M.; Zheng, S. Cenozoic Tectono-geomorphological Growth of the SW Chinese Tian Shan: Insight from AFT and Detrital Zircon U–Pb data. J. Asian Earth Sci. 2015, 111, 395–413. [Google Scholar] [CrossRef] [Green Version]
- Li, T.; Chen, J.; Thompson Jobe, J.A.; Burbank, D.W.; Cheng, X.; Xu, J.; Li, Z.; Zheng, W.; Zhang, P. Active Bending-Moment Faulting: Geomorphic Expression, Controlling Conditions, Accommodation of Fold Deformation. Tectonics 2018, 37, 2278–2306. [Google Scholar] [CrossRef] [Green Version]
- Wu, C.; Zheng, W.; Zhang, P.; Zhang, Z.; Jia, Q.; Yu, J.; Zhang, H.; Yao, Y.; Liu, J.; Han, G.; et al. Oblique Thrust of the Maidan Fault and Late Quaternary Tectonic Deformation in the Southwestern Tian Shan, Northwestern China. Tectonics 2019, 38, 2625–2645. [Google Scholar] [CrossRef]
- Miao, J.; Jia, C.; Hou, X.; Wang, Z.; Zou, C.; Tang, L.; Song, Y. Structural Analysis on Cenozoic Fold-and-Thrust Belts in Kashiarea, Western Tarim Basin. Chin. J. Geol. 2007, 42, 740–752. [Google Scholar]
- Bureau of Geology and Mineral Resources of Xinjiang Uygur Autonomous Region (BGMXJ). Regional Geology of Xinjiang Uygur Automomous Region; Geological Publishing House: Beijing, China, 1993.
- Chen, Q.; Fu, B.; Shi, P.; Kong, P. Time constraints of Late Cenozoic tectonic deformation of the Atushi anticline, Southwestern Tian Shan: Evidence from cosmogenic nuclide burial age. Front. Earth Sci. 2022, 10, 849167. [Google Scholar] [CrossRef]
- Allen, M.B.; Vincent, S.J.; Wheeler, P.J. Late Cenozoic tectonics of the Kepingtage thrust zone: Interactions of the Tien Shan and Tarim Basin, northwest China. Tectonics 1999, 18, 639–654. [Google Scholar] [CrossRef]
- Lv, L.; Li, T.; Chen, Z.; Chen, J.; Jobe, J.T.; Fang, L. Active Structural Geometries and Their Correlation With Moderate (M 5.5–7.0) Earthquakes in the Jiashi-Keping Region, Tian Shan Southwestern Front. Tectonics 2021, 40, e2021TC006760. [Google Scholar] [CrossRef]
- Turner, S.A.; Liu, J.G.; Cosgrove, J.W. Structural Evolution of the Piqiang Fault Zone, NW Tarim Basin, China. J. Asian Earth Sci. 2011, 40, 394–402. [Google Scholar] [CrossRef]
- Zhang, X.; Zhao, J.; Zhang, C.; Ren, Q.; Nie, W.; Cheng, S.; Pan, S.; Tang, Z. Crustal Structure at the Northeast Side of the Pamirs. Chin. J. Geophys. 2002, 45, 665–672. [Google Scholar] [CrossRef]
- Philip, H.; Rogozhin, E.; Cisternas, A.; Bousquet, J.C.; Borisov, B.; Karakhanian, A. The Armenian Earthquake of 1988 December 7: Faulting and Folding, Neotectonics and Palaeoseismicity. Geophys. J. Int. 1992, 110, 141–158. [Google Scholar] [CrossRef] [Green Version]
- Cheng, J.; Rong, Y.; Magistrale, H.; Chen, G.; Xu, X. Earthquake Rupture Scaling Relations for Mainland China. Seismol. Res. Lett. 2019, 91, 248–261. [Google Scholar] [CrossRef]
- Wells, D.L.; Coppersmith, K.J. New Empirical Relationships among Magnitude, Rupture Length, Rupture Width, Rupture Area, and Surface Displacement. Bull. Seismol. Soc. Am. 1994, 84, 974–1002. [Google Scholar]


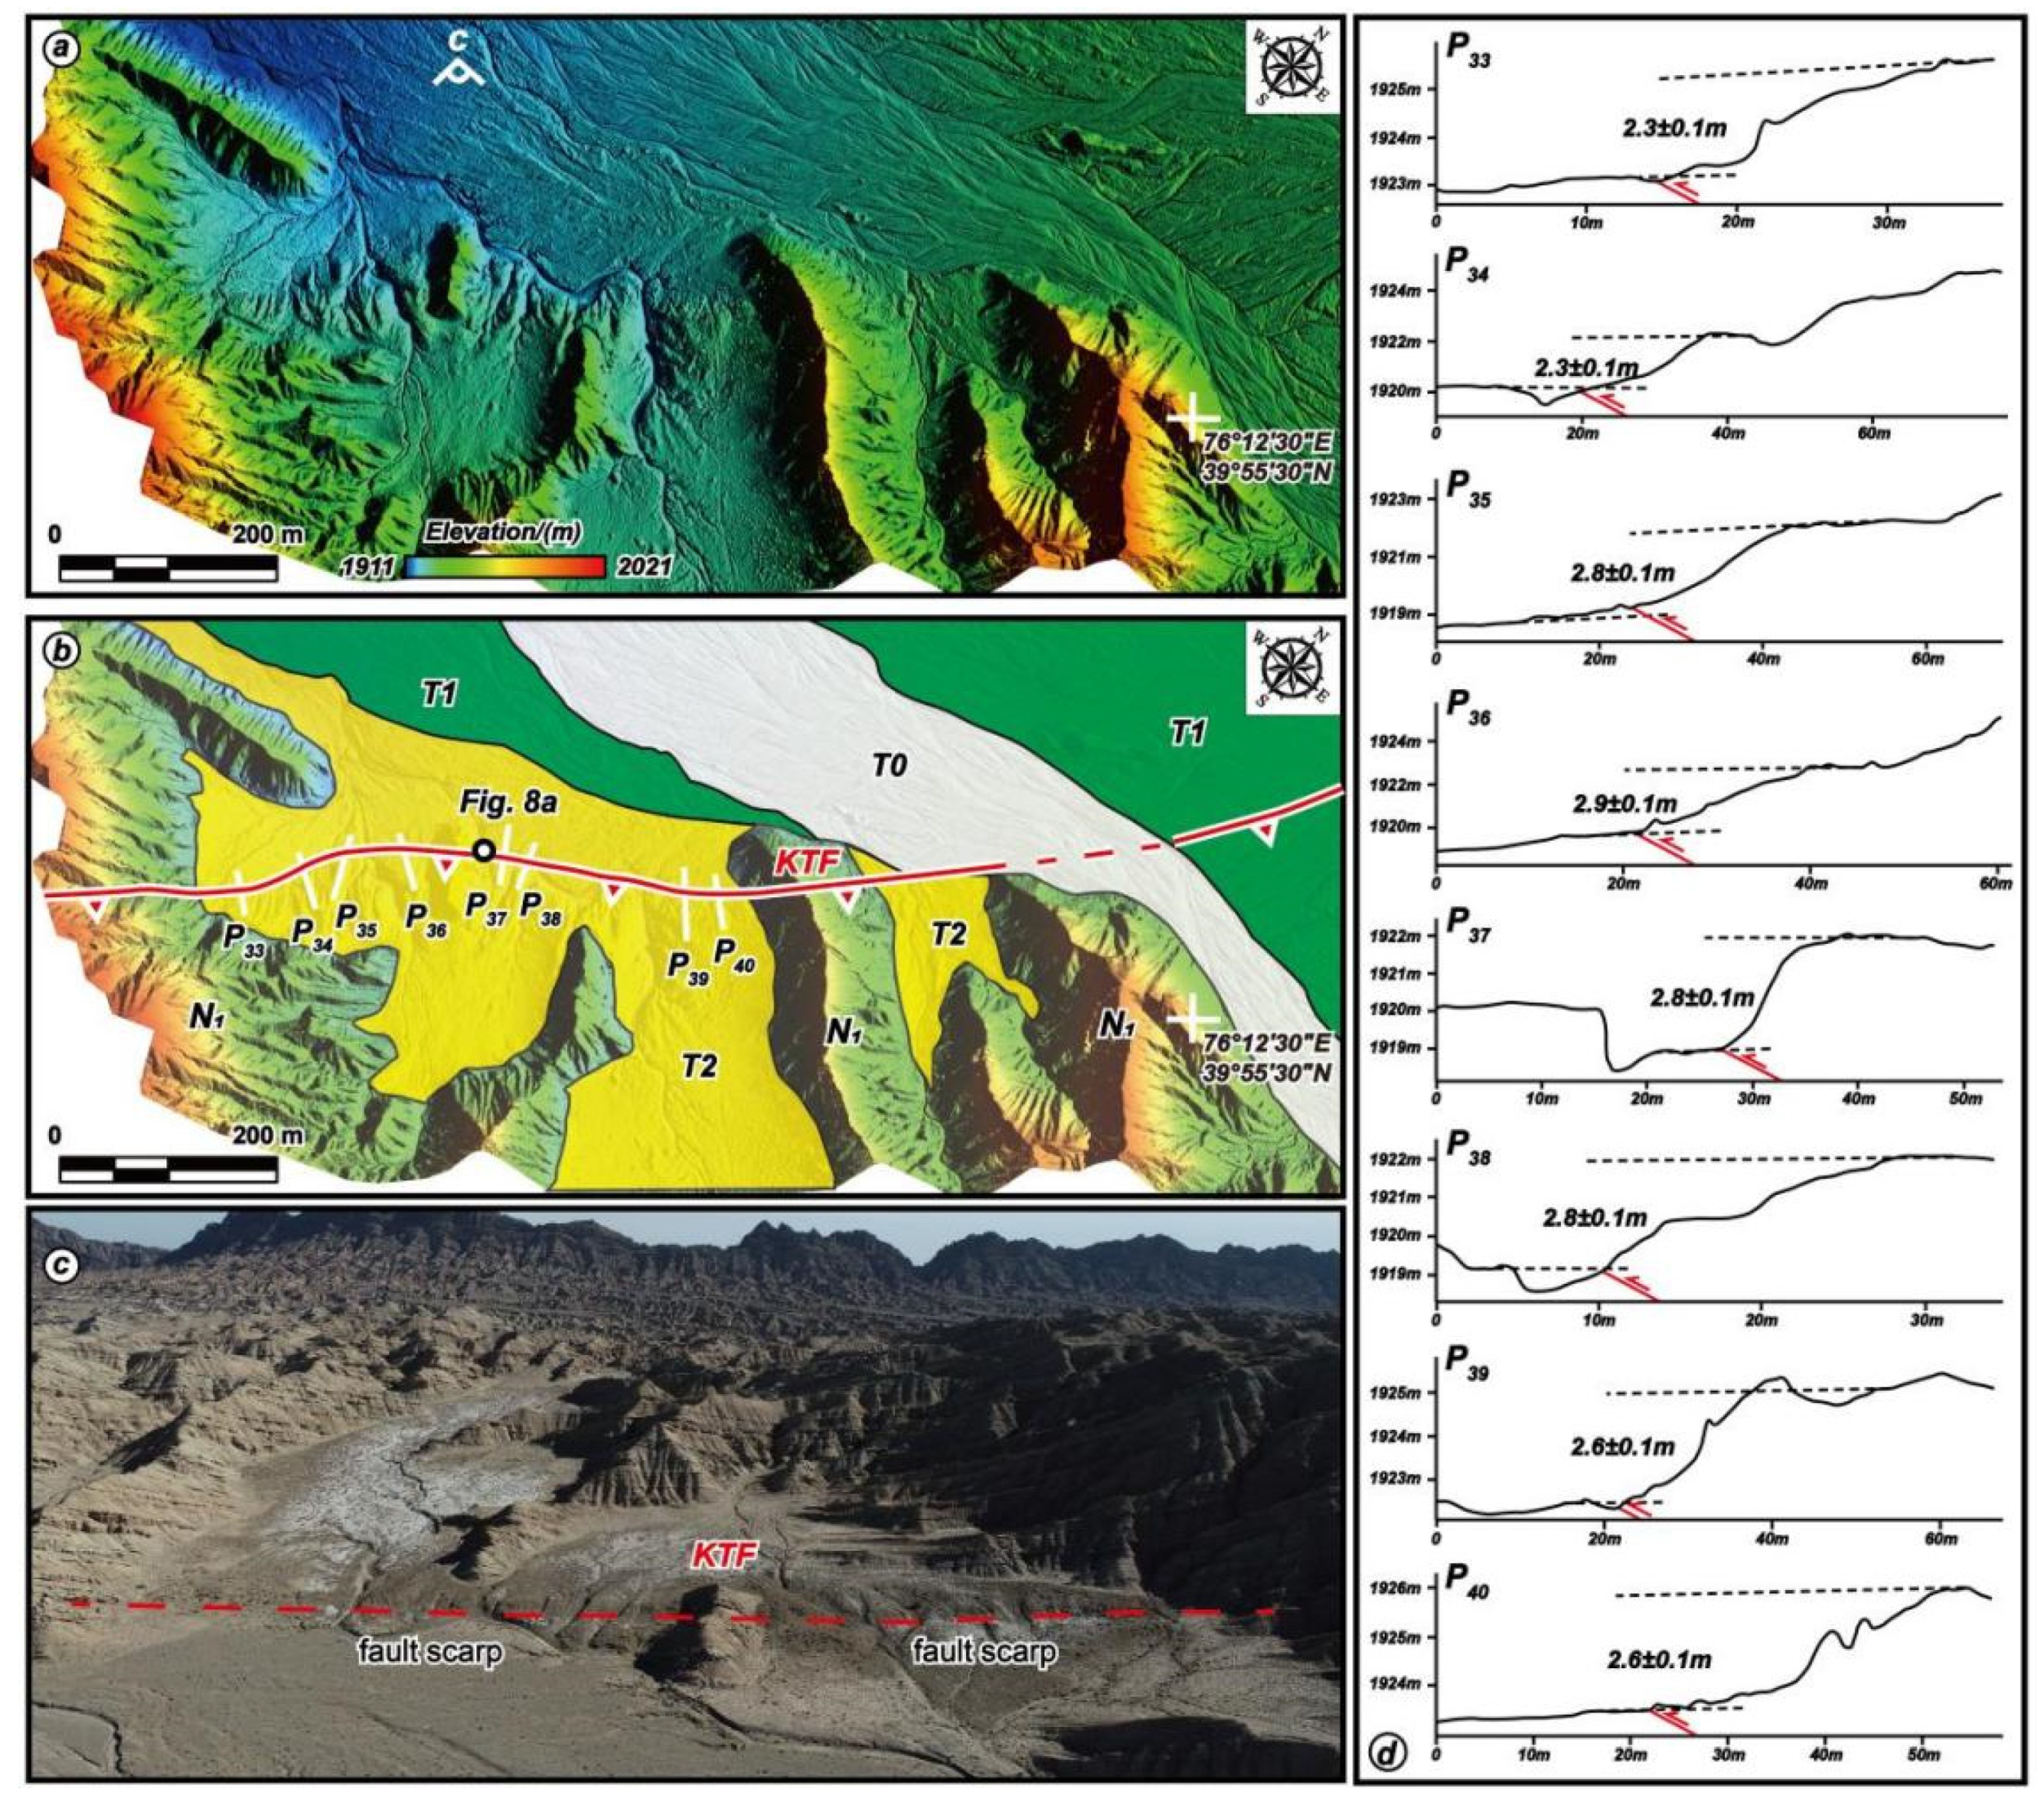
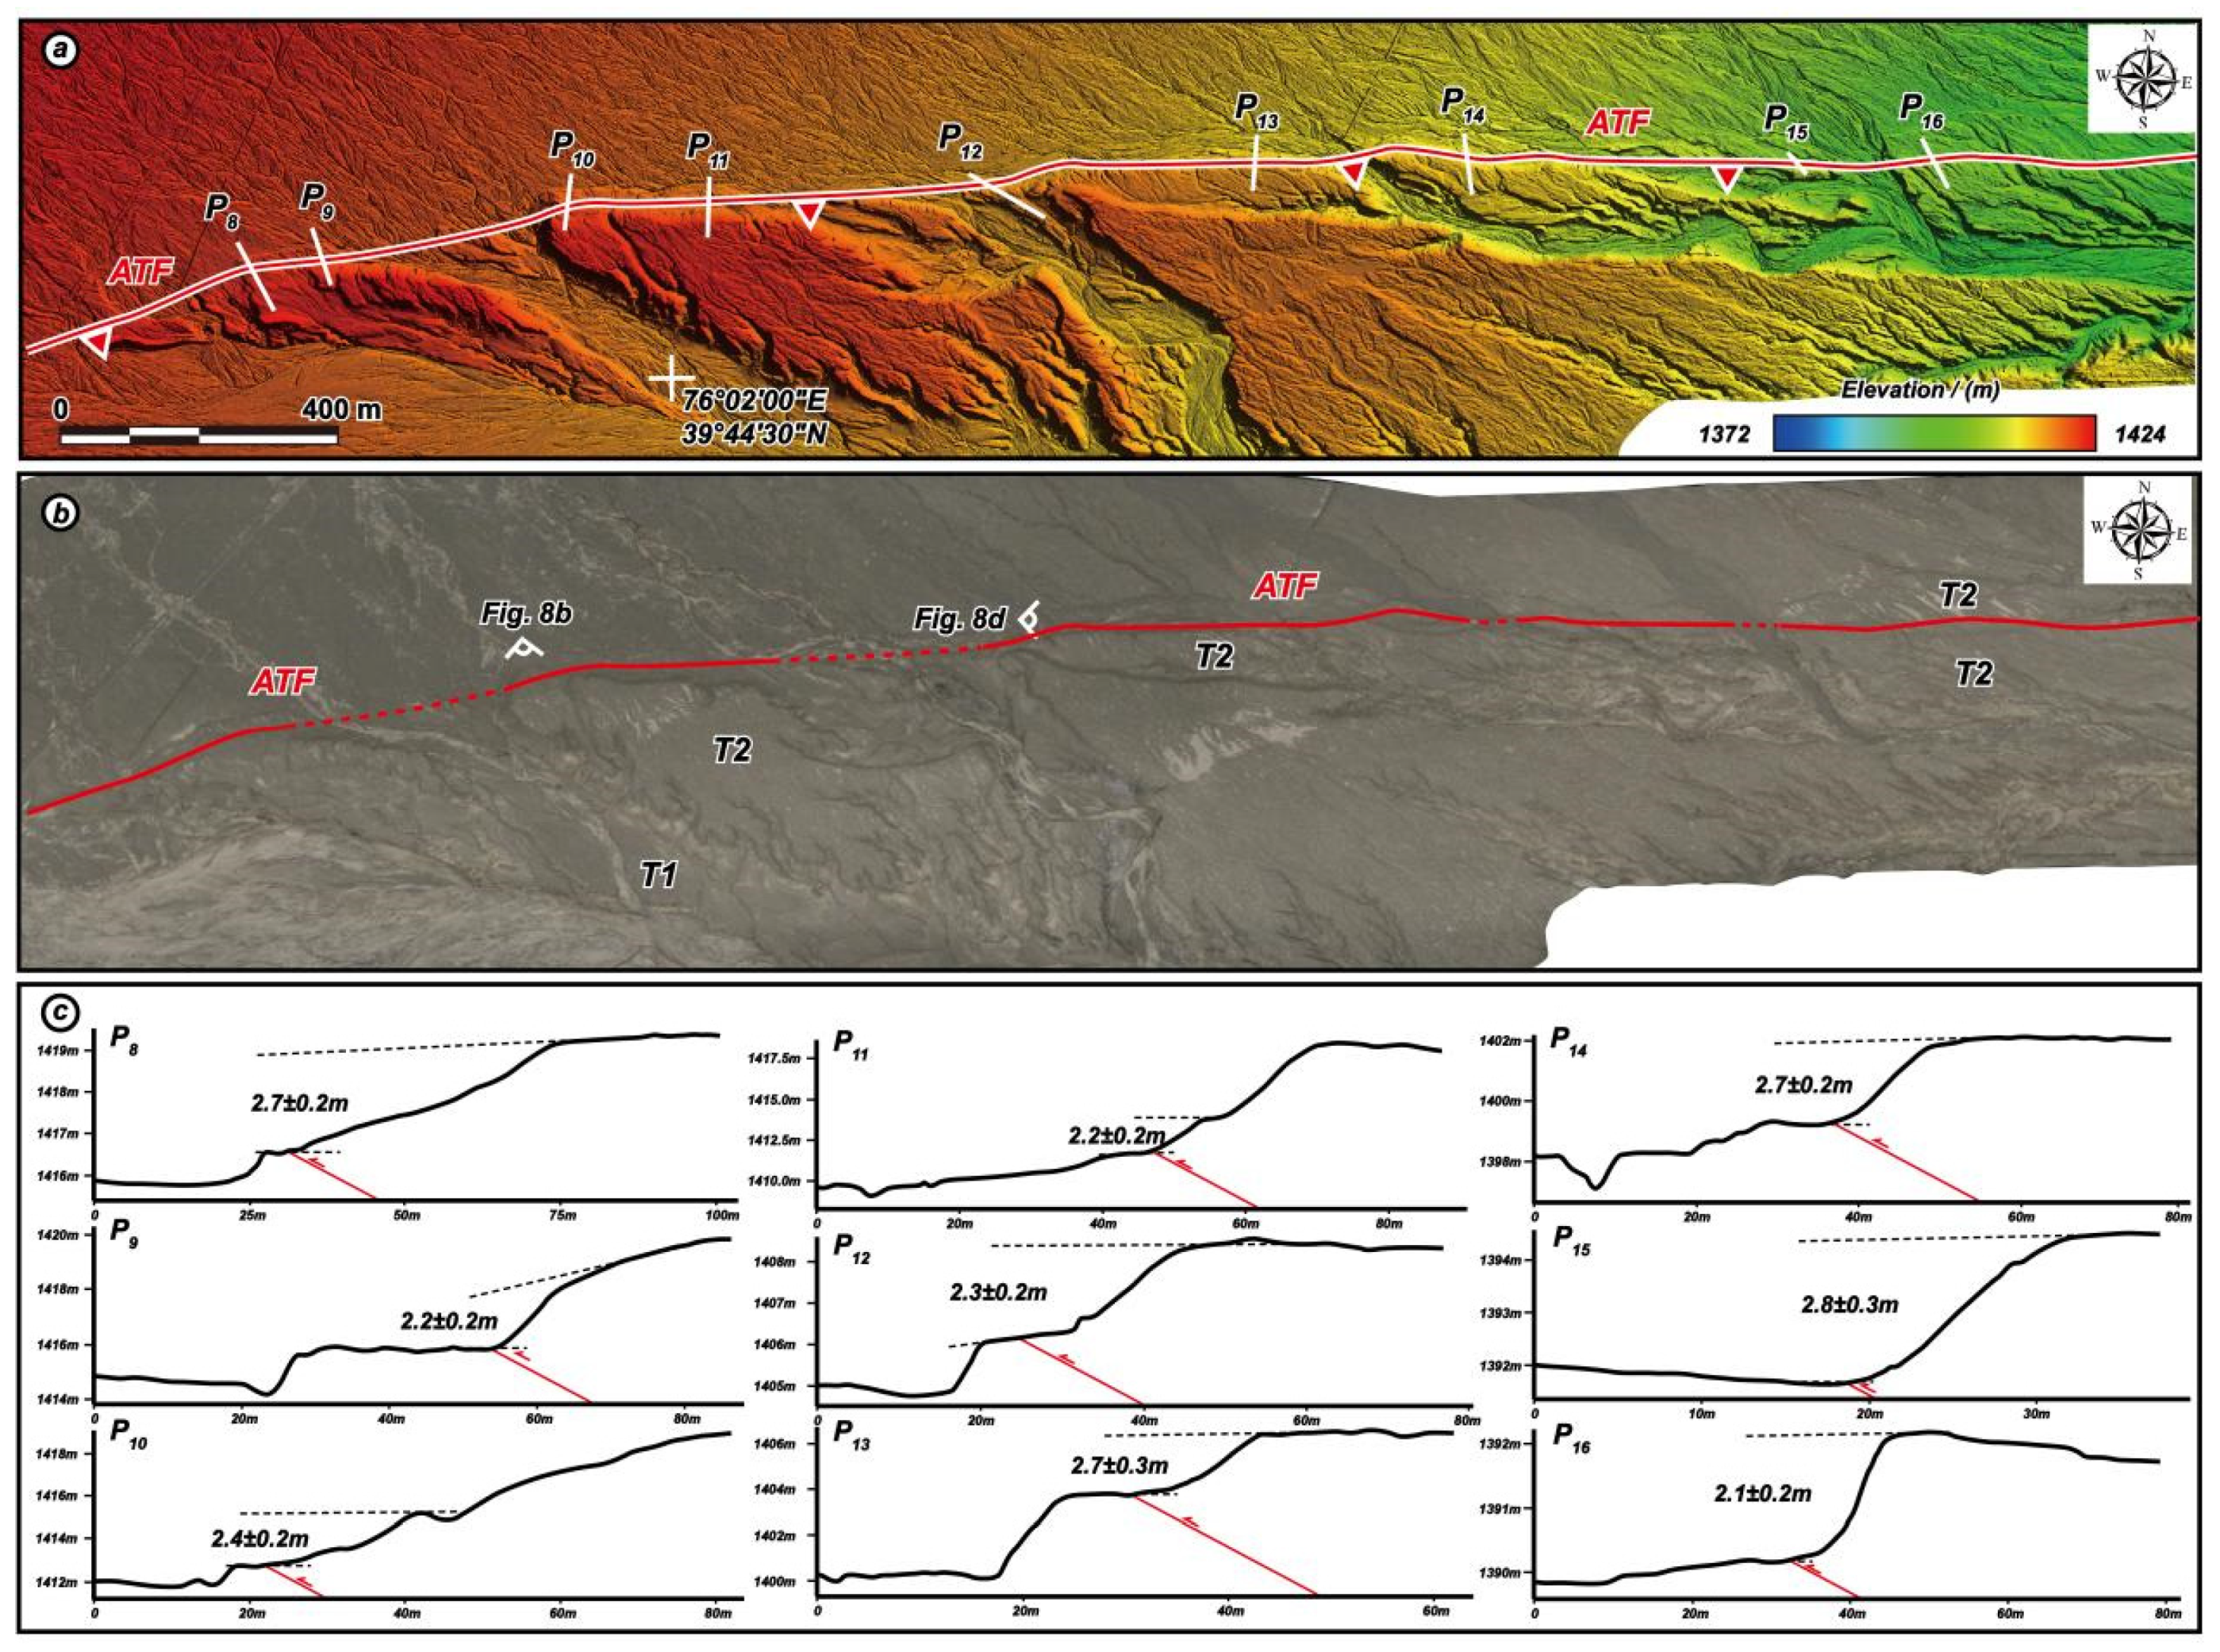
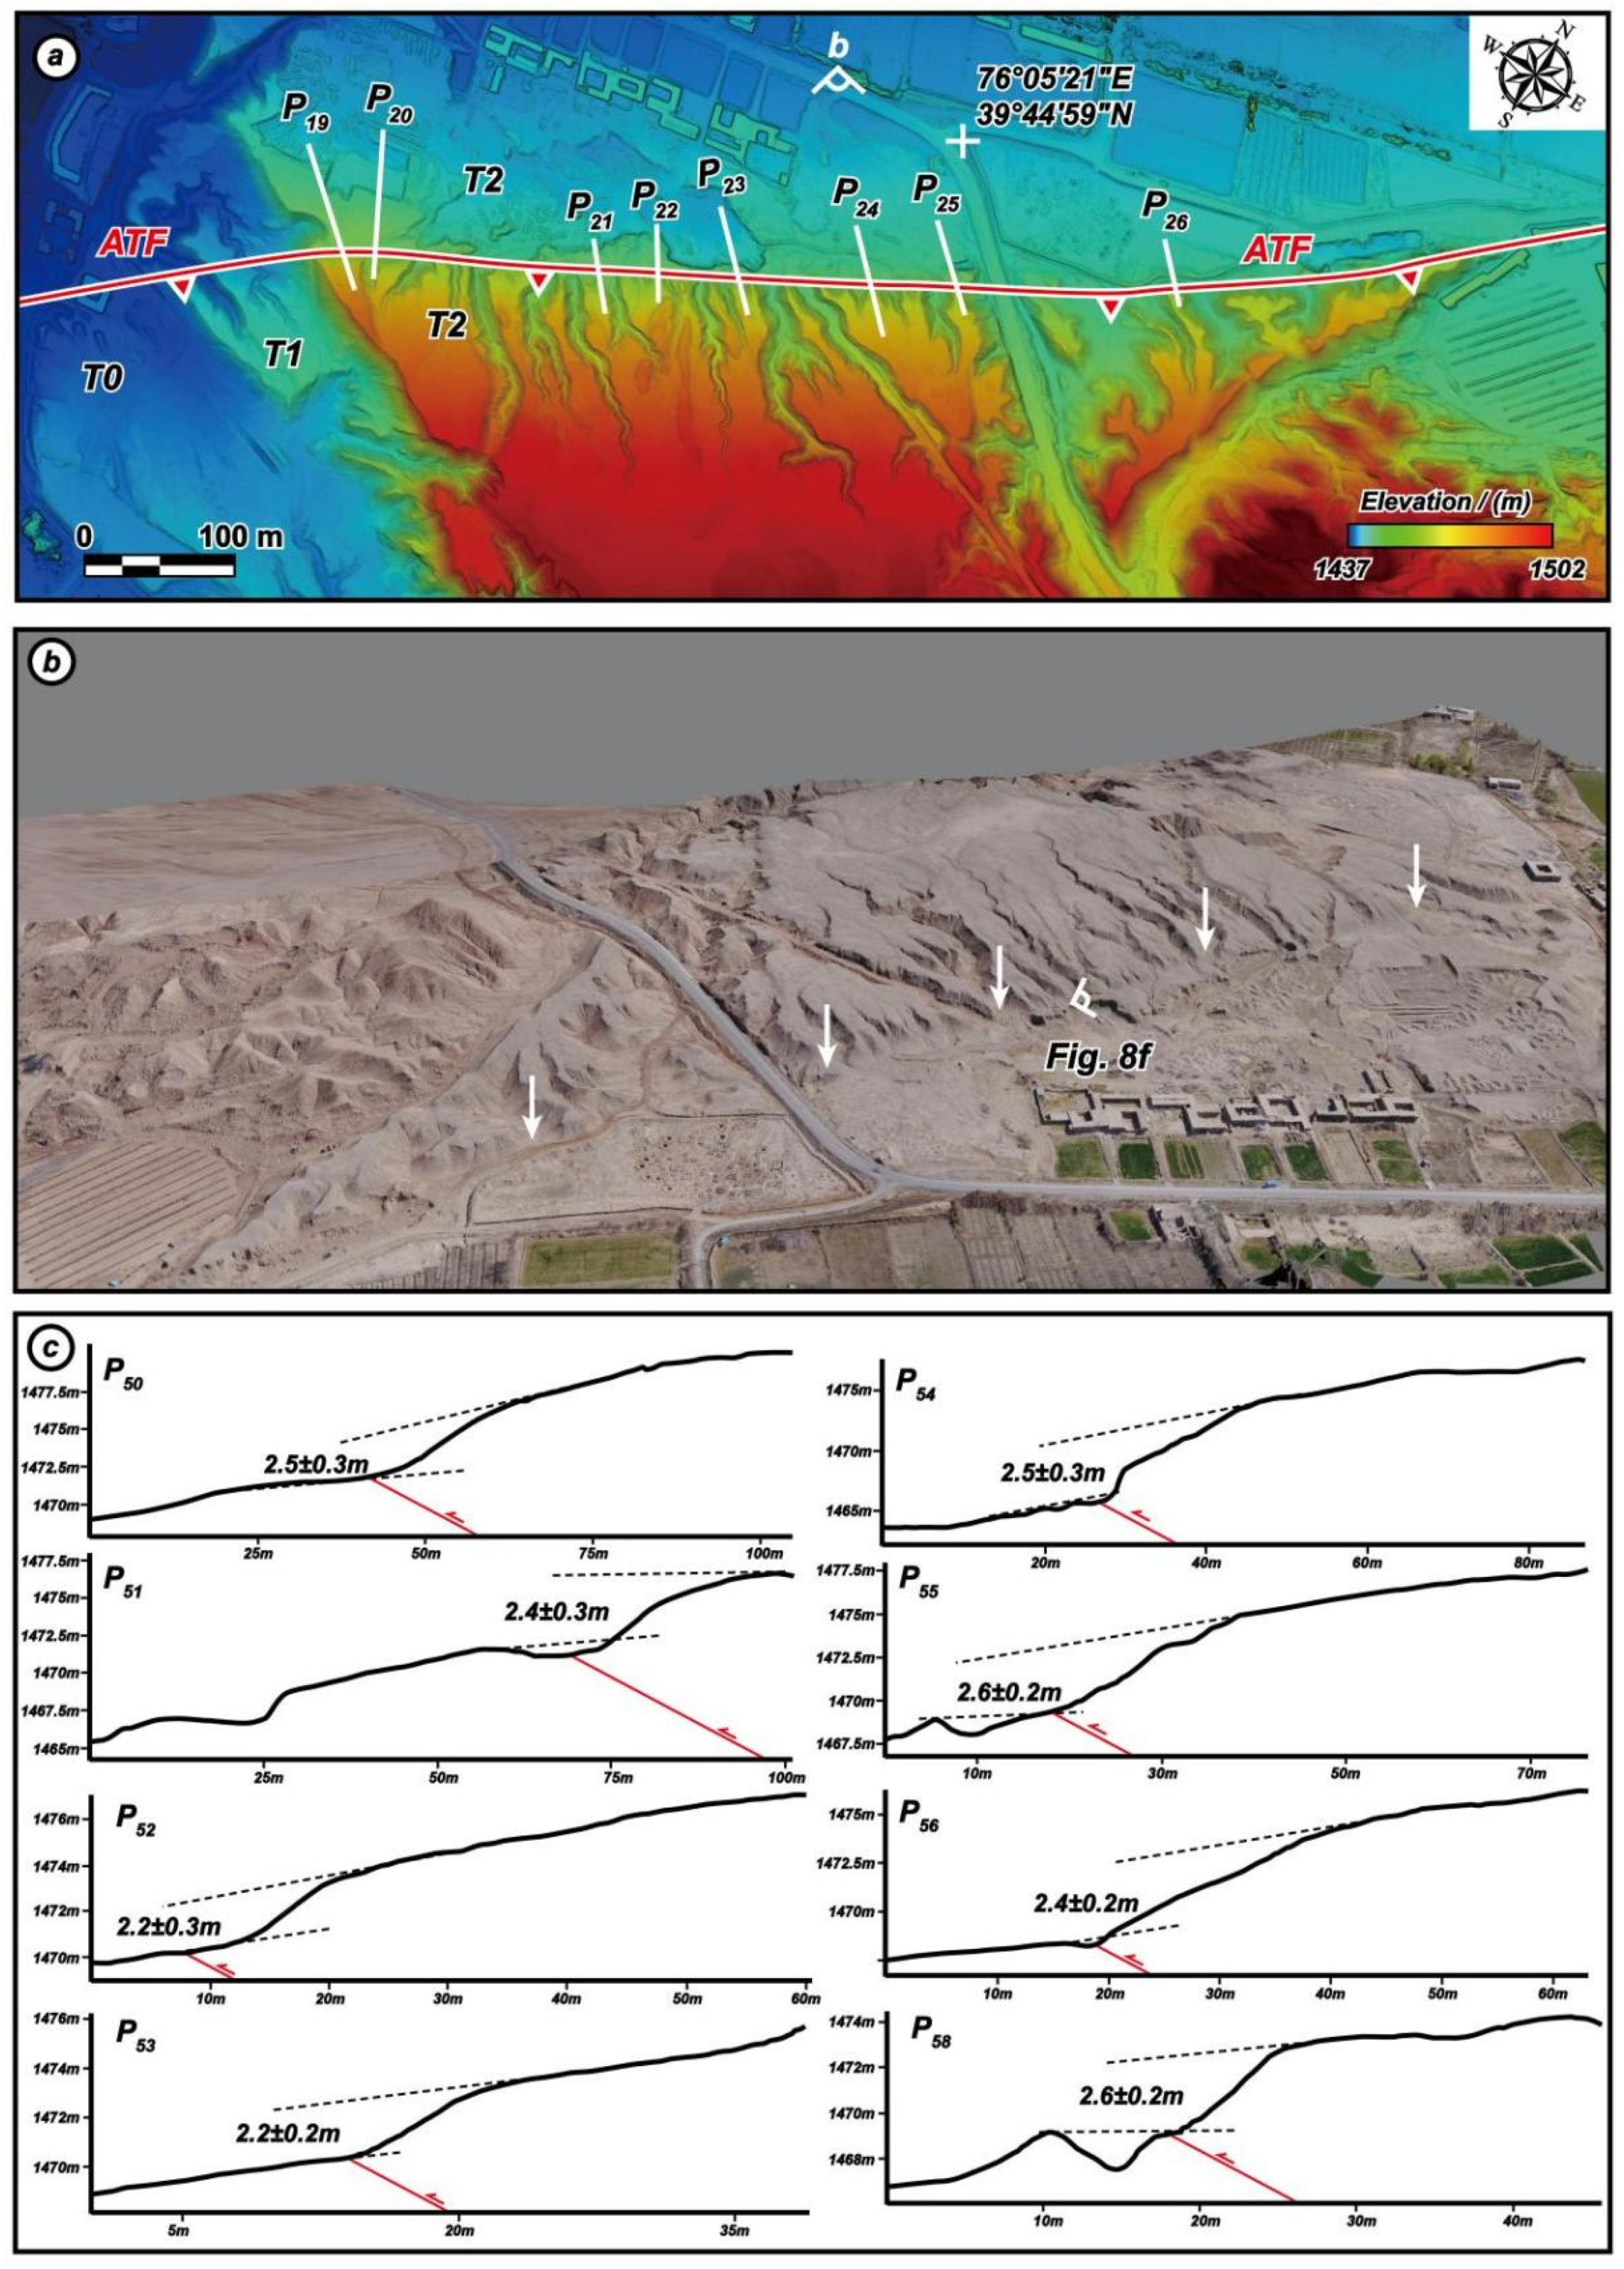
| No. | Longitude/(°) | Latitude/(°) | Distance/(km) | Throw/(m) | Error/(m) | Fault |
|---|---|---|---|---|---|---|
| 1 | 75.9553 | 39.7052 | 12.43 | 2.3 | 0.2 | ATF |
| 2 | 75.9656 | 39.7073 | 13.38 | 2.5 | 0.2 | |
| 3 | 75.9684 | 39.7082 | 13.63 | 2.4 | 0.2 | |
| 4 | 75.9724 | 39.7096 | 14.01 | 2.3 | 0.2 | |
| 5 | 75.9768 | 39.7113 | 14.48 | 2.3 | 0.2 | |
| 6 | 75.9842 | 39.7133 | 15.12 | 2.0 | 0.2 | |
| 7 | 75.9985 | 39.7295 | 16.98 | 2.3 | 0.2 | |
| 8 | 76.0273 | 39.7383 | 20.06 | 2.7 | 0.1 | |
| 9 | 76.0283 | 39.7429 | 20.17 | 2.2 | 0.1 | |
| 10 | 76.0317 | 39.7441 | 20.56 | 2.4 | 0.1 | |
| 11 | 76.0337 | 39.7442 | 20.75 | 2.2 | 0.1 | |
| 12 | 76.0376 | 39.7447 | 21.1 | 2.3 | 0.1 | |
| 13 | 76.0413 | 39.7453 | 21.42 | 2.7 | 0.1 | |
| 14 | 76.0442 | 39.7456 | 21.68 | 2.7 | 0.1 | |
| 15 | 76.0487 | 39.7457 | 22.07 | 2.8 | 0.1 | |
| 16 | 76.0507 | 39.7460 | 22.2 | 2.1 | 0.1 | |
| 17 | 76.0534 | 39.7461 | 22.5 | 1.4 * | 0.1 | |
| 18 | 76.0567 | 39.7469 | 22.8 | 1.5 * | 0.1 | |
| 19 | 76.0851 | 39.7469 | 24.6 | 2.5 | 0.1 | |
| 20 | 76.0853 | 39.7469 | 24.6 | 2.4 | 0.1 | |
| 21 | 76.0874 | 39.7475 | 24.7 | 2.2 | 0.1 | |
| 22 | 76.0875 | 39.7476 | 24.7 | 2.2 | 0.1 | |
| 23 | 76.0884 | 39.7479 | 24.8 | 2.5 | 0.1 | |
| 24 | 76.0892 | 39.7485 | 24.8 | 2.6 | 0.1 | |
| 25 | 76.0898 | 39.7489 | 24.9 | 2.4 | 0.1 | |
| 26 | 76.0908 | 39.7495 | 25.0 | 2.6 | 0.1 | |
| 27 | 76.0901 | 39.7491 | 24.9 | 2.2 | 0.1 | |
| 28 | 76.0927 | 39.7510 | 25.2 | 2.6 | 0.1 | |
| 29 | 76.4242 | 39.8462 | 55.6 | 2.5 | 0.2 | |
| 30 | 75.9580 | 39.8271 | 7.4 | 1.9 | 0.2 | KTF |
| 31 | 76.0502 | 39.8579 | 16.0 | 2.5 | 0.2 | |
| 32 | 76.0513 | 39.8579 | 16.1 | 2.2 | 0.2 | |
| 33 | 76.1995 | 39.9204 | 33.5 | 2.3 | 0.1 | |
| 34 | 76.1998 | 39.9209 | 33.6 | 2.3 | 0.1 | |
| 35 | 76.2001 | 39.9212 | 33.6 | 2.8 | 0.1 | |
| 36 | 76.2007 | 39.9215 | 33.7 | 2.9 | 0.1 | |
| 37 | 76.2015 | 39.9220 | 33.7 | 2.8 | 0.1 | |
| 38 | 76.2016 | 39.9221 | 33.8 | 2.8 | 0.1 | |
| 39 | 76.2031 | 39.9228 | 33.9 | 2.6 | 0.1 | |
| 40 | 76.2033 | 39.9229 | 34.0 | 2.6 | 0.1 | |
| 41 | 76.2255 | 39.9355 | 36.7 | 2.6 | 0.2 | |
| 42 | 76.2265 | 39.9372 | 36.9 | 2.7 | 0.2 | |
| 43 | 76.2504 | 39.9628 | 37.7 | 2.5 | 0.2 | |
| 44 | 76.2381 | 39.9421 | 38.0 | 2.7 | 0.2 | |
| 45 | 76.2579 | 39.9490 | 39.9 | 2.7 | 0.2 | |
| 46 | 76.2679 | 39.9539 | 40.9 | 2.6 | 0.2 |
Publisher’s Note: MDPI stays neutral with regard to jurisdictional claims in published maps and institutional affiliations. |
© 2022 by the authors. Licensee MDPI, Basel, Switzerland. This article is an open access article distributed under the terms and conditions of the Creative Commons Attribution (CC BY) license (https://creativecommons.org/licenses/by/4.0/).
Share and Cite
Chen, Q.; Fu, B.; Shi, P.; Li, Z. Surface Deformation Associated with the 22 August 1902 Mw 7.7 Atushi Earthquake in the Southwestern Tian Shan, Revealed from Multiple Remote Sensing Data. Remote Sens. 2022, 14, 1663. https://doi.org/10.3390/rs14071663
Chen Q, Fu B, Shi P, Li Z. Surface Deformation Associated with the 22 August 1902 Mw 7.7 Atushi Earthquake in the Southwestern Tian Shan, Revealed from Multiple Remote Sensing Data. Remote Sensing. 2022; 14(7):1663. https://doi.org/10.3390/rs14071663
Chicago/Turabian StyleChen, Qingyu, Bihong Fu, Pilong Shi, and Zhao Li. 2022. "Surface Deformation Associated with the 22 August 1902 Mw 7.7 Atushi Earthquake in the Southwestern Tian Shan, Revealed from Multiple Remote Sensing Data" Remote Sensing 14, no. 7: 1663. https://doi.org/10.3390/rs14071663