
Accountability and High Impact Journals in the Health Sciences


Department of Physiology, Medical Sciences Building, 1 King’s College Circle, Toronto, ON M5S 1A8, Canada
Publications 2017, 5(1), 5; https://doi.org/10.3390/publications5010005
Submission received: 8 December 2016
/
Accepted: 9 March 2017
/
Published: 13 March 2017
(This article belongs to the Special Issue Alternative Publication Metrics)
Abstract
:As the requirement for accountability and demonstration of the impact of public and privately funded research increases, the practice of attributing impact to research published in high impact journals is on the rise. To investigate the relevance of existing bibliometrics laws to current health research practices, 57 research areas in Web of Science (WoS) representing the major and minor disciplines were studied. In the majority of cases, Garfield’s Law of Concentration is followed with 20% of journals in each area contributing 80% of the total citations. The major multidisciplinary journals formed an anomalous grouping with low overall citation rates, although those documents cited were at a level well above the norm. In all research areas studied, team science is the prevailing norm, single author publications were rarely present in the data sets. For researchers looking to maximize the uptake and recognition of their work, publication in the top journals in the appropriate research area would be the most effective strategy, which does not in many cases include the major multidisciplinary journals.
1. Introduction
In the 21st century there is an increasing societal emphasis on “value for money” or impact of publicly funded research. In the search for quantitative, impartial methods to evaluate research impact, bibliometrics has become increasingly utilized in spite of reservations with respect to limitations with the available methodologies [1,2,3]. Bibliometrics, and the related field Scientometrics, involves the analysis of scientific publication patterns using citations to documents as a proxy for impact, and co-authorship on documents as an indication of scientific collaboration and network activity. Bibliometrics is used for evaluation of academic careers for hiring and tenure decisions, monitoring research output from grants provided by government and private funding agencies and ranking of institutions by companies such as Times Higher Education and Quacquarelli Symonds [4,5].
As the use of bibliometrics has become increasingly common, the fact that high impact documents and journals are not distributed equally has led individuals and institutions to target the high impact journals in a given field [6]. There are a number of bibliometric laws that reflect the concentrated nature of publication practices across all disciplines, starting with Lotka’s Law in 1926, which stated that the majority of authors publish a single paper in a research field, such that prolific authors’ output can be represented as a fixed ratio to the total of the single majority [7]. Price’s Square Root Law contended that 50% of all output in a given research field was contributed by a core set of authors, this core sub-set being equivalent to the square root of all authors in the field [8]. Bradford’s law of dispersion became the foundation for Garfield’s Law of Concentration that contended a publication output of 10%–20% in a given research field was responsible for 80%–90% of the citations to documents published on the area. In addition, Garfield posited that material published in a small number of multi-disciplinary journals served as the main source of information for researchers across numerous fields [9].
This study was initiated to examine how high impact publications are distributed in health sciences research. During the study the relevance of the core bibliometric laws to health sciences publication practices was determined at the level of the research areas in Web of Science (WoS) and individual author output from a sub-group of journals in these research areas.
2. Materials and Methods
2.1. Bibliometrics Data Collection
The data were collected from Thompson Reuters InCites in November 2016, comprising 57 research areas from the 251 provided in the Web of Science (WoS) hierarchy covering the period 2008 to 2014. These WoS areas were selected as they cover the core output of health sciences researchers. The data were segregated into three levels, overall research areas, journal level data for the research areas and for three sub-categories detailed analysis of author level data for a total of 75 journals in each category. In all cases, the citations to publications were collected up to the date of the InCites data upload on 30 September 2016, the current dataset available in November 2016. Previous bibliometric studies in the biosciences have shown peak citation rates occur in years 3–5 post-publication [10], therefore new articles published after 2014 were excluded from the study, as there was insufficient time post-publication to assess citation patterns. The data covered 57 research areas, 10,560 journals and 4,864,439 documents over a seven-year period.
The sub-categories were defined as: Clinical, those research areas with a specific concentration on patient focused research, the journals typically have a large proportion of case studies n = 27 (Surgery, Opthalmology, Paediatrics etc.); Basic Science, those areas with a specific focus on discovery sciences that underpin new approaches in Clinical Sciences, the journals have few if any case studies n = 10 (Biochemistry, Cell Biology, Physiology etc.); Bridge Sciences, these areas have an equal emphasis on discovery and patient focused research and the published documents include patient data derived case studies and discovery sciences n = 13 (Genetics and Heredity, Pathology, Pharmacology and Toxicology, etc.); and Allied Health Sciences n = 7 (Audiology and Speech Sciences, Nursing, Rehabilitation, etc.), see Table 1 for the categories as defined in this study.
Due to the way different multi-disciplinary journals are indexed by WoS, the initial data collection defined a core group of 27 journals considered in health sciences to cross multiple disciplines. Of these 14 appear in the WoS research area “Multidisciplinary Sciences” made up of a total of 82 journals. The multidisciplinary journals were analysed at the document level to determine whether output was sub-divided across different research areas, e.g., Nature, or treated as a single dataset and counted as such across different research areas, e.g., EMBO Journal, or reflected as a single dataset in a single research area, e.g., Journal of Clinical Investigation. For those journals where individual documents were differentially indexed to research areas, providing sufficient documents were published in a given research area in the study time period, the journal was included in the research area analysis at the author level.
As the analysis moved forward an additional complication came from the duplication of entire journal datasets in different research areas. To avoid double counting, a journal of this type was only included in a single category. For example, although Developmental Cell was indexed in both Cell Biology (Basic Sciences category) and Developmental Biology (Bridge category) documents in the journal were only counted in the Cell Biology category.
The data collected from the WoS research areas at the journal level required cleaning to remove books, chapters and conference proceedings. The total number of items indexed was 23,066; of these, 10,560 were active journals (45%). The active journals indexed accounted for 93% of all indexed citable documents as defined for the study (articles, letters and reviews) and 96% of citations to documents in the research areas.
The author level data contained two levels of duplicative entries, firstly multiple entries for the same authors to accommodate different institutional affiliations. The most common were three entries (e.g., Harvard University, and Massachusetts General Hospital and Broad Institute), these represented duplicative entries and were removed using a simple remove duplicates in the excel workbooks. The second level of duplication was less extensive and caused by use of different initials or initials versus first name. These name variant entries referred to different documents authored by the individual, and as these were typically <5% of total entries, the name variants were not removed.
2.2. Data Analysis
2.2.1. Journal Level
The total number of citable documents (articles, letters and reviews) indexed between 2008 and 2014 in the appropriate research area, total citations to these documents between 2008 and September 30th 2016, per cent cited documents and Journal Impact Factor (JIF) were recorded. The per cent cited documents and total citation data were used to calculate the average citations/document. To determine if Garfield’s Law of Concentration applied at the journal level the percentage of total citations from the top 10% and 20% of journals publishing the greatest number of documents (Journals by Output, JO) and the top 10% and 20% of journals with the highest citations to published documents (Journals by Impact, JI) were calculated and compared to the expected 80%–90% concentration level. In addition, the average citations per document for the four health sciences sub-categories was analysed to evaluate if there were differences in citation patterns.
2.2.2. Author Level
The journals to be analysed in depth were selected using the following criteria: >300 documents indexed between 2008 and 2014 in the appropriate research area, JIF >2.0, and >85% indexed documents cited during the study period (up to 30 September 2016). The full author listing for each journal was collected and institution duplicates removed. Once the institutional duplicates were removed the total number of authors, documents and citations for each journal was recorded. For each journal two correction factors were required to normalize the data. Firstly, to account for multiple authors on single publications, the total number of all documents listed in the author data pull was divided by the actual number of documents indexed by InCites for the journal. This provided an average of the authors/document for that journal which was used as a normalization factor in further analysis of the output from the journal. The second normalization factor was required to account for the non-linear distribution of citations to documents. The total number of citations to all papers by all authors was divided by the actual citation count attributed to the journal in InCites, this provided an average citations per document that was used in subsequent calculations of author level citation data.
The author level data were collected in three sub-categories, Basic Science, Clinical Sciences and Bridge Sciences, from a total of 75 journals from each category, and the power calculations confirmed that in each case the sample size was sufficient to avoid type 1 and type 2 errors. This covered 2,281,960 authors and 502,006 documents over the seven-year period.
The data were analysed to assess the following across the three categories: average authors/paper, average citations/paper, Garfield’s Law of Concentration of citations by comparing the citations obtained from the top 10% and 20% of authors selected by either total output or total citations; Price’s Square Root Law by calculating number of authors covered and comparing to the 10% total for the Garfield analysis. Pivot tables were used to provide author distribution data to determine if health sciences research followed Lotka’s Law of authorship.
2.2.3. Statistical Analysis
Power analyses were completed for each data grouping to ensure sufficient journals/authors were analysed to complete the statistical testing. A statistical significance of α = 0.05 was used for the power calculations. For each dataset, the mean, standard deviation and standard error of the mean were calculated and significance of variance from expected was assessed using either the t-test for data with a normal distribution or the Chi squared test for data with a non-parametric distribution, significance was set at p < 0.01.
3. Results
3.1. Journal Level Analysis
Multi-Disciplinary Journals: Analysis of the indexing pattern of the major health sciences cross disciplinary journals revealed three variations. The first, seen in 17 of the 25 journals investigated in this category, involved categorizing individual articles in the journal into different research areas. The number of research areas covered ranged from 206 (Public Library of Science one (PLoS ONE)) to 46 (Journal of the American Medical Association (JAMA)) (Table 2). The JIF of these multi-disciplinary journals ranged from 56 (New England Journal of Medicine (NEJM)) to 3.2 (PLoS ONE). Publication in the major multi-disciplinary journals did not guarantee uptake as measured by citations: the data showed that on average 80% of all published documents were cited (Table 2). An in-depth look at the research areas receiving citations in these journals showed in most cases that there were a small number with no citations (Table 3). These research areas were usually not in the core subject focus for the journal, e.g., in NEJM, the seven areas receiving no citations included single documents in linguistics, remote sensing and statistics and probability. An examination of publication practices across the top 10 multidisciplinary journals that accounted for 88% of the documents in the selected multi-disciplinary journals, demonstrated that nine out of ten (PNAS, Nature, Nature Communications, Nature Medicine, Science, Lancet, NEJM, JAMA, and Cochrane Data Base of Systematic Reviews) maintained a steady annual publication rate, the exception was PLoS ONE which increased from <3000 documents in 2008 to >30,000 documents in 2014. In spite of the rapid rise in open, on-line publication, 95% of the documents were cited over the seven-year period, indicating a rapid uptake and acceptance of the journal by the scientific community.
The second way of indexing the multi-disciplinary journals was to double or triple count all publications in the journal in two or three research areas. Of the journals investigated, eleven were indexed in this manner (Table 2). Finally, a journal considered in health sciences research to cover multiple-disciplines was indexed under a single research area; in the current study, the Journal of Clinical Investigation fell into this group (Table 2).
3.2. Journal Analysis Bibliometric Laws
Garfield’s Law of Concentration: The assessment of whether publication practices in health sciences research followed Garfield’s Law of Concentration (i.e., 10%–20% of documents are responsible for 80%–90% of citations) was completed in two groupings. Firstly, the percentage of citations to documents in the top 10% and 20% JO and secondly, the percentage of citations to documents in the top 10% and 20% JI. Variance from the expected 80% of total citations was assessed using a Chi squared test for unequal variance. The analysis was completed on 57 research areas, involving 10,560 journals and 4,864,439 publications. Although there was considerable variation across the journals, 20% of journals by JO represented 78% ± 11% of citations (p < 0.001) and 20% by JI represented 83% ± 9% (NS). These data indicated that at the 20% level, there was no significant difference between the citations received and the 80% required for Garfield’s Law of Concentration (Table 4). There were two research areas with low levels of citation concentration: Medial Ethics and Nursing at 58% and 66% of citations, respectively. The analysis at the 10% level for both JO and JI resulted in significantly lower citation percentages and were not consistent with Garfield’s Law (data not shown).
3.3. Comparison Across Categories
There was a wide variation in the size of the publication communities across the different WoS research areas and four health science categories. The total number of journals and publications indexed in WoS in each research area was used to compare the size of the communities. In addition, the average number of citations per document was compared across the categories to examine if there were differences in citation patterns. There were no significant differences between the average citations per document among the Basic, 15.9 ± 5; Clinical, 11.1 ± 4; and Bridge, 14.6 ± 4 categories; however, the Allied Health category average at 8.1 ± 2 was significantly lower than all the other categories (unpaired t-test p < 0.01).
4. Author Level Analysis
The author level analysis was completed on three of the four categories: the Allied Health category was not included due to the small sample size and significant difference in publication patterns. The analysis covered 75 journals in each category that met the following criteria: JIF > 2, # of documents in the research area >300 and >85% of documents in the journal receiving citations. For the three categories, this covered: Basic, 197,058 documents receiving 5,212,065 citations; Clinical, 162,863 documents receiving 3,377,602 citations; and Bridge, 142,085 documents receiving 2,783,779 citations. The research areas involved in the author level analysis were: Basic: Biophysics, Cell Biology, Immunology and Physiology; Clinical: Endocrinology and Metabolism, Cardiac and Cardiovascular systems, Obstetrics and Gynaecology; and Bridge: Developmental Biology, Pathology, Pharmacology and Pharmacy and Toxicology.
The author level analysis examined if three main bibliometric laws were followed by health sciences research publication pattern namely: Lotka’s, Price’s and Garfield’s Laws.
4.1. Author Analysis Bibliometric Laws
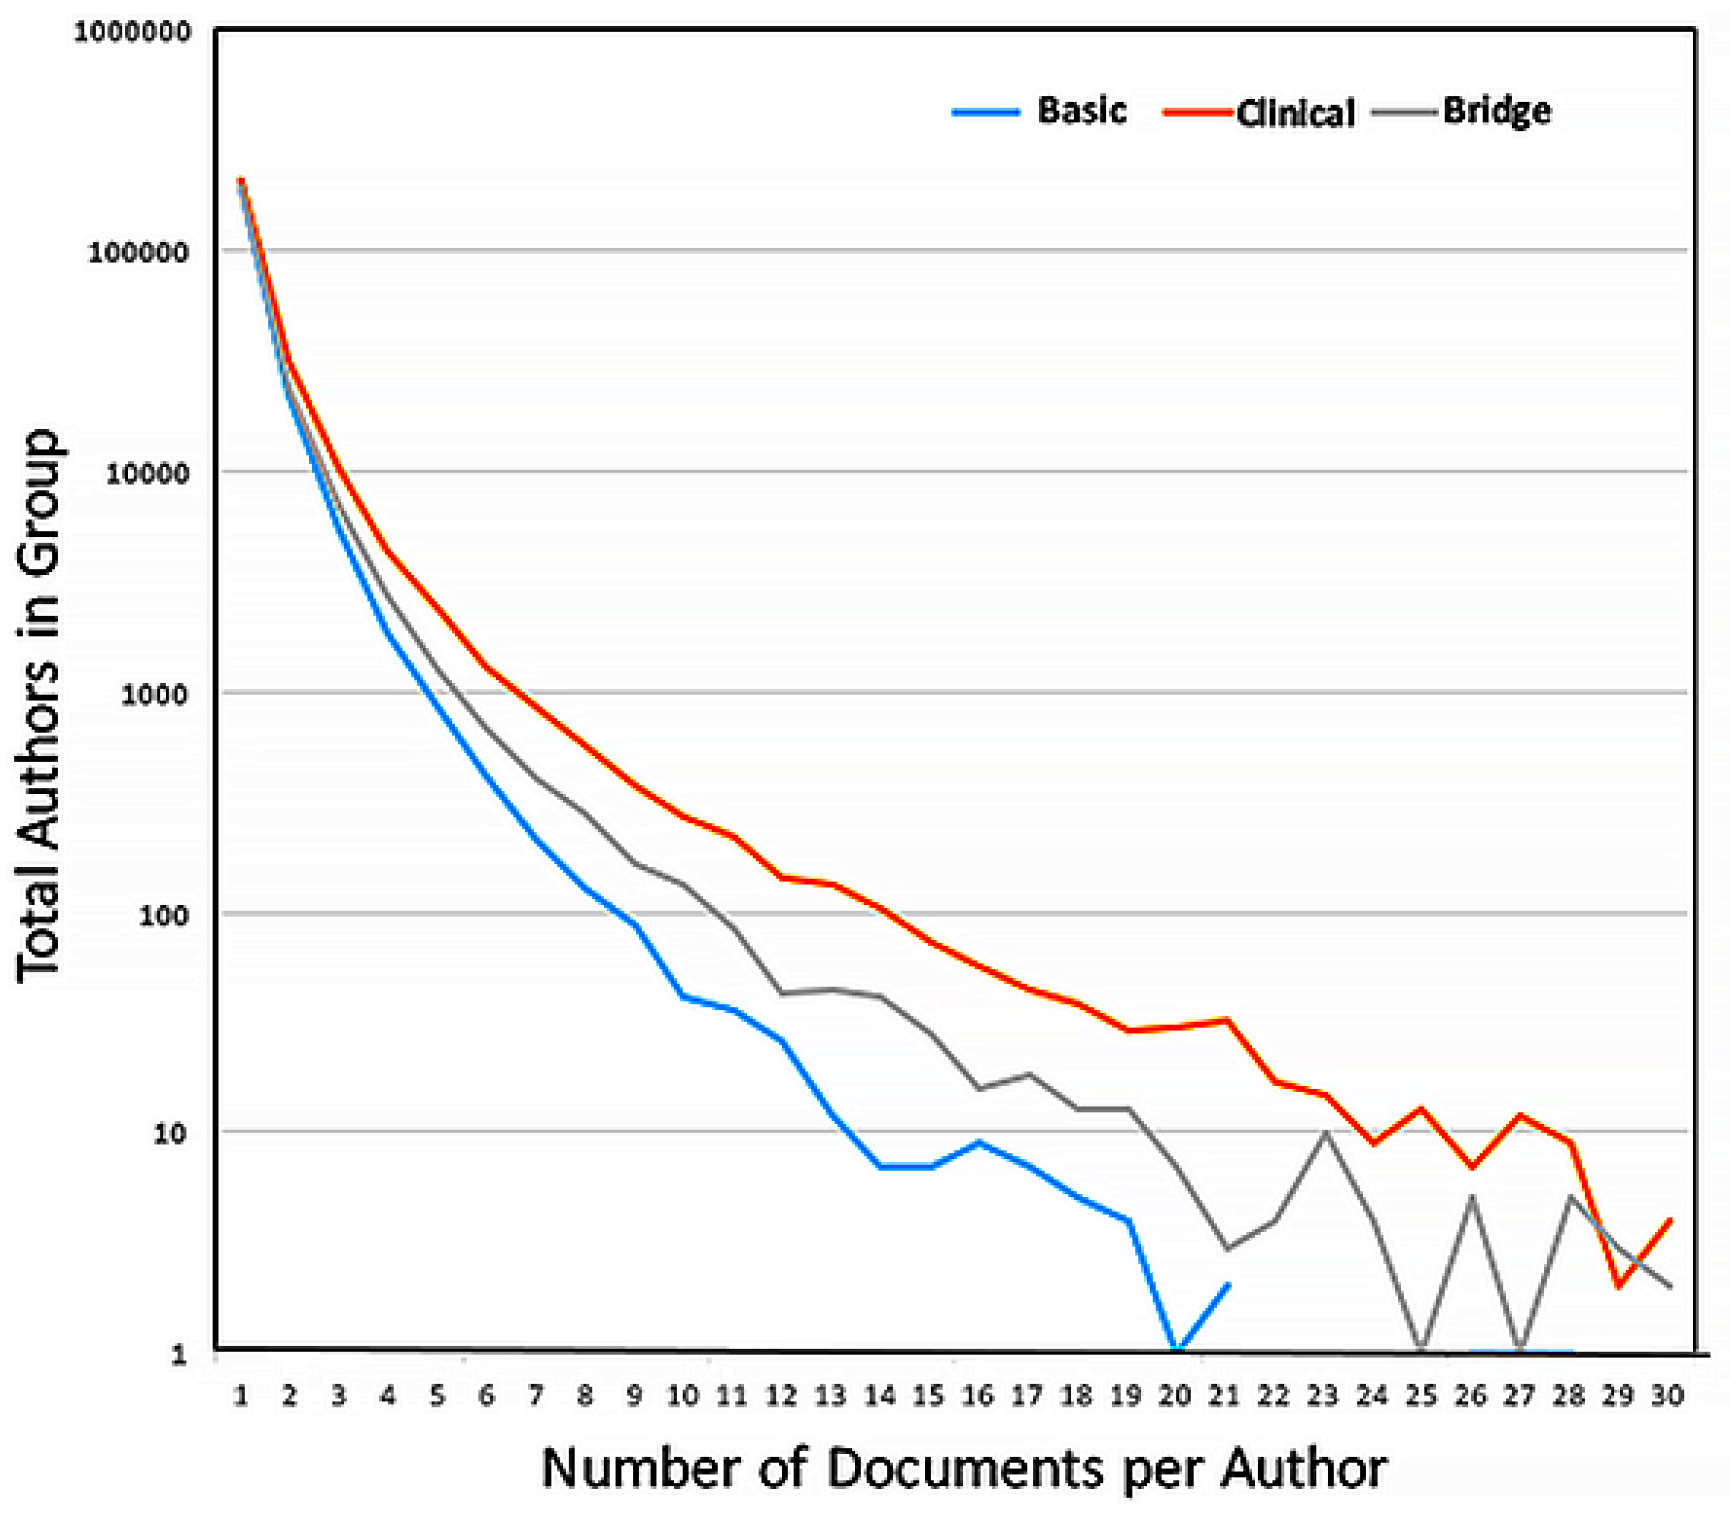
Lotka’s Law: The number of authors publishing a single paper in a journal exceeded repeat authors by 19 fold forming 83% of all authors (607,120 compared to 120,502 in all other groups). The extent of the tail in the distribution varied between categories: the authors in the Clinical category produced the greatest number of documents per author, with 14 authors publishing >50 papers in a single journal during 2008–2014, an average of seven documents each year. The distribution data were graphed using a logarithmic scale to account for the magnitude of the decrease in the number of authors publishing multiple documents in a single journal (Figure 1). The current study did not examine the total number of documents authored by a single author in all journals during this period.
Price’s Square Root Law: The question of whether 50% of all output in a given research field was contributed by a core set of authors, with this core sub-set being equivalent to the square root of all authors in the field was examined. Although there was a large variance in the number of authors contributing to individual journals, the mean number of authors included using the square root law was always significantly less than the number covered in the top 10% of all authors (Table 5). There was no significant difference between categories with respect to the percentage of documents contributed by the top 10% of authors (Table 5) at <30% of all documents, which indicated that health research publications do not follow Price’s Square Root Law.
Garfield’s Law of Concentration: The analysis of publication patterns by authors in the three categories was compared for the top 10% of authors selected either for high output (AO) or high citation counts (AI). In both cases, these authors were responsible for approximately 20% of all documents in the journals examined (Table 5). These documents received <50% of citations to all documents in the journals indicating that, at the individual author level, health research does not follow Garfield’s law of concentration.
4.2. Comparison Across Categories
4.2.1. Data Cleaning
Removal of the author duplicates resulting from multiple Institutional affiliations resulted in removal of approximately 20% of entries: Basic, 22%; Clinical, 20%; and Bridge, 17%.
4.2.2. Authors per Document
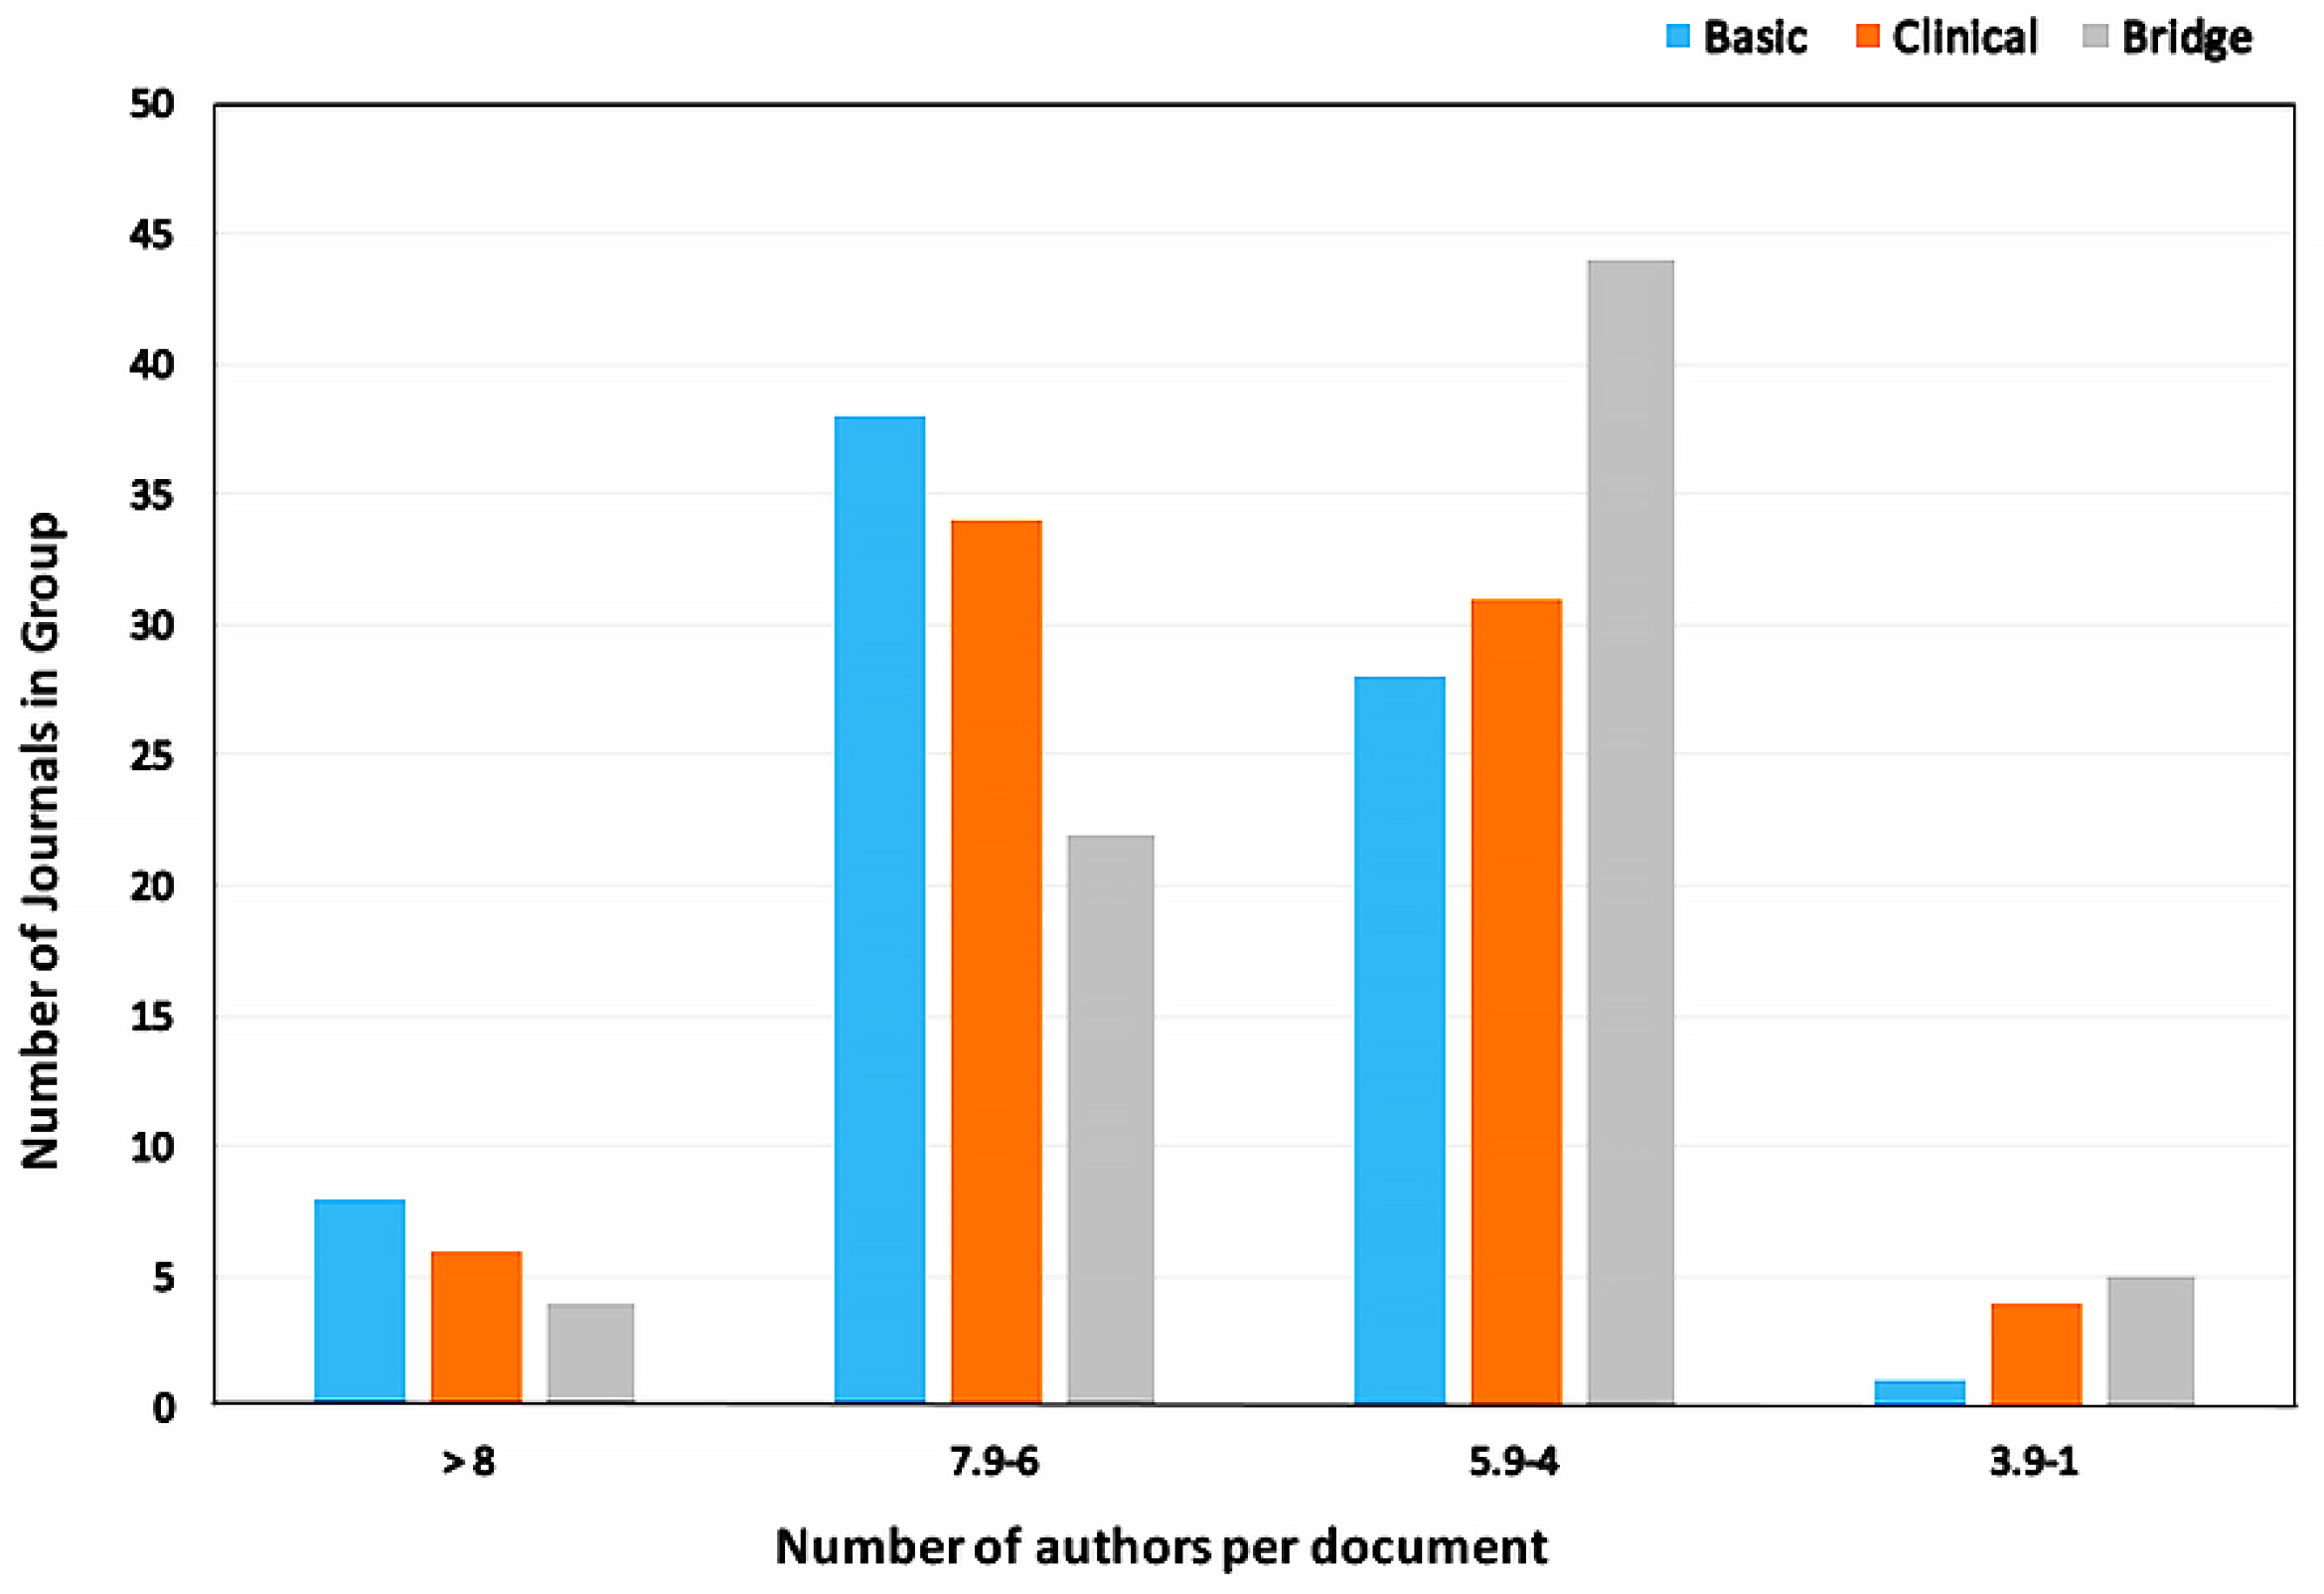
The average authors per document were compared across the three categories, the overall averages were: Basic, 6.3 ± 1.5; Clinical, 5.9 ± 1.4; and Bridge, 5.6 ± 1.1. There was no significant difference between the authors/document between Basic and Clinical categories, however there was a significant difference between Basic and Bridge categories (p < 0.01). The difference was accounted for by the high number of documents with 4–5.9 authors per document in the Bridge category (Figure 2).
4.2.3. Citations per Document
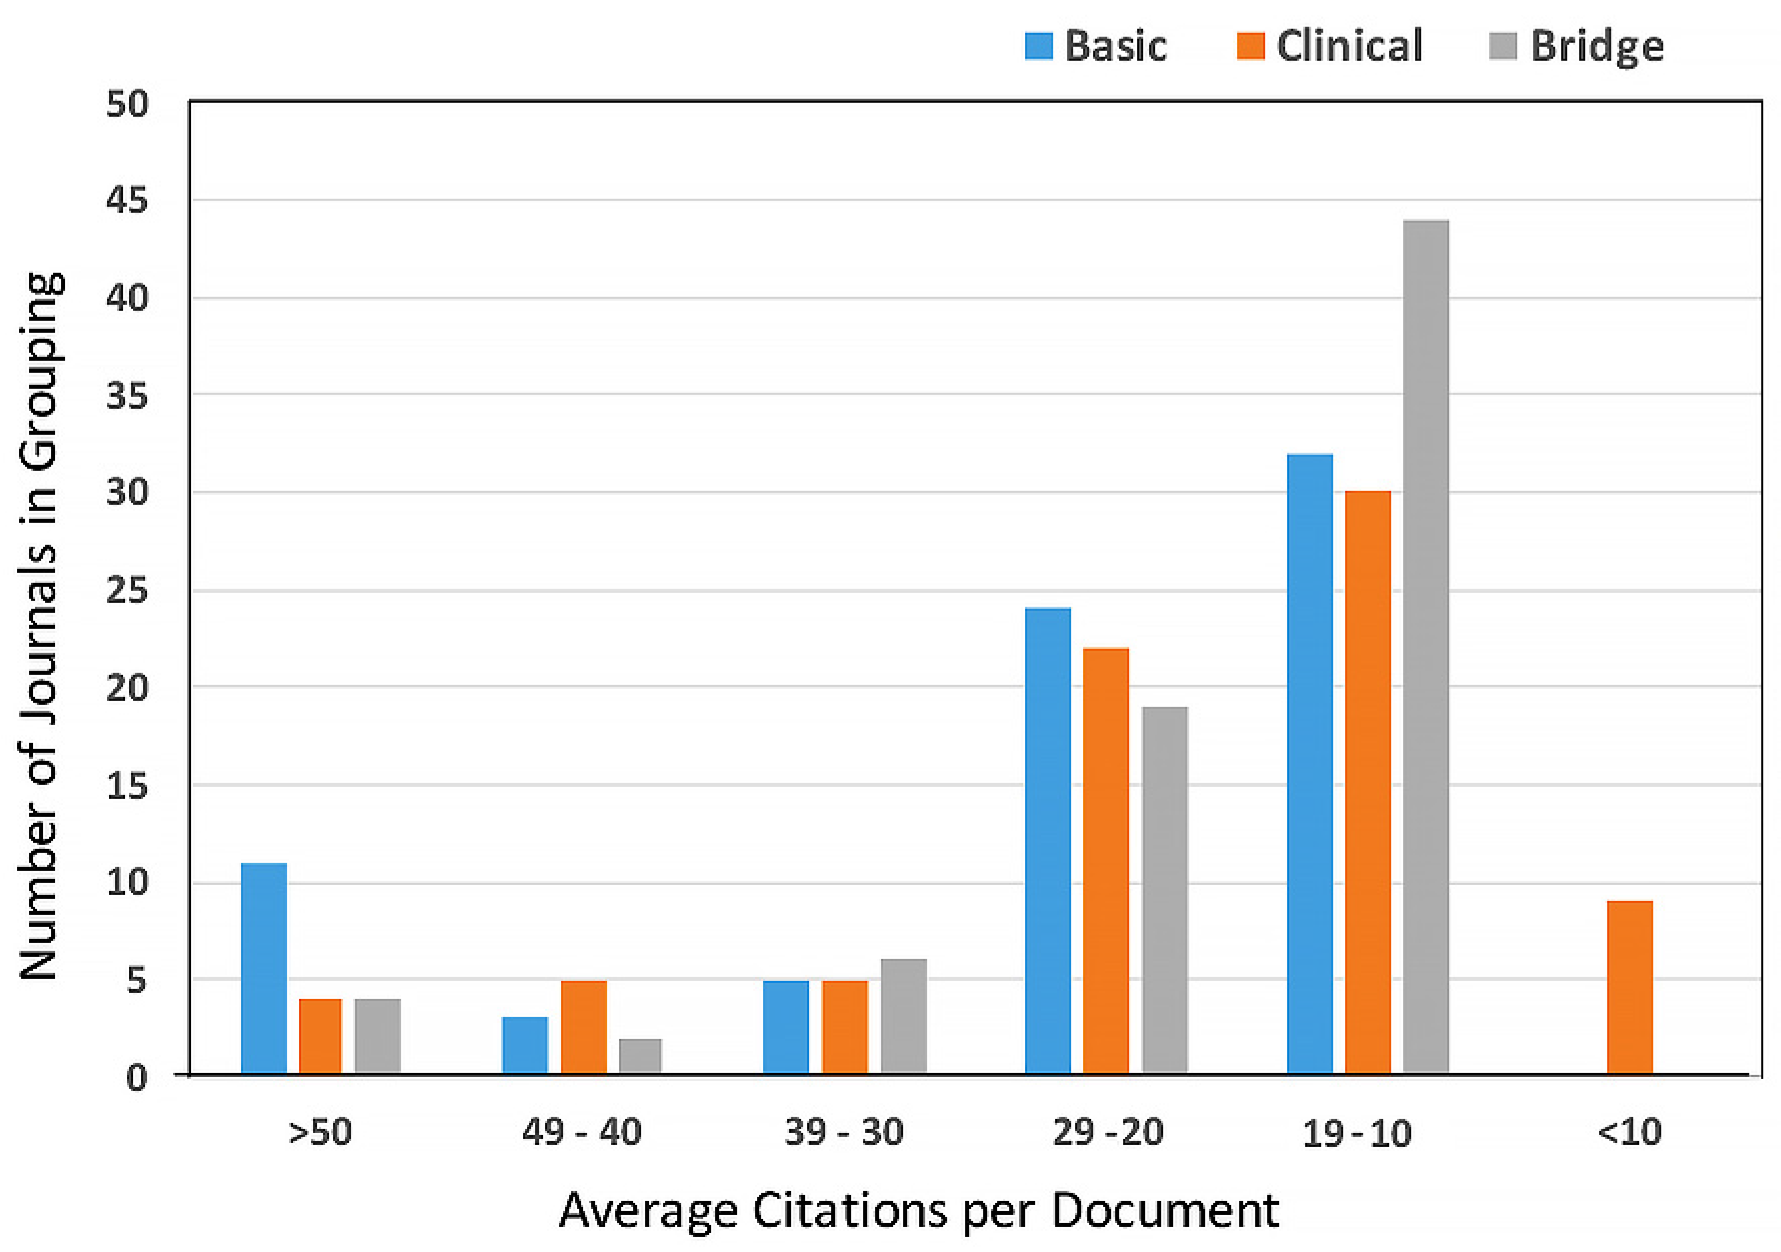
The power analysis indicated that the high variance seen for the average citations to documents precluded completing a statistical analysis for differences between the categories. Figure 3 shows the distribution of citations for the three categories; note the concentration of documents receiving between 10 and 19 citations in all three categories.
4.3. Distribution of JIF
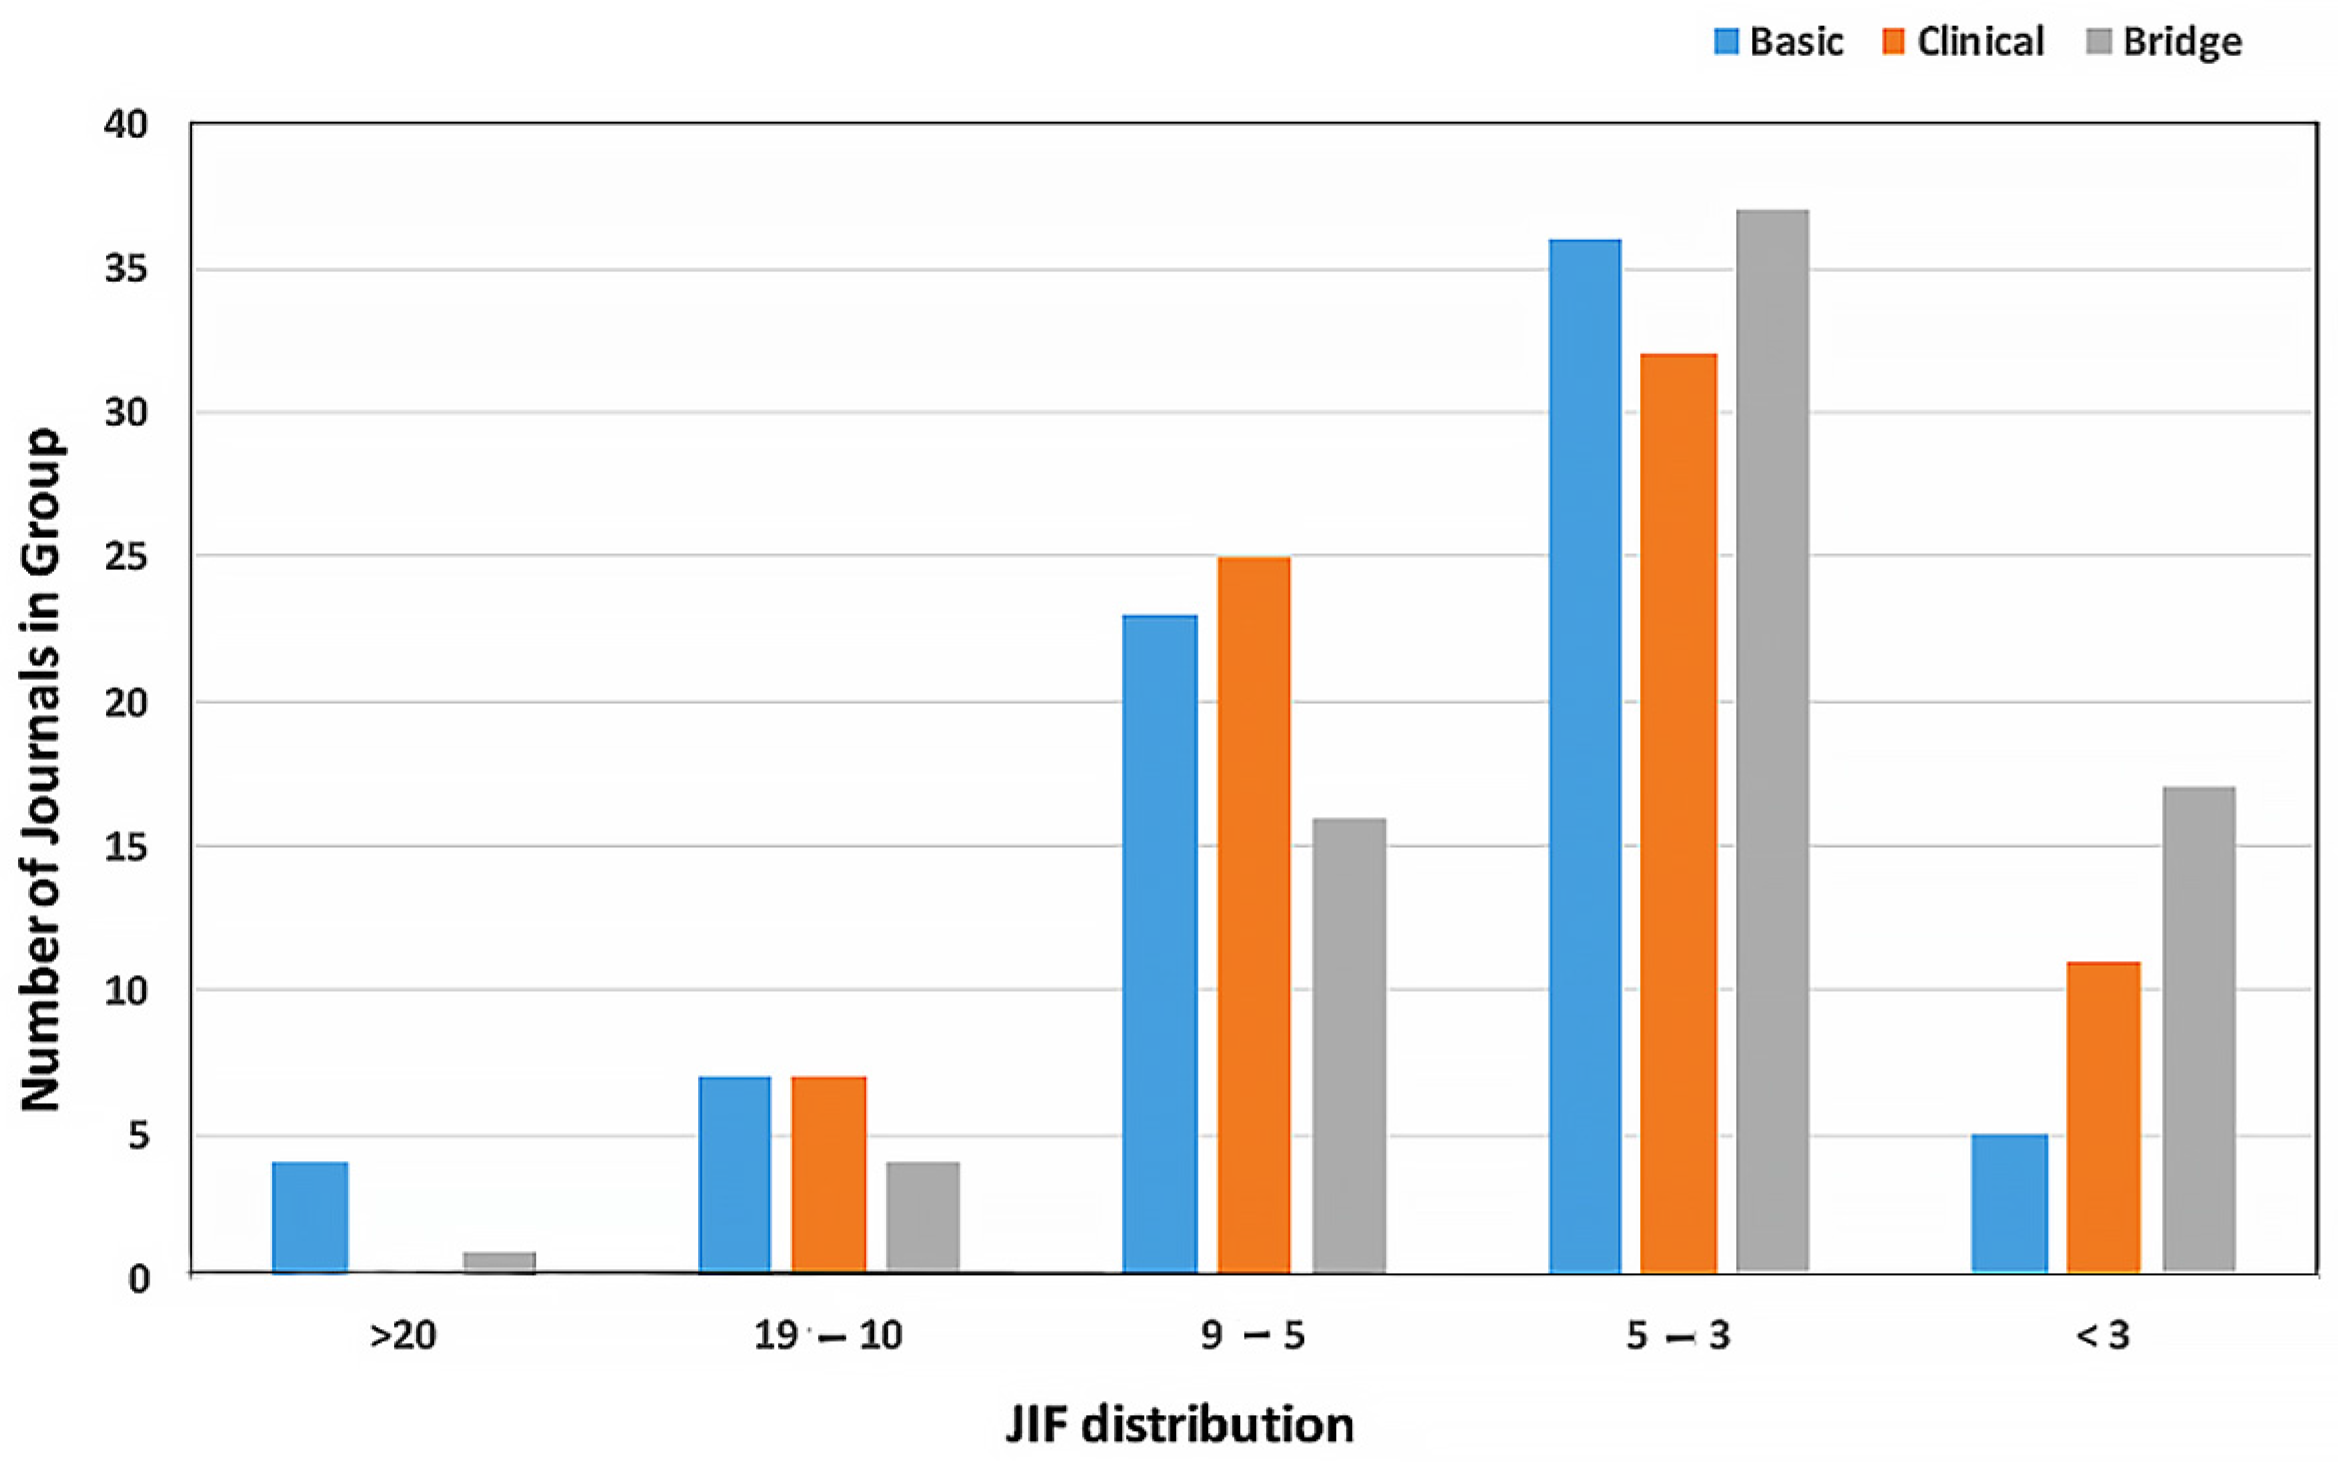
A comparison of the JIF of the selected journals was biased by the selection criteria used, and the majority of the multidisciplinary journals were not represented in any of the categories as the number of documents in a research area failed to reach the minimum number of 300 over the seven years covered by the study. The exceptions to this were PNAS and PLoS ONE: PNAS had >300 documents in Immunology and Developmental Biology areas and PLoS ONE in Cell Biology, Cardiac and Cardiovascular systems and Immunology. In all three categories, the largest group of journals were between JIF 4.0 and 4.9 (Figure 4).
5. Discussion
The data analysed during this study was gathered from TR InCites and concentrated on the research areas in WoS covering health sciences research. There are two conflicting views of health sciences publications: the first contends that there is an almost exponential increase in output in the area causing scientists problems in remaining current in their fields [11]; and the second is that the number of journals is relatively constant and that within these there is a small core of journals that publish the most highly cited articles [12]. In the current study, the 57 research areas relevant to health sciences research were represented by 23,066 items indexed under Journals, Books and Conference Proceedings; of these, less than 50% were journals available to scientists to submit original research studies and to follow new research in their fields. Analysis of citation patterns to the 10,560 journals showed that Garfield’s Law of Concentration was valid, i.e., that 20% of the documents received 80% of the citations. This held true whether the journals analysed were selected by the highest output of documents in the research area (JO) resulting in 78% ± 11% of citations or by impact as indicated by the highest level of citations to documents (JI) resulting in 83% ± 9% of citations. These data covered the time period 2008–2014 indicating that the advent of online search and download abilities have not altered the behaviour of researchers in the health sciences with respect to citing previous work in their field, at least for those journals indexed in WoS.
The analysis of the major multidisciplinary journals was undertaken separately due to the high percentage of documents in these journals that were not cited in the time period studied and the low number of documents indexed in a single research area. The investigation of multidisciplinary journals was complicated further by the differing ways in which the journals were indexed in WoS. There were two main variations: first, to sub-categorize documents in each journal to different research areas, of the 27 multidisciplinary journals analysed, 15 fell into this group; and, second, variation was to double or triple count all documents in the journal in two or three research areas, 11 of the journals were in this group. For bibliometricians using WoS research areas to examine publication activity, the different ways of indexing journals should be taken into account to avoid double counting author contributions, documents and citations.
In the thirty years since Garfield’s 1986 study of medical journals, the top multi-disciplinary journals remained the same, i.e. NEJM, Lancet, JAMA, Annals of Internal Medicine and BMJ [13]. A consistent finding in the two studies was that, although those documents that were cited received higher than average numbers, a percentage of documents received no citations. The current study cannot comment on whether the phenomenon of un-cited documents was a common feature of all multi-disciplinary journals. However, the finding will be followed up in an on-going analysis of the 82 multi-disciplinary journals indexed by WoS. The biggest change in the 30 years was a dramatic increase in the citations received by documents in JAMA and NEJM. In the 1986 study covering 1977 to 1982, 4316 documents in JAMA received 13,217 citations compared to 4356 documents and 198,307 citations between 2008 and 2014, a 15-fold increase. The NEJM in the earlier time period published 5869 documents that received 62,474 citations compared to 7959 documents that received 574,436 citations in 2008–2014, a nine-fold increase. The Lancet and Annals of Internal Medicine also showed increased citation numbers, however these were more modest at four-fold above the earlier counts. The increase in citations could not be accounted for by either an increase in documents published in the journals or by an increase in the percentage of documents receiving citations with an average of 57% cited in the 1986 study and 64% in the current study. The most likely explanation for the increased citation counts is the significant growth in numbers of active researchers in the health sciences in the last 30 years who are following the same citation pattern of citing the top 20% of published documents.
The consistent citation pattern seen in the top multi-disciplinary journals indicated that research areas represented by a low number of documents were the most likely to receive no citations. For researchers outside the core research areas publishing in these journals if the intent was to expose a wider readership to their research this would be a valid strategy. However, if the intent was to gain wider acknowledgement and uptake of their work (using citations as a proxy measure), this is a high-risk strategy. For the latter, it would be more effective to publish in a high impact journal in the appropriate research area, the majority of which have >90% citation rates.
A second bibliometric law appropriate for current health sciences publications practices was Lotka’s Law [7]. Authors publishing a single document in a journal represented over 80% of all authors. It should be noted that this study did not examine the total publication output of authors, only the output at a journal level. The third law, Price’s Square Root Law, did not apply to health sciences publication patterns; this finding was consistent with previous studies demonstrating an incompatibility between datasets conforming to Lotka’s and Price’s Laws simultaneously [14]. In all cases, the number of authors represented by the square root of the total were responsible for <10% of all documents and <20% of all citations. While the high number of authors publishing a single document per journal, consistent with Lotka’s Law, accounted for part of the discrepancy, a second factor may be the prevalence of multi-author papers in the health sciences. In health sciences research, the most common modality is represented by collaborative individuals, with complementary expertise, working together either in a single laboratory or across multiple laboratories, known as team science. In this study, the average collaborative team size on a single document in all three categories was six co-authors. In order to claim authorship of a document, the scientists should have made a significant contribution to the research and been actively involved in the preparation of the manuscript. Across the three categories examined at the individual author level, the number active collaborators in the research teams was concentrated between four and eight scientists per document, while less than 10% of documents in all three categories had more than eight co-authors.
6. Conclusions
This study examined publication practices across 57 WoS defined research areas relevant to the health sciences. In the majority of research areas, Garfield’s Law of Concentration applied at the journal level, with 20% of journals contributing 80% of all citations on the topic. The data show that, at an individual author level, the only law with relevance to health sciences research publication practices was Lotka’s law; Price’s and Garfield’s Laws did not reflect output or citation practices.
Although there was considerable variation in the absolute numbers across the research areas, the use of percentages to total document output and citations reduced the variation and in the majority of cases enabled statistical comparisons to be completed. When comparing journal output and citations across four sub-categories of health sciences, Allied Health had significantly different publication patterns with lower numbers of journals, authors and citations to documents, reflecting the smaller size of the overall research community in these research areas, at least as reflected in WoS. When using bibliometrics as a proxy for impact assessment in research evaluations, the way in which journals are indexed must be taken into account, as well as the wide variations across research areas even in the a single large field such as health research.
Conflicts of Interest
The author declares no conflict of interest.
References
- Seglen, P.O. Why the impact factor of journals should not be used for evaluating research. BMJ 1977, 314, 497. [Google Scholar] [CrossRef]
- Moed, H.F.; van Leeuwen, T.N.; Reedikj, N.J. Towards appropriate indicators of journal impact. Scientometrics 1999, 46, 575–589. [Google Scholar] [CrossRef]
- Adler, R.; Ewing, J.; Taylor, P. Citation Statistics: A report from the International Mathematical Union (IMU) in Cooperation with the International Council of Industrial and Applied Mathematics (ICIAM) and the Institute of Mathematical Statistics (IMS). Available online: http://www.mathunion.org/fileadmin/IMU/Report/CitationStatistics.pdf (accessed on 10 March 2017).
- Frank, C.; Nason, E. Health research: Measuring the social, health and economic benefits. Can. Med. Assoc. J. (CMAJ) 2009, 180, 528–534. [Google Scholar] [CrossRef] [PubMed]
- Lowy, C. Impact factor limits funding. Lancet 1997, 350, 1035. [Google Scholar] [CrossRef]
- El-Omar, E. How to publish a scientific manuscript in a high-impact journal. Adv. Dig. Med. 2014, 1, 105–109. [Google Scholar] [CrossRef]
- Lotka, A.J. The frequency distribution of scientific productivity. J. Wash. Acad. Sci. 1926, 16, 317–323. [Google Scholar]
- Price, D.J.D. Little Science, Big Science; Columbia University Press: New York, NY, USA, 1963. [Google Scholar]
- Garfield, E. The Mystery of the Transposed Journal Lists—Wherein Bradford’s Law of Scattering Is Generalized According to Garfield’s Law of Concentration, Current Content No. 7 5(August 4 I971) Reprinted in Essays of an Information Scientist; ISI Press: Philadelphia, PA, USA, 1977; Volume 1, pp. 222–223. [Google Scholar]
- Archambault, E.; Lariviere, V. The limits of Bibliometrics for the analysis of the Social Sciences and Humanities Literature. In World Social Science Report 2010; UNESCO Publishing: Paris, France, 2010. [Google Scholar]
- Larsen, P.O.; von Ins, M. The rate of growth in scientific publication and the decline in coverage provided by Science Citation Index. Scientometrics 2010, 84, 575–603. [Google Scholar] [CrossRef] [PubMed]
- Garfield, E. The significant science literature appears in a small core of journals. Scientist 1996, 10, 5. [Google Scholar]
- Garfield, E. Which medical journals have the greatest impact? Am. Coll. Phys. 1986, 106, 313–320. [Google Scholar] [CrossRef]
- Nicholls, P.T. Price’s square root law: Empirical validity and relationship to Lotka’s Law. Inf. Process. Manag. 1988, 24, 469–477. [Google Scholar] [CrossRef]
Figure 1.
Distribution of the number of papers submitted by individual authors in the category journals.
Figure 1.
Distribution of the number of papers submitted by individual authors in the category journals.

Figure 2.
Distribution of co-authors across the three categories.

Figure 3.
Distribution of citations per document for the three categories.

Figure 4.
Distribution of Journal Impact Factors across the categories.


| Clinical | (n = 27) | Basic (n = 10) | Bridge (13) | Allied Health Sciences (n = 7) |
|---|---|---|---|---|
| Anaesthesiology | Orthopaedics | Anatomy and Morphology | Allergy | Audiology and Speech Sciences |
| Andrology | Otorhinolaryngology | Biochemistry | Developmental Biology | Health Care Sciences and Services |
| Cardiac and Cardiovascular Systems | Paediatrics | Biophysics | Genetics and Heredity | Health Policy and Services |
| Clinical Neurology | Peripheral Vascular Sciences | Cell Biology | Haematology | Medical Ethics |
| Critical Care Medicine | Primary Health Care | Immunology | Infectious Disease | Nursing |
| Dermatology | Psychiatry | Material Sciences Biomaterials | Medical Laboratory Technology | Public Environmental and Occupational Health |
| Emergency Medicine | Psychology Clinical | Medical Informatics | Medicine Research and Experimental | Rehabilitation |
| Endocrinology and Metabolism | Reproductive Biology | Neurosciences | Neuroimaging | |
| Gastroenterology and Hepatology | Rheumatology | Nutrition and Dietetics | Pathology | |
| Geriatrics and Gerentology | Substance Abuse | Physiology | Pharmacology and Pharmacy | |
| Medicine General and Internal | Surgery | Radiology Nuclear Medicine Medical Imaging | ||
| Obstetrics and Gynaecology | Transplantation | Respiratory System | ||
| Oncology | Urology and Nephrology | Toxicology | ||
| Ophthalmology |
| Journal | JIF | # Research Areas Covered | Total Docs in All Areas | % Cited |
|---|---|---|---|---|
| PLoS ONE | 3.2 | 206 | 11,2621 | 96 |
| PNAS | 9.7 | 163 | 26,988 | 99 |
| Science | 33.6 | 139 | 7591 | 89 |
| Nature | 41.5 | 110 | 7977 | 89 |
| Nature Communications | 11.5 | 86 | 5689 | 99 |
| Lancet | 45.2 | 79 | 5633 | 71 |
| New England Journal of Medicine | 55.9 | 73 | 7977 | 65 |
| JAMA | 35.3 | 72 | 4356 | 62 |
| BMJ-British Medical Journal | 17.4 | 62 | 1948 | 57 |
| Cochrane Database of Systematic Reviews | 6.0 | 62 | 5366 | 90 |
| Canadian Medical Association Journal | 6.0 | 57 | 1367 | 63 |
| Annals of Internal Medicine | 17.8 | 53 | 2432 | 64 |
| PLoS Medicine | 14.4 | 50 | 813 | 99 |
| Journal of Internal Medicine | 6.1 | 48 | 829 | 92 |
| JAMA Internal Medicine | 13.0 | 46 | 847 | 70 |
| FASEB Journal * | 5 | 3 | 3108 | 98 |
| Genome Research * | 14.6 | 3 | 1429 | 100 |
| Nature Medicine * | 28.2 | 3 | 11,248 | 96 |
| Federation of Biological Sciences (FEBS) Letters * | 3.2 | 3 | 4511 | 98 |
| Placenta * | 2.7 | 3 | 1320 | 95 |
| Cell * | 32.2 | 2 | 2675 | 99 |
| Molecular Cell * | 14 | 2 | 2098 | 100 |
| EMBO Journal * | 10.4 | 2 | 2061 | 100 |
| EMBO reports * | 9 | 2 | 896 | 95 |
| Journal of Physiology London * | 9 | 2 | 2857 | 98 |
| Journal Experimental Medicine * | 12.5 | 2 | 1575 | 100 |
| Journal of Clinical Investigation | 13.0 | 1 | 2738 | 99 |
* Journals with duplication of entries across research areas.
| Journal | # Research Areas | Total Docs | 100% | 99%–90% | 89%–50% | 49%–1% | 0% | JIF |
|---|---|---|---|---|---|---|---|---|
| Annals Internal Medicine | 58 | 2432 | 19 | 3 | 29 | 2 | 5 | 17.8 |
| Arch Internal Med | 53 | 2004 | 21 | 3 | 24 | 1 | 4 | 17.3 |
| BMJ | 62 | 1948 | 21 | 3 | 30 | 3 | 5 | 17.4 |
| JAMA | 74 | 4356 | 17 | 2 | 17 | 27 | 10 | 35.3 |
| Lancet | 79 | 5633 | 27 | 5 | 38 | 1 | 8 | 45.2 |
| Nature | 110 | 7977 | 69 | 19 | 15 | 0 | 7 | 41.4 |
| Nature Communications | 86 | 5689 | 69 | 16 | 1 | 0 | 0 | 11.5 |
| NEJM | 73 | 7958 | 18 | 0 | 47 | 1 | 7 | 55.8 |
| PLoS Medicine | 50 | 813 | 47 | 3 | 0 | 0 | 0 | 14.4 |
| PLoS ONE | 206 | 112,621 | 45 | 104 | 53 | 2 | 2 | 3.2 |
| PNAS | 163 | 26,988 | 113 | 45 | 5 | 0 | 0 | 9.7 |
| Science | 139 | 7591 | 85 | 21 | 26 | 0 | 7 | 33.6 |
| Journal of Internal Medicine | 48 | 829 | 34 | 9 | 4 | 0 | 1 | 6.1 |
| Canadian Medical Association Journal | 57 | 1367 | 19 | 4 | 29 | 2 | 3 | 6 |
| JAMA Internal Medicine | 46 | 847 | 16 | 2 | 20 | 4 | 4 | 13 |
| Cochrane Database of Systematic Reviews | 62 | 5366 | 20 | 21 | 20 | 1 | 0 | 6 |
| Research Area Grouping | %Total Docs in Area Mean ± SD | % Total Cites in Area Mean ± SD | Chi-Squared Test Variance from 80% |
|---|---|---|---|
| 10% JO | 52 ± 11 | 60 ± 13 | p < 0.001 |
| 20% JO | 73 ± 11 | 78 ± 11 | NS |
| 10% JI | 47 ± 12 | 64 ± 12 | p < 0.001 |
| 20% JI | 69 ± 12 | 83 ± 9 | NS |
| Category | Square Root of Total Authors | 10% Total Authors | % Total Docs from Top 10% Authors by AO | % Total Citations from Top 10% Authors by AO | % Total Docs from Top 10% Authors by AI | % Total Citations from Top 10% Authors by AI |
|---|---|---|---|---|---|---|
| Basic | 102 ± 34 | 1085 ± 1535 | 27.5 ± 5 | 27.5 ± 6 | 18 ± 5 | 41 ± 5 |
| Clinical | 87 ± 31 | 767 ± 629 | 28 ± 6 | 30.7 ± 7 | 22 ± 5 | 44 ± 7 |
| Bridge | 87 ± 25 | 727 ± 490 | 24.3 ± 5 | 26 ± 6 | 18 ± 4 | 41 ± 5 |
© 2017 by the author. Licensee MDPI, Basel, Switzerland. This article is an open access article distributed under the terms and conditions of the Creative Commons Attribution (CC BY) license ( http://creativecommons.org/licenses/by/4.0/).
Share and Cite
MDPI and ACS Style
Buchan, A.M.J. Accountability and High Impact Journals in the Health Sciences. Publications 2017, 5, 5. https://doi.org/10.3390/publications5010005
AMA Style
Buchan AMJ. Accountability and High Impact Journals in the Health Sciences. Publications. 2017; 5(1):5. https://doi.org/10.3390/publications5010005
Chicago/Turabian StyleBuchan, Alison M. J. 2017. "Accountability and High Impact Journals in the Health Sciences" Publications 5, no. 1: 5. https://doi.org/10.3390/publications5010005
Note that from the first issue of 2016, this journal uses article numbers instead of page numbers. See further details here.