Evaluation of Bio-VOC Sampler for Analysis of Volatile Organic Compounds in Exhaled Breath

Abstract
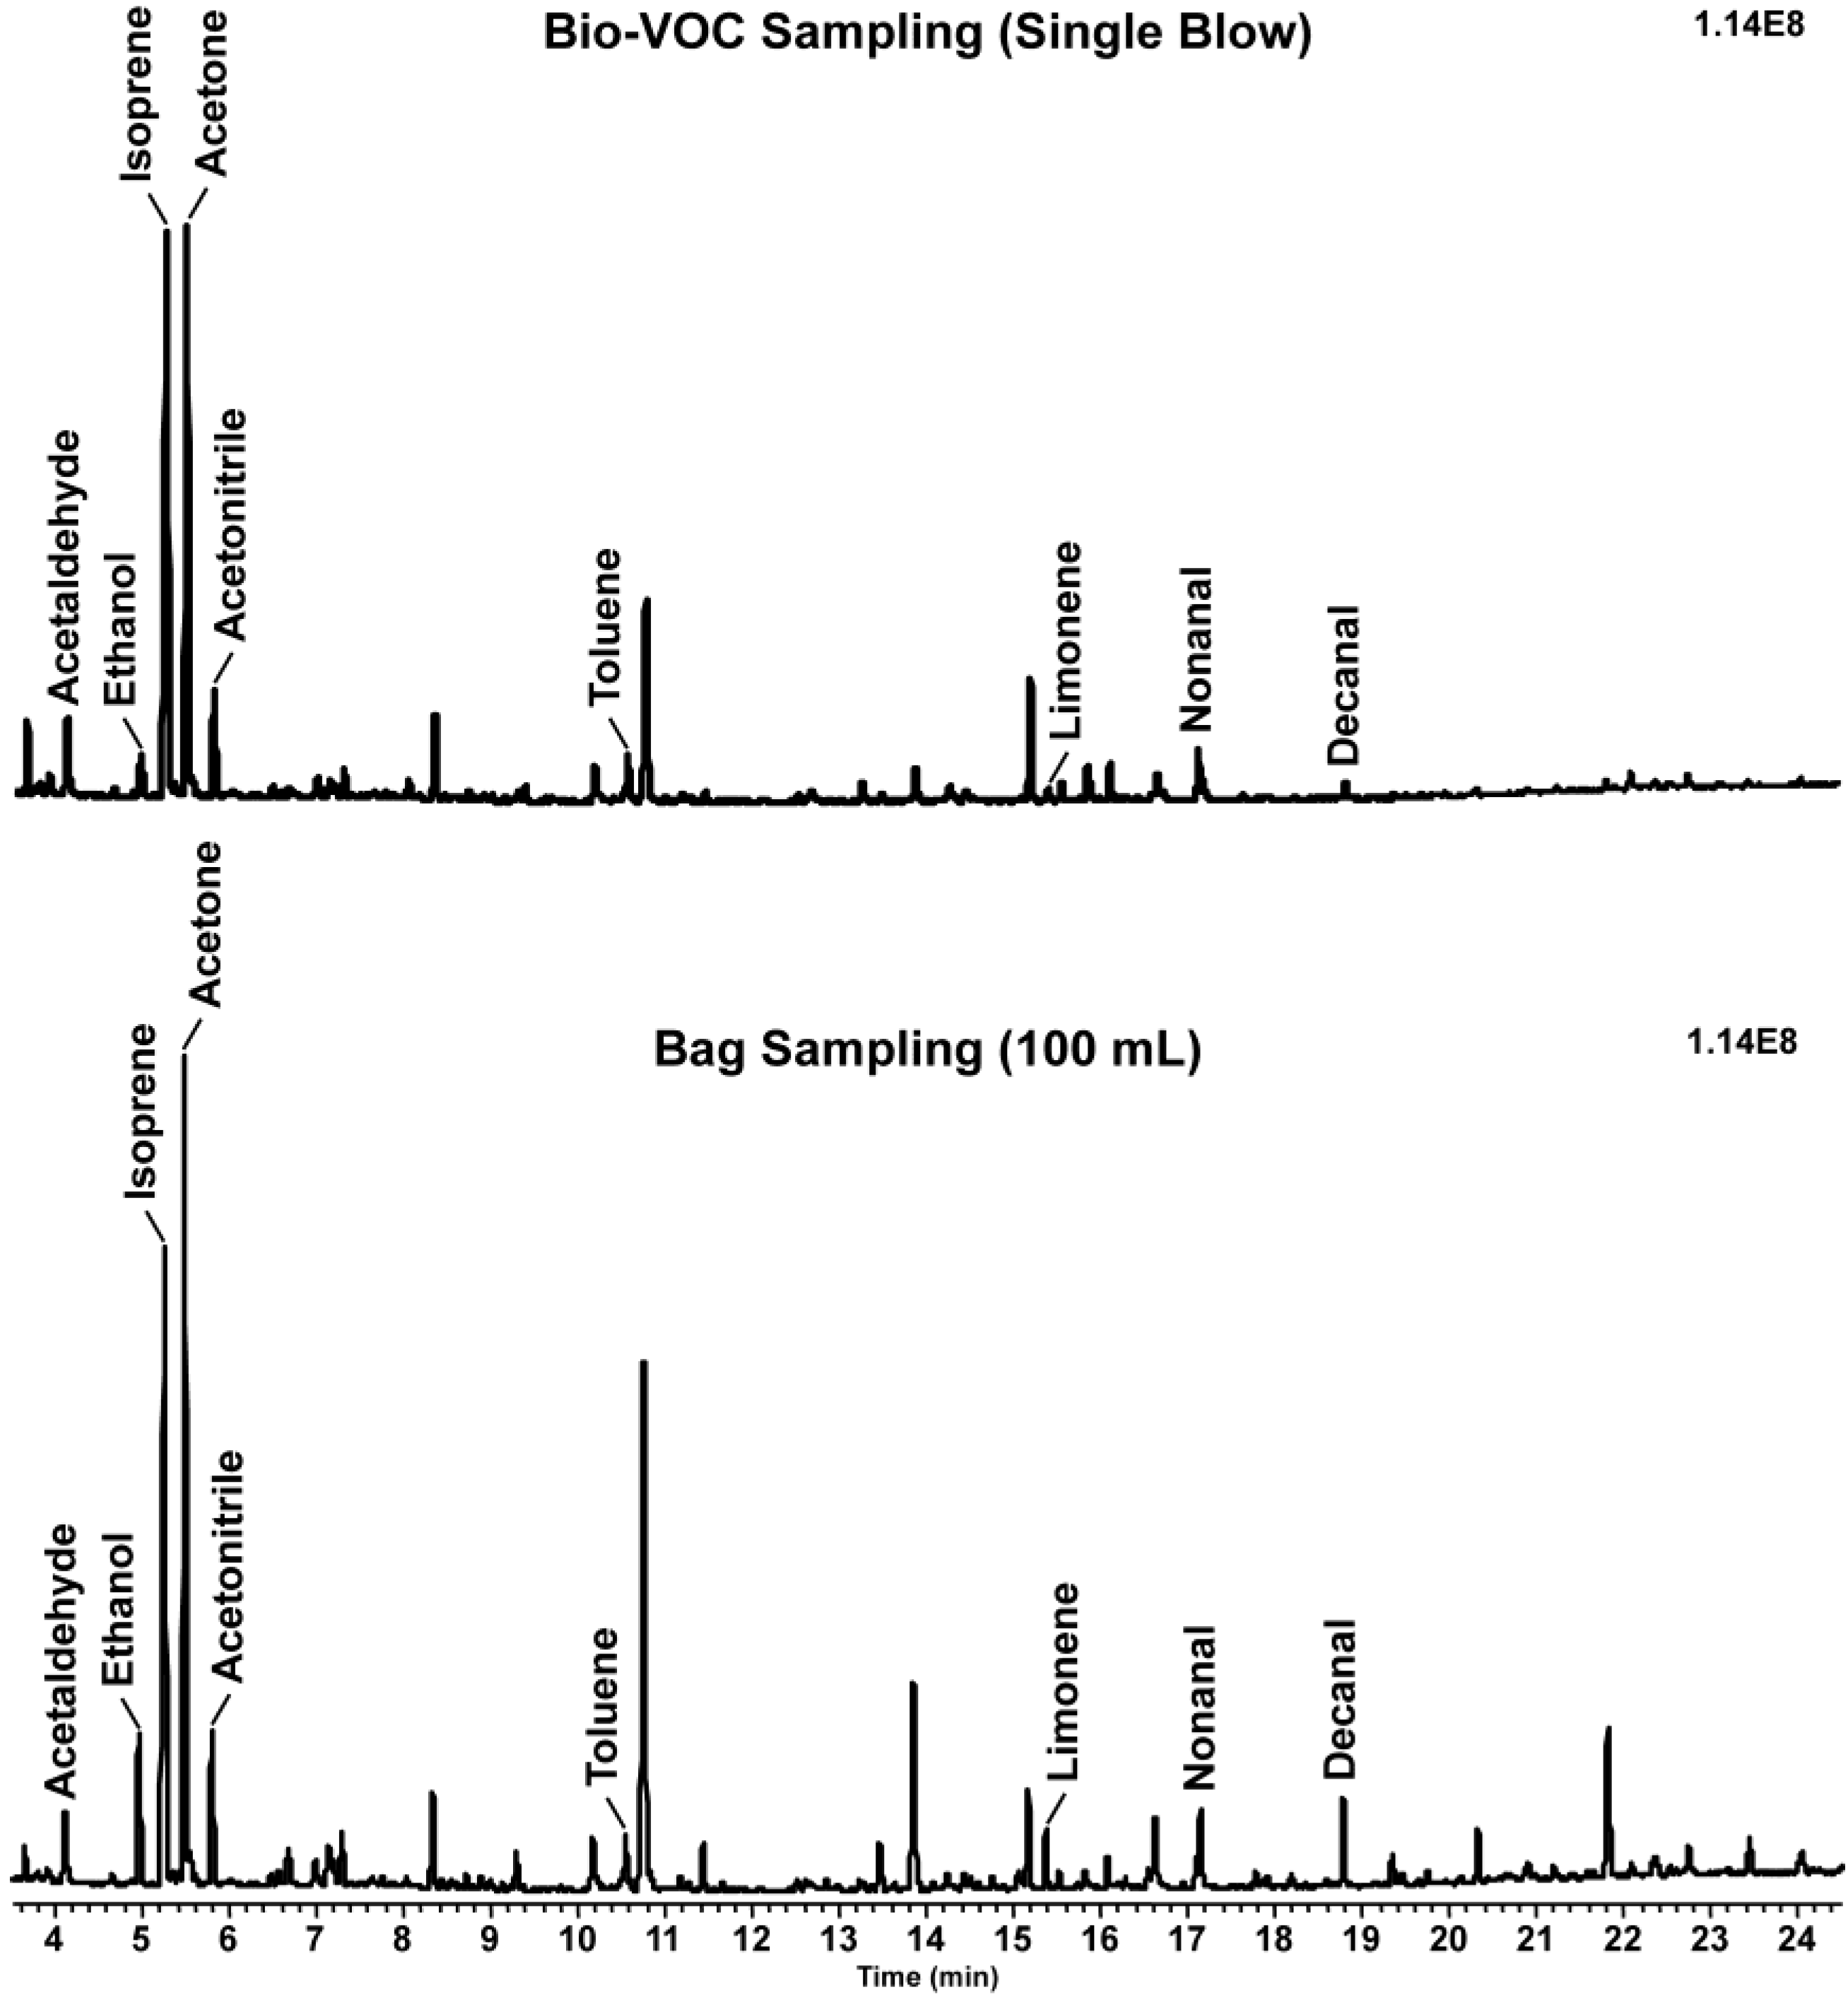
:1. Introduction
2. Results and Discussion

| Compound | RT (min) | Quant ion | Volume Calculated (mL) | |||||
|---|---|---|---|---|---|---|---|---|
| Subject 1 | Subject 2 | Subject 3 | Subject 4 | Average | %RSD | |||
| Ethanol | 4.92 | 45 | 52 | 26 | 75 | 102 | 64 | 51 |
| Isoprene | 5.21 | 67 | 85 | 49 | 91 | 148 | 93 | 44 |
| Acetone | 5.44 | 43 | 124 | 64 | 116 | 153 | 114 | 32 |
| Isopropanol | 5.50 | 45 | 58 | 22 | 90 | 81 | 63 | 48 |
| 1-Propanol | 6.61 | 42 | 59 | 73 | 87 | 96 | 79 | 21 |
| Allyl methyl sulfide | 8.99 | 88 | 83 | 62 | 115 | 95 | 89 | 25 |
| 1-(Methylthio)-1-propene | 9.76 | 88 | 77 | 69 | 132 | 113 | 97 | 30 |
| Limonene | 15.53 | 68 | 88 | 96 | 174 | 75 | 108 | 41 |
| Average | 78 | 58 | 110 | 108 | 88 | |||
| %RSD | 29 | 43 | 29 | 27 | ||||

| Compound | RT (min) | Quant ion | R2 | |||||
|---|---|---|---|---|---|---|---|---|
| Subject 1 | Subject 2 | Subject 3 | Subject 4 | Average | %RSD | |||
| Allyl methyl sulfide | 8.99 | 88 | 0.9878 | 0.9536 | 0.9869 | 0.9947 | 0.9808 | 1.88 |
| Toluene | 10.53 | 91 | 0.9765 | 0.9534 | 0.9887 | 0.9946 | 0.9783 | 1.86 |
| 1-(Methylthio)-1-propene | 9.77 | 88 | 0.9855 | 0.9440 | 0.9776 | 0.9814 | 0.9721 | 1.96 |
| Isopropanol | 5.50 | 45 | 0.9510 | 0.9592 | 0.9842 | 0.9697 | 0.9660 | 1.48 |
| Acetone | 5.44 | 43 | 0.9452 | 0.9433 | 0.9156 | 0.9727 | 0.9442 | 2.47 |
| p/m-xylene | 12.65 | 91 | 0.8528 | 0.9403 | 0.9539 | 0.9511 | 0.9245 | 5.21 |
| Ethylbenzene | 12.49 | 91 | 0.8935 | 0.9538 | 0.8672 | 0.9713 | 0.9215 | 5.34 |
| Isoprene | 5.20 | 67 | 0.9743 | 0.9486 | 0.9899 | 0.7554 | 0.9171 | 11.90 |
| Limonene | 15.53 | 68 | 0.9826 | 0.9349 | 0.9436 | 0.7055 | 0.8917 | 14.11 |
| Acetonitrile | 5.74 | 41 | 0.8254 | 0.9697 | 0.9411 | 0.8165 | 0.8882 | 8.85 |
| 2-Pentanone | 9.09 | 43 | 0.8057 | 0.7903 | 0.9450 | 0.9962 | 0.8843 | 11.54 |
| 1-Propanol | 6.62 | 42 | 0.6637 | 0.9463 | 0.9558 | 0.9326 | 0.8746 | 16.11 |
| 2-Butanone | 7.25 | 43 | 0.7646 | 0.8809 | 0.8465 | 0.9739 | 0.8665 | 10.00 |
| Octanal | 15.36 | 84 | 0.8213 | 0.6678 | 0.7334 | 0.8642 | 0.7717 | 11.42 |
| Hexanal | 11.40 | 44 | 0.6247 | 0.9508 | 0.6609 | 0.8473 | 0.7709 | 20.05 |
| Heptanal | 13.45 | 70 | 0.7807 | 0.7642 | 0.6838 | 0.8416 | 0.7676 | 8.47 |
| Acetaldehyde | 4.07 | 44 | 0.1933 | 0.8472 | 0.9302 | 0.9645 | 0.7338 | 49.56 |
| Pentanal | 9.26 | 44 | 0.5148 | 0.8941 | 0.6204 | 0.8940 | 0.7308 | 26.46 |
| Benzene | 8.29 | 78 | 0.9342 | 0.8118 | 0.5231 | 0.6359 | 0.7263 | 25.14 |
| Benzaldehyde | 15.16 | 106 | 0.5510 | 0.3867 | 0.9449 | 0.9007 | 0.6958 | 38.97 |
| Nonanal | 17.14 | 57 | 0.7859 | 0.4286 | 0.5822 | 0.8831 | 0.6700 | 30.45 |
| 2,3-Butanedione | 7.08 | 43 | 0.7890 | 0.8762 | 0.6227 | 0.3775 | 0.6664 | 32.93 |
| 3-Methylfuran | 6.94 | 82 | 0.0261 | 0.9447 | 0.6842 | 0.9683 | 0.6558 | 66.96 |
| Ethanol | 4.92 | 45 | 0.6121 | 0.9686 | 0.8735 | 0.0810(−) | 0.6338 | 62.83 |
| Decanal | 18.80 | 112 | 0.5344 | 0.3728 | 0.4547 | 0.8883 | 0.5626 | 40.35 |
| Phenol | 16.07 | 94 | 0.5905 | 0.1354 | 0.9752 | 0.4900 | 0.5478 | 63.06 |
| Acetophenone | 17.08 | 105 | 0.5675 | 0.0732(−) | 0.5015 | 0.7822 | 0.4811 | 61.78 |
| 3-Heptanone | 13.12 | 57 | 0.0213(−) | 0.1726 | 0.8456 | 0.4561 | 0.3739 | 96.92 |
| Methyl Isobutyl Ketone | 10.20 | 100 | 0.0007(−) | 0.0925(−) | 0.111(−) | 0.3864(−) | 0.1477 | 112.59 |
3. Experimental Section
3.1. Exhaled Breath Collection
| Subject 1 | Subject 2 | Subject 3 | Subject 4 | |
|---|---|---|---|---|
| Age | 44 | 59 | 31 | 21 |
| Sex | Male | Male | Male | Female |
| Ethnicity | Asian | Asian | Caucasian | Caucasian |
| Smoking | No | Yes | No | No |
3.2. Measurement of the Breath Air Volume Collected in Bio-VOC
3.3. Sorbent Tubes
3.4. Analysis of Sorbent Tubes
4. Conclusions
Acknowledgments
Author Contributions
Conflicts of Interest
References
- King, J.; Mochalski, P.; Kupferthaler, A.; Unterkofler, K.; Koc, H.; Filipiak, W.; Teschl, S.; Hinterhuber, H.; Amann, A. Dynamic profiles of volatile organic compounds in exhaled breath as determined by a coupled PTR-MS/GC-MS study. Physiol. Meas. 2010, 31, 1169–1184. [Google Scholar]
- Alonso, M.; Sanchez, J.M. Analytical challenges in breath analysis and its application to exposure monitoring. Trends Anal. Chem. 2013, 44, 78–89. [Google Scholar]
- Dyne, D.; Cocker, J.; Wilson, H.K. A novel device for capturing breath samples for solvent analysis. Sci. Total Environ. 1997, 199, 83–89. [Google Scholar]
- Poli, D.; Carbognani, P.; Corradi, M.; Goldoni, M.; Acampa, O.; Balbi, B.; Bianchi, L.; Rusca, M.; Mutti, A. Exhaled volatile organic compounds in patients with non-small cell lung cancer: Cross sectional and nested short-term follow-up study. Respir. Res. 2005, 6, 71. [Google Scholar]
- Kusano, M.; Mendez, E.; Furton, K.G. Development of headspace SPME method for analysis of volatile organic compounds present in human biological specimens. Anal. Bioanal. Chem. 2011, 400, 1817–1826. [Google Scholar]
- Van den Velde, S.; Quirynen, M.; van Hee, P.; van Steenberghe, D. Differences between alveolar air and mouth air. Anal. Chem. 2007, 79, 3425–3429. [Google Scholar]
- Raj, N.; Henderson, K.A.; Hall, J.E.; Aguilera, I.M.; Harmer, M.; Hutchings, A.; Williams, B. Evaluation of personal, environmental and biological exposure of paediatric anaesthetists to nitrous oxide and sevoflurane. Anaesthesia 2003, 58, 630–636. [Google Scholar]
- Jones, K.; Meldrum, M.; Baird, E.; Cottrell, S.; Kaur, P.; Plant, N.; Dyne, D.; Cocker, J. Biological monitoring for trimethylbenzene exposure: a human volunteer study and a practical example in the workplace. Ann. Occup. Hyg. 2006, 50, 593–598. [Google Scholar]
- Caro, J.; Gallego, M. Environmental and biological monitoring of volatile organic compounds in the workplace. Chemosphere 2009, 77, 426–433. [Google Scholar]
- Scheepers, P.T.; Konings, J.; Demirel, G.; Gaga, E.O.; Anzion, R.; Peer, P.G.; Dogeroglu, T.; Ornektekin, S.; van Doorn, W. Determination of exposure to benzene, toluene and xylenes in Turkish primary school children by analysis of breath and by environmental passive sampling. Sci. Total Environ. 2010, 408, 4863–4870. [Google Scholar]
- Jareño-Esteban, J.J.; Muñoz-Lucas, M.A.; Carrillo-Aranda, B.; Maldonado-Sanz, J.A.; de Granda-Orive, I.; Aguilar-Ros, A.; Civera-Tejuca, C.; Gutiérrez-Ortega, C.; Callol-Sánchez, L.M. Volatile Organic Compounds in Exhaled Breath in a Healthy Population: Effect of Tobacco Smoking. Arch. Bronconeumol. 2013, 49, 457–461. [Google Scholar]
- Van den Velde, S.; Quirynen, M.; van Hee, P.; van Steenberghe, D. Halitosis associated volatiles in breath of healthy subjects. J. Chromatogr. B Anal. Technol. Biomed. Life Sci. 2007, 853, 54–61. [Google Scholar]
- Van den Velde, S.; Nevens, F.; van Hee, P.; van Steenberghe, D.; Quirynen, M. GC-MS analysis of breath odor compounds in liver patients. J. Chromatogr. B Anal. Technol. Biomed. Life Sci. 2008, 875, 344–348. [Google Scholar]
- Dadamio, J.; van den Velde, S.; Laleman, W.; van Hee, P.; Coucke, W.; Nevens, F.; Quirynen, M. Breath biomarkers of liver cirrhosis. J. Chromatogr. B Anal. Technol. Biomed. Life Sci. 2012, 905, 17–22. [Google Scholar]
- Phillips, C.O.; Syed, Y.; Parthaláin, N.M.; Zwiggelaar, R.; Claypole, T.C.; Lewis, K.E. Machine learning methods on exhaled volatile organic compounds for distinguishing COPD patients from healthy controls. J. Breath Res. 2012, 6, 036003. [Google Scholar] [CrossRef]
- Poli, D.; Goldoni, M.; Caglieri, A.; Ceresa, G.; Acampa, O.; Carbognani, P.; Rusca, M.; Corradi, M. Breath analysis in non small cell lung cancer patients after surgical tumour resection. Acta Biomed. 2008, 79 (Suppl. 1), 64–72. [Google Scholar]
- Poli, D.; Goldoni, M.; Corradi, M.; Acampa, O.; Carbognani, P.; Internullo, E.; Casalini, A.; Mutti, A. Determination of aldehydes in exhaled breath of patients with lung cancer by means of on-fiber-derivatisation SPME-GC/MS. J. Chromatogr. B Anal. Technol. Biomed. Life Sci. 2010, 878, 2643–2651. [Google Scholar]
- Patterson, S.G.; Bayer, C.W.; Hendry, R.J.; Sellers, N.; Lee, K.S.; Vidakovic, B.; Mizaikoff, B.; Gabram-Mendola, S.G. Breath analysis by mass spectrometry: a new tool for breast cancer detection? Am. Surg. 2011, 77, 747–751. [Google Scholar]
- Henderson, K.A.; Matthews, I.P. Biological monitoring of midwives’ exposure to N2O using the Bio-VOC breath sampler. J. Expo. Anal. Environ. Epidemiol. 2002, 12, 309–312. [Google Scholar]
- Hryniuk, A.; Ross, B.M. Detection of acetone and isoprene in human breath using a combination of thermal desorption and selected ion flow tube mass spectrometry. Int. J. Mass Spectrom. 2009, 285, 26–30. [Google Scholar]
- Helmig, D.; Vierling, L. Water adsorption capacity of the solid adsorbents Tenax TA, Tenax GR, Carbotrap, Carbotrap C, Carbosieve SIII, and Carboxen 569 and water management techniques for the atmospheric sampling of volatile organic trace gases. Anal. Chem. 1995, 67, 4380–4386. [Google Scholar]
© 2014 by the authors; licensee MDPI, Basel, Switzerland. This article is an open access article distributed under the terms and conditions of the Creative Commons Attribution license (http://creativecommons.org/licenses/by/4.0/).
Share and Cite
Kwak, J.; Fan, M.; Harshman, S.W.; Garrison, C.E.; Dershem, V.L.; Phillips, J.B.; Grigsby, C.C.; Ott, D.K. Evaluation of Bio-VOC Sampler for Analysis of Volatile Organic Compounds in Exhaled Breath. Metabolites 2014, 4, 879-888. https://doi.org/10.3390/metabo4040879
Kwak J, Fan M, Harshman SW, Garrison CE, Dershem VL, Phillips JB, Grigsby CC, Ott DK. Evaluation of Bio-VOC Sampler for Analysis of Volatile Organic Compounds in Exhaled Breath. Metabolites. 2014; 4(4):879-888. https://doi.org/10.3390/metabo4040879
Chicago/Turabian StyleKwak, Jae, Maomian Fan, Sean W. Harshman, Catherine E. Garrison, Victoria L. Dershem, Jeffrey B. Phillips, Claude C. Grigsby, and Darrin K. Ott. 2014. "Evaluation of Bio-VOC Sampler for Analysis of Volatile Organic Compounds in Exhaled Breath" Metabolites 4, no. 4: 879-888. https://doi.org/10.3390/metabo4040879