
Proton Bridging in Catalysis by and Inhibition of Serine Proteases of the Blood Cascade System

Department of Chemistry, The Catholic University of America, Washington, DC 20064, USA
Life 2021, 11(5), 396; https://doi.org/10.3390/life11050396
Submission received: 26 March 2021
/
Revised: 24 April 2021
/
Accepted: 26 April 2021
/
Published: 27 April 2021
(This article belongs to the Special Issue Current Approaches in Molecular Enzymology)
Abstract
:Inquiries into the participation of short hydrogen bonds in stabilizing transition states and intermediate states in the thrombin, factor Xa, plasmin and activated protein C–catalyzed reactions revealed that specific binding of effectors at Sn, n = 1–4 and S’n, n = 1–3 and at remote exosites elicit complex patterns of hydrogen bonding and involve water networks. The methods employed that yielded these discoveries include; (1) kinetics, especially partial or full kinetic deuterium solvent isotope effects with short cognate substrates and also with the natural substrates, (2) kinetic and structural probes, particularly low-field high-resolution nuclear magnetic resonance (1H NMR), of mechanism-based inhibitors and substrate-mimic peptide inhibitors. Short hydrogen bonds form at the transition states of the catalytic reactions at the active site of the enzymes as they do with mechanism-based covalent inhibitors of thrombin. The emergence of short hydrogen bonds at the binding interface of effectors and thrombin at remote exosites has recently gained recognition. Herein, I describe our contribution, a confirmation of this discovery, by low-field 1H NMR. The principal conclusion of this review is that proton sharing at distances below the sum of van der Waals radii of the hydrogen and both donor and acceptor atoms contribute to the remarkable catalytic prowess of serine proteases of the blood clotting system and other enzymes that employ acid-base catalysis. Proton bridges also play a role in tight binding in proteins and at exosites, i.e., allosteric sites, of enzymes.
1. Introduction
Fundamental questions of the origins and evolutionary progress of catalytic acceleration by enzymes intrigued and motivated enzymologists for some time. This review is predicated on the vast knowledge of the serine proteases of the serine hydrolase family, especially the cardiovascular enzymes. They, like many hydrolases as cholinesterases, are of great scientific and medical interest. The catalytic acceleration of the native reactions catalyzed by these enzymes is ~13 orders of magnitude (kcat/kuncat) or greater relative to an appropriate reference reaction. The origins of this impressive catalytic power lie in sophisticated modes of transition state (TS) stabilization [1,2,3]. Proton bridges are at the heart of the catalytic prowess of serine hydrolases; when they form at the TS they lower its energy barrier, which has captured our interest. Specific structural features of the protein are decisive to the extent to which the compression of the proton bridges occurs to affect TS stabilization. The quest for understanding the role of proton bridges in catalytic efficiency required a range of biophysical chemical methods: (1) Kinetic studies included partial and full deuterium solvent isotope effects (SIEs) [1,2,4,5] and kinetic SIEs (KSIEs). (2) Structural studies included high-resolution magnetic resonance (NMR) [6,7,8,9,10,11,12,13,14] and protein dynamics (MD) calculations [15,16]. Proton bridges at the TS of serine hydrolase-catalyzed reactions have been characterized broadly by kinetic methods especially using isotope effects [1,2,3,4,5,17,18,19,20,21,22,23,24,25,26,27,28]. Our work extended to several serine proteases and cholinesterases, which revealed a dependence of the degree of participation of proton bridges in the stabilization of the TS of substrate reactions on sub-site interactions in the specificity pocket [20,21,22,23,24,25,26]. Covalent inhibitors of enzymes illuminate properties of reaction intermediates on the catalytic path. Nonetheless, another group of inhibitors bind non-covalently at the active-site region in the canonical mode and others in non-canonical modes to reveal different aspects of enzyme-substrate interactions. While catalytic sites are amenable to both kinetic and structural inquiries when using a range of rationally selected substrates and inhibitors, remote-site interactions in enzymes are particularly well revealed by structural techniques. These interactions are especially important when considering large peptide or protein substrates and inhibitors of serine proteases.
A paradigm of significant remote-site interactions presents itself in thrombin catalysis of the refashioning of its prime substrates, like fibrinogen and protein C (PC), and in its inhibition by small inhibitors that are close analogs [27,29] of the cognate substrates [30,31,32,33,34,35,36]. Factor (F) Xa-catalyzed hydrolysis of small peptides that mimic cognate substrate sites and the activation of prothrombin also reveal the participation of proton sharing in TS stabilization in the respective reactions. This is enforced at exosites and by solvate restructuring. Inhibitors offer powerful tools to study the key interactions that drive specificity and efficient catalysis, as the time window for observations is conveniently broad. Very useful has been the inhibition of thrombin by hirudin [26,37,38,39,40,41,42,43,44,45,46,47], a natural protein, and a series of its synthetic analogs [48,49,50,51,52,53,54]. The X-ray structure of the α-thrombin-sulfohirudin complex (1.84 Å resolution) revealed the occurrence of H bridges between a phenolic OH of Tyr76 in thrombin and an oxygen on Tys63 in hirudin [55]. The same oxygen atom is also in an H bond with a water molecule. An extended H-bond network connects this water molecule to another oxygen atom on the sulfate. Previous structural information from X-ray studies had revealed at least 13 sites near the cognate substrate-recognition site where hirudin might form short proton bridges. To aid locating the sites of possible short proton bridges between thrombin and hirudin, we employed several analogs of hirudin: hirunorm IV and hirunorm V [48,53,54], r-RGD-hirudin (recombinant 32SGD34 type 2 hirudin) [51] and an Nα(Me)Arg-peptide [52]. The hirunorms have three amino acids of the N-terminal sequence of hirudin followed by a linker and 10 amino acids of the C-terminus of hirudin, but are about hundred times less effective inhibitors of α-thrombin than the parent compound. One novelty in this endeavor has been the characterization of short proton bridges at binding sites near the active-site cleft and remote sites by full and partial KSIE probes and high-resolution 1H NMR techniques [20,21,22,23,26]. These interactions have important roles in binding of the extended substrates and inhibitors and enforcing the conformation required for efficient catalysis. The results are further supported by solvent isotope effect studies of substrate and inhibitor-binding studies [26].
2. Kinetic Probes of Catalysis by Serine Proteases
2.1. The Double Displacement Mechanism of Serine Protease Catalysis of Peptide/Protein Hydrolysis
The fundamentals of serine protease catalysis [3,17,18] are the His57-catalyzed nucleophilic attack of Ser195 resulting in the formation of a tetrahedral intermediate [56] and the ensuing His57H+-catalyzed cleavage of the C–N bond. In these general acid base-catalyzed steps, proton transfer may be mediated at short distances at the TS [2,19]. Proton sharing between the carboxylate of Asp102 and the imidazole of His57 accepting the positive charge and subsequent protonation of the leaving group can assist in lowering the TS barrier. A repeat of these steps occurs in deacylation, when water serves as nucleophile in the hydrolysis of the acyl enzyme [57]. Scheme 1 describes the molecular mechanisms of catalysis and Scheme 2 gives a general kinetic sequence of steps in the Michaelis–Menten formalism [58].
Under steady-state (Michalis Menten) conditions the constants can be defined in terms of elementary rate constants as follows: kcat/Km = k1 k2 k3/(k−1k2 + k−1k3 + k2k3) and kcat = k2 k3/(k2 + k3). The first step of the scheme (Kas = k1/k−1) is reversible substrate binding. Acylation (k2) follows then deacylation (k3). At the heart of an elucidation of the mechanisms of action of serine proteases is how the proton-transfer steps, shown in Scheme 1, are coupled or uncoupled to bond-making and -breaking at the quasi-tetrahedral TS.
2.2. The Catalytic Site of Serine Proteases
Proton bridges form at catalytic sites in the depth of these globular proteins to stabilize the TS. This stabilization of the TS occurs by 5–10 kcal/mol free energy provided by the acid-base catalytic machinery [1,2,3,4,5,6,14], which consist of the catalytic triad, a Ser, a His and an Asp residue [2,3,4,5,17,18,19,20,21,22,23]. Deuterium or tritium isotope effects, particularly deuterium KSIEs, proved to be great measures of the participation of protons in general acid-base catalysis by enzymes [4,17,18,19,20,21,22,23]. More in-depth information can be acquired from the proton inventory method to reveal the number and, to a degree, the nature of proton bridges at TSs [2,4,5,19,20,22,59,60,61,62,63,64,65,66,67]. R. L. Schowen and his group championed the proton inventory technique since the 1980s to unravel the role of proton bridges in a variety of serine protease. On the basis of the results of these works, and others, they promoted an understanding that interactions between Sn (n = 1–3) specificity sub-sites and specific amino acids in substrates at corresponding Pn (n = 1–3) sites elicit a compression to affect contraction of the distances between proton donors and acceptors in the acid-base machinery. A consequence is the optimization of the pK of the attacking Ser195 nucleophile as it covalently attaches to the carbonyl C [2,3,16]. Corroborating evidence of contraction of the critical proton bridges in the catalytic triad came from A. Frey’s group [7,68,69,70,71] and others [11,72,73,74] by measuring 1H NMR signals of short strong hydrogen bonds (SSHBs) in a range of serine proteases covalently modified by TS analogs. Yet, other works with substrates and inhibitors demonstrated that P’ sites [75,76,77,78] and exosites [26] in long peptide and protein substrates can have roles in exerting compression at the active site.
2.3. Solvent Isotope Effects and Proton Inventories
Isotope effects originate [4,5,8,14,15,20,21,22,23,59,60,61,62,63,64,65,66,67] predominantly from a change in zero point potential energy when moving from one state to another. Deuterium isotope effects in particular stem from the mass difference of 2 between the two nuclei: They are normal when taking a value >1 because the change from reactant to TS or product results in a smaller energy gap between H and D at the TS or product state than in the reactant state; as a result, the potential energy barrier is reduced more for H than for D. In the opposite case, the isotope effect is inverse (<1). Quantum effects can become significant under certain conditions in enzymatic reactions, but only the classical treatment has been applied to these studies.
Rate ratios in water and heavy water give KSIEs of appropriate kinetic parameters. They are excellent and well-tested tools to measure the participation of acid-base catalysis in the rate-limiting process. The proton inventory is a related study of the dependence of a rate or equilibrium parameter of maximal catalytic efficiency on the composition of the mixtures of isotopic waters at the pH/pD optimum [4]. This technique aids in assessing the number of protons that participate in catalysis as transferring (readily exchangeable) protons from/to substrates and inhibitors, to/from enzymatic residues or solvating water molecules.
A rational expectation is that the most complex of catalysts, enzymes, involve more than a single protonic site in their acid-base catalytic function. The premise of the method is that the contribution of individual sites to the phenomenological solvent isotope effects can be extracted. This target can be reached by studies of rates in 5–10 different mol fractions of isotopic waters. The critical requirement for a correct and meaningful proton inventory study is a knowledge of the pH (H2O) and pD (D2O) dependence of the reaction. The rate measurements then are carried out at a pH plateau, minimum or maximum, in identically prepared H2O and D2O buffers and their mixtures [4,5,20,21,22,23,59,60,61,62,63,64,65,66,67]. The Gross–Butler equation, given below, relates the dependence of a particular rate parameter to the atom fraction of deuterium, n, in the solvent mixtures;
![Life 11 00396 i006]() where Vn = velocity in a binary solvent; Vo = velocity in water; n = atom fraction of deuterium; RS = reactant state; ɸR = RS fractionation factor; ɸT = TS fractionation factor. (The TS sum is for TS fractionation factors and the RS sum is for RS fractionation factors.) The fractionation factors are in essence inverse equilibrium isotope effects, KD/KH, for exchange between a bulk-water site and a particular structural site of RS or TS [4,5,20,21,22,65]. The contributing isotope effects can be obtained from an appropriate least squares fitting procedure. The most common simplifications of this equation involve the assumption of a unit fractionation factor of most RSs and the assumption that one or two active-site units contribute. More complex models can also be derived from the general expression [4,5,20,21,22,57,64,65,66,67].
where Vn = velocity in a binary solvent; Vo = velocity in water; n = atom fraction of deuterium; RS = reactant state; ɸR = RS fractionation factor; ɸT = TS fractionation factor. (The TS sum is for TS fractionation factors and the RS sum is for RS fractionation factors.) The fractionation factors are in essence inverse equilibrium isotope effects, KD/KH, for exchange between a bulk-water site and a particular structural site of RS or TS [4,5,20,21,22,65]. The contributing isotope effects can be obtained from an appropriate least squares fitting procedure. The most common simplifications of this equation involve the assumption of a unit fractionation factor of most RSs and the assumption that one or two active-site units contribute. More complex models can also be derived from the general expression [4,5,20,21,22,57,64,65,66,67].

3. Structural Probes of Reaction Intermediates
3.1. High Resolution, Low-Field Nuclear Magnetic Resonance (1H NMR) Signals at Catalytic Bridges and in Binding Interactions
Spectroscopic properties of shared protons can be exploited for structural inquiries using selected inhibitors that generate covalent adducts of enzymes. H-bonding interactions in the acylation step in Scheme 1 and Scheme 2 can be modeled by mimics of the oxyanionic tetrahedral intermediate, whereas ideal models for the anionic tetrahedral intermediate in deacylation are phosphate and phosphonate ester adducts of serine proteases. The stable tetracovalent adducts of enzymes and TS analogue adducts with inhibitors can be studied by high-resolution 1H NMR at low field. Short proton bridges manifest in the 1H NMR spectra as a unique resonance between 14 and 21 ppm downfield from silanes [7,8,9,10,11,12,13,14]. The low-field signals can also be observed below pH 6 with some native enzymes that operate acid-base catalysis [7,8,9,10,11,12,13,14,23,24,25,26]. The deshielding phenomenon has been attributed to the presence of short strong H-bonds (SSHBs) at the active site of enzymes as the key base catalyst (His) becomes protonated. The deshielding is due to the loss of some of the sigma bond electron density upon lengthening slightly the H-donor distance. SSHBs have been detected [14,68,69,70,71,72,73,74] by 1H NMR methods in several enzymes, other than serine proteases. These cases satisfy four criteria; (a) the occurrence of highly deshielded proton resonances (below 14 ppm), (b) lower than one D/H fractionation factor, (c) at least 10 times slower exchange rates than in average H-bonds, (d) SSHBs ~5–10 kcal/mol stronger than normal proton bridges as measured by pH titration or by the deductions from the values of kinetic parameters in active-site mutants [7,8,11,79,80,81,82,83]. However, earlier estimates of the unusual bond strength have not been substantiated and to recognize this fact the notation of short H-bond (SHB) will be used in the following [82,83,84,85]. From 1H NMR data, the SHB length of 2.4–2.7 Å and donor-H-acceptor angles can be calculated. In contrast, normal H-bonds in proteins and nucleic acids are 2.7–3.0 Å in length and ~1–2 kcal/mol in strength [85]. These small differences in H-bond distances are frequently not discernible in X-ray structures. Protons can be located reliably by neutron diffraction spectroscopy which is still rarely available [14,79,80,81,85]. Mildvan [14] offered an alternative using two methods for the calculation of proton donor-acceptor distances; from chemical shifts and D/H fractionation factors of the shared protons.
3.2. Computational Studies: Molecular Dynamics
Random thermal fluctuations of enzymes that keep them in constant motion result in many conformers that differ slightly in energy [86]. These different conformations offer different epitopes for binding, i.e., different surface interactions with cognate substrates and other effectors [86,87,88,89]. It appears that some of these motions result in compression of critical distances to enforce a catalytic reaction. α-Thrombin as an allosteric enzyme fulfills its various functions in response to stimuli by adopting different conformations for the binding of its effectors [47,90,91,92]. Molecular dynamics (MD) simulations of these motions in the presence and absence of effectors are very revealing techniques.
For example, we performed MD simulations with CHARMM [93] of the interactions between components of the enzyme active site and a modifier to shed light on experimentally inaccessible questions involving transients [94,95]. Differences have been observed between acetylcholinesterase and trypsin or chymotrypsin in the use of the catalytic triad, oxy anion hole and other active-site components in tetrahedral carbonyl and tetra and pentacoordinate phosphonate adducts of the enzymes [94,95,96].
4. Basic Characteristics of the Enzymes of Bold Clotting Supporting the Catalytic Function
α-Thrombin and FXa are key serine proteases in hemostasis and thrombin also plays a role in thrombolysis [30,31,32,33,34]. Other serine proteases in blood coagulation are factors VIIa, IXa, Xa, XIa, XIIa and PC. Plasmin, and plasminogen activator enzyme are serine protease enzymes with thrombolytic function [30,31,32,33,34]. Plasmin efficiently degrades fibrin that forms the meshwork of a thrombus and thus provides an important counterbalance to the blood coagulation cascade in vivo [30,31,33]. The coagulation enzymes are two/four-chain glycoproteins with modular structures [30,33] in which components have high specificity for binding different macromolecules [35,36,37,38,39,47,97,98,99]. The enzymes become activated from their zymogens by a serine protease-catalyzed, Ca2+ ion, cofactor and plasma-membrane-dependent cleavage of one or more Arg-Gly (Val, Ilu, Ala, Leu or Asp) bonds [35]. Individuals who lack the presence or the vitamin K-dependent activation of the zymogens, factors V, VII, VIII, IX, or X, suffer from profound hemostatic defects and those with deficient FXI also show some of the defects [33]. Activated PC (APC) is an anticoagulant, thus, PC deficiency is a thrombotic risk [35].
The enzymes execute their roles very selectively only with physiologic substrates and predominantly in the presence of regulatory molecules. Binding of substrates and inhibitors at P sites, P’sites and exosites may have complementary or compensatory roles [75,76,77,99]. The most extensive mechanistic information is now available for thrombin [32,35,36,37,38,51,55,88,89,100,101,102,103], but the understanding of the mode of operation of both FXa [33,104,105] and plasmin [33] are also increasing rapidly. The availability of crystal structures of thrombin [32,88,89,100,101,102] and FXa [105] now provide the basis for interpretation of kinetic data at the molecular level or even in atomic detail.
Processing of thrombin occurs when FXa catalyzes the hydrolysis of two peptide bonds in the zymogen. In vivo, the prothrombin complex includes prothrombin, Ca2+, and FVa bound to a phospholipid surface where two bonds, Arg322-Ile323 and Arg273-Thr274, 36 Å apart, are cleaved by FXa in succession. If FVa is left out of the complex, the cleavage rate drops by five orders of magnitude and it occurs in the opposite order [105]. If the construct forms correctly, thrombin production is channeled without the release of intermediates. In this process an exosite of FXa becomes exposed near the active site, which seems to serve as a docking site of the scissile bond on prothrombin. This exosite is critical for the correct orientation of the Arg322 cleavage site. Cleavage is preceded by a rotation around two Gly residues hinge points. The presence of FVa promotes the first bond fission but the second one seems unaffected. Interestingly, FVa itself is processed from its precursor by thrombin-catalyzed cleavage at Arg709 into a heavy and a light chain.
One distinctive difference in the active-site composition of the enzymes is the presence of Glu192 in thrombin and PC, which is Gln192 in FXa and FVIIa [106]. This difference in the negative electrostatic medium at the active site is the origin of discrimination between natural inhibitors and chromogenic substrates; Glu192 confers resistance to Kunitz type inhibitors [102] whereas FXa is prone to inhibition by them. Such phenomena were studied with the Q192E mutant of FXa [106,107,108] and the E192Q mutant of thrombin [88,105]. The E192Q mutation in thrombin resulted in higher cleavage rates of substrates that have an acidic residue at P3. In the regulatory role of thrombin, thrombomodulin (TM) induces a conformational change that may move Glu192 in the catalytic pocket of thrombin out of the way of PC binding. Our interest was piqued by the great importance of the absence of negative charge at 192 in FXa in the process of prothrombin activation as most of the P3 and P3’ sites in human and bovine prothrombin are acidic. An important study of the activation of prothrombin by FXa and its Q192E mutant in the presence and absence of FVa indicated that FVa can compensate for the electrostatic repulsion between the Q192E mutant and the acidic P3 and P3’ sites [106].
α-Thrombin is probably the most selective and multifunctional of the serine proteases recruited in blood clotting; it plays a role in both hemostasis and thrombolysis [88,89,109,110,111,112,113,114]. It cleaves 12 substrates with specific cofactors. Activation of fibrinogen to fibrin is the most broadly studied among the natural reactions, which assisted our investigations into the role of SHBs in this vital reaction. It occurs in distinct steps in a sequential mechanism producing FpA and FpB to be further processed to fibrin. Thrombin is down regulated by its own action when it activates PC. Thrombin is a remarkable catalyst owing to the unique combination of catalytic features: the catalytic triad, the oxyanion hole, and two specificity-binding, I and II, exosites. While the latter may vary significantly among the members of this large class of enzymes, they all perform the task of nucleophilic displacement at carbonyl by the double displacement mechanism, shown in Scheme 1 [2,3,17,18].
4.1. The Catalytic Mechanism of α-Thrombin and the Role of Water Networks
The catalytic machinery (Ser195 His57 and Asp102), is at the bottom of the active-site cleft of α-thrombin [87,88,89,100,101,102]. The pK of His57 in free thrombin was reported to be 6.7 ± 0.3 and two other ionizable residues with pK 8.4 ± 0.4 and ~8.0 were identified at µ = 0.1 and 25 °C [115,116,117,118]. The second pK was assigned to the breakage of the salt bridge involving Ilu16 and the third one was attributed to a group located in the fibrinogen recognition (exo) site (FRS). The first two pKs change upon binding of small peptide substrates to 6.16 ± 0.25 and 8.95 ± 0.41, respectively, while the third pK remains the same. Higher pKs but similar trends were also reported for the thrombin-catalyzed fibrinogen activation and oligopeptide hydrolysis reflecting a complex dependence on ionizing groups under different conditions [35,114]. Similar kinetic pKs, 6.9 and 8.8, were reported for the reaction of FXa with specific ester substrates [119].
A prescient suggestion of Lottenberg et al. [118] that the unique pH dependence of the thrombin-catalyzed hydrolysis of a series of oligopeptide substrates can be explained by two or three protons participating in the mechanism guided our inquiry. Sizable solvent isotope effects were reported by Stone et al. [120] supported the anticipation of multi-proton catalysis by thrombin, FXa, APC and plasmin, if the requirements for optimal interactions between enzyme and substrate subsites were satisfied. In fact, these systems provide the most relevant cases for exosite-dependent and independent P’ specificity and their effect on proton participation in TS stabilization.
Catalysis by α-thrombin is controlled at several proton-linked ionizable groups [87,88,89,109,110,111,112,113,114,115,116]. The studies that informed our investigations were on the elucidation of the mechanism of allosteric regulation of α-thrombin using spectroscopic and kinetic measurements. These studies led to the proposition of the “fast-slow” conformational transition [87,88]; however, a general induced fit model can also account for the conformational flexibility of thrombin [89]. Di Cera’s proposition is that α-thrombin exists in either of the fast or the slow form, but only the fast form binds Na+ ion whereby it activates α-thrombin. Many peptide substrates and fibrinogen recognize and bind the fast conformation in the procoagulation process, whereas preferential binding to the slow conformation, or induction of the fast-slow conformational change, is associated with the anticoagulant role of thrombin [112,113,114]. The allosteric effector binds to the enzyme and affects its kinetic properties; a linkage effect. For example, fibrinogen binds to the FRS first then Na+ ion bound in its pore facilitates binding of the rest of fibrinogen by forming the link through the water channels to the active site. As these systems often disobey Michaelis–Menten kinetics [88,109,110], a comprehensive mathematical treatment of linkage thermodynamics and kinetics was applied to the regulation of α-thrombin by macromolecules and by the presence or absence of Na+ ions [113] and other monovalent cations [112,113]. Na+ ions, abundant in the extracellular medium, are the most effective in stabilizing the conformation of α-thrombin that accommodates peptide substrates and fibrinogen [87,88]. Na+ ion binding occurs on a faster time scale than the slow-fast transition [87,88,121,122]. This was elucidated from fast kinetic measurements of Na+ ion binding using the augmentation of the intrinsic fluorescence of thrombin [121]. The Trp residues of α-thrombin giving rise to its fluorescence were eliminated successively by site-specific mutations to map the exact role of each Trp in the intrinsic fluorescence of α-thrombin [121]. These studies revealed that a key contributor to fluorescence is Trp215 at the aryl binding site. The fluorescence studies showed that the Na+ ions bind to α-thrombin at about three orders of magnitude slower than many natural substrates do [121,122]. The reason for this is the need for stripping off water hydrate from Na+ ions to enable their penetration into the pore defined by loops 186- and 220- on α-thrombin [87,123]. After entering its site, the Na+ ion is coordinated with the backbone oxygen atoms of Arg221, Lys224 and four water molecules [87,88]. Ensuing this event is a grand organization of the water network that spans the interior of α-thrombin in a length of 15 Å leading up to the catalytic Ser195. This entire process of Na+ ion binding including the organization of water channels apparently slows down the association of Na+ with α-thrombin. An important physiological ramification of Na+ ion binding is that natural mutations in the prothrombin gene affecting residues of the Na+ ion binding site often result in bleeding [87,121].
Huntington [47,89,124,125] proposed a flexible, the plastic, model of thrombin on the basis of 2 dimensional 1H 15N NMR and molecular dynamics investigations. His group analyzed vastly different conformations of unliganded thrombin structures or zymogen like states, which yielded solution-state structures. Their fundamental finding is that thrombin is inherently flexible at the sites of binding and activity as it rapidly samples multiple states corresponding to the slow form or zymogen like states. Thrombin’s recognition of a number of binding sites of its multiple substrates and cofactors are key to its unique catalytic role at the end of the blood cascade system. Ligands bind through induced fit or cofactor-triggered conformation at active sites and exosites.
4.2. Thrombin Inhibition by the Hirudin Family
Substrates like fibrinogen or PC exploit numerous remote-site interactions with thrombin that can be sampled indirectly with large substrate-mimic inhibitors, which use the same epitopes as one or the other substrate. Hirudin and its analogs are tight-binding inhibitors that utilize extensive interactions at subsites and two exosites, primarily at the FRS, but without forming covalent bonds [86]. H bonds, some with the potential for an SHB, are numerous among these interactions [86].
Hirudin is a 65-residue protein produced in the salivary glands of the common leech, Hirudo medicinalis, in three varieties of close sequence homology [39,46,126]. All three variants contain three disulfide bonds and a sulfated Tyr63, Tys63. Hirudo aiponnia and Hirudinaria manillenis produce other isoforms of hirudin that contain an Asp residue instead of Tys63 [126]. Hirudin interacts non-covalently but tightly with α-thrombin within the active-site cleft as well as with the FRS [46,127,128,129]. It is an allosteric effector of the fast conformation of α-thrombin. The first X-ray structure (2.3 Å) of the α-thrombin-r-hirudin complex (variant 2, Lys47) afforded a complex picture of the key interactions [128,129,130,131]. Three residues of the N-terminal, Ile1′-Val2′-Tyr3′, penetrate the active site and aryl binding site where they interact with the S1 specificity site and form H bonds to His57 as well as Ser214 in thrombin. The central portion is globular and more loosely attached to α-thrombin. The N-terminal head of r-hirudin forms a parallel β-strand with thrombin (214–219) making a non-substrate like interaction. The 53–65 C-terminal fragment of hirudin binds the tightest to residues 62–73 of the B-chain on α-thrombin. Strong electrostatic interactions including at least 13 H bonds hold this segment together, but the last five residues form a 310 helical turn, which engages in hydrophobic interactions. Native hirudin with the sulfate group on Tys63, enhances the binding constant by ~20-fold over the desulfo form [46,55].
The intrinsic fluorescence of α-thrombin has been employed for measurements of binding parameters, because r-hirudin binding causes key Trp residues bury more deeply in the interior and thus enhance fluorescence [132]. Tt emerged from two studies [112,132], that first the C-terminal segment is preoriented and binds rapidly to the FRS because of the complementary electrostatic forces between the two. This is followed by the fitting of the N-terminal segment, which is ~300 times slower than the first step. The N-terminal fragment (1–52) and a C-terminal fragment were also used in this study to elucidate the binding events and calculate rate constants [132].
Several analogs were fashioned on the full hirudin chain including hirulogs [133] and hirutonin to include an active-site-directed N-terminal, a spacer of some length and the C-terminal hirudin tail or a variant of it. Hirunorms [48,49,53,54] were designed to be effective hirudin mimics by containing the functionalities that interact with the α-thrombin active site, specifically the Ser214-Gly216 segment, and with the FRS like hirudin does [46]. A three-residue segment consisting of D-Ala6″-βAla7″-βAla8″ or D-Ala6″-Gly7″-βAla8″ was used as a spacer in place of the larger Cys6′-Lys47′ core in hirudin. Hirunorms IV and V were reported to be the most potent among five hirunorms. X-ray structures of α-thrombin-hirunorm IV [54] and α-thrombin-hirunorm V complexes [53] show that the hirunorms interact along the B-chain blocking the active-site cleft by interacting with key residues in a parallel manner and stretch out of the cleft and around, so that the C-terminal interacts with the FRS. The primary sequence of hirunorms IV and V differ only at the second residue and only slightly along the C-terminal. The H-bonding potential between α-thrombin and the C-terminal of these inhibitors is similar to that of hirudin, but they bind with ~3 kcal/mol less energy than hirudin.
Our endeavors built on the above discoveries as we embarked on interrogating the effect of binding interactions at binding sites and exosites, on the formation and strength of SHBs at active sites in TS stabilization and at binding sites in cardiovascular enzymes. As shown above, these enzymes are unique in their great specificity and allosteric use of exosites, beyond S and S’ binding sites. The investigations included reaction dynamics and structural stabilization of intermediates. A great medical significance of the enzymes was additional justification of our quest [30,31,32,33]. Experimental details can be found in an Appendix A and in references [20,21,22,23,26,134,135,136,137,138].
5. The Occurrence of Short Hydrogen Bonds (SHBs) in Catalysis by and Inhibition of Blood-Clotting Enzymes
5.1. Probing the Dependence of Proton Sharing at the Transition States on Subsite Binding of Substrates
Lottenberg et al. [118] suggested that the unique pH dependence of the thrombin-catalyzed hydrolysis of a series of oligopeptide substrates can be explained by two or three protons participating in the mechanism. KSIEs > 3 were reported by Stone et al. [120] which lent support to the anticipation of multi-proton catalysis by thrombin, FXa, APC and plasmin, if the requirements for optimal interactions between enzyme and substrate subsites were satisfied. A proton inventory study had been completed for the thrombin-catalyzed hydrolysis of the minimum substrate Z-Arg-ethyl ester [4,65]. Not unexpectedly, this reaction involves one-proton catalysis. Overall, the conclusions from our studies fully concur with these earlier results and predictions. Moreover, the results obtained with natural substrates, indicate that solvent rearrangement in association and dissociation steps is manifest in inverse or very inverse KSIEs.
We constructed full and partial solvent isotope effect profiles reporting on a great number of protonic sites and their mode of participation in the catalysis of substrate hydrolysis by the four enzymes [20,21,22]. The substrates were selected to model cognate specificity subsites. Substrates were three types: (1) Chromogenic or fluorogenic di- to tetrapetide amide substrates test the effect of P1-P4 residues. (2) To test the collective contribution of P1-P4 and P1’-P3’sites without exosites, fluorescence-quenched substrates with an N-terminal 2-aminobenzoyl (AB)-Val fluorophore, a C-terminal Lys-2,4-dinitrophenyl (DNP) quencher, and an Asp-OH to enhance solubility, were studied with thrombin. (3) The effect on the extent of protonic participation of exosites (other than the N-acyl, or leaving group-binding site) were evaluated from studies of selected natural reactions. Naturally occurring substrates of α-thrombin and FXa achieve specific binding to the enzymes at designated exosites remote from the active site. Remote site interactions are expected to modify other, particularly P’-site, interactions. Enzyme–substrate pairs were studied as follows
Thrombin: (1) Z-Pro-Arg-7-amido-4-methylcoumarin (7-AMC) (PR-AMC); N-t-Boc-Val-Pro-Arg-7-AMC (VPR-AMC); Bz-Phe-Val-Arg-p-nitroanilide (pNA) (FVR-pNA); and H-D-Phe-L-Pip-Arg-pNA (FPiR-pNA). (2) Internally quenched fluorogenic peptides; (a) the optimal substrate; (AB)Val-Phe-Pro-Arg-Ser-Phe- Arg-Leu- Lys(DNP)-Asp-OH, (P1-P3-P1′-P3′ = FPR-SFR) and (b) a recognition sequence for FVIII; (AB)Val-Ser-Pro-Arg-Ser-Phe-Gln-Lys(DNP)-Asp-OH, (P1-P3-P1′-P3′ = SPR-SFQ) [10,88,89]. The hydrolysis of N-t-Val-Pro-Arg-7-AMC catalyzed by thrombin demonstrated that fluorescence quenching by the substrate limited the useful range of substrate concentration as the mmol range was approached. Quenching by a substrate, of the fluorescence of a reaction product was quantitated under a set of conditions and a correction was applied to the slope for the initial rate measurements. (3) Natural substrates; (a) fibrinogen to fibrin, FpA and FpB by high-performance liquid chromatography (HPLC) and blood clotting curves developing after the release of FpA; (b) the activation of PC to APC.
FXa: (1) N-α-Z-D-Arg-Gly-Arg-pNA (RGR-pNA); H-D-Ile-L-Pro-L-Arg-pNA (IPR-pNA. (2) Prothrombin activation to thrombin.
Plasmin: Pyr-Glu-Phe-Lys-pNA (EFK-pNA); H-D-Val-Phe-Lys-pNA, (VFK-pNA); H-D-Val-Leu-Lys-pNA (VLK-pNA).
APC: H-D-Ile-Pro-Arg-pNA (IPR-pNA); Pyr-Glu-Pro-Arg-pNA (EPR-pNA).
Michaelis–Menten parameters of the reactions were characterized as a function of pH and dependence on NaCl concentrations at 25.0 ± 0.1 °C. The optimal pH was above 8.4 for chromogenic and fluorogenic substrates of thrombin and at 8.0 for all other reactions.
It has been shown [3,17,18,19,57] that the deacylation manifold is faster than acylation in serine protease-catalyzed hydrolysis of amides and peptides and, thus, the rate-determining step is generally in the acylation manifold. Strongly bound or poorly aligned leaving groups can present barriers. Accordingly, it is proton-transfer assisted either C–O bond formation to Ser195 and/or bond fission to the leaving group that is typically revealed by these studies. In terms of elementary rate constants, since k2 < k3, kcat/Km = k1k2/(k−1 + k2) and kcat = k2., The rate of reaction occurs near diffusion control at low substrate concentrations, i.e., kcat/Km = k1 [139], in the reactions of highly developed enzymes with very efficient, as the natural, substrates. Because the isotopically sensitive step is concealed, only a small isotope effect for encounter (~1.17) is expected. However, if conformational adjustments accompany encounter many small inverse isotope effects result. These can add up to values 0.3–0.9 [4,5,20,22].
Initial rates were measured or full progress curves constructed for the above systems at the optimal pH and at 25.0 ± 0.1 °C. Some kcat/Km values approach 108 M−1 s−1 as was reported for k1 the rate constant for association of the best substrates with thrombin. P-nitroanilide tripeptides give the highest reaction rate constants. There are four orders of magnitude difference in the value of the kinetic parameters from the simple PR-AMC substrate to the most efficient FPiR-pNA substrates of thrombin. The kinetic parameters obtained [20,22] reflect on the compliance of the subsites, especially in the S3 location. The lack of a P3 residue in PR-AMC results in a large Km and a small kcat values. Somewhat unexpected is that the decapeptide substrate of thrombin does not bind better than PR-AMC does, which is likely a consequence of the compromised fit of the leaving group segment. The disadvantage is compensated for by a great kcat value and, thus, a large bimolecular rate constant value. The encounter of thrombin and the decapeptide occurs at near the rate of diffusion.
An extensive statistical analysis of the proton inventories involved fitting of 6–8 mathematical models to the data: adaptations of the Gross–Butler equation of the five most useful models are shown in Chart 1 [4,5,20,22].
In the Chart 1, kn represents an observed rate constant, Vmax or Vmax/Km (kcat or kcat/Km) determined at n > 0 and kH represents rate constants determined in water (n = 0). The fractionation factor for the reactant state was set to RS = 1. (TS fractionation factors, ɸn, and an exponential term for H-bond contributions from water (sn) were the fitting parameters.) The calculations were performed with each proton inventory study and the model with the smallest value of χ2 yielding self-consistent fractionation factors between Vmax and Vmax/Km measurements were identified. Specific models are shown for protonic participation at the TSis and solvent (solv) of the rate-determining step. A general solvation term was calculated as an exponential dependence on n.
As the D/H fractionation factor (ɸ) calculated for an H-bond is an equilibrium constant for the exchange of H for D between a site on a protein and the protic solvent, i.e., L2O (L = H, D), it can be written as; ɸ = [Active site-D][Hsolvent]/[Active site-H][Dsolvent]. This expresses the preference of the active site for D over H in reference to the solvent, i.e., an inverse deuterium solvent isotope effect [4,5,19,20,59,65]. The shorter and stronger the H-bond, the smaller the value of ɸ. The classical representation of the potential energy of the proton vibration in the proton bridge is a double well model, in which the minima in the wells are centered at one covalent bond length from the donor and acceptor heavy atoms. As the donor and acceptor atoms move closer to each other, the wells approach each other and become broader and shallower. The origin of the difference between proton and deuteron transfer at the TS lies in the loss of the difference in zero point energies existing in the ground state vibration of H/D in bonds to other atoms. Due to the 2-fold greater mass of a deuteron than a proton, its zero point vibrational energy decreases (2)1/2 –times, which results in a decreased preference for deuterium over protium (ɸ). An estimate may be made from the value of ɸ of the length of the SHB by empirical methods. However, a refined approach may involve quantum effects or polarization effects. Electronic and nuclear quantum effects are generally small and undetectable by classical methods, but unique to SHBs unlike in H-bonds with longer bonds.
In most of the reactions studied, it is assumed that the rate-limiting step is acylation for both the kcat/Km and the kcat terms and, thus, the fractionation factor for proton transfer at the TS should be the same for the two terms but the contribution of solvation is usually quite different. Ostensibly, the solvation term is important in binding and not at all in the catalytic chemical step. Due to the complex contribution of solvation, which can have either a normal or an inverse overall SIE, the shape of the proton inventory for the kcat/Km term is frequently bowl shaped or dome shaped.
Table 1 illustrates selected numerical data for the most plausible models, which gave the best statistical results as measured by the χ2 and F tests for the proton inventory study of the thrombin-catalyzed hydrolysis of N-t-Val-Pro-Arg-7-AMC (VPR-7-AMC). The data for the model of choice based on the goodness of fit, consistence and a sensible mechanism, are printed in bold face letters in Table 1. Figure 1 shows the proton inventory curve on the left side. On the right side of Figure 1 is a representative curve for an internally fluorescence-quenched substrate, (AB)Val-Phe-Pro-Arg-Ser-Phe-Arg-Leu-Lys(DNP)-Asp-OH, (P1-P3-P1′-P3′ = FPR-SFR).
It is noteworthy that almost identical TS fractionation factors were calculated for the two-proton transfer plus solvation model, under kcat as well as kcat/Km conditions, consistent with the proposition that acylation is the rate-determining chemical step for both Michaelis–Menten parameters of this reaction. For kcat, fractionation factors for TS1 and TS2 were 0.57 (isotope effect = 1.9 for each proton transfer) while they were constrained to be equal whether solvation was calculated or not. That is, the fractionation factor for solvation was calculated to be 1.0 within experimental error. There was a slight difference between the two fractionation factors when the contribution of solvent was constrained to 1.0 but ɸ1 and ɸ2 were unconstrained. Nearly the same value, 0.55, was obtained for the kcat/Km term when the values of the fractionation factors for TS1 and TS2 were constrained to be equal, but the contribution of solvent was calculated. As the up-bulging curve for the dependence of the kcat/Km isotope effects on n suggests, there is a strong contribution of solvent reorganization at the TS for this term. The deduced data are most consistent with two protons participating coupled to either the formation or breakdown of the tetrahedral adduct in the rate-determining acylation. In the spirit of the mechanism depicted in Scheme 1, the catalytic protons are between Ser195-His57 and His57 and Asp102. Solvent reorganization occurring at the TS for acylation masks the contribution of the proton-transfer steps under kcat/Km conditions in the overall solvent isotope effect, but the proton inventory analysis aids in unravelling the contribution and nature of elementary steps.
Figure 2 offers another example, the proton inventory results for two FXa-catalyzed reactions. The data for the Michaelis–Menten parameters are plotted on the left side. On the center graph, the resolution of the phenomenological rate constants into elementary steps on the center graph for the hydrolysis of RGR-pNA is shown, with somewhat diminished precision. The KSIE for kcat/Km and Kas = k1/k−1 are quite similar, while the KSIE for kcat is clearly a weighted function of k2 and k3. The substrates have an Arg at the carboxyl side of the bond cleaved and comply with preferences for the P2 and P3 sides. Both substrates present concave proton inventories under enzyme saturation by them. Again, the best statistical fit is with a model for two equal proton transfers at the TS under saturating concentrations of substrates. The RGR-pNA substrate also gives a small SIE, 0.78, even for kcat, indicating a contribution from solvent restructuring, ostensibly associated with rate-limiting leaving group departure. But the fractionation factors calculated at substrate concentrations below Km differ from those for kcat.
The KSIEs and fractionation factors for the model best fitting each proton inventory are summarized in Table 2. The KSIEs for kcat are near 3 with simple fluorogenic substrates and 2.2 ± 0.2 for two intramolecularly fluorescence-quenched substrates. Intrinsic isotope effects between 2.5 and 3.5 are most likely primary effects, meaning that protons are transferred in the rate-determining step of the hydrolysis reaction. Proton transfer becomes a component of the reaction coordinate for bond breaking or making at the TS. The fractionation factors for kcat and kcat/Km for the rate-determining chemical step in acylation of the enzymes by the substrates containing certain P1–P4 residues are nearly identical. One or two KSIEs are extracted from the fractionation factors (Table 2) for one or two protons participating in the rate-determining step. The intrinsic KSIEs for proton transfer in the reactions catalyzed by the four enzymes are between 1.0 and 3.9. The fractionation factors are near 1.0 ± 0.4 for solvation terms at saturating concentrations of the substrates except for one. The KSIEs for the kcat/Km term are between 1 and 2.1 and present curved proton inventories as all include a term for solvate restructuring. However, the intrinsic KSIEs for the rate-determining proton transfer step are typically near the values obtained for kcat.
A deeper insight can be gained from further analyzing the data; an example is for the simplest substrate of thrombin, Z-Pro-Arg-AMC. Its hydrolysis involves a small value of ɸs for kcat but a larger value for kcat/Km. The value of 0.8 for solvation in the kcat phase is indicative of some solvent rearrangement accompanying C–O bond formation. Furthermore, the fractionation factor for solvation can be calculated for Km from the ratio of the ɸs as follows; V/Kɸs/Vɸs = 1/Kɸs = 1.22/0.8 = 1.5, which is the SIE for dissociation: its inverse, the SIE for Kas, is 0.67. This is of interest, because Km is an uncomplicated dissociation constant in this case and the SIE simply is a measure of solvate restructuring in the association/dissociation manifold.
At low substrate concentrations, the most reactive thrombin tripeptide substrate due to its optimal sequence, D-Phe-Pip-Arg-pNA, behaves somewhat differently: it has an isotopically insensitive rate-determining step [20,120]. At enzyme saturating concentrations the proton inventory is best fit with the two SHB plus solvation term model, giving a SIE = 0.5 for a solvation term (see Table 2). The acylated analogue of this substrate has been known to be a “sticky” substrate [114], which is entirely commensurate with rate-limiting leaving C–N bond fission and leaving-group departure. This process associated with the highest energy barrier on the reaction path entails a net increase of isotopic fraction factors for numerous solvating proton bridges.
The inclusion of specific P1′-P3′ residues in the substrates of thrombin introduces more complexity. It elicits large solvent rearrangements at the TS even in the kcat term in one case (FPR-SFR). The decapeptide substrate (Figure 1, right side) shows a domed curve for kcat with a best fit model of two SHBs at the rate-limiting TS sites plus a large fractionation factor for solvation (3.1), which again is consistent with a rate-determining leaving group departure. Nonetheless, the model for two fractionation factors for SHBs at the TS agrees well with the results obtained with tripeptide substrates. However, the thrombin-catalyzed hydrolysis of the nonapeptide substrate (SPR-SFQ) gives a proton inventory with a single proton bridge at the TS, which is in contrast to the short substrates that possess good complementarity at the S1–S3 subsites and are associated with two-proton bridges at the rate-determining TS. It is as if the introduction of the P’-sites disrupted the correct alignment at P-sites, which introduced compensating terms for intrinsic KSIEs. The existence of exosite interactions in natural substrates may serve exactly to prevent such misfits. The nonapeptide case is consistent with the rate-determining leaving group departure and also with the well known conformational adjustment of thrombin. The lack of binding interactions at the exo site in the reactions of short substrates creates an opportunity to discern the balance between the SHB-assisted chemical steps and physical steps including solvate rearrangements in the reaction sequence and the nature of rate-determining TS under various conditions. The allosteric plasticity of thrombin was investigated further with the natural substrates.
5.2. Proton Inventories for the Hydrolysis of Natural Substrates Catalyzed by Thrombin and FXa
For the first time, three zymogen activation reactions were studied for the elucidation of the role of proton bridges [21,22]. As expected, these reactions posed analytical challenges and the quality of data obtained is inferior to those with substrate mimics.
Thrombin binds in the central region of fibrinogen and cuts off the FpA and FpB peptides in sequence from the Aα and Bβ chains, respectively. Fibrinogen activation to fibrin consists of at least three major steps:
Fibrinogen → FpA + fibrin1 → FpB + protofibril → lateral polymerization → fibrin mesh
This reaction sequence was studied extensively by monitoring the formation of products and also by analyzing developing turbidity manifest in light scatter. Reports [88,114,116] on turbidity studies claimed that the second bond cleavage and the accompanying lateral polymerization occurring with conformational change are the physical steps monitored in these experiments. The cleavage of the bond to FpA occurs significantly faster than the rest. Accordingly, as shown in Figure 3, the lag time in the curves reports on protofibril formation, then the protofibrils aggregate laterally, which is associated with the maximal slope of the curve. The thickness of the fiber clot may be discerned from the final absorbance. These reactions show a great dependence on specific ions. The top curve on the left side of Figure 3 indicates that in the presence of F− ions, the precipitate is thicker than in the presence of Cl− ions. The thickness of the clot decreases in the presence of cations in the following order; Ca2+ > Na+ > choline+. The presence of a lag time is pronounced in choline Cl− shown in the lowest curve on the left side of Figure 3. Structural effects of ions are more pronounced in H2O than in D2O. Both the lag time and the maximal slope of the blood clotting curves depend on the ion-perturbed water structure. Structural changes in blood clots are associated with substantial changes in water structure in the direction of looser intermolecular H-bonding accompanying finer particle size. The pivotal importance of the rearrangement of water channels during conformational changes in FpB formation is consistent with this unique observation.
A systematic proton inventory study, in the presence of NaCl, of the lag times and slopes of the blood-clotting curves, shows exponential dependence on the atom fraction of D in the buffer displayed in Figure 4 on the right side. Consequently, the KSIEs are very inverse and, thus, the fractionation factors are large for solvent rearrangement, probably, when FpB forms. The equations of the lines are derived from the best-fit all-solvation model, which depicts a conglomerate of small inverse SIEs each from a solvation site in the polymerization process. The SIEs are more inverse in the presence of Na+ and Cl− ions that promote lighter clotting, indicating a net decrease in the strength in H-bonding. The introduction of D in the buffer counteracts this trend. As substrate concentrations were enhanced, the SIEs became increasingly inverse. This result supports that with the tightening of interlocking H-bonds, their strength amplify and/or the water structure tightens around the lateral fiber. The phenomena of inverse KSIEs are corroborated by other polymerization reactions that involve major solvent restructuring.
Figure 4 also shows on the left side, the proton inventory for fibrinogen activation monitored by HPLC. The Na+ ion concentrations were varied to probe the catalytic machinery as it adopts the efficient conformation of thrombin operating in fibrinogen activation. Remarkably, the statistically most relevant model of the proton inventory curves for kcat and kcat/Km indicated the participation of two similar (identical) short proton bridges with intrinsic fractionation factors 0.64–0.66 in fibrinogen processing by thrombin. Most likely, it is associated with the first covalent step in the natural reaction, i.e., the acylation of the catalytic Ser during bond cleavage to FbA. The bond forming/breaking is aided with a concerted dual proton transfer to bring down the TS potential energy barrier. Solvent restructuring does not show a SIE when the two-proton model is calculated. Thus, the proton inventory of this acylation reaction is uncomplicated by comparison to the internally fluorescence-quenched peptide substrates of thrombin, vide supra. Similarity appears between proton inventories for fibrinogen and the p-NA peptides that give similar TS fractionation factors for the two-proton bridge model (Table 2). The internally fluorescence-quenched decapeptide mimic of FVIIIa also shows two and similar TS fractionation factors. An accompanying large-inverse fractionation factor indicative of a substantial solvent rearrangement (Figure 1) is consistent with rate-limiting leaving group departure. This is not the case for the natural substrate, which may receive aid for leaving group departure from remote-site interactions. Amide bond cleavage may be partly or fully rate determining in fibrinogen hydrolysis at substrate concentrations both below and above saturating the enzyme. Two other methods exist to untangle the difficulty of masked chemical steps; the variation of temperature of the reaction or the electrostatic milieu can be changed. Di Cera’s group [114] applied this technique to fibrinogen activation and found that the TS energy barrier originates 67% from the acylation step and 33% from the encounter step at 37 °C but under different experimental conditions to those employed in this study [21].
Zymogen activation catalyzed by thrombin to form APC from PC and the FXa-catalyzed activation of prothrombin in the presence of FVa, phosphotidylcholine and phosphatidylserine (75:25) was studied at low substrate concentrations. All reactions were associated with small inverse SIEs, illustrated on Figure 5 and Figure 6. Apparently, bond fission in these reactions is not the rate-determining step under the conditions studied. Activation of PC to APC by thrombin was monitored using a coupled assay for increasing APC activity with the aid of an APC-specific chromogenic substrate [87,118]. There are fluorogenic substrates that provide greater selectivity for APC [117]. However, the safest technique for the proton inventory measurements is quenching PC activation in the appropriate solvent medium by inactivating thrombin with antithrombin III or hirudin and assaying for emerging APC activity in water to exclude any contribution of the assay reaction to solvent isotope effects. The rate of the reaction dropped to half in the absence of Na+ ions and a lag time appeared. Otherwise, this process is known [88] to be catalyzed by the “slow” form of thrombin, which is less dependent on Na+ ions. The inverse effect in D2O is amplified in the presence of Na+ and Cl− ions as the SIE drops from 1.02 ± 0.06 to 0.75 ± 0.09 when 0.30 M choline chloride replaces 0.30 M NaCl. Although the reaction mechanism of PC activation is not well known, the inverse SIE indicates a rate-limiting physical step in this reaction.
Prothrombin activation by FXa starts with association followed by rearrangement at the aqueous–lipid interface, which are likely to limit the rate. The very role of activation is fulfilled by juxtaposing the reactants on heterogeneous surfaces that enables the chemical transformation. Thus, strong contributions are expected from solvent rearrangement in the FXa-catalyzed physiological reaction. Indeed, very inverse SIEs, 0.2–0.3, were calculated from the data obtained (Figure 6) in the presence of FXa:FVa in 1:4 ratio and 50 μM phospholipid vesicles (LUV), while the substrate concentrations were raised above Km. The implication is that physical rather than chemical steps dominate the rate-limiting phase of prothrombin transformation to thrombin at the aqueous–lipid interface. In fact, the SIE becomes increasingly inverse, reaching a value of 0.19 at high prothrombin concentrations. Meizothrombin intermediate is formed under these conditions but it is quickly channeled to thrombin without release from the membrane-enzyme complex [104]. A conformational switch is required in this case to poise the Arg322-Ile323 bond for fission. This optimal projection of the proteolytic site of prothrombin is supported by binding to the exosite of FXa and near the carboxyl segment of the FVa heavy chain. Clearly, this requires a grand reorganization of myriads of water solvates, which contribute to fractionation factors between 3.3 and 5. Thus, the proton inventory results are in full accord with this physical event being rate limiting. In the presence of FXa:FVa = 1:1 and at enzyme saturation with substrate, the SIEs become small normal, i.e., greater than 1.0. A reversal of the order of bond fission in prothrombin is likely under these conditions as FVa concentrations are low. This has been the case in the absence of FVa in the reaction mixture [104]. As shown in Figure 2, an unmasked picture of the rate-determining events in peptide bond hydrolysis catalyzed by FXa, studied with natural substrate mimics in aqueous buffer, presents very different proton inventories. FXa-catalyzed reactions of chromogenic substrates behave similarly to the thrombin-catalyzed reactions of oligopeptide p-NAs or 7-AMC, i.e., show two-proton bridges at the rate-determining TS. However, N-α-Z-D-Arg-Gly-Arg-pNA·2HCl, a very efficient substrate of FXa, hydrolyzes with a contribution also from solvent rearrangement at the rate-determining TS while saturating the enzyme.
5.3. Probing the Proton Bridges in Covalent and Non-Covalent Adducts of Thrombin
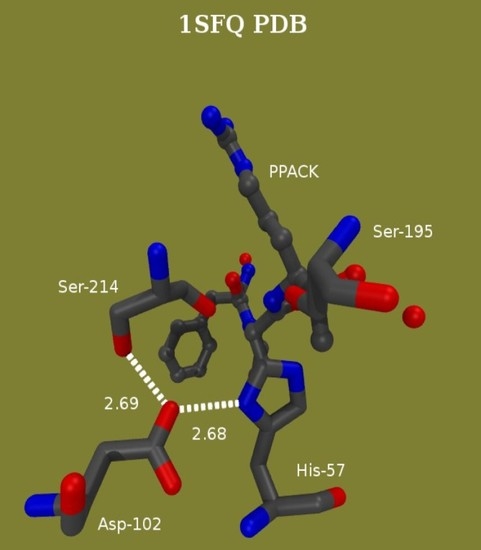
Mechanism-based inhibitors have been used broadly as investigative tools for the elucidation of fleeting TS structures not amenable to immediate observation. A truly effective affinity label of thrombin is Phe-Pro-Arg-chloromethylketone (PPACK) as it consists of amino acids that fulfill the requirements for the P1-P3 binding subsites. It attaches to the active site Ser195 and crosslinks with His57, thus creating a good mimic of the tetrahedral intermediate in the acylation of thrombin, shown in Figure 7 on the left side [23]. The correspondence between amino acids in the PPACK and subsites at the thrombin active site enforces tight interactions. The proton bridges of the catalytic apparatus may thus be compressed. Another broadly tested group of covalent modifiers of serine hydrolase active sites are phosphate and phosphonate esters. The negative charge density accumulates around the esters, which repels nucleophilic attack at P for either self-catalyzed or chemical reactivations. Frequently, this is further exacerbated if an alkoxy ligand hydrolyzes off or dealkylates. Dealkylation also occurred when thrombin was inactivated with paraoxon and NPMP (4-nitrophenyl-2-propyl methylphosphonate). Figure 7 on the right side shows the dealkylated product at the paraoxon –inhibited thrombin active site. The charge density is thus further enhanced and it and the geometry of this structure resemble the intermediates in deacylation.
5.3.1. Kinetic Characterization of Thrombin Inhibition with Covalent Modifiers
Inhibition reactions were carried out [23] as a function of concentration of [I], pH, temperature and ionic strength. The data analysis was performed in accord with Equation (2), as the rate constants showed hyperbolic dependence on [I] consistent with Michaelis Menten kinetics. First-order rate constants were calculated from data obtained at [I] << Ki and second-order rate constants were calculated from inhibitor dependence of the observed rate constants. From the dependence on PPACK concentration, the individual rate constants were also calculated although with low precision. The kinetic and thermodynamic data are tabulated in Table 3.
Ki−1 kh/k−h kalk
E + I![Life 11 00396 i001]() EI
EI ![Life 11 00396 i002]() EI*
EI* ![Life 11 00396 i003]() EI**
EI**
E + I
 EI
EI  EI*
EI*  EI**
EI**
The kinetics of binding of small inhibitors resemble the initial steps of reactions of normal substrates. As discussed earlier, the inhibition of thrombin with PPACK occurs with the intervention of a tetrahedral covalent adduct which forms without the departure of any fragment from the molecule and thus resembles the tetrahedral intermediate formed after nucleophilic attack on a substrate of thrombin. The maximal second-order rate constant, ki/Ki, for the inhibition of human α-thrombin with PPACK was determined to be 2.15 × 10⁷ M−1s−1 at pH 8.1 and 1.07 × 10⁷ M−1s−1 at pH 7.00 and 25.0 ± 0.1 °C. The Ki value for PPACK inhibition of thrombin is over 100 fold smaller than the Km value for the best chromogenic substrate of thrombin, FPiR-pNA, at pH 8.0 [20,113,118]. The tripeptide segment of the two structures are nearly identical as Pip is an analog of Pro. Although Km is a complicated constant with contributions from rate constants for elementary chemical steps, its numerical value is identical to the dissociation constant for the reaction of FPiR-pNA with thrombin. The implication is then that Ki for thrombin inhibition by PPACK is reduced by a factor which includes terms pertaining to events ensuing the binding step (Equation (2). It is almost certain that formation of the hemiketal anion, kh, precedes alkylation of His57 by the methylene group and the departure of Cl− (kalk). It probably contributes to the rate-determining step in Equation (2). The kinetic and thermodynamic data of covalent inhibition of thrombin are in Table 3.
The activation barrier for the self-catalyzed inhibition of thrombin by PPACK is given by the values of ΔH‡ = 10.6 ± 0.7 kcal/mol and ΔS‡ = 9 ± 2 cal/mol K. The activation free energy of ΔG‡ = 7.85 kcal/mol can be calculated from the second-order rate constant at pH 7.00 and 25.0 ± 0.1 °C, calculated using the Eyring equation. The difference between ΔG‡ and ΔH‡ is 2753 cal/mol, the value of TΔS‡, which gives ΔS‡ = 9 cal/mol K. A nonlinear fit of the temperature dependence of the second-order rate constant gives a value in great agreement with this value. This means that the TS of the rate-determining step for ki/Ki has more favorable entropy than the free enzyme and 1 M inhibitor have. Thus, the TS has a more favorable electrostatic environment associated with formation of the hemiketal anion than the TS of a simple noncovalent association of the enzyme and the inhibitor. By comparison, the thrombin-catalyzed hydrolysis of FPiR-pNA, the structural substrate analog of PPACK, gave a value of ΔH‡ between 10.21 and 11.14 kcal/mol for the acylation rate constant (k2) under similar conditions [115,118]. The TSs for the two reactions have similar quasi-tetrahedral character and similar charge distribution.
From Table 3, the pKa of 7.3 is consistent with catalysis by His57 as the unprotonated His base is needed to promote the reaction. The pKa of the amino terminal Ile16 residue, which is engaged in a salt bridge with Asp194 thereby keeping the oxyanion hole in the correct conformation for catalysis, agrees well with a second pKa of 8.8. This observation has also been reported for other thrombin-catalyzed reactions, including those in this study [20,23,118,120].
Another intermediate occurs in the substrate reaction sequence in the course of deacylation after water attack on the acyl enzyme. Phosphate and phosphonate ester adducts of thrombin especially after dealkylation (aging) model this intermediate [23,27,28,94,96,140,141,142,143,144,145,146]. Deacylation in a natural reaction of thrombin involves significant negative charge accumulation at the oxygens of the tetrahedral intermediate, which also occurs at P in the in phosphorylated active sites [146]. However, paraoxon and NPMP inhibit thrombin 7 and 6 orders of magnitude less efficiently than does PPACK. The pH-rate profiles of the two classes of inhibitors are quite different. The pKa of His57 in the phosphate and phosphonate adducts approaches 8.0, which is consistent with the enhanced negative charge accumulation described. Whereas these pKas are half a unit higher than that for PPACK inhibition, the upper pKa value assigned to the more remote Ile16, are similar in the three adducts because the stronger negative electrostatic environment around P enhances the basicity of His57 only.
The KSIEs are near unity for the second-order rate constants of all three inhibition reactions of thrombin. This result is not surprising as the kcat/Km for the thrombin-catalyzed hydrolysis of FPiR-pNA is also associated with a unit KSIE. The fractionation factor for the TS of the association of thrombin with FPiR-pNA or that of the sequential conformational change is one [20]. The fractionation factors for the encounter between thrombin and PPACK is 1.0 at pH 7.45 and 0.93 at pH 8.00 within ~10% experimental error. These results with thrombin deviate from the solvent isotope effect obtained for elastase inhibition by a peptidyl chloromethyl ketone, which is 0.65 at [I] < Ki [64]. Interpretations of this result, however, include the possibility of a TS fractionation factor of 1.0 for ki/Ki, if there is a compensation of terms due to the contribution of solvent reorganization in elastase inhibition by the peptidyl chloromethyl ketone. Ostensibly, the significant differences in the subsite binding environments of the two enzymes and the allosteric flexibility of thrombin lie at the heart of the differences.
5.3.2. SHB in Covalent Adducts Detected by Low-Field 1H NMR
The low-field 1H NMR signals at 18.10 and 17.34 ppm for the analogs of the tetrahedral intermediate for acylation and of the intermediate for deacylation, respectively, establish the presence of an SHB in the covalent adducts of thrombin [23]. PPACK-inhibited thrombin shows a peak at 18.10 ± 0.05 ppm in 7% D2O and at 17.8 ppm in 55% D2O, while the peak for the integration standard proton sponge in acetonitrile-d3 is positioned at 18.60 ± 0.05 ppm. This result was reproduced several times. The line width of the signal at 18.10 ppm sharpened with increasing temperature relative to the proton sponge, indicating a faster proton exchange at the 18.10 resonance. The 1H NMR signal with paraoxon-inhibited thrombin at 17.34 ppm in 7% D2O was assigned to the dealkylated adduct as it emerged slowly and reached a maximum after 50 h. After the loss of the ethyl group, strong negative charge accumulates on the oxygen at P and provides deshielding of the proton bridge. Nearly identical results were obtained with the phosphonate inhibitor, NPMP. The highly deshielded signals occurring in these adducts reflect the negatively charged environment deeply buried in the canyon where the active site resides.
From the low-field signal intensity measured in different isotopic mixtures of buffered water, an isotope effect of 2.2 ± 0.2 was calculated for the formation of a proton bridge which occurs at the active site in the PPACK-inhibited thrombin. Again, this isotope effect denotes the presence of an SHB. The minima in the vibrational potential energy well for the H-bond, vide supra, are typically separated by distances between 0.4 and 0.7 Å [74]. An empirical correlation can be derived, a third-order polynomial fit of ɸ to the distances between the minima of the two vibrational potential energy wells [7,10,11,14,23,24,25,26,68,69,70,71,72,73,74,79,80,81]. Because the covalent bond length in O-H and N-H bonds are close to 1.00 Å, two covalent bond length, 2.00 Å, are added to the distance between the minima of the wells to yield the distance between donor and acceptor in a proton bridge. Performing this calculation yielded the same bond length of 2.62 Å and with the same precision as estimated from the chemical shifts for the PPACK- inhibited thrombin using a correlation of chemical shifts and N–H–O bond distances in small crystals [14,23,24,25,26]. Donor-acceptor distances of His57δNH and Asp102γO or Asp102γO and Ser214γOH in PPACK-inhibited thrombin from crystallographic data compare well with these finds [87]. Adducts of paraoxon and NPMP with thrombin gave similar values, 2.62–2.64 Å, to that calculated for the SHB in the adduct with PPACK.
Notably, in corresponding analogs of tetrahedral intermediates in serine proteases [7,10,68,69,70,71,72,73,74] and in the double-displacement mechanism of ester hydrolysis catalyzed by cholinesterases [14,24,25] nearly identical resonances were reported to the three cases with thrombin. The protonated His57 of the native enzymes gave a similar peak in most cases at pH below 6. In contrast, we have not found a signal with the native thrombin between pH 5.3 and 8.5. While proton exchange is faster in thrombin than in the serine hydrolases interrogated [92], the proton bridge at the active site in the native thrombin appears to be longer than the proton bridges at the active site of other serine proteases. This may be due to the vicinity of residues around the proton bridge in the His-Asp pair, which can serve as catalysts of proton transfer in a relay at the pH values in our study.
As the kinetic studies demonstrated (Table 3), the TS for binding the small inhibitors does not manifest in SHBs, but the stable adducts of the same inhibitors with thrombin show at least one unique SHB at the active site. This is in agreement with that found for the first step of hydrolysis of fibrinogen to FpA, shown on the left side of Figure 4 [21]. It appears reasonable to assume that these SHBs also occur in tetrahedral intermediates on the thrombin-catalyzed reaction path. However, these small-molecule modifiers of the thrombin active site lack critical remote interactions of natural substrates at exosites. In particular, the fibrinogen binding exosites determine the substrate selection regulated by Na+ ion binding at an adjacent location [87,88] as delineated in Section 4.1.
5.3.3. A 1 ns Molecular Dynamics (MD) Simulation and Preliminary Quantum Mechanical/Molecular Mechanical (QM/MM) Calculation
Quantum mechanical/molecular mechanical (QM/MM) and MD calculations targeted all systems under high-resolution 1H NMR investigations [147]. The conformational mobility of the active-site region in thrombin was examined first in the MD simulation. This simulation indicated a tight H-bonding arrangement between Asp102 and His57 being part of the catalytic mechanism of thrombin. The His57 Nδ-H-O Asp102 distance is 2.8 Å in native thrombin [103,147], 2.71 Å in the D-Phe-Pro-Arg chloromethylketone adduct [101,102] and ranges between 2.7 and 2.8 Å in a phenacyl methylphosphonate adducts of thrombin [27].
A new question emerged from the MD simulations of the PPACK-inhibited thrombin; it showed two competing potential SHBs at the active site of thrombin. One is an SHB between His57 Nδ and Asp102 Oβ originally proposed [6,148] and the other is one between Ser214 Oγ and Asp102 Oβ, an equally likely candidate (Figure 8). The MD approach used for the α-thrombin-PPACK covalent adduct showed equal frequency of the occurrence of the two H-bonding options. A more refined calculation uses QM/MM at the B3LYP/6-31G** or RHF/6-31G(d) level of theory. The results of the completed one ns CHARMM [93] simulation of this system are the starting structure for a CHARMM-Qchem calculation. There are about 45 core atoms at the active site. Figure 8 shows the core of the assembly with the two potential SHBs. Both cases indicate ~150 ps periods for SHB formation at donor acceptor distances <2.6 Å for either donor-acceptor pair, during a ns simulation. A refinement of these results is what the QM/MM calculations target. The results of this brief calculation so far point to a slight preference for the His57-Asp102 pair.
It is interesting that in a quantum chemical calculation for RNase A catalysis, contraction of a proton bridge indeed facilitated nucleophilic attack on C. The activation barrier for this reaction was reduced by an SHB in the catalytic apparatus [149].
5.3.4. SHBs in Non-Covalent Adducts of Thrombin
Whether or not SHBs have a role in tight-binding interactions between thrombin and hirudin, as it exists between thrombin and cognate substrates, was investigated next [26]. First, hirudin forms 13 intramolecular H-bonds in its tight core, yet a solution of hirudin alone does not resonate below 12 ppm in 1H NMR. Hirudin binds to thrombin with a Ki of 20 fM. Tight binding of hirudin showed strongly ion-dependent KSIEs around unity in kinetic and equilibrium experiments [150]. But the X-ray structure of the complex also shows numerous intermolecular proton bridges interspersed with salt bridges near the FRS exosite. As discussed, this site is crucial in the allosteric regulation of thrombin function. This is supported by 2D 1H NMR studies of r-hirudin bound to and without thrombin, which revealed that the C-terminal section of hirudin lost some order in solution relative to the same 2D 1H NMR result with hirudin in solution alone [51,151,152,153].
The characterization by low-field 1H NMR, of SHBs in thrombin when inhibited with the non-canonical r-hirudin, its mimics and in comparison to canonical peptide inhibitors posed challenges. We had previously recorded the 1H NMR spectra for thrombin and PPACK-inhibited thrombin shown in Figure 9. A signal at 15.33 ppm arose upon addition of r-hirudin to a thrombin solution, while r-hirudin gave no perceptible signal by itself and no new signal could be detected when r-hirudin was added to the solution of thrombin-PPACK adduct (Figure 9). The experiments gave identical results whether type 1 or type 2 hirudin was used. Both signals, at 18.10 ppm and 15.33 ppm, meet the requirements for an SHB, but the one observable with PPACK at the active site is in an environment of lower electron density than the SHB formed between thrombin and hirudin or its mimics. Notably, when PPACK was added to the thrombin-hirudin complex, the signal for the thrombin-PPACK adduct moved upfield by 0.1 ppm and the peak at 15.33 ppm moved downfield by <0.1 ppm in the ternary complex. Both peaks broadened and became somewhat skewed, which may indicate a proton exchange between the active site and the interface between thrombin and hirudin. PPACK seems to be somewhat less tightly bound to the active site in the ternary complex. The signals are pH independent between 5.6 and 8.8. The proton exchange rate constants at pH 6.5 were calculated at 60 Hz for the PPACK adduct and at 98 Hz for the hirudin complex each at half peak height. The corresponding rate constants are 188 s−1 and 307 s−1 at 30 °C for the thrombin-PPACK adduct and the thrombin-hirudin complex, respectively, unless dipolar effects also contribute to the line width. Polarization effects resulted in peak broadening at 5 °C. Frey and coworkers reported a similar observation [70].
The resonances of the adducts of thrombin with hirudin mimics were similar to that of the thrombin hirudin adduct, displayed on the left side in Figure 10. Further experiments with the hirunorm V-inhibited thrombin in the temperature range 5–35 °C gave the peaks on the right side of Figure 10. Peak broadening and a shift to lower field with decreasing temperature are seen, which may be attributed to decreasing solubility and aggregation of the adduct or polarization effects. The effect of Na+ ion concentration on the resonance obtained with thrombin complexed to hirudin and its analogs was not perceptible in the range on 0.09–0.31 M.
The 1H NMR resonance obtained with the t-RGD-hirudin is 0.21 ppm more deshielded than the hirudin signal which may be due to changes in the environment of the interactions between the FRS, a critical binding region, and the RGD sequence. RGD replaces an SDG sequence in the natural hirudin. In contrast to the RGD-hirudin signal, the complex of the Nα(Me)Arg-peptide with thrombin gives essentially the same resonance as the thrombin-r-hirudin complex does implying that the same or similar binding elements are involved in the two cases. The Nα(Me)Arg-peptide was designed for enhanced binding affinity and storage stability by introducing methylation of the Arg in the P1 position to exclude binding at this site [52,154]. This close analog of the C-terminal peptide of hirudin is tethered to the N-terminal segment with a poly-Gly linker, which interacts with human α-thrombin (Ki = 37 pM).
The complex between thrombin and a canonical inhibitor, D-NAPAP (Nα-2-naphthylsulfonyl-glycyl-DL-4-amidinophenylalanyl-piperidide acetate), shows a weak signal at 15.35 ppm with a line width of 125 Hz broader than in the other complexes (Figure 10). D-NAPAP binds at the binding region of the active site in thrombin in the predominant canonical orientation as is the case with PPACK [155]. D-NAPAP also inhibits trypsin and binds in a similar manner at the active site, yet it does not give a signal at lower field than 12 ppm from DSS (4,4-dimethyl-4-silapentane-1-sulfonic acid sodium salt) under the conditions of our experiments. The canonical inhibitors form an antiparallel β-sheet with the Ser214-Gly216 segment of thrombin. Twin H-bonds are prevalent between the backbone N and O of Gly216 and the O and N of Gly in the P2 position of D-NAPAP [155,156], as they occur in the PPACK-bound thrombin. The peak at 15.35 ppm indicates the presence of an SHB probably in this region. If D-NAPAP binding results in sequestering or compressing the active site of thrombin, an SHB may form in the catalytic triad. While His57 in the thrombin-D-NAPAP complex is likely to be protonated at pH 6.5 to give rise to the signal, this contradicts the absence of the low-field 1H NMR resonance in native thrombin at this pH. The occurrence of an intermolecular SHB at a binding site is just as possible. By comparison, chymotrypsin forms a neutral hemiacetal with N-acetyl-l-leucyl-l-phenylalanal with a chemical shift near 15 ppm [157].
A stark contrast can be discerned in the binding patterns at the active site of thrombin, between hirudin and its mimics, and D-NAPAP. The N-terminal head of r-hirudin forms a parallel β-strand with thrombin (residues 214–219) making a non-substrate like interaction. The first three residues at the N-terminus (Ile1′-Val2′-Tyr3′) of hirudin penetrate the active site and aryl binding site where they interact with the S2 and S3 specificity sites and form proton bridges to His57 and Ser214, but avoid the the S1 binding site of thrombin. A tightly packed central structure can be observed with intramolecular H-bonds, yet these do not present a signal below 12 ppm in the 1H NMR spectrum of hirudin alone. Hirunorms bind to the B chain of thrombin and partly block the active site. Also determined in the X-ray structures of the thrombin complexes is the identical geometry of the catalytic triad, the distance and angle between N and O, which are as in native thrombin. The resonances measured between 15.17 and 15.54 ppm are consistent with donor-acceptor distances <2.70 Å, and an angle of >150° which were calculated from chemical shifts as described above [14]. They compare well with the crystallographic data for the donor acceptor distance in many H-bonds between α-thrombin and r-hirudin, RGD-hirudin and hirunorms. Moreover, from the pH profile for the binding of hirudin to thrombin, we calculated pKa values of 7.1, 8.4 and 9.2, which are consistent with the values from the native enzyme for His57, the N amino terminal and the amino group of the Ile residue, respectively. Yet, the pH independence of the 15.33 ppm resonance testifies to the independence of the signal from the ionizing residues (His, N-terminal and Ile). The totality of these results safely excludes the active site as the source of a SHB in the hirudin-inhibited thrombin.
Equilibrium deuterium isotope effects for r-hirudin-inhibited and hirunorm IV and V–inhibited thrombin were measured at pH 7.5 and 6.5 in the established pH-independent range. An example is presented in Figure 11. Fractionation factors between 0.67 and 1.0 were calculated for r-hirudin-inhibited thrombin from the resonances at 15.33 ppm at pH 6.5 in 0.020 M citrate buffer, 0.10 M NaCl and 25.0 and 30.0 ± 0.1 °C. The fractionation factor of 1.0 for the hirunorm V-inhibited thrombin was calculated from the 15.17 ppm resonances under the same conditions. At elevated salt concentrations, above 0.30 M, the fractionation factor is 1.15 for the complexes of thrombin with r-hirudin and RGD-hirudin. The estimated precision in the integration is 20%. These results differ with the fractionation factor of 0.45 ± 0.04 obtained for the active-site inhibited thrombin by PPACK, indicating a shorter proton bridge in an environment of lower dielectric milieu for the latter.
5.3.5. Sequence Specificity of the 1H NMR Resonances in Thrombin-Hirudin Complexes
In the possession of an arsenal of structural information, the SHB at the interface of thrombin and hirudin should be possible to locate. Three tight-binding regions seemed the most likely candidates for the origin of the SHB giving rise to the 15.33 ppm signal. The binding epitopes on fibrinogen exist in r-hirudin as Ile1′, Tyr3′ Val21′ and the Glu57′ Glu58’ pair. Our inquiries into the nature of the SHB allows for selective elimination of some of the candidate regions. (1) The emergence of the 18.00 ppm peak after addition of PPACK to the thrombin-hirudin complex, while the 15.33 ppm peak remains, is inconsistent with the existence of an SHB at the active site in the first place. (2) The pH and Na+ ion independence of the 15.33 ppm resonance contradicts the presence of an H-bond at the N-terminal amino group of thrombin in the complexes formed between thrombin and the hirudin family of inhibitors. (3) The structures of hirunorms contain a β-(2-naphthyl)alanine at the P3 site, which is an unlikely H-bonding partner to H-donors and acceptors at the active site of thrombin and, thus, precludes a SHB forming at this site to give rise to the resonance at 15.17 ppm. (4) Participation of Val21’ is abrogated in the hirudin mimics. (5) Consequently, the origin of the SHB is predicated on one or more proton bridges between Glu57′ or Glu58′ as H acceptors embedded among hydrophobic residues at the C-terminus of hirudin and Arg75 and Arg77 of thrombin as H donors. In fact, Arg75 and Arg77 are solvated with water, which are reported to involve H-donor-acceptor distances of 2.6–2.8 Å [128,129]. The most likely site of SHBs is embedded among hydrophobic residues at the C-terminus of hirudin are shown in Figure 12. Such an SHB may result from a compression as the interactions between α-thrombin and hirudin are fine tuned. An SHB between a carboxylate ion and guanidinium ion (Arg) is well supported by the pH independence of the 15.33 ppm peak between pH 5.6 and 8.8.
The X-ray structure of the α-thrombin-(r)sulfohirudin complex was solved at 1.84 Å resolution [55]. The interactions of Tys63 in hirudin with α-thrombin are electrostatic with ample opportunities for additional H bonds including SHBs. A prominent interaction is between Tys63 in hirudin and Tyr76 in thrombin dominated by a H bond between a phenolic OH and an oxygen of Tys63. A water molecule also H bonds with the oxygen of Tys63, which mediates a water bridge involving another oxygen of the sulfate group, a backbone amide group, and a backbone carbonyl group. Tys63 is also in a salt bridge with Lys81 in thrombin. This interaction is lacking in α-thrombin modified by the synthetic sulfated-C-terminal peptide, hirugen, containing 10 residues of hirudin [50,158]. Clearly, the sulfate group on hirudin alters the conformation and locks the complex with additional ~3 kcal/mol energy. The totality of interactions, each with small energy, allows for the high potency of native hirudin [37,46]. Presumably, 1H NMR studies would reveal if the binding of these regions of sulfated hirudin to thrombin were associated with SHBs and if so what the nature of the resonances is.
6. Conclusions
Proton bridges with SHBs eminently contribute to the remarkable catalytic prowess of serine proteases of the blood-clotting cascade and other entities with physiological functions that employ acid-base catalysis. Binding of effectors near the active site elicits conformational adjustments and solvate rearrangements that may or may not exhibit the presence of SHBs. In contrast, these subsite interactions result in the contraction of proton bridges supporting the catalytic apparatus in the chemical steps, which is measurable by the methods delineated in this review. Indeed, the KSIEs under substrate concentrations below enzyme saturation show a component of each an isotopically more and less sensitive step. Conformational adjustments in the binding step are brought to light only by SIEs, proton inventories and thermodynamic studies. When the enzyme is saturated with substrate, the KSIEs become normal between 1 and 4, typically without a contribution of solvent reorganization. The proton inventory technique permits access to intrinsic isotope effects for the masked chemical steps and illuminates the mobilization of (multiple) proton bridges in catalysis by the blood cascade enzymes when specific effectors comply with the stringent requirements for subsite interactions. Fulfillment of the specificity requirements at the P- and P’ sites serve to enforce a compression at the TS to lower the activation energy barrier. When leaving group departure is cumbersome, conformational changes and associated major solvent restructuring occur. The zymogen activation reactions of natural substrates are mediated by solvate reorganization due to interactions between enzyme and substrate at the substrate specificity site or leaving-group binding site, shown in a net increase in the isotopic fractionation factors.
SHBs form at the active site of serine hydrolases (and other enzymes) with transition state analog and mechanism-based inhibitors as PPACK and phosphate or phosphonate inhibitors of thrombin. The SHBs had appeared unique to the attainment of catalytic perfection, but this idea was later questioned [9,82,83,84,159,160,161]. Furthermore, a surprising discovery has been an 1H NMR resonance at 18.0 ppm originating not from the catalytic triad in the native rhamnogalacturonan acetylesterase, but from an adjacent SHB between two Asp residues near the oxyanion hole [162]. It became apparent more recently that SHBs are frequent stabilizing elements of tertiary protein structure in compressed regions or in low dielectric fields [163,164]. These are the features that characterize thrombin inhibition with canonical peptide inhibitors, such as D-NAPAP, at the P1 and P2 binding sites, and even more the non-substrate-like binding inhibitors, for instance, at the allosteric FRS at the thrombin–hirudin interface.
Funding
This research was funded partly by the National Institutes of Health Grants 1 R15 HL067754-01 and 1 R15 HL067754-02.
Acknowledgments
I sincerely thank my former collaborators for their contributions to this project: Daoning Zhang, Center for Biomolecular Structure and Organization, Department of Chemistry & Biochemistry, University of Maryland, College Park 20742-3360; Edith J. Enyedi, Suffolk University, 8 Ashburton Pl, Boston, MA 02108; Frank Jordan and Lazaros Kakalis Department of Chemistry at Rutgers, The State University of New Jersey, Newark, New Jersey 07102-1811; Akos Bencsura, Central Research Institute for Chemistry of the Hungarian Academy of Sciences, P.O. Box 17 H-1525 Budapest, Hungary; Paul Kelley, Department of Chemistry, Philander Smith College 900 W. Daisy L. Gaston Bates Little Rock, AR 7220; Carol Wohlmuth, Nejako Drive, Middletown, CT, 06457; John Paul Sheehy MD, College of Medicine University of Cincinnati, 231 Albert Sabin Way PO Box 670515, Cincinnati, OH 45267; Krystal D. Nolan, 2355 Erskine Ave, Charleston SC 29414; Ahmet Baykal, Acibem University School of Medicine, Turkey. The generous gift of hirudin mimics is gratefully acknowledged to the late Vincenzo Pavone and his collaborators, University of Padova, Italy, Wei Mo, Molecular Medicine, Ministry of Education, Fudan University, Shanghai, China and Torsten Steinmetzer, Institute of Pharmaceutical Chemistry, Philipps Universität, Marburg, Germany.
Conflicts of Interest
The author declares no conflict of interest.
Abbreviations
7-AMC, 7-amido-4-methylcoumarin; Cha, cyclohexyl-β-alanine; Chg, Cylohexylglycine; DMSO, dimethyl sulfoxide; DSS, 4,4-dimethyl-4-silapentane-1-sulfonic acid sodium salt; EFK-pNA, Pyr-Glu-Phe-Lys-pNA; EPR-pNA, Pyr-Glu-Pro-Arg-pNA; F, blood clotting factor; FPR-SFR, (AB)Val-Phe-Pro-Arg-Ser-Phe-Arg-Leu-Lys(DNP)-Asp-OH; FPiR-pNA, H-D-Phe-L-Pip-Arg-pNA; FRS, fibrinogen recognition site; FVR-pNA, Bz-Phe-Val-Arg-pNA; HPLC, high pressure liquid chromatography; IPR-pNA, H-D-Ile-L-Pro-L-Arg-pNA; KSIE, kinetic solvent isotope effect; LUV, phospholipid vesicles; NPMP, 4-nitrophenyl-2-propyl methylphosphonate; MD, molecular dynamics; MUGB, 4-methylumbelliferyl 4-guanidinobenzoate hydrochloride; NAPAP, Nα-2-naphthylsulfonyl-glycyl-DL-4-amidinophenylalanyl-piperidide acetate; Nα(Me)Arg-peptide,DCha-Pro-Nα(Me)Arg-Thr-(Gly)5-10Asp-Tyr-Glu-Pro-Ile-Pro-(Glu)2-Ala-Cha-20DGlu; Paraoxon, 4-nitrophenyl diethyl phosphate; PC, protein C; Pip, piperidyl; PPACK, Phe-Pro-Arg-Chloromethylketone; PR-AMC, Z-Pro-Arg- 7-AMC; QM, quantum mechanical; r-hirudin, recombinant hirudin type 1 or 2; r-RGD-hirudin, recombinant 32SGD34 type 2 hirudin; RGR-pNA, N-α-Z-D-Arg-Gly-Arg-pNA; RS, reactant state; SHB, short hydrogen bond; SSHB, short strong hydrogen bond; SPR-SFQ, (AB)Val-Ser-Pro-Arg-Ser-Phe-Gln-Lys(DNP)-Asp-OH; TLC, thin layer chromatography; TM, thrombomodulin; TS, transition state; VFK-pNA, H-D-Val-Phe-Lys-pNA; VLK-pNA, H-D-Val-Leu-Lys-pNA; VPR-AMC, N-t-Boc-Val-Pro-Arg-7-AMC.
Appendix A. Experimental Methods Employed in the Investigations of Short Proton Bridges in the Blood-Clotting Enzymes
Appendix A.1. Materials Used
Human α-thrombin, TM, antithrombin, prothrombin, human factors Xa and Va, PC, plasmin, porcine trypsin, r-hirudin type1 and type 2, substrates, inhibitors and other chemicals were commercial products of highest purity available (95–99%). Internally fluorescence-quenched substrates were custom synthesized by BioSynthesis Inc Lewisville, TX. Fibrinogen and fibrinopeptides A (FpA) and B (FpB), were also 98% purity but further purified by HPLC as needed and the possibility of interference of the biochemicals and adjuvants in the assays were excluded in control experiments. We received generous gifts: RGD-hirudin [51] from Prof. Wei Mo Molecular Medicine, Ministry of Education, Fudan University, Shanghai China, hirunorms IV and V [53,54] from the late Prof. Vincenzo Pavone University of Padova, Napoli Italy] and DCha-Pro-Nα(Me)Arg-Thr-(Gly)5-10Asp-Tyr-Glu-Pro-Ile-Pro-(Glu)2-Ala-Cha-20DGlu (Nα(Me)Arg-peptide) [52] from Prof. Torsten Steinmetzer, Institute of Pharmaceutical Chemistry, Philipps Universitat, Marburg, Germany. 4-Nitrophenyl-2-propyl methylphosphonate (NPMP) was synthesized in this lab previously [20,23,134].
Appendix A.2. Solvent Isotope Effect and Proton Inventory Measurements and Techniques
Enzyme activity was monitored before and after each experiment using active-site titrants or efficient chromogenic or fluorogenic substrate reactions with previously determined kcat values [20,21,22,23]. Spectrophotometric or fluorimetric assays were used to monitor leaving group departure from substrates, or detection of fluorescence produced by substrate hydrolysis. All kinetic measurements were carried out in identically and carefully prepared buffer solutions in freshly distilled H2O and 99% D2O to characterize the pH dependence of the kinetic parameters. Depending on the number and the nature of the participating enzyme acid and base residues, at the TS for the rate-limiting step associated with a kinetic parameter, the dependence of the rate constant as a function of pH can be sigmoid, bell-shaped or occasionally more complicated. The pH independent kinetic parameters (klim1 and klim2) and Ka of the catalyzing acid or base can be calculated from a fit of the observed rate parameter (kcat/Km or kcat) to [H+] in the general form:
k = Kaklim1/(Ka + [H+]) + klim2
The pD (pD = electrode reading + 0.4) dependence of the reaction in D2O was determined in an identical manner, and thus, the solvent isotope effects on the pH-independent parameters and pKs were calculated.
Complete equilibration in D2O at exchangeable catalytic sites were observed with serine proteases under typical experimental conditions and checked in control experiments. Temperatures were maintained within 0.01 °C by appropriate incubation time of all reaction mixtures. The KSIEs were measured first, then mixtures of the buffered isotopic waters were made and the kinetic parameters were determined at a single pH in the pH-independent range of the reactions where k2 (less likely k3) is rate determining. The highest precision was obtained if the initial rate ratios of the velocity in water to that of a particular atom fraction of D (n), Vi,o/Vi,n, were measured as a function of fractional saturation of enzyme with substrate (fA = [S]/(Km + [S]) = 1/(CVf + 1)). The Km value measured in water, CVf, is the commitment factor toward product formation [4,5,6,59] and the partial solvent isotope effects for the Michaelis–Menten parameters were calculated from; Vi,0/Vi,n = fA (DODkcat/nkcat) + (1 − fA)(DODkcat/Km)/(nkcat/Km) [65]. FXa, ACP and plasmin-catalyzed reactions were performed at substrate concentrations saturating the enzyme and followed in full progress curves using the integrated Michaelis Menten Equation (A2) [135,136]:
where A, Ao and Ainf are the absorbance values at time t, 0 and infinity, respectively; ε is the molar absorptivity, [E] is the enzyme concentration, and kcat and Km are the Michaelis-Menten parameters. Equation (A2) was fitted to two sets of 1000 data points from full progress curves. The calculated kcat values for the reaction in each of nine isotopic buffers were used for constructing the proton inventory curve. The Michaeli–Menten parameters calculated were in good agreement with initial estimates from the first 10–50 data points and with published values under similar conditions. Specific models for protonic participation at the TSi (or solvation) of the rate-determining step vide infra were used. Results of the goodness of fit were carefully evaluated and the statistically most feasible model(s) identified.
(A − Ao)/εkcat[E} + Km/kcat(ln(Ainf − Ao)/(Ainf − A)) = t
Appendix A.3. Experiments for Fibrinogen Activation
The reactions were studied under optimal conditions outlined above in the presence of 5–500 mM NaCl [21]. The reaction was run at fibrinogen concentrations 0.5–30 nM around Km with <0.2 nM thrombin. The rates were adjusted at the working temperature, 37 °C, for convenient sampling at >30 s intervals. The reaction was terminated by the addition of HClO4 (~0.3 M). Analysis of the supernatant of the centrifuged solution of the re-dispersed protein were by HPLC using C18 10 µ resin in analytical columns. Elution of the peptides were with 0.02 M pH ~6 buffers using acetonitrile for a linear gradient. In other experiments the turbidity emanating from fibrin formation was monitored by light scatter at 350 nm.
Appendix A.4. Experiments for Protein C (PC) Activation
The experiments were carried out in properly buffered isotopic waters in the presence of 5–200 mM NaCl and the required amount of choline chloride to keep the salt concentration at 200 mM and in the presence of ~10 nM TM [21]. Aliquots were drawn as a function of time for quenching with r-hirudin 99% of thrombin activity and assaying for emerging APC [118] with a chromogenic substrate of APC under conditions identical to that in water for all samples. The concentrations of APC were measured by initial rates of substrate hydrolysis, spectroscopic monitoring p-NA release at 405 nm and in reference to a previously constructed standard curve.
Appendix A.5. Experiments for the Inactivation of Thrombin by Active-Site Inhibitors
The inhibition of thrombin with Phe-Pro-Arg-chloromethylketone (PPACK) was monitored by discontinuous sampling for remaining activity as a function of time [23]. Pseudo-first-order rate constants were obtained by fitting the exponential function to the remaining thrombin activity versus time of inhibition for 10 successive incubation times. Inactivation of thrombin by known concentrations of 4-nitrophenyl diethyl phosphate (paraoxon) and NPMP required longer incubation times at constant temperature. Aliquots were drawn from the inhibition mixture and sampled for remaining activity by diluting into the chromogenic assay mixture. Pseudo-first–order rate constants for inhibition were calculated for four half lives from which the second order rate constants were derived. The irreversible inhibition of thrombin by the covalent inhibitors ([I]) were modeled using the following Equation (A3) [23]:
Ki ki
E + I![Life 11 00396 i004]() EI
EI ![Life 11 00396 i005]() EI*
EI*
E + I
 EI
EI  EI*
EI*
In this model Ki is an equilibrium constant, koff/kon, where kon is the rate constant for the association of the enzyme and the inhibitor to form the enzyme inhibitor complex, EI, while koff is the rate constant for the dissociation of the enzyme and inhibitor from the EI complex. After the EI complex is formed, ki is the first-order rate constant for bond formation between the enzyme and inhibitor to result in EI*, the covalently modified thrombin. The rate constant observed in the experiments has a hyperbolic dependence on the concentration of I (Equation (A4)) as in the Michaelis–Menten equation [58];
kobs = (ki [I])/(Ki + [I]), if [I] << Ki the equation simplifies to kobs/[I] = ki/Ki
This is the formula used to obtain ki/Ki, the second order rate constant, for the encounter of the enzyme and inhibitor to form the EI* complex, as the concentration of PPACK used was much less than the actual Ki. The pH dependence of the pseudo-first-order rate constant at 2.2 × 10⁻⁹ M PPACK and 25.0 ± 0.1 °C was plotted and evaluated according to a two-pKa model [3], shown in Equation (A5), that provided the highest probability.
kobs = [I]/(1 + 10(pK1–pH) + 10(pH–pKI))
All fitting was at the 95% confidence level using simple robust or explicit error propagation (from the inverse of the errors associated with the dependent variable).
Appendix A.6. Prothrombin Activation Catalyzed by Human FXa
Well-tested methods [22,137,138] were used for the preparation of phospholipid vesicles (LUV) using phosphatidylcholine (Ph). A stock solution was stored frozen and diluted before use to 56 μM LUV, followed by extrusion before use.
For pseudo-first-order kinetic studies, at 5.0 μM prothrombin solution was prepared in pH 7.50 buffer containing 5 × 10⁻³ M CaCl2. For prothrombin activation in the presence of LUV, 355 μL of 56 μM LUV was added to a 5 μL of solution of 25 nM FXa and 100 nM FVa to attain a final concentration of 0.33 nM of FXa. The mixture was incubated at 25.0 ± 0.1 °C for 15 min and 15 μL of 5.0 μM prothrombin, to reach 0.20 μM in the prothrombin complex (360 μL), initiated the reaction. Reactions were also carried out with higher FXa concentrations and at different prothrombin concentrations, but in the absence of FVa and LUV.
For initial rate measurements, 41.7 nM FXa (FXa:FVa = 1:4), in pH 7.50 buffer, 0.15 M NaCl and 5 × 10⁻³ M CaCl2 was prepared with 56 μM LUV, aliquoted at 10 μL volume, and kept at −20 °C. Prior to the reaction, 10 μL FXa solution was mixed with 110 μL of 56 μM LUV and incubated at 25.0 ± 0.1 °C for 15 min. The reaction was initiated by adding 5 μL of 100 μM prothrombin solution to obtain 4.0 μM prothrombin and 3.3 nM FXa in the prothrombinase complex solution. Reactions were also carried out at different FVa concentrations and at different prothrombin concentrations at 50 μM LUV. In all cases, an aliquot of 20 μL was drawn at appropriate time intervals to test the amidolytic activity of thrombin produced. The sample was added to 715 μL of pH 7.50 buffer and 0.15 M NaCl and preincubated in a cell at 25.0 ± 0.1 °C for 10 min. Fifteen microliters of 3.2 × 10⁻³ M H-D-Phe-L-Pip-Arg-pNA (FPiR-pNA) in pH 7.5 buffer containing 900 nM Soybean trypsin inhibitor and 0.15 M NaCl was added to the solution to start the hydrolysis and pNA release was monitored for one min at 405 nm. The thrombin concentration was calculated from the average of slopes of three to five parallel runs and the kcat value for FPiR-Pna [20]. Repeats from several fresh LUV preparations gave values within 10%. Prothrombin conversion to thrombin occurred near 90%.
Appendix A.7. Low-Field 1H NMR Protocol
We prepared solutions of 0.2–0.5 mM human α-thrombin with three-fold excess of PPACK or 10-fold excess of 4-nitrophenyl diethylphosphate (paraoxon) or NPMP in pH 6.7, 0.02 M citrate buffer, 0.01 M phosphate buffer, 0.20 M NaCl, 0.1% PEG-8000 [23] and a > five-fold excess was used with Nα-2-naphthylsulfonyl-glycyl-DL-4-amidinophenylalanyl-piperidide acetate salt; (D-NAPAP) at pH 6.5 in 0.05 M sodium citrate buffer, or in 0.01 M phosphate buffer (pH = 6.5), 0.20 M NaCl, 0.1% PEG8000 [26]. R-hirudin or its analogs and the Nα(Me)Arg-peptides were used in slight excess over thrombin concentrations. Identical concentrations and conditions were used for samples of, r-hirudin and hirunorm V for control [26]. The effect of Na+ ion, buffer composition and temperature were probed with thrombin-r-hirudin and RGD-hirudin complexes in pH 6.5, 0.02–0.04 M citrate or 0.04–0.10 M phosphate buffer which contained NaCl between 0.09 and 0.31 M concentrations. The D2O content was ~7% in general and ~45–55% for the isotope effect studies. A 99% loss of thrombin activity was achieved with PPACK and 90% loss of activity was obtained with paraoxon and NPMP, 97% and 98% activity loss were observed with the Nα(Me)Arg-peptide and D-NAPAP inhibition, respectively, and >99% loss of activity was achieved with r-hirudin, and its mimics. Trypsin samples were made in 1.8 mM concentration with and without ~3-fold excess of D-NAPAP in pH 7.00, 0.10 M phosphate buffer, 0.1% PEG-4000 and 7% D2O. Inhibition was >70%. We probed the 1H NMR samples for protein aggregation by polyacrylamide gel electrophoresis (PAGE). Only one band corresponding to the 36,500 Da of thrombin was obtained.
A 5 mm triple resonance probe was used, water excitation was avoided by using a 1331 pulse sequence and a 90° pulse width of 30 μs for a 512 ms acquisition time including a 2.5 s relaxation delay were applied. We allowed the phosphate and phosphonate ester-inhibited thrombin samples to “age” for 50 h and then reexamined them. To determine the D/H fractionation factors from deshielded resonances at maximal sensitivity the samples were divided into two, one in buffered H2O and the other in identically buffered D2O. The proton sponge 1,8-bis(dimethylamino) naphthalene was dissolved in CD3CN then titrated with H2SO4. It was placed in a capillary to serve as an external chemical shift reference for quantitation of deshielded resonances. One-dimensional 1H NMR spectra were acquired at 30 °C with 3000–16,000 transients for free thrombin, free r-hirudin, free hirunorm V, covalently modified thrombin with PPACK and for complexes of thrombin with D-NAPAP, r-hirudin with or without PPACK, and for complexes of thrombin with hirudin mimics. The chemical shifts are reported relative to low field from external DSS. Temperature studies of the resonances were in the 5–35 °C range. From the integrated signals in 7% and 55% D2O buffers the fractionation factors (ɸ) were calculated as follows: I = [Imax(X)] ɸ/(1 − X) + X], where X = mole fraction of H2O; I = observed intensity and Imax is maximal intensity at X = 1.0.
References
- Schowen, R.L. Catalytic Power and Transition-State Stabilization. In Transition States of Biochemical Proceses; Gandour, R.D., Schowen, R.L., Eds.; Plenum: New York, NY, USA, 1978; pp. 77–114. [Google Scholar]
- Schowen, R.L. Structural and Energetic Aspects of Protolytic Catalysis by Enzymes: Charge-Relay Catalysis in the Function of Serine Proteases. In Mechanistic Principles of Enzyme Activity; Liebman, J.F., Greenberg, A., Eds.; VCH Publishers: New York, NY, USA, 1988; Volume 9, pp. 119–168. [Google Scholar]
- Fersht, A. Structure and Mechanism in Protein Science: A Guide to Enzyme Catalysis and Protein Folding; W.H. Freeman and Company: New York, NY, USA, 1999. [Google Scholar]
- Schowen, K.B.; Schowen, R.L. Solvent isotope effects on enzyme systems. Methods Enzymol. 1982, 87, 551–606. [Google Scholar] [CrossRef] [PubMed]
- Alvarez, F.J.; Schowen, R.L. Mechanistic Deductions from Solvent Isotope Effects. In Isotopes in Organic Chemistry; Buncel, E., Lee, C.C., Eds.; Elsevier: Amsterdam, The Netherlands, 1987; Volume 7, pp. 1–60. [Google Scholar]
- Bachovchin, W.W. Confirmation of the assignment of the low-field proton resonance of serine proteases by using specifically nitrogen-15 labeled enzyme. Proc. Natl. Acad. Sci. USA 1985, 82, 7948–7951. [Google Scholar] [CrossRef] [Green Version]
- Frey, P.; Whitt, S.; Tobin, J. A low-barrier hydrogen bond in the catalytic triad of serine proteases. Science 1994, 264, 1927–1930. [Google Scholar] [CrossRef] [PubMed]
- Cleland, W.; Kreevoy, M. Low-barrier hydrogen bonds and enzymic catalysis. Science 1994, 264, 1887–1890. [Google Scholar] [CrossRef]
- Perrin, C.L.; Nielson, J.B. “Strong” hydrogen bonds in chemistry and biology. Annu. Rev. Phys. Chem. 1997, 48, 511–544. [Google Scholar] [CrossRef]
- Cassidy, C.S.; Lin, J.; Frey, P.A. A New Concept for the Mechanism of Action of Chymotrypsin: The Role of the Low-Barrier Hydrogen Bond. Biochemistry 1997, 36, 4576–4584. [Google Scholar] [CrossRef]
- Ash, E.L.; Sudmeier, J.L.; De Fabo, E.C.; Bachovchin, W.W. A low-barrier hydrogen bond in the catalytic triad of serine proteases? Theory versus experiment. Science 1997, 278, 1128–1132. [Google Scholar] [CrossRef] [PubMed]
- Markley, J.L.; Westler, W.M. Protonation-state dependence of hydrogen bond strengths and exchange rates in a serine protease catalytic triad: Bovine chymotrypsinogen A. Biochemistry 1996, 35, 11092–11097. [Google Scholar] [CrossRef]
- Bachovchin, W.W. Review: Contributions of NMR spectroscopy to the study of hydrogen bonds in serine protease active sites. Magn. Reson. Chem. 2001, 39, S199–S213. [Google Scholar] [CrossRef]
- Mildvan, A.; Massiah, M.; Harris, T.; Marks, G.; Harrison, D.; Viragh, C.; Reddy, P.; Kovach, I. Short, strong hydrogen bonds on enzymes: NMR and mechanistic studies. J. Mol. Struct. 2002, 615, 163–175. [Google Scholar] [CrossRef]
- Kohen, A. Current Issues in Enzymatic Hydrogen Transfer from Carbon: Tunneling and Coupled Motion from Kinetic Isotope Effect Studies. In Hydrogen-Transfer Reactions; Hynes, J.T., Klinman, J.P., Limbach, H.-H., Schowen, R.L., Eds.; WILEY-VCH Verlag GmbH & Co. KgaA: Weinheim, Germany, 2007; Volume 4, pp. 1311–1340. [Google Scholar]
- Garcia-Viloca, M.; Gonzalez-Lafont, A.; Lluch, J.M. On pKa Matching as a Requirement to Form a Low-Barrier Hydrogen Bond. A Theoretical Study in Gas Phase. J. Phys. Chem. 1997, 101, 3880–3886. [Google Scholar] [CrossRef]
- Polgar, L. Mechanisms in Protease Action; CRC Press Inc.: Boca Raton, FL, USA, 1990. [Google Scholar]
- Hedstrom, L. Serine protease mechanism and specificity. Chem. Rev. 2002, 102, 4501–4524. [Google Scholar] [CrossRef]
- Schowen, K.; Limbach, H.-H.; Denisov, G.; Schowen, R. Hydrogen bonds and proton transfer in general-catalytic transition-state stabilization in enzyme catalysis. Biochim. Biophys. Acta (BBA) Bioenergy 2000, 1458, 43–62. [Google Scholar] [CrossRef] [Green Version]
- Enyedy, E.J.; Kovach, I.M. Proton inventory studies of α-thrombin-catalyzed reactions of substrates with selected P and P’ sites. J. Am. Chem. Soc. 2004, 126, 6017–6024. [Google Scholar] [CrossRef]
- Zhang, D.; Kovach, I.M. Full and partial deuterium solvent isotope effect studies of α-thrombin-catalyzed reactions of natural substrates. J. Am. Chem. Soc. 2005, 127, 3760–3766. [Google Scholar] [CrossRef]
- Zhang, D.; Kovach, I.M. Deuterium solvent isotope effect and proton-inventory studies of factor Xa-catalyzed reactions. Biochemistry 2006, 45, 14175–14182. [Google Scholar] [CrossRef] [Green Version]
- Kovach, I.M.; Kelley, P.; Eddy, C.; Jordan, F.; Baykal, A. Proton bridging in the interactions of thrombin with small inhibitors. Biochemistry 2009, 48, 7296–7304. [Google Scholar] [CrossRef]
- Viragh, C.; Harris, T.K.; Reddy, P.M.; Massiah, M.A.; Mildvan, A.S.; Kovach, I.M. NMR evidence for a short, strong hydrogen bond at the active site of a cholinesterase. Biochemistry 2000, 39, 16200–16205. [Google Scholar] [CrossRef] [PubMed]
- Massiah, M.A.; Viragh, C.; Reddy, P.M.; Kovach, I.M.; Johnson, J.; Rosenberry, T.L.; Mildvan, A.S. Short, strong hydrogen bonds at the active site of human acetylcholinesterase: Proton NMR studies. Biochemistry 2001, 40, 5682–5690. [Google Scholar] [CrossRef]
- Kovach, I.M.; Kakalis, L.; Jordan, F.; Zhang, D. Proton bridging in the interactions of thrombin with hirudin and its mimics. Biochemistry 2013, 52, 2472–2481. [Google Scholar] [CrossRef] [PubMed] [Green Version]
- Enyedy, E.J.; Kovach, I.M. Modulation of the activity of human α-thrombin with phosphonate ester inhibitors. Bioorg. Med. Chem. 1997, 5, 1531–1541. [Google Scholar] [CrossRef]
- Zhao, Q.; Kovach, I.M.; Bencsura, A.; Papathanassiu, A. Enantioselective and reversible inhibition of trypsin and α chymotrypsin by phosphonate esters. Biochemistry 1994, 33, 8128–8138. [Google Scholar] [CrossRef]
- Das, J.; Kimball, S.D. Thrombin active site inhibitors. Bioorg. Med. Chem. 1995, 3, 999–1007. [Google Scholar] [CrossRef]
- Schulman, S.; Furie, B. The molecular basis of blood coagulation. Cell 2014, 53, 505–518. [Google Scholar] [CrossRef]
- Davie, E.W.; Fujikawa, K.; Kisiel, W. The coagulation cascade: Initiation, maintenance, and regulation. Biochemistry 1991, 30, 10363–10370. [Google Scholar] [CrossRef]
- Berliner, L.J. Thrombin: Structure and Function; Plenum Press: New York, NY, USA, 1992. [Google Scholar]
- Mann, K.G.; Lorand, L. Introduction: Blood coagulation. Methods Enzymol. 1993, 222, 1–10. [Google Scholar] [CrossRef]
- Patthy, L. Modular design of proteases of coagulation, fibrinolysis, and complement activation: Implications for protein engineering and structure-function studies. Methods Enzymol. 1993, 222, 10–21. [Google Scholar] [CrossRef]
- Hopfner, K.P.; Ayala, Y.; Szewczuk, Z.; Konishi, Y.; Di Cera, E. Chemical compensation in macromolecular bridge-binding to thrombin. Biochemistry 1993, 32, 2947–2953. [Google Scholar] [CrossRef]
- Picozzi, M.; Landolfi, R.; Cristofaro, R. Effects of protons on the thrombin-fibrinogen interaction. Eur. J. Biochem. 1994, 219, 1013–1021. [Google Scholar] [CrossRef] [PubMed]
- Stone, S.R.; Hofsteenge, J. Kinetics of the inhibition of thrombin by hirudin. Biochemistry 1986, 25, 4622–4628. [Google Scholar] [CrossRef] [PubMed]
- Stone, S.R.; Braun, P.J.; Hofsteenge, J. Identification of regions of alpha-thrombin involved in its interaction with hirudin. Biochemistry 1987, 26, 4617–4624. [Google Scholar] [CrossRef]
- Braun, P.J.; Dennis, S.; Hofsteenge, J.; Stone, S.R. Use of site-directed mutagenesis to investigate the basis for the specificity of hirudin. Biochemistry 1988, 27, 6517–6522. [Google Scholar] [CrossRef]
- Stone, S.R.; Dennis, S.; Hofsteenge, J. Quantitative evaluation of the contribution of ionic interactions to the formation of the thrombin-hirudin complex. Biochemistry 1989, 28, 6857–6863. [Google Scholar] [CrossRef]
- Dennis, S.; Wallace, A.; Hofsteenge, J.; Stone, S.R. Use of fragments of hirudin to investigate thrombin-hirudin interaction. Eur. J. Biochem. 1990, 188, 61–66. [Google Scholar] [CrossRef] [PubMed]
- Betz, A.; Hofsteenge, J.; Stone, S.R. Ionic interactions in the formation of the thrombin-hirudin complex. Biochem. J. 1991, 275, 801–803. [Google Scholar] [CrossRef] [Green Version]
- Stone, S.R.; Hofsteenge, J. Basis for the reduced affinity of bT- and gT-thrombin for hirudin. Biochemistry 1991, 30, 3950–3955. [Google Scholar] [CrossRef]
- Karshikov, A.; Bode, W.; Tulinsky, A.; Stone, S.R. Electrostatic interactions in the association of proteins: An analysis of the thrombin-hirudin complex. Protein Sci. 1992, 1, 727–735. [Google Scholar] [CrossRef] [Green Version]
- Myles, T.; Le Bonniec, B.F.; Betz, A.; Stone, S.R. Electronic steering and ionic tethering in the formation of thrombin-hirudin complexes: The role of the thrombin anion-binding Exosite-I. Biochemistry 2001, 40, 4972–4979. [Google Scholar] [CrossRef]
- Stone, S.R.; Betz, A.; Parry, M.A.; Jackman, M.P.; Hofsteenge, J. Molecular basis for the inhibition of thrombin by hirudin. Adv. Exp. Med. Biol. 1993, 340, 35–49. [Google Scholar] [PubMed]
- Huntington, J.A. Natural inhibitors of thrombin. Thromb. Haemost. 2014, 111, 583–589. [Google Scholar] [CrossRef] [Green Version]
- Lombardi, A.; Nastri, F.; Morte, R.D.; Rossi, A.; De Rosa, A.; Staiano, N.; Pedone, C.; Pavone, V. Rational design of true hirudin mimetics: Synthesis and characterization of multisite-directed α-thrombin inhibitors1. J. Med. Chem. 1996, 39, 2008–2017. [Google Scholar] [CrossRef]
- Lombardi, A.; De Simone, G.; Galdiero, S.; Staiano, N.; Nastri, F.; Pavone, V. From natural to synthetic multisite thrombin inhibitors. Biopolymers 1999, 51, 19–39. [Google Scholar] [CrossRef]
- Vijayalakshmi, J.; Padmanabhan, K.P.; Tulinsky, A.; Mann, K.G. The isomorphous structures of prethrombin2, hirugen-, and PPACK-thrombin: Changes accompanying activation and exosite binding to thrombin. Protein Sci. 1994, 3, 2254–2271. [Google Scholar] [CrossRef] [PubMed] [Green Version]
- Liu, X.; Yan, X.; Mo, W.; Song, H.; Dai, L. Spectral assignments and reference data: H NMR assignment and secondary structure of recombinant RGD-hirudin. Magn. Reson. Chem. 2005, 43, 956–961. [Google Scholar] [CrossRef]
- Friedrich, R.; Steinmetzer, T.; Huber, R.; Sturzebecher, J.; Bode, W. The methyl group of Nα(Me)Arg-containing peptides disturbs the active-site geometry of thrombin impairing efficient cleavage. J. Mol. Biol. 2002, 316, 869–874. [Google Scholar] [CrossRef] [PubMed]
- De Simone, G.; Lombardi, A.; Galdiero, S.; Nastri, F.; Morte, R.D.; Staiano, N.; Pedone, C.; Bolognesi, M.; Pavone, V. Hirunorms are true hirudin mimetics. The crystal strcture of human a-thrombin-hirunorm V complex. Protein Sci. 1998, 7, 243–253. [Google Scholar] [CrossRef] [PubMed]
- Lombardi, A.; De Simone, G.; Nastri, F.; Galdiero, S.; Pedone, C.; Pavone, V.; Della Morte, R.; Staiano, N.; Bolognesi, M. The crystal structure of α-thrombin-hirunorm IV complex reveals a novel specificity site recognition mode. Protein Sci. 2008, 8, 91–95. [Google Scholar] [CrossRef]
- Liu, C.C.; Brustad, E.; Liu, W.; Schultz, P.G. Crystal structure of a biosynthetic Sulfo-hirudin complexed to thrombin. J. Am. Chem. Soc. 2007, 129, 10648–10649. [Google Scholar] [CrossRef] [Green Version]
- Hirohara, H.; Bender, M.L.; Stark, R.S. Acylation of -chymotrypsin by oxygen and sulfur esters of specific substrates: Kinetic evidence for a tetrahedral intermediate. Proc. Natl. Acad. Sci. USA 1974, 71, 1643–1647. [Google Scholar] [CrossRef] [PubMed] [Green Version]
- Miller, C.G.; Bender, M.L. Direct observation of an acyl-enzyme intermediate in the alpha-chymotrypsin-catalyzed hydrolysis of a specific substrate at neutral pH. J. Am. Chem. Soc. 1968, 90, 6850–6852. [Google Scholar] [CrossRef]
- Michaelis, L.; Menten, M.L. Die kinetik der invertinwirkung. Biochem. Z. 1913, 49, 333–369. [Google Scholar]
- Quinn, D.M.; Sutton, L.D. Theoretical Basis and Mechanistic Utility of Solvent Isotope Effects. In Enzyme Mechanism from Isotope Effects; Cook, P.F., Ed.; CRC Press: Boston, MA, USA, 1991; pp. 73–126. [Google Scholar]
- Elrod, J.P.; Hogg, J.L.; Quinn, D.M.; Venkatasubban, K.S.; Schowen, R.L. Protonic reorganization and substrate structure in catalysis by serine proteases. J. Am. Chem. Soc. 1980, 102, 3917–3922. [Google Scholar] [CrossRef]
- Stein, R.L.; Elrod, J.P.; Schowen, R.L. Correlative variations in enzyme-derived and substrate-derived structures of catalytic transition states. Implications for the catalytic strategy of acyl-transfer enzymes. J. Am. Chem. Soc. 1983, 105, 2446–2452. [Google Scholar] [CrossRef]
- Stein, R.L. Catalysis by human leukocyte elastase: Substrate structural dependence of rate-limiting protolytic catalysis and operation of the charge relay system. J. Am. Chem. Soc. 1983, 105, 5111–5116. [Google Scholar] [CrossRef]
- Stein, R.L.; Strimpler, A.M.; Hori, H.; Powers, J.C. Catalysis by human leukocyte elastase: Mechanistic insights into specificity requirements. Biochemistry 1987, 26, 1301–1305. [Google Scholar] [CrossRef]
- Stein, R.L.; Trainor, D.A. Mechanism of inactivation of human leukocyte elastase by a chlorromethyl ketone: Kinetic and solvent isotope effect studies. Biochemistry 1986, 25, 5414–5419. [Google Scholar] [CrossRef]
- Venkatasubban, K.S.; Schowen, R.L. The proton inventory technique. CRC Crit. Rev. Biochem. 1985, 17, 1–44. [Google Scholar]
- Scholten, J.D.; Hogg, J.L.; Raushel, F.M. Methyl chymotrypsin catalyzed hydrolysis of specific substrate esters indicate multiple proton catalysis is possible with a modified charge relay triad. J. Am. Chem. Soc. 1988, 110, 8246–8247. [Google Scholar] [CrossRef]
- Chang, T.K.; Chiang, Y.; Guo, H.-X.; Kresge, A.J.; Mathew, L.; Powell, M.F.; Wells, J.A. Solvent isotope effects in H2O-D2O mixtures (proton inventories) on serine-protease-catalyzed hydrolysis reactions. Influence of oxyanion hole interactions and medium effects. J. Am. Chem. Soc. 1996, 118, 8802–8807. [Google Scholar] [CrossRef]
- Tobin, J.B.; Whitt, S.A.; Cassidy, C.S.; Frey, P.A. Low-barrier hydrogen bonding in molecular complexes analogous to histidine and aspartate in the catalytic triad of serine proteases. Biochemistry 1995, 34, 6919–6924. [Google Scholar] [CrossRef] [PubMed]
- Lin, J.; Cassidy, C.S.; Frey, P.A. Correlations of the basicity of His 57 with transition state analogue binding, substrate reactivity, and the strength of the low-barrier hydrogen bond in chymotrypsin. Biochemistry 1998, 37, 11940–11948. [Google Scholar] [CrossRef]
- Lin, J.; Westler, W.M.; Cleland, W.W.; Markley, J.L.; Frey, P.A. Fractionation factors and activation energies for exchange of the low barrier hydrogen bonding proton in peptidyl trifluoromethyl ketone complexes of chymotrypsin. Proc. Natl. Acad. Sci. USA 1998, 95, 14664–14668. [Google Scholar] [CrossRef] [PubMed] [Green Version]
- Lin, J.; Frey, P.A. Strong hydrogen bonds in aqueous and aqueous—Acetone solutions of dicarboxylic acids: Activation energies for exchange and deuterium fractionation factors. J. Am. Chem. Soc. 2000, 122, 11258–11259. [Google Scholar] [CrossRef]
- Halkides, C.J.; Wu, Y.Q.; Murray, C.J. A low-barrier hydrogen bond in subtilisin: 1H and15N NMR studies with peptidyl trifluoromethyl ketones. Biochemistry 1996, 35, 15941–15948. [Google Scholar] [CrossRef] [PubMed]
- Kahyaoglu, A.; Haghjoo, K.; Guo, F.; Jordan, F.; Kettner, C.; Felföldi, F.; Polgár, L. Low barrier hydrogen bond is absent in the catalytic triads in the ground state but is present in a transition-state complex in the prolyl oligopeptidase family of serine proteases. J. Biol. Chem. 1997, 272, 25547–25554. [Google Scholar] [CrossRef] [Green Version]
- Bao, D.; Huskey, P.W.; Kettner, C.A.; Jordan, F. Hydrogen bonding to active-site histidine in peptidyl Botonic acid inhibitor complexes of chymotrypsin and subtilisin: Proton magnetic resonance assignments and H/D fractionation. J. Am. Chem. Soc. 1999, 121, 4684–4689. [Google Scholar] [CrossRef]
- Schellenberger, V.; Turck, C.W.; Hedstrom, L.; Rutter, W.J. Mapping the S’ subsites of serine proteases using acyl transfer to mixtures of peptide nucleophiles. Biochemistry 1993, 32, 4349–4353. [Google Scholar] [CrossRef]
- Schellenberger, V.; Turck, C.W.; Rutter, W.J. Role of the S’ subsites in serine protease catalysis. Active-site mapping of rat Chymotrypsin, rat trypsin, alpha-lytic protease, and cercarial protease from Schistosoma mansoni. Biochemistry 1994, 33, 4251–4257. [Google Scholar] [CrossRef]
- Le Bonniec, B.F.; Myles, T.; Johnson, T.; Knight, C.G.; Tapparelli, C.; Stone, S.R. Characterization of the P2’ and P3’ specificities of thrombin using fluorescence-quenched substrates and mapping of the subsites by mutagenesis. Biochemistry 1996, 35, 7114–7122. [Google Scholar] [CrossRef]
- Dai, Y.; Hedstrom, L.; Abeles, R.H. Inactivation of cysteine proteases by (acyloxy)methyl ketones using S’-P’ interactions. Biochemistry 2000, 39, 6498–6502. [Google Scholar] [CrossRef] [PubMed]
- Mildvan, A.S.; Harris, T.K.; Abeygunawardana, C. Nuclear magnetic resonance methods for the detection and study of low-barrier hydrogen bonds on enzymes. Methods Enzymol. 1999, 308, 219–245. [Google Scholar]
- Harris, T.K.; Mildvan, A.S. High-precision measurement of hydrogen bond lengths in proteins by nuclear magnetic resonance methods. Protein Struct. Funct. Genet. 1999, 35, 275–282. [Google Scholar] [CrossRef]
- Harris, T.; Zhao, Q.; Mildvan, A. NMR studies of strong hydrogen bonds in enzymes and in a model compound. J. Mol. Struct. 2000, 552, 97–109. [Google Scholar] [CrossRef]
- Schenier, S.; Karr, T. The nonexistence of specially stabilized hydrogen bonds in enzymes. J. Am. Chem. Soc. 1995, 117, 6970–6975. [Google Scholar] [CrossRef]
- Perrin, C.L. Are short, low-barrier hydrogen bonds unusually strong? Acc. Chem. Res. 2010, 43, 1550–1557. [Google Scholar] [CrossRef]
- Warshel, A.; Papzyan, A.; Kollman, P.A. On low-barrier hydrogen bonds and enzyme catalysts. Science 1995, 269, 104. [Google Scholar] [CrossRef] [Green Version]
- Hibbert, F.; Emsley, J. Hydrogen bonding and chemical reactivity. Adv. Phys. Org. Chem. 1990, 26, 255–379. [Google Scholar] [CrossRef]
- De Filippis, V.; Colombo, G.; Russo, I.; Spadari, B.; Fontana, A. Probing the hirudin-thrombin interaction by incorporation of nonbonded amino acids and molecular dynamics simulation. Biochemistry 2002, 41, 13556–13569. [Google Scholar] [CrossRef]
- Pineda, A.O.; Carrell, C.J.; Bush, L.A.; Prasad, S.; Caccia, S.; Chen, Z.-W.; Mathews, F.S.; Di Cera, E. Molecular dissection of Na+ binding to thrombin. J. Biol. Chem. 2004, 279, 31842–31853. [Google Scholar] [CrossRef] [Green Version]
- Di Cera, E. Thrombin. Mol. Asp. Med. 2008, 29, 203–254. [Google Scholar] [CrossRef] [PubMed]
- Huntington, J.A. How Na+ activates thrombin—A review of the functional and structural data. Biol. Chem. 2008, 389, 1025–1035. [Google Scholar] [CrossRef]
- Fuglestad, B.; Gasper, G.M.; Tonelli, M.; McCammon, J.A.; Phineus, R.; Markwick, L.; Komives, E.A. The dynamic structure of thrombin in solution. Biophys. J. 2012, 103, 79–88. [Google Scholar] [CrossRef] [PubMed] [Green Version]
- Xiao, J.; Salisbury, R.F., Jr. Molecular dynamics simulations of aptamer-binding reveal generalized allostery in thrombin. Parasitol. Res. Thromb. Haemost. 2014, 111, 583–589. [Google Scholar] [CrossRef] [PubMed]
- Phineus, R.L.; Markwick, L.; Riley, B.; Peacock, L.; Komives, E.A. Accurate prediction of amide exchange in the fast limit reveals thrombin allostery. Biophys. J. 2019, 116, 49–56. [Google Scholar]
- Brooks, B.R.; Bruccoleri, R.E.; Olafson, B.D.; States, D.J.; Swaminathan, S.; Karplus, M. CHARMM: A program for macromolecular energy, minimization, and dynamics calculations. J. Comput. Chem. 1983, 4, 187–217. [Google Scholar] [CrossRef]
- Enyedy, I.; Bencsura, A.; Kovach, I.M. Interactions in tetravalent and pentavalent phosphonate esters at the active site of serine enzymes. Phosphorus Sulfur Silicon 1996, 109–110, 249–252. [Google Scholar]
- Bencsura, A.; Enyedy, I.; Kovach, I.M. Probing the active site of acetylcholinesterase by molecular dynamics of its phosphonate ester adducts. J. Am. Chem. Soc. 1996, 118, 8531–8541. [Google Scholar] [CrossRef]
- Bencsura, A.; Enyedy, I.; Kovach, I.M. Origins and diversity of the aging reaction in phosphonate adducts of serine hydrolase enzymes: What characteristics of the active site do they probe? Biochemistry 1995, 34, 8989–8999. [Google Scholar] [CrossRef] [PubMed]
- DiBella, E.E.; Scheraga, H.A. The role of the insertion loop around tryptophan 148 in the activity of thrombin. Biochemistry 1996, 35, 4427–4433. [Google Scholar] [CrossRef]
- Le Bonniec, B.F.; Esmon, C.T. Glu-192—Gln substitution in thrombin mimics the catalytic switch induced by thrombomodulin. Proc. Natl. Acad. Sci. USA 1991, 88, 7371–7375. [Google Scholar] [CrossRef] [Green Version]
- Le Bonniec, B.F.; Guinto, E.R.; Stone, S.R. Identification of thrombin residues that modulate its interactions with antithrombin III and 1 antitrypsin. Biochemistry 1995, 34, 12241–12248. [Google Scholar] [CrossRef]
- Bode, W.; Turk, D.; Karshikov, A. The refined 1.9-Å X-ray crystal structure of d-Phe-Pro-Arg chloromethylketone-inhibited human α -thrombin: Structure analysis, overall structure, electrostatic properties, detailed active-site geometry, and structure-function relationships. Protein Sci. 1992, 1, 426–471. [Google Scholar] [CrossRef]
- Bode, W.; Mayr, I.; Baumann, U.; Huber, R.; Stone, S.R.; Hofsteenge, J. The refined 1.9 Å crystal structure of human α thrombin: Interaction with D Phe Pro Arg Chloromethylketone and significance of the Tyr Pro Pro Trp insertion segment. EMBO J. 1989, 8, 3467–3475. [Google Scholar] [CrossRef] [PubMed]
- Bode, W. Structure and interaction modes of thrombin. Blood Cells Mol. Dis. 2006, 36, 122–130. [Google Scholar] [CrossRef] [PubMed]
- Jankun, E.S.; Carperos, V.; Ravichandran, K.G.; Tulinsky, A.; Westbrook, M.; Maraganore, J.M. Structure of the Hirugen and Hirulog 1 complexes of α Thrombin. J. Mol. Biol. 1991, 221, 1379–1393. [Google Scholar] [CrossRef]
- Boskovic, D.S.; Bajzar, L.S.; Nesheim, M.E. Channeling during prothrombin activation. J. Biol. Chem. 2001, 276, 28686–28693. [Google Scholar] [CrossRef] [Green Version]
- Padmanabhan, K.; Padmanabhan, K.P.; Tulinsky, A.; Park, C.H.; Bode, W.; Huber, R.; Blankenship, D.T.; Cardin, A.D.; Kisiel, W. Structure of human Des(1 45) factor Xa at 2.2 Å resolution. J. Mol. Biol. 1993, 232, 947–966. [Google Scholar] [CrossRef] [PubMed]
- Guinto, E.; Ye, J.; Le Bonniec, B.; Esmon, C. Glu192–>Gln substitution in thrombin yields an enzyme that is effectively inhibited by bovine pancreatic trypsin inhibitor and tissue factor pathway inhibitor. J. Biol. Chem. 1994, 269, 18395–18400. [Google Scholar] [CrossRef]
- Rezaie, A.R.; Esmon, C.T. Contribution of residue 192 in factor Xa to enzyme specificity and function. J. Biol. Chem. 1995, 270, 16176–16181. [Google Scholar] [CrossRef] [PubMed] [Green Version]
- Rezaie, A.; Neuenschwander, P.; Morrissey, J.; Esmon, C. Analysis of the functions of the first epidermal growth factor-like domain of factor X. J. Biol. Chem. 1993, 268, 8176–8180. [Google Scholar] [CrossRef]
- Di Cera, E.; Dang, Q.D.; Ayala, Y.; Vindigni, A. Linkage at steady state: Allosteric transitions of thrombin. Methods Enzymol. 1995, 259, 127–144. [Google Scholar] [CrossRef] [PubMed]
- Di Cera, E.; Hopfner, K.; Dang, Q. Theory of allosteric effects in serine proteases. Biophys. J. 1996, 70, 174–181. [Google Scholar] [CrossRef] [Green Version]
- Dang, O.D.; Vindigni, A.; Di Cera, E. An allosteric switch controls the procoagulant and anticoagulant activities of thrombin. Proc. Natl. Acad. Sci. USA 1995, 92, 5977–5981. [Google Scholar] [CrossRef] [Green Version]
- Ayala, Y.; Di Cera, E. Molecular recognition by thrombin. Role of the slows—Fast transition, site-specific ion binding energetics and thermodynamic mapping of structural components. J. Mol. Biol. 1994, 235, 733–746. [Google Scholar] [CrossRef]
- Wells, C.M.; Di Cera, E. Thrombin is a Na+ activated enzyme. Biochemistry 1992, 31, 11721–11730. [Google Scholar] [CrossRef] [PubMed]
- Vindigni, A.; Di Cera, E. Release of fibrinopeptides by the slow and fast forms of thrombin. Biochemistry 1996, 35, 4417–4426. [Google Scholar] [CrossRef]
- Di Cera, E.; De Cristofaro, R.; Albright, D.J.; Fenton, J.W. Linkage between proton binding and amidase activity in human alpha-thrombin: Effect of ions and temperature. Biochemistry 1991, 30, 7913–7924. [Google Scholar] [CrossRef]
- Mathur, A.; Schlapkohl, W.A.; Di Cera, E. Thrombin-fibrinogen interaction: pH dependence and effects of the slow fwdarw fast transition. Biochemistry 1993, 32, 7568–7573. [Google Scholar] [CrossRef] [PubMed]
- Lottenberg, R.; Christensen, U.; Jackson, C.M.; Coleman, P.L. Assay of coagulation proteases using peptide chromogenic and fluorogenic substrates. Methods Enzymol. 1981, 28, 341–361. [Google Scholar] [CrossRef]
- Lottenberg, S.R.; Hall, J.A.; Blinder, M.; Binder, E.P.; Jackson, C.M. The action of thrombin on peptide p nitroanilide substrates. Substrate selectivity and examination of hydrolysis under different reaction conditions. Biochim. Biophys. Acta 1983, 742, 539–557. [Google Scholar]
- Kerr, M.A.; Grahn, D.T.; Walsh, K.A.; Neurath, H. Activation of bovine factor X (Stuart factor)—Analogy with pancreatic zymogen-enzyme systems. Biochemistry 1978, 17, 2645–2648. [Google Scholar] [CrossRef]
- Stone, S.R.; Betz, A.; Hofsteenge, J. Mechanistic studies on thrombin catalysis. Biochemistry 1991, 30, 9841–9848. [Google Scholar] [CrossRef] [PubMed]
- Bah, A.; Garvey, L.C.; Ge, J.; Di Cera, E. Rapid kinetics of Na+ binding to thrombin. J. Biol. Chem. 2006, 281, 40049–40056. [Google Scholar] [CrossRef] [Green Version]
- Gianni, S.; Ivarsson, Y.; Bah, A.; Bush-Pelc, L.A.; Di Cera, E. Mechanism of Na+ binding to thrombin resolved by ultra-rapid kinetics. Biophys. Chem. 2007, 131, 111–114. [Google Scholar] [CrossRef] [PubMed] [Green Version]
- Prasad, S.; Wright, K.J.; Roy, D.B.; Bush, L.A.; Cantwell, A.M.; Di Cera, E. Redesigning the monovalent cation specificity of an enzyme. Proc. Natl. Acad. Sci. USA 2003, 100, 13785–13790. [Google Scholar] [CrossRef] [PubMed] [Green Version]
- Huntington, J.A.; Esmon, C.T. The molecular basis of thrombin allostery revealed by a 1.8 A structure of the “slow” form. Structure 2003, 11, 469–479. [Google Scholar] [CrossRef]
- Huntington, J.A. Thrombin plasticity. Biochim. Biophys. Acta 2012, 1824, 246–252. [Google Scholar] [CrossRef]
- Müller, C.; Haase, M.; Lemke, S.; Hildebrandt, J.-P. Hirudins and hirudin-like factors in Hirudinidae: Implications for function and phylogenetic relationships. Parasitol. Res. 2016, 116, 313–325. [Google Scholar] [CrossRef]
- Sohn, J.H.; Kang, H.A.; Rao, K.J.; Kim, C.H.; Choi, E.S.; Chung, B.H.; Rhee, S.K. Current status of the anticoagulant hirudin: Its biotechnological production and clinical practice. Appl. Microbiol. Biotechnol. 2001, 57, 606–613. [Google Scholar] [CrossRef]
- Rydel, T.; Ravichandran, K.; Tulinsky, A.; Bode, W.; Huber, R.; Roitsch, C.; Fenton, J. The structure of a complex of recombinant hirudin and human alpha-thrombin. Science 1990, 249, 277–280. [Google Scholar] [CrossRef]
- Rydel, T.J.; Tulinsky, A.; Bode, W.; Huber, R. Refined structure of the Hirudin-thrombin complex. J. Mol. Biol. 1991, 221, 583–601. [Google Scholar] [CrossRef]
- Priestle, J.P.; Rahuel, J.; Rink, H.; Tones, M.; Grütter, M.G. Changes in interactions in complexes of hirudin derivatives and human α-thrombin due to different crystal forms. Protein Sci. 1993, 2, 1630–1642. [Google Scholar] [CrossRef] [PubMed]
- Grütter, M.G.; Priestle, J.P.; Rahuel, J.; Grossenbacher, H.; Bode, W.; Hofsteenge, J.; Stone, S.R. Crystal structure of the thrombin-hirudin complex: A novel mode of serine protease inhibition. EMBO J. 1990, 9, 2361–2365. [Google Scholar] [CrossRef]
- Jackman, M.; Parry, M.; Hofsteenge, J.; Stone, S. Intrinsic fluorescence changes and rapid kinetics of the reaction of thrombin with hirudin. J. Biol. Chem. 1992, 267, 15375–15383. [Google Scholar] [CrossRef]
- Egner, U.; Hoyer, G.-A.; Schleuning, W.-D. Rational design of hirulog-type inhibitors of thrombin. J. Comput. Mol. Des. 1994, 8, 479–490. [Google Scholar] [CrossRef] [PubMed]
- Kovach, I.M.; McKay, L. Reversible modulation of serine protease activity by phosphonate esters. Bioorg. Med. Chem. Lett. 1992, 2, 1735. [Google Scholar] [CrossRef]
- Zhang, D.; Kovach, I.M.; Sheehy, J.P. Locating the rate-determining step for three-step hydrolase-catalyzed reactions with DYNAFIT. Biochim. Biophys. Acta Proteins Proteomics 2008, 1784, 827–833. [Google Scholar] [CrossRef] [PubMed] [Green Version]
- Akhmetshin, R.R. Mechanistic Investigations of Catalysis by Some Hemostatic and Thrombolytic Enzymes. Ph.D. Thesis, The Catholic University of America, Washington, DC, USA, 1998. [Google Scholar]
- Wu, J.R.; Zhou, C.; Majumder, R.; Powers, D.D.; Weinreb, G.; Lentz, B.R. Role of procoagulant lipids in human prothrombin activation. 1. Prothrombin activation by factor X(a) in the absence of factor V(a) and in the absence and presence of membranes. Biochemistry 2002, 41, 935–949. [Google Scholar] [CrossRef] [PubMed]
- Banerjee, M.; Majumder, R.; Weinreb, G.; Wang, J.; Lentz, B.R. Role of procoagulant lipids in human prothrombin activation. 2. Soluble phosphatidylserine upregulates and directs factor X(a) to appropriate peptide bonds in prothrombin. Biochemistry 2002, 41, 950–957. [Google Scholar] [CrossRef] [PubMed]
- Philipp, M.; Bender, M.L. Alpha-chymotrypsin: Is binding the rate-determining step in acylation? Nat. New Biol. 1973, 214, 44–50. [Google Scholar] [CrossRef] [PubMed]
- Bender, M.L.; Wedler, F.C. Phosphate and carbonate ester “aging” reactions with alpha-chymotrypsin. Kinetics and mecha-nism. J. Am. Chem. Soc. 1972, 94, 2101–2109. [Google Scholar] [CrossRef] [PubMed]
- Kovach, I.M. Structure and dynamics of serine hydrolase-organophosphate adducts. J. Enzym. Inhib. 1988, 2, 199–208. [Google Scholar] [CrossRef]
- Kovach, I.M.; McKay, L.; Vander Velde, D. Diastereomeric phosphonate ester adducts of chymotrypsin: 31P-NMR measureents. Chirality 1993, 5, 143–149. [Google Scholar] [CrossRef] [PubMed]
- Bencsura, A.; Enyedy, I.; Viragh, C.; Akhmetshin, R.; Kovach, I.M. Phosphonate Ester Active Site Probes of Acetylcholin-Esterase, Trypsin, and Chymotrypsin. In Enzymes of the Cholinesterase Family; Quinn, D.M., Balasubramanian, A.S., Doctor, B.P., Taylor, P., Eds.; Plenum Press: New York, NY, USA, 1995; pp. 155–162. [Google Scholar]
- Kovach, I.M.; Enyedy, E.J. Active-site-dependent elimination of 4-nitrophenol from 4-nitrophenyl alkylphosphonyl serine protease adducts. J. Am. Chem. Soc. 1998, 120, 258–263. [Google Scholar] [CrossRef]
- Kovach, I.M. Ligand and active-site dependent P-O versus C-O bond cleavage in organophosphorus adducts of serine hydrolases. Phosphorus Sulfur Silicon 1996, 144–146, 537–540. [Google Scholar] [CrossRef]
- Kovach, I.M. Stereochemistry and secondary reactions in the irreversible inhibition of serine hydrolases by organophos-phorus compounds. J. Phys. Org. Chem. 2004, 17, 602–614. [Google Scholar] [CrossRef]
- Bencsura, A.; Kovach, I.M. QM/MM study of short hydrogen bonds in covalently modified α-thrombin. Unpublished work.
- Bachovchin, W.W. 15N NMR spectroscopy of hydrogen-bonding interactions in the active site of serine proteases: Evidence for a moving histidine mechanism. Biochemistry 1986, 25, 7751–7759. [Google Scholar] [CrossRef] [PubMed]
- Vishveshwara, S.; Madhusudhan, M.S.; Maziel, J.V., Jr. Short-strong hydrogen bonds and a low barrier transition state for the proton transfer reaction in RNase A catalysis: A quantum chemical study. Biophys. Chem. 2001, 89, 105–117. [Google Scholar] [CrossRef]
- Kovach, I.M.; Shehey, J.P.; Dole-Nolan, K. Kinetic isotope effects in the inhibition of thrombin with hirudin and its mimics. Unpublished work.
- Song, X.; Mo, W.; Liu, X.; Zhu, L.; Yan, X.; Song, H.; Dai, L. The NMR solution structure of recombinant RGD-hirudin. Biochem. Biophys. Res. Commun. 2007, 360, 103–108. [Google Scholar] [CrossRef] [PubMed]
- Haruyama, H.; Wüthrich, K. Confirmation of recombinant desulfatohirudin in aqueous solution determined by nuclear magnetic resonance. Biochemistry 1989, 28, 4301–4312. [Google Scholar] [CrossRef]
- Folkers, P.J.M.; Clore, G.M.; Driscoll, P.C.; Dodt, J.; Köhler, S.; Gronenborn, A.M. Solution structure of recombinant hirudin and Lys-47-Glu mutant: A nuclear magnetic resonance and hybrid distance geometry-dynamical simulated annealing study. Biochemistry 1989, 28, 2601–2617. [Google Scholar] [CrossRef] [PubMed]
- Rehse, P.H.; Steinmetzer, T.; Li, Y.; Konishi, Y.; Cygler, M. Crystal structure of a peptidyl pyridinium methyl ketone inhibitor with thrombin. Biochemistry 1995, 34, 11537–11544. [Google Scholar] [CrossRef] [PubMed]
- Brandstetter, H.; Turk, D.; Hoeffken, H.W.; Grosse, D.; Stürzebecher, J.; Martin, P.D.; Edwards, B.F.P.; Bode, W. Refined 2.3 Å X-ray crystal structure of bovine thrombin complexes formed with the benzamidine and arginine-based thrombin inhibitors NAPAP, 4-TAPAP and MQPA. J. Mol. Biol. 1992, 226, 1085–1099. [Google Scholar] [CrossRef]
- Bode, W.; Turk, D.; Stürzebecher, J. Geometry of binding of the benzamide- and arginine-based inhibitors Nα-(2-naphthyl-sulphonyl-glycyl)-DL-p-amidinophenylalanyl-piperidine (NAPAP) and (2R,4R)-4-methyl-1-[Nα-(3-methyl-1,2,3,4-tetrahydro-8-quinolinesulphonyl)-L-arginyl]-2-piperidine carboxylic acid (MQPA) to human α-thrombin. X-ray crystallographic determination of the NAPAP-trypsin complex and modeling of NAPAP-thrombin and MQPA-thrombin. Eur. J. Biochem. 1996, 193, 175–182. [Google Scholar]
- Neidhart, D.; Wei, Y.; Cassidy, C.; Lin, J.; Cleland, W.W.; Frey, P.A. Correlation of low-barrier hydrogen bonding and oxyanion binding in transition state analogue complexes of chymotrypsin. Biochemistry 2001, 40, 2439–2447. [Google Scholar] [CrossRef]
- Chen, Z.; Li, Y.; Mulichak, A.; Lewis, S.; Shafer, J. Crystal structure of human α-thrombin complexed with hirugen and p-Amidinophenylpyruvate at 1.6 Å resolution. Arch. Biochem. Biophys. 1995, 322, 198–203. [Google Scholar] [CrossRef]
- Shan, S.O.; Loh, S.; Herschlag, D. The energetics of hydrogen bonds in model systems: Implications for enzymatic catalysis. Science 1996, 272, 97–101. [Google Scholar] [CrossRef] [Green Version]
- Shan, S.O.; Hercshlag, D. The change in hydrogen bond strength accompanying charge rearrangement: Implications for enzymatic catalysis. Proc. Natl. Acad. Sci. USA 1996, 93, 14474–14479. [Google Scholar] [CrossRef] [Green Version]
- Fuhrmann, C.N.; Daugherty, M.D.; Agard, D.A. Subangstrom crystallography reveals that short ionic hydrogen bonds, and not a His-Asp low-barrier hydrogen bond, stabilize the transition state in serine protease catalysis. J. Am. Chem. Soc. 2006, 128, 9086–9102. [Google Scholar] [CrossRef]
- Langkilde, A.; Kristensen, S.; Leggio, L.L.; Mølgaard, A.; Jensen, J.H.; Houk, A.R.; Poulsen, J.C.N.; Kauppinen, S.K.; Larsen, S. Short strong hydrogen bonds in proteins: A case study of rhamnogalacturonan acetylesterase. Acta Crystallogr. D-Biol. Crystallogr. 2008, 64, 851–863. [Google Scholar] [CrossRef] [Green Version]
- Rajagopal, S.; Vishveshwara, S. Short hydrogen bonds in proteins. FEBS J. 2005, 272, 1819–1832. [Google Scholar] [CrossRef] [PubMed]
- Zhou, S.; Wang, L. Unraveling the structural and chemical features of biological short hydrogen bonds. Chem. Sci. 2019, 10, 7734–7745. [Google Scholar] [CrossRef] [PubMed]
Scheme 1.
Double displacement mechanism of serine protease catalysis of peptide hydrolysis.

Scheme 2.
Sequence of catalytic events as binding, bond making and bond breaking.

Figure 1.
Proton inventory for the thrombin-catalyzed hydrolysis of, (a) left side, VPR7-AMC (N-t-Boc-Val-Pro-Arg-7-AMC) and, (b) right side, FPR-SFR in 0.02 M Tris buffer, pH 8.4 containing 0.3 M NaCl, 1% DMSO, 0.1% PEG-4000 at 26.0 ± 0.1 °C. Circles represent kcat/Km and triangles kcat. Curves were calculated from the best-fit models in Table 1, as introduced in Chart 1.

Figure 2.
Proton inventories for the 1.45 × 10⁻⁸ M bovine FXa-catalyzed hydrolysis reactions, at pH 8.4 and equivalent pL (L = H, D and their mixtures), 0.02 M Tris buffer, 0.30 M NaCl, 5 × 10⁻³ M CaCl2, 0.1% PEG4000, at 25.0 ± 0.1 °C: (a) Left side: 1 × 10⁻³ M RGR-pNA, kcat open circles, the equation of the line is kn/kH = 1.0 (1 − n + n/1.75)2 0.78n; kcat/Km closed circles, the equation of the line is kn/kH = 1.0 (1 − n + n/1.37)2. (b) Center: 1 × 10⁻³ M RGR-pNA elementary rate constants were calculated from progress curves as K1 = k1/k−1, triangles, k2 closed circles, and k3 open circles. The equations of the lines for fitting to the data are: kn/kH = (1 − n + n/(2.03)); kn/kH = (1 − n + n/(1.43)); and kn/kH = (1 − n + n/(3.11)2), respectively. (c) Right side: IPR-pNA; ratios of initial rates measured under saturating levels of substrate and plotted against n and the equation of the line is kn/kH = 1.0 (1 − n + n/1.5)2 (See Chart 1).

Figure 3.
Time course of turbidity development during fibrin formation from 0.33 μM fibrinogen, catalyzed by 1.5 nM thrombin in pH 8.0, 0.02 M Tris buffer containing 0.3 M NaCl, 1% DMSO, 0.1% PEG-4000 at 25.0 ± 0.1 °C, in D2O (n = 0.88) on the upper curve and in H2O on the lower curve and on each graph. (a) Left side: in the presence of 0.30 M NaF on top; 0.30 M NaCl middle, and 0.30 M choline Cl, bottom. (b) Right side: in the presence of 0.30 M choline Cl and 5 mM CaCl2 on top and in 0.30 M NaCl and 5 mM CaCl2 on the bottom.

Figure 4.
Proton inventory for the thrombin-catalyzed fibrinogen hydrolysis at conditions indicated in Figure 3. (a) Left side: open circles, initial rates at 22 μM fibrinogen and the equation of the line is kn/kH = 0.90 (1 − n + n/1.51)2; filled circles, pseudo-first-order data at 0.55 μM fibrinogen and the equation of the line is kn/kH = 0.98 (1 − n + n/1.56)2. (b) Right side: proton inventory for the evolution of turbidity during fibrin formation. Open circles represent inverse partial solvent isotope effects for the inverse lag (life) time and the line was calculated from τn/τH = 0.88 (±0.06) [5.55(±0.52)]n Closed circles are for the maximal slopes of turbidity plots and the line was calculated from slopen/slopeH, a = 1.13 (±0.06)[7.79 (±0.56)]n Errors are within the symbols.

Figure 5.
Solvent isotope effect for thrombin-catalyzed PC activation at pH 8.5, 0.02 M Tris, 0.30 M NaCl, 5 mM CaCl2, 0.1% PEG-4000, 100 nM TM, 13.1 nM thrombin and 37.0 ± 0.1 °C. Circles represent H2O buffer, triangles D2O buffer (n = 0.91) and squares H2O/D2O buffer (n = 0.45). The errors are smaller than the symbols.

Figure 6.
Human FXa-catalyzed human prothrombin activation in the presence of four-fold excess of FVa, at pH 7.50, 0.020 M Tris buffer, 5.0 × 10⁻⁵ M LUV, 5 × 10⁻³ M CaCl2 and 25.0 ± 0.1 °C. (a) Left side: Time dependence of the reactions, the filled circles represent H2O buffer and triangles D2O buffer. (b) Right side: Initial rates, the filled symbols represent H2O buffer and open symbols D2O buffer.

Figure 7.
(a) Left side: structure of Phe-Pro-Arg-chloromethylketone (PPACK) covalently linked to the catalytic triad of thrombin. (b) Right side: structure of paraoxon-inhibited thrombin after dealkylation (modified structures of the thrombin active site from the Protein Data Bank entry ISHH).
Figure 7.
(a) Left side: structure of Phe-Pro-Arg-chloromethylketone (PPACK) covalently linked to the catalytic triad of thrombin. (b) Right side: structure of paraoxon-inhibited thrombin after dealkylation (modified structures of the thrombin active site from the Protein Data Bank entry ISHH).

Figure 8.
α-Thrombin active site inhibited with PPACK.

Figure 9.
Low-field sections of 3000 transients of 600 MHz 1H NMR spectra of human α-thrombin and its inhibited forms at pH 6.5, 0.05 M citrate buffer, 0.20 M NaCl, 0.01% PEG800, 30.0 ± 0.1 °C and 7% D2O: human α-thrombin; r-hirudin in 0.01 M phosphate buffer; r-hirudin-inhibited thrombin; PPACK-inhibited thrombin; and PPACK added to the thrombin-r hirudin complex; from top to bottom, respectively. The line width at half height is 60 Hz for the thrombin-PPACK adduct and 98 Hz for the thrombin–hirudin complex.

Figure 10.
(a) Left side: Low-field region of the spectra (3–4000 transients) obtained for complexes of human α-thrombin with hirunorm V, hirunorm IV, RGD-hirudin (recombinant 32SGD34 type 2 hirudin), Nα(Me)Arg-peptide and D-NAPAP (Nα-2-naphthylsulfonyl-glycyl-DL-4-amidinophenylalanyl-piperidide acetate) from top to bottom, respectively, in pH 6.5, 0.025–0.050 M citrate buffer, 0.10–0.20 M NaCl, 0.005–0.010 % PEG-8000 at 30 °C. The corresponding peak widths at half height are 91, 82, 43, 38 and 125 Hz. (b) Right side: Temperature dependence of the low-field resonance for the human α-thrombin-hirunorm IV complex in pH 6.5, 0.020 M citrate buffer, 0.10 M NaCl and 0.005% PEG8000. The spectra were recorded at 35, 25, 15, and 5 °C, from top to bottom.

Figure 11.
Integration of the resonances obtained for the proton sponge (left) and the thrombin hirudin complexes in 6.6% D2O (middle) and in 58% D2O (right), both buffered at pH 7.5, 0.30 M HEPES buffer, 0.30 M glycine, 0.10 M NaCl, and 0.005% PEG-8000, 25.0 ± 0.1 °C.
Figure 11.
Integration of the resonances obtained for the proton sponge (left) and the thrombin hirudin complexes in 6.6% D2O (middle) and in 58% D2O (right), both buffered at pH 7.5, 0.30 M HEPES buffer, 0.30 M glycine, 0.10 M NaCl, and 0.005% PEG-8000, 25.0 ± 0.1 °C.

Figure 12.
The strand structures of the A chain in blue and B chain in cyan of human-α -thrombin complexed with hirudin in light green. Ile1′ and the most likely site of a short hydrogen bond (SHB) occurring in the thrombin-r-hirudin complex, residues 55 to 65 of r-hirudin engaged with Arg75 and Arg77 of thrombin, are labeled. The image is from the Protein Data Bank PDB file 4HTC [129] modeled with Jmol Version 12.0.41.


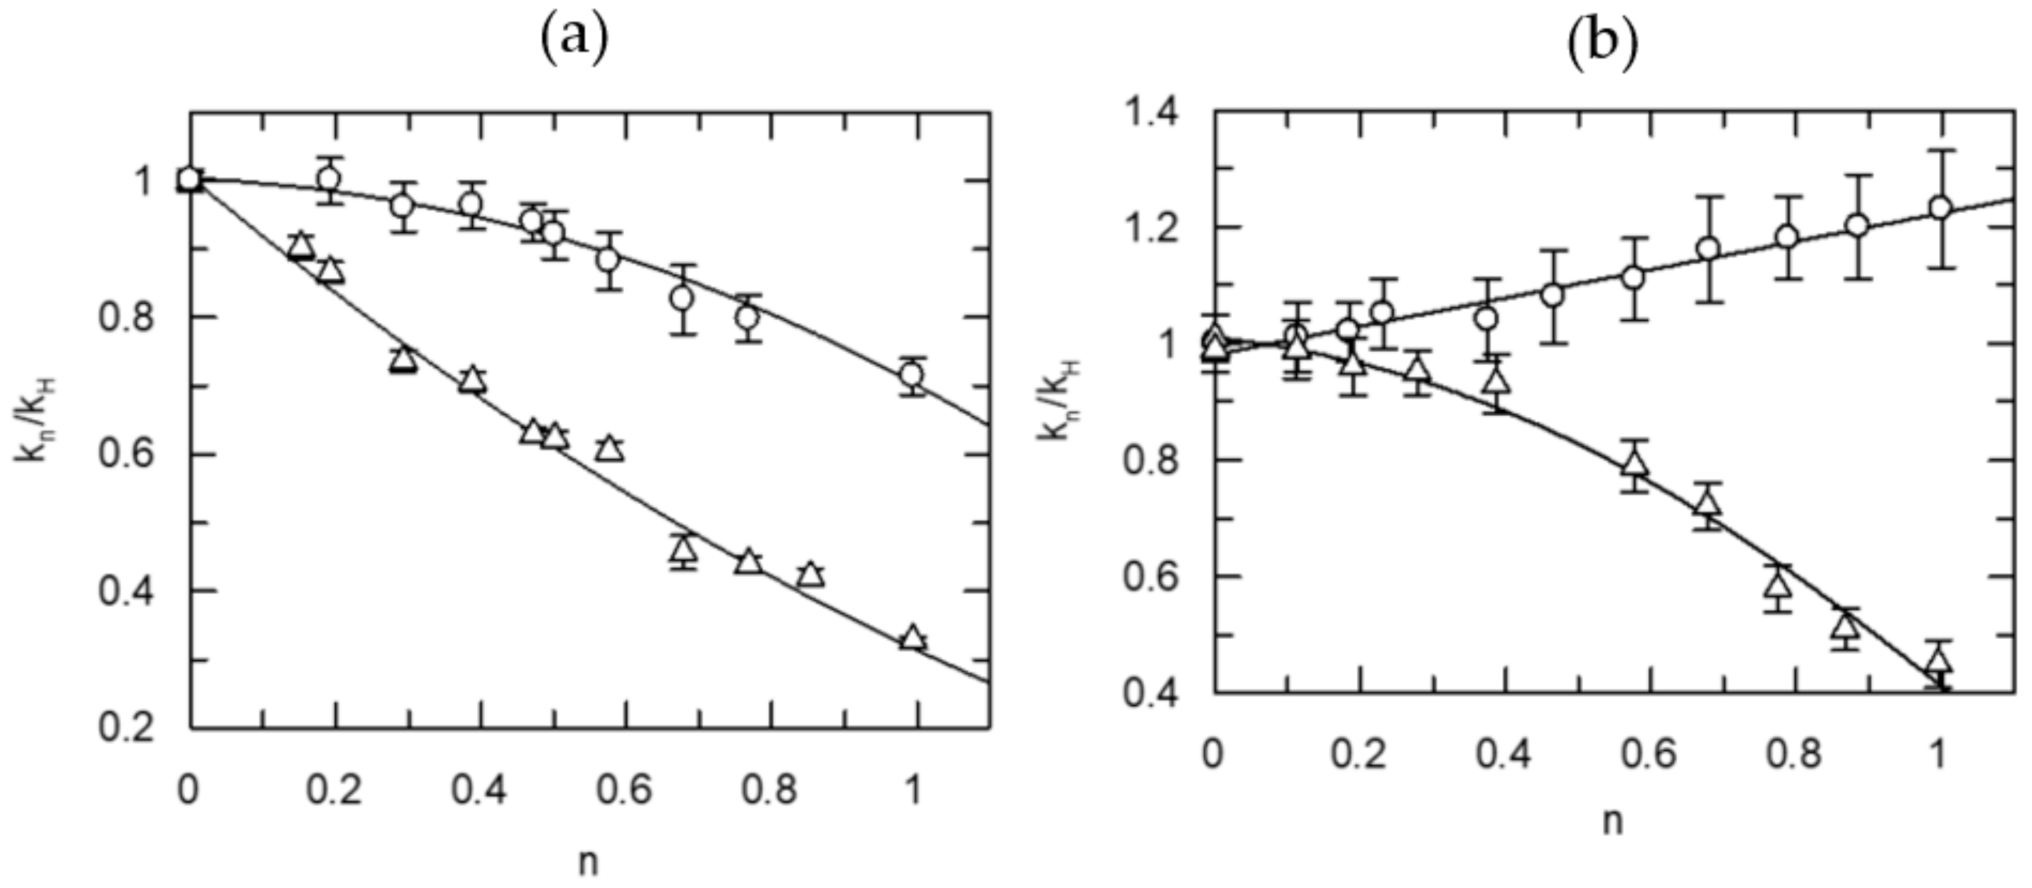
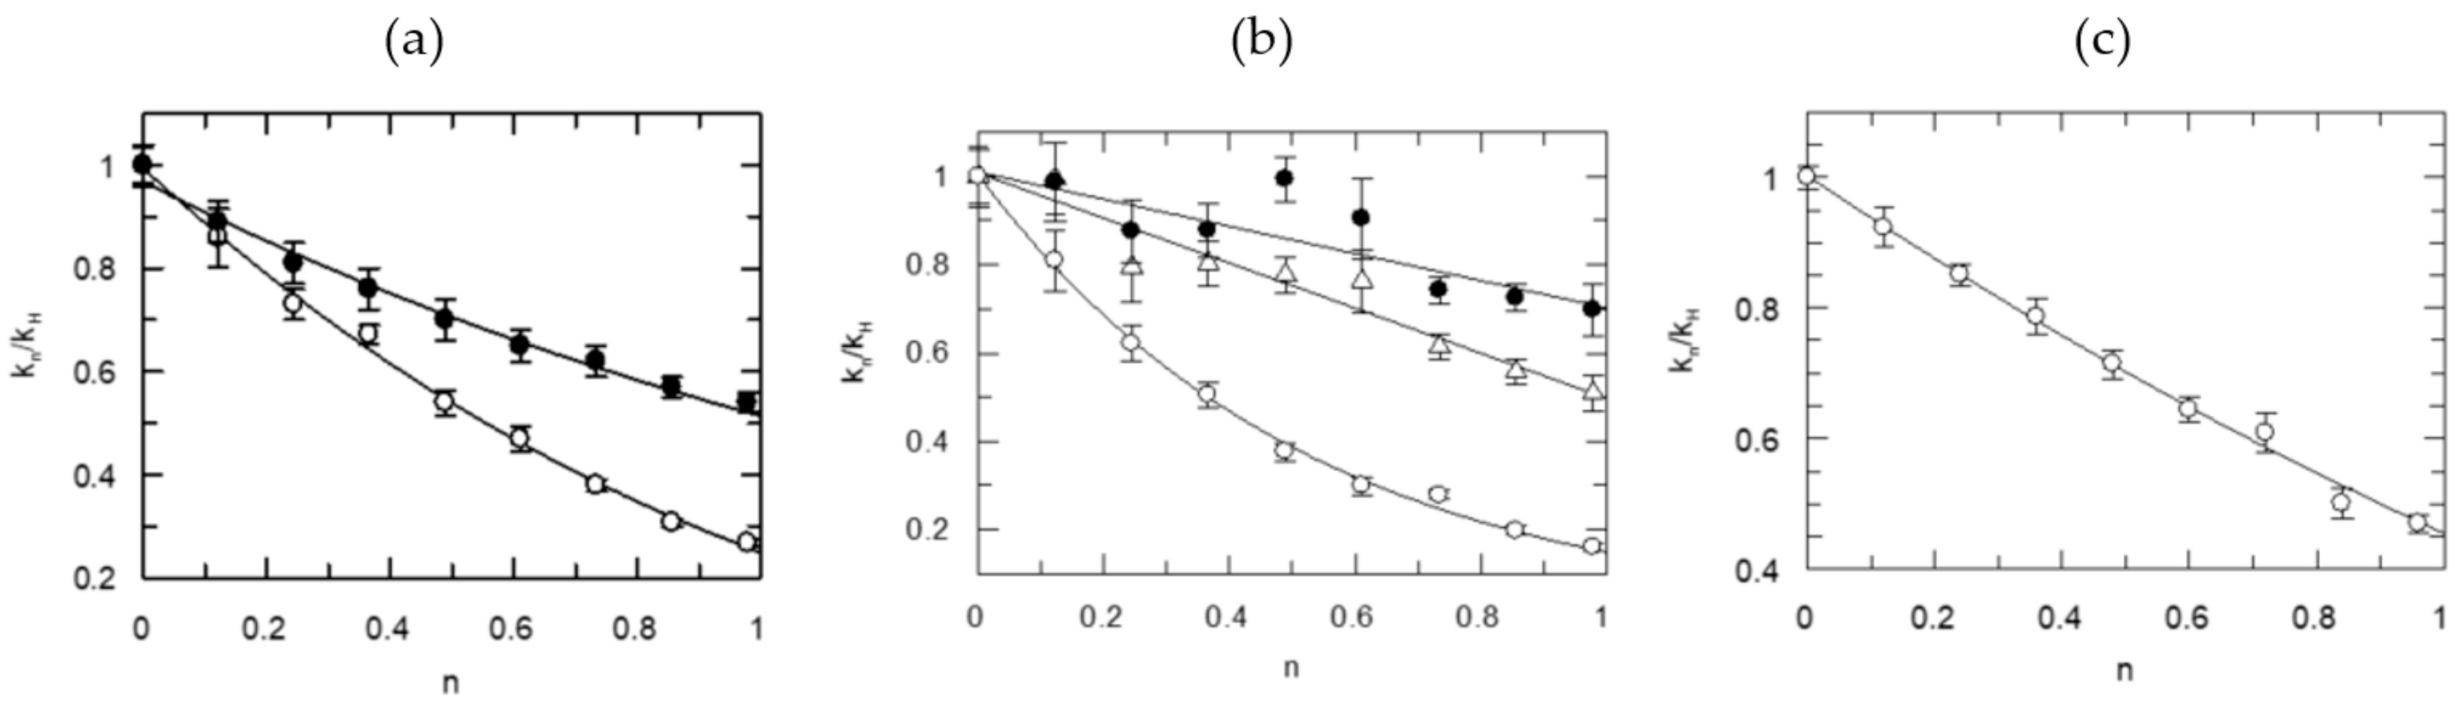
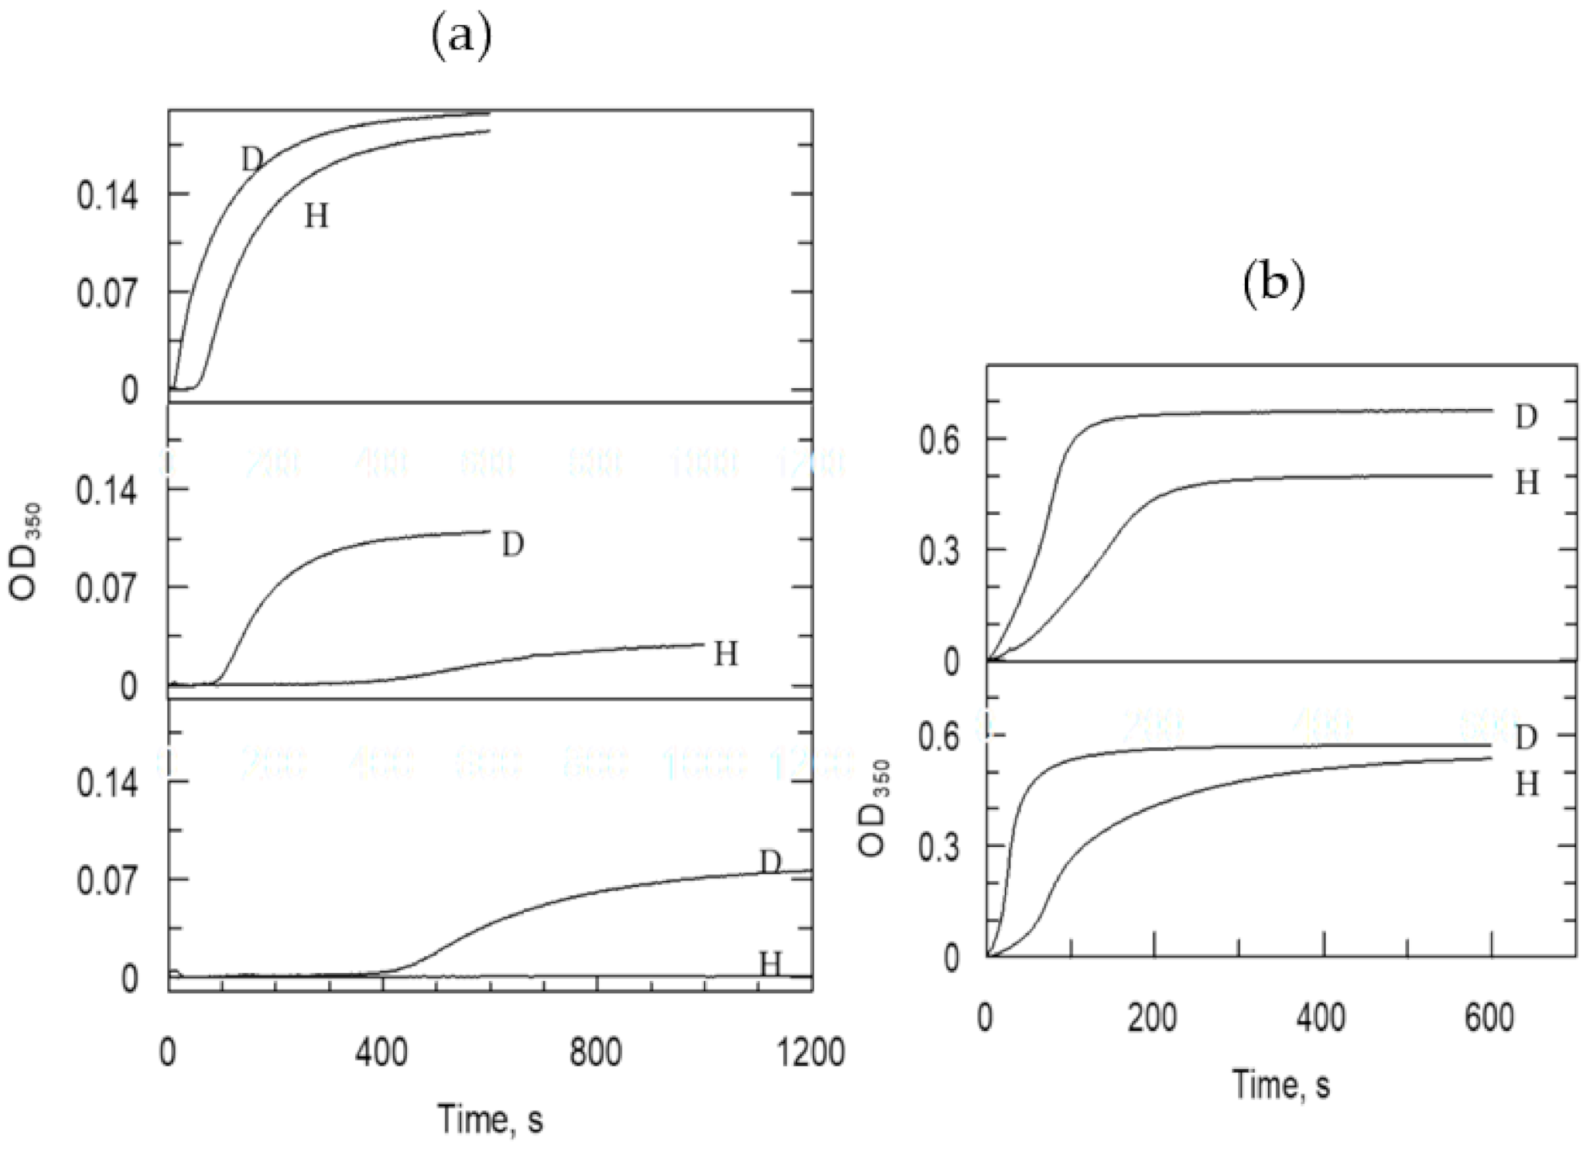
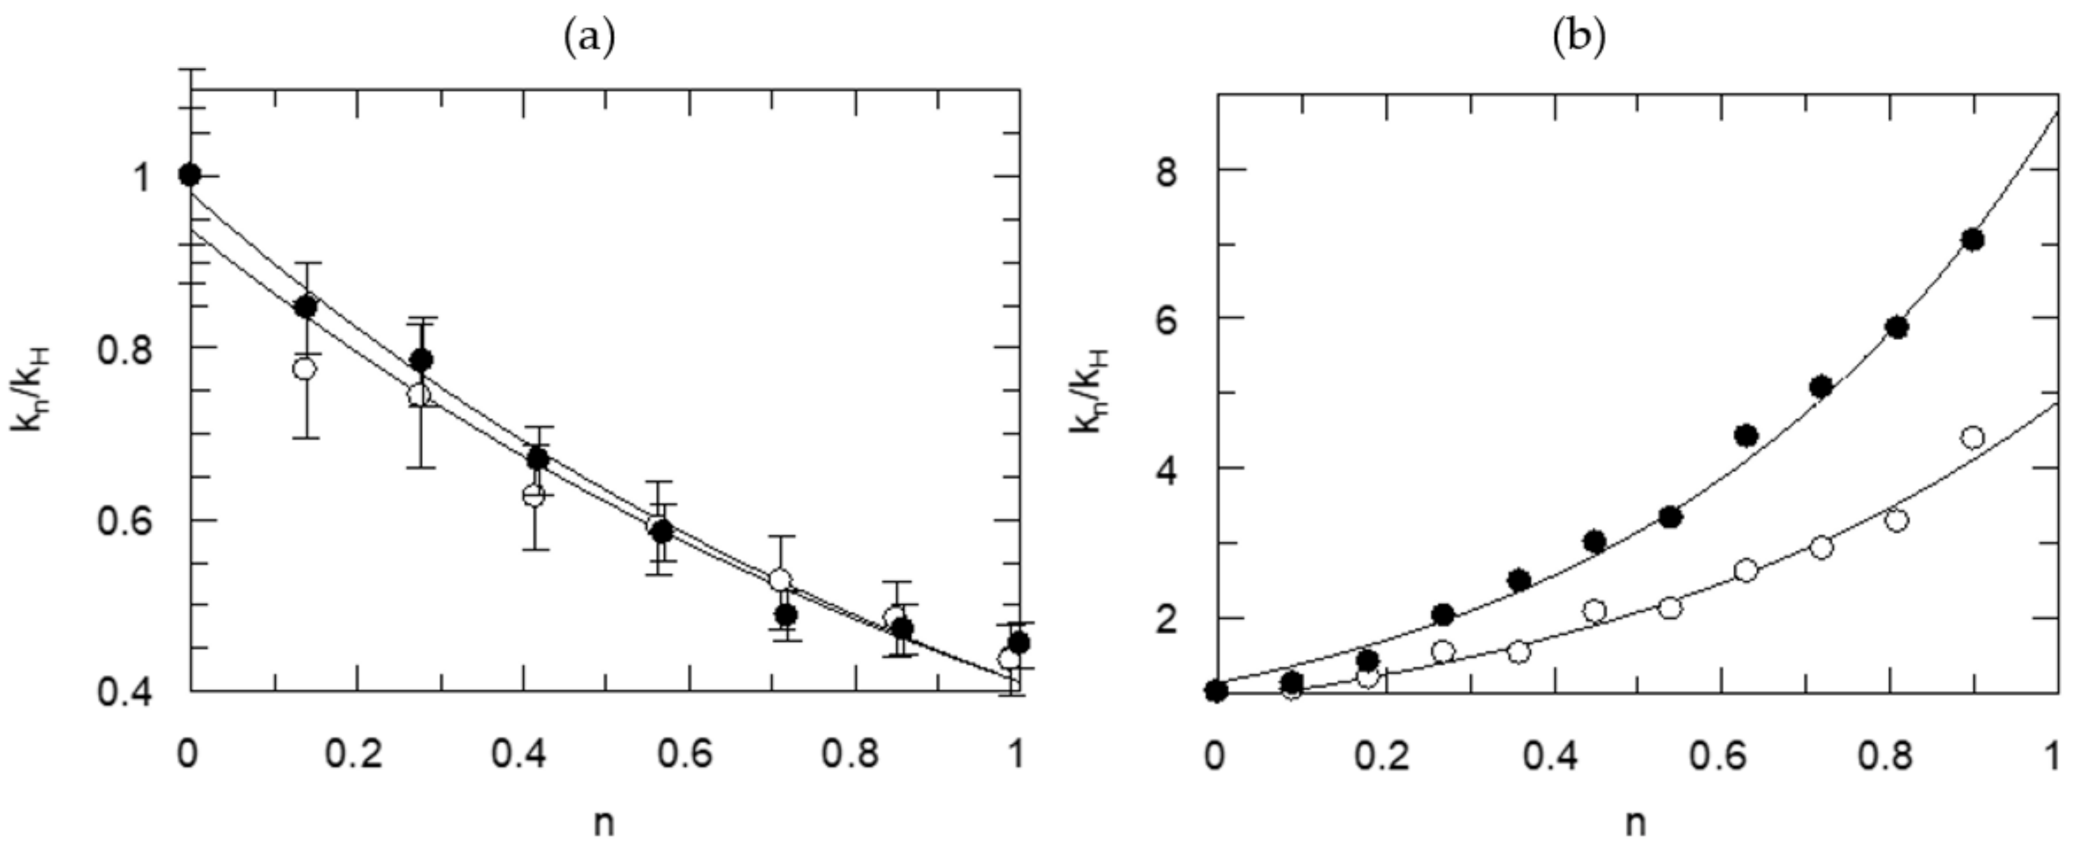
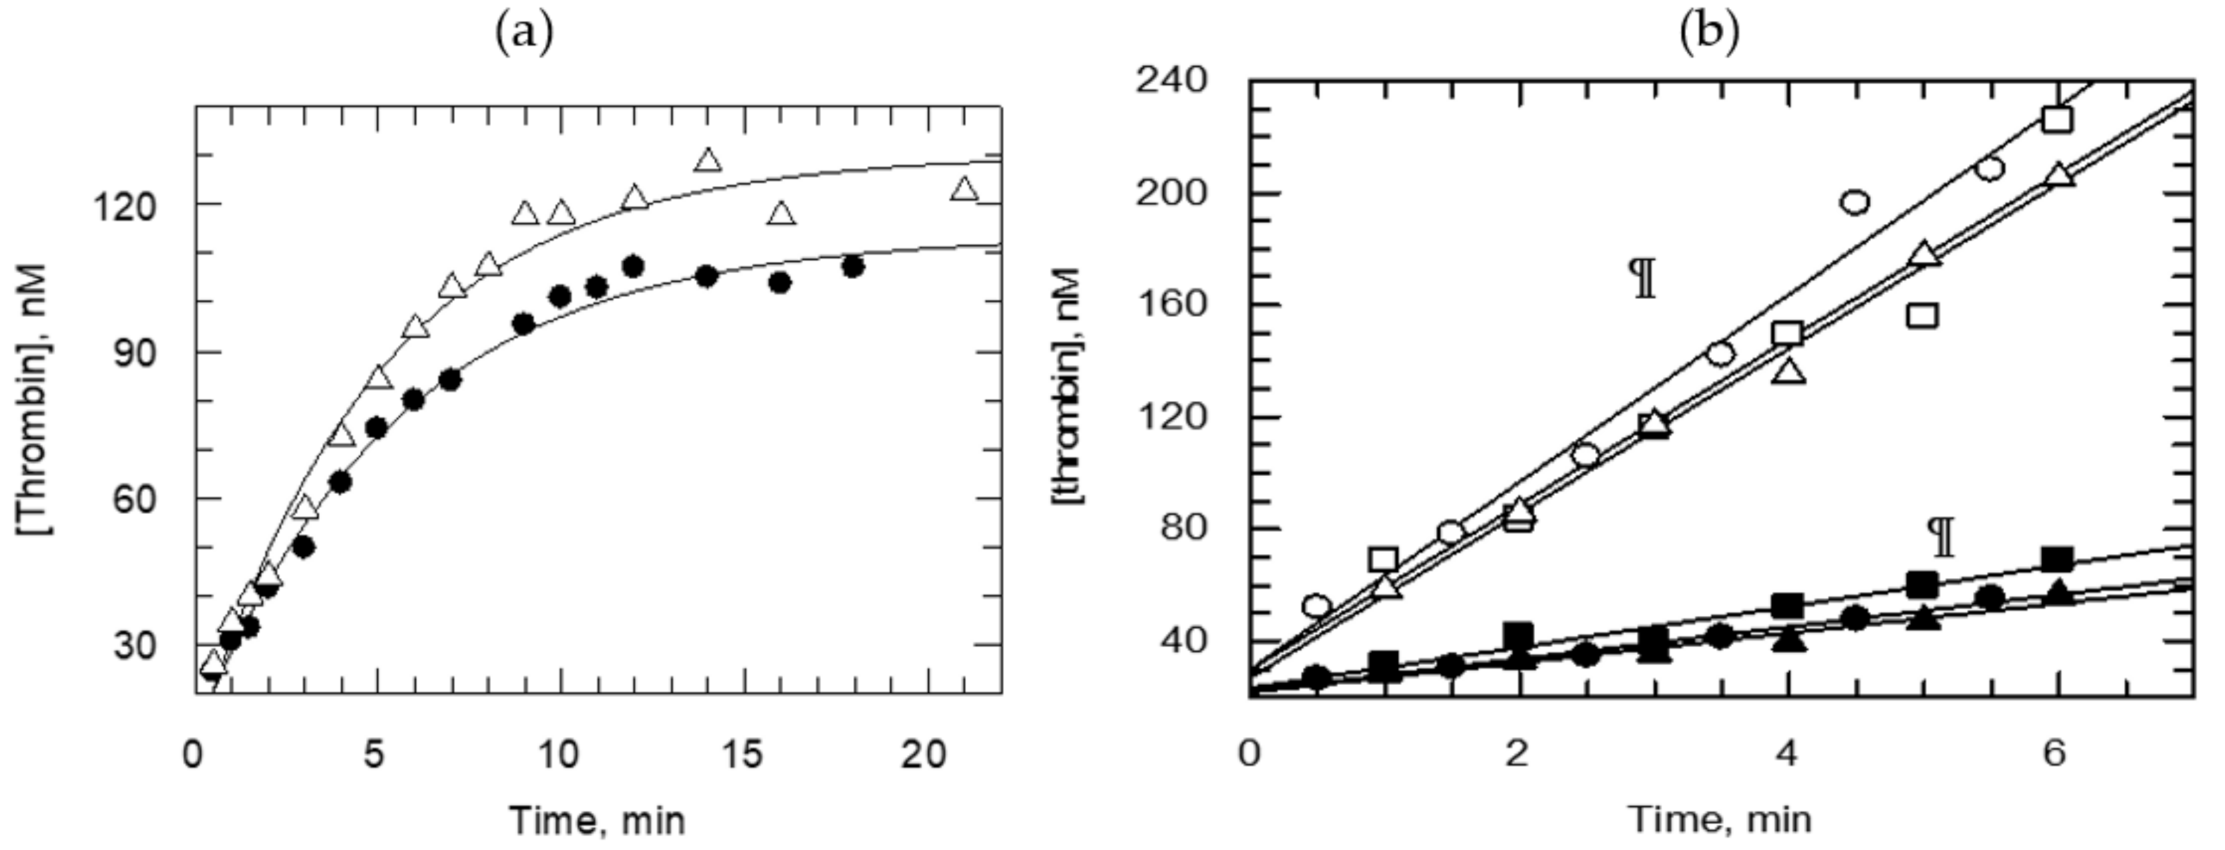
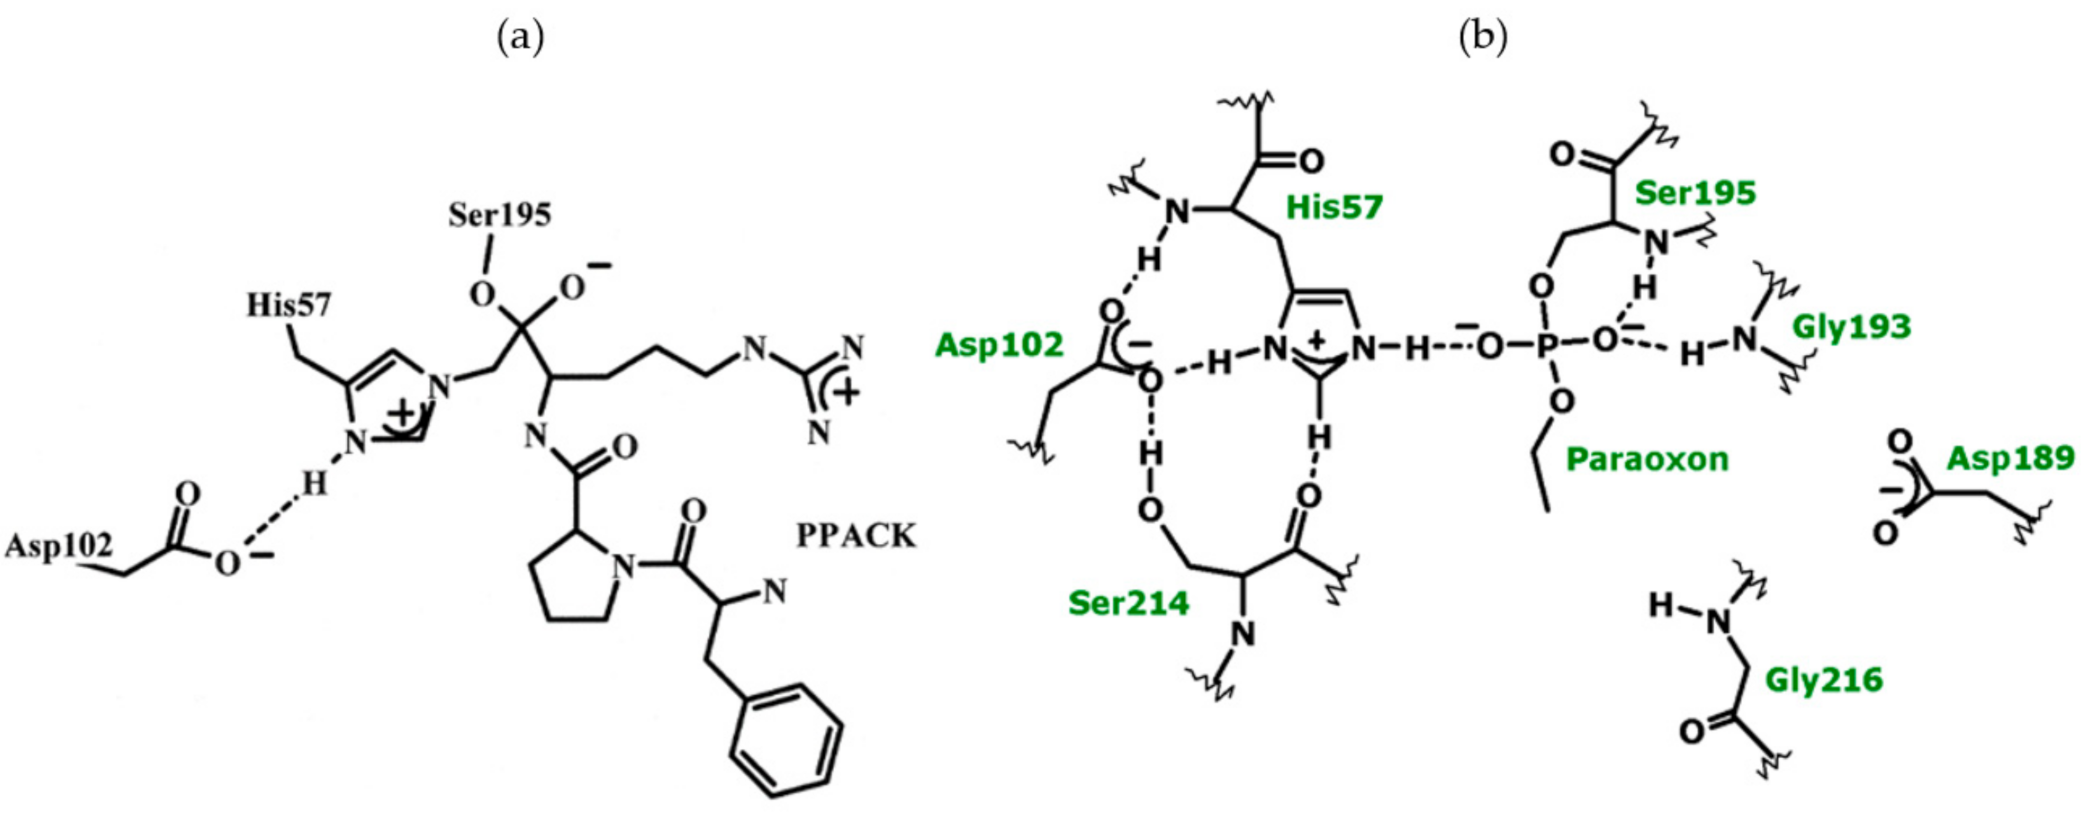
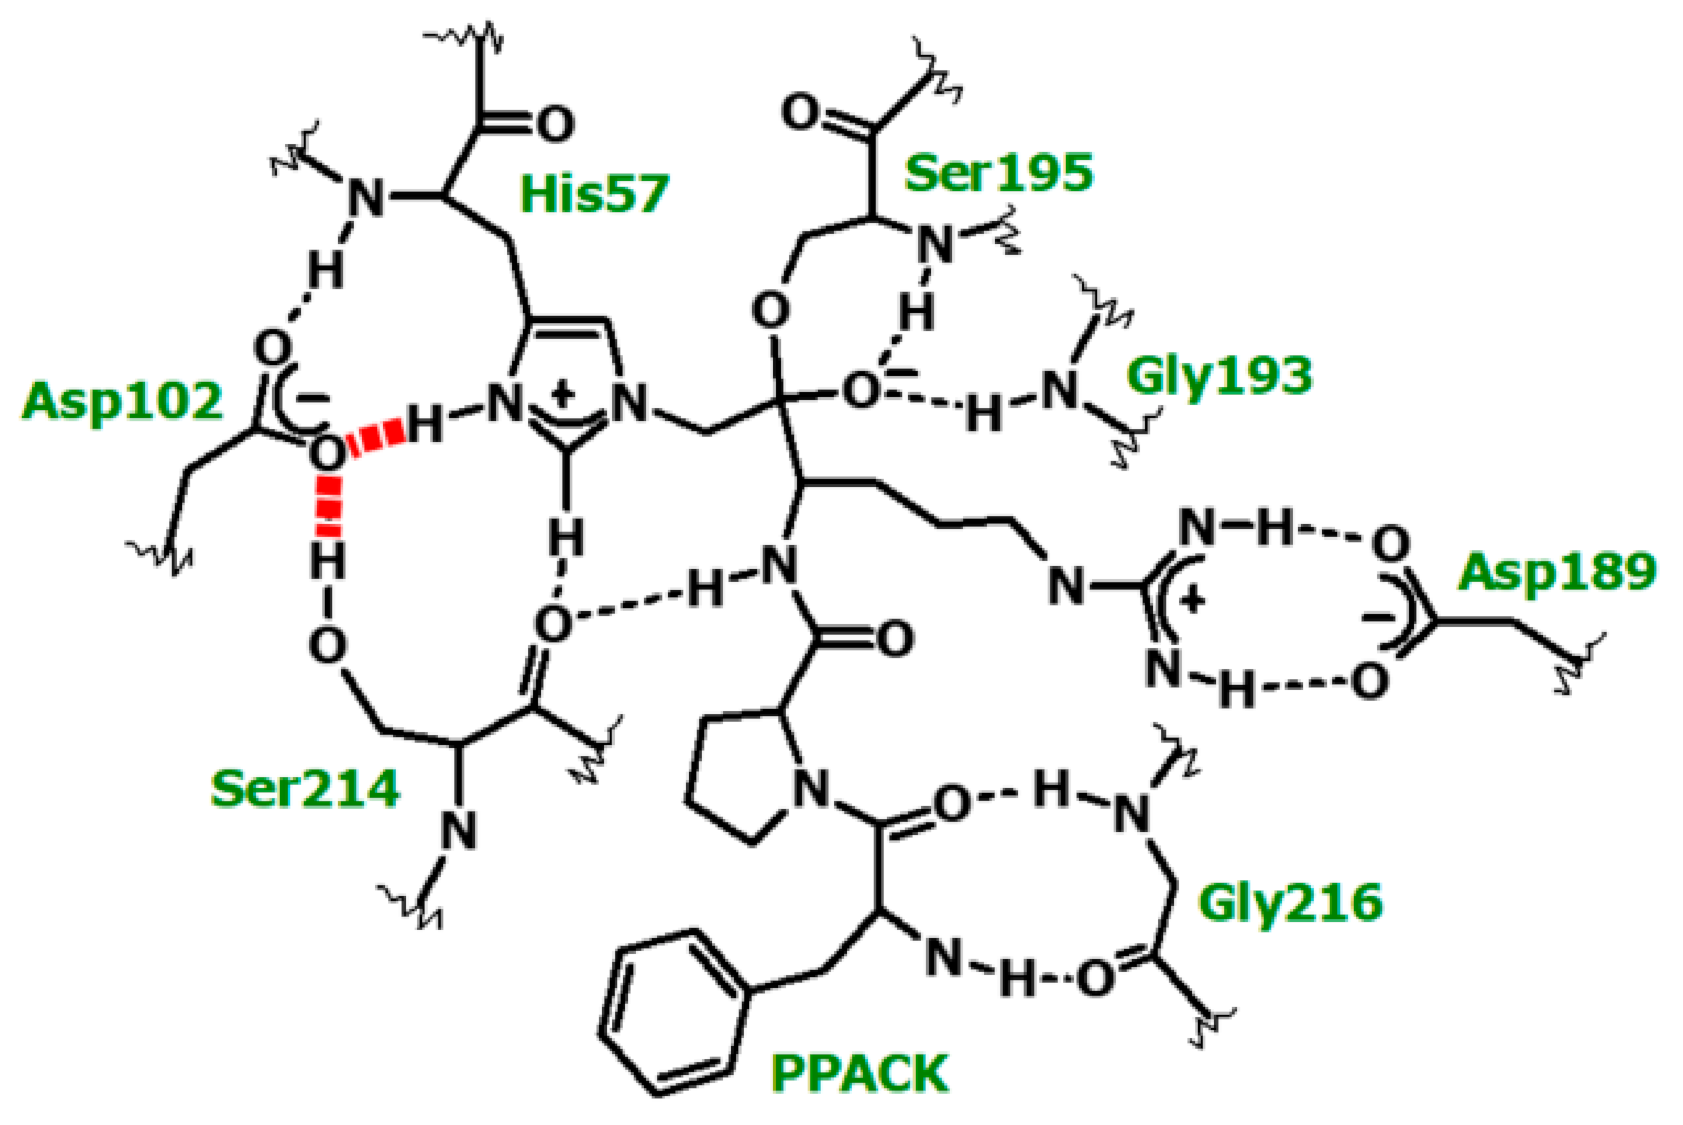
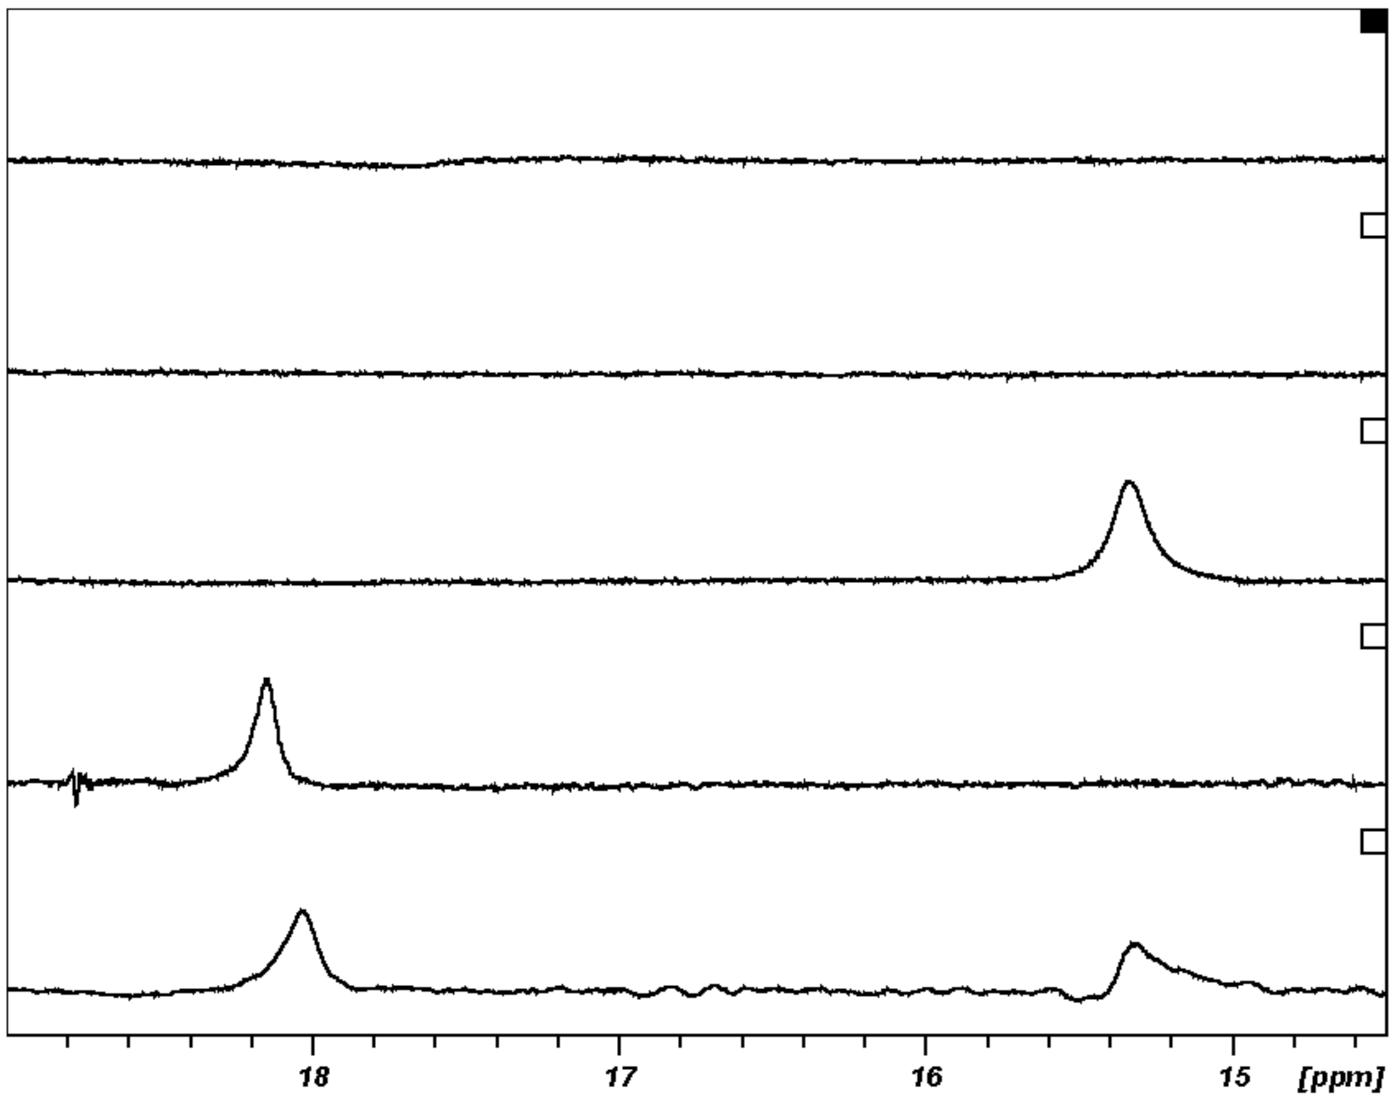
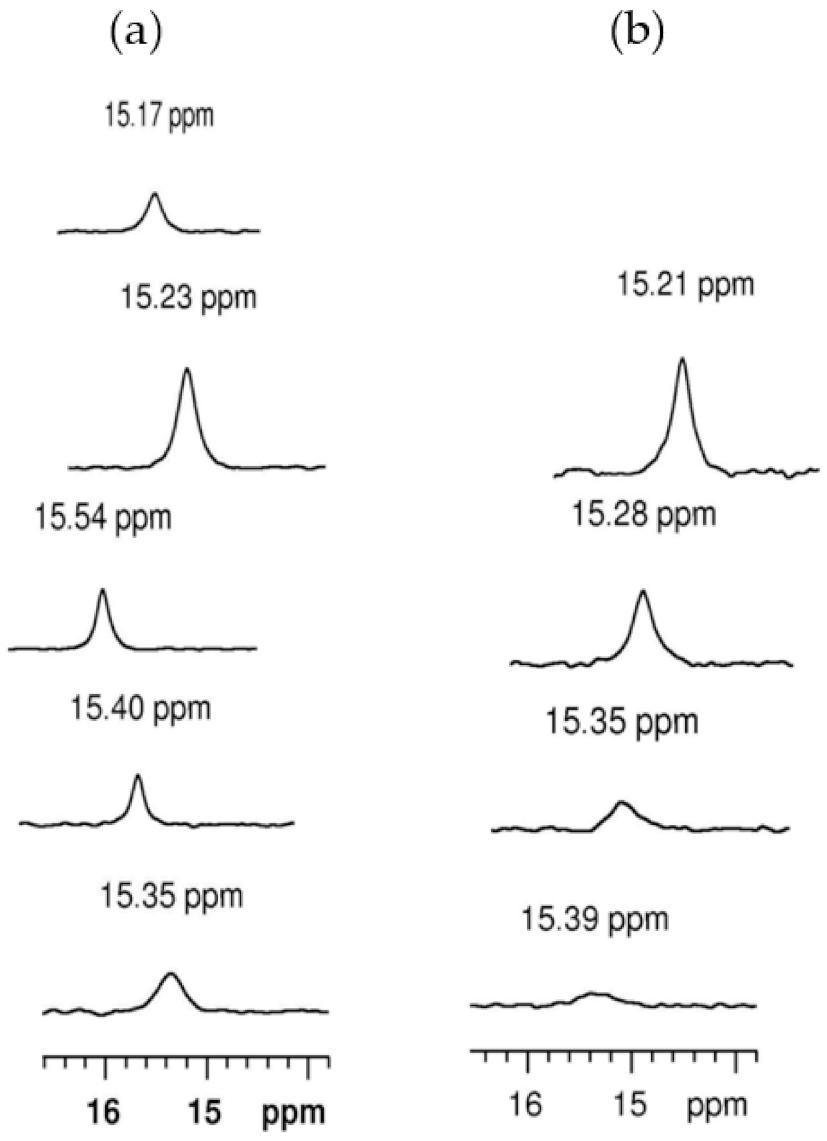
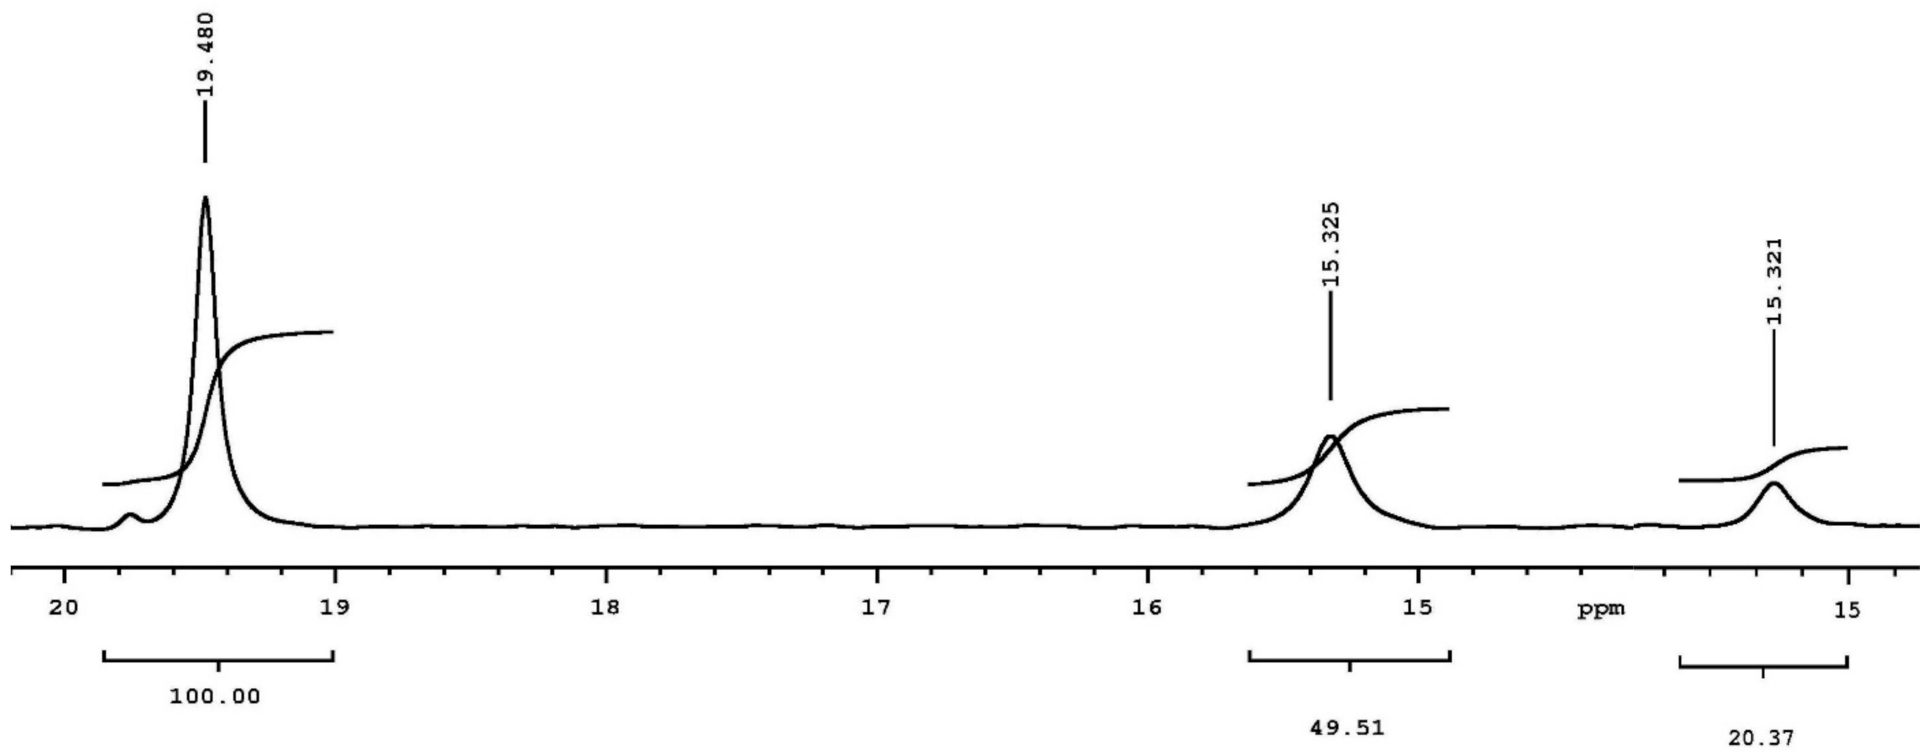
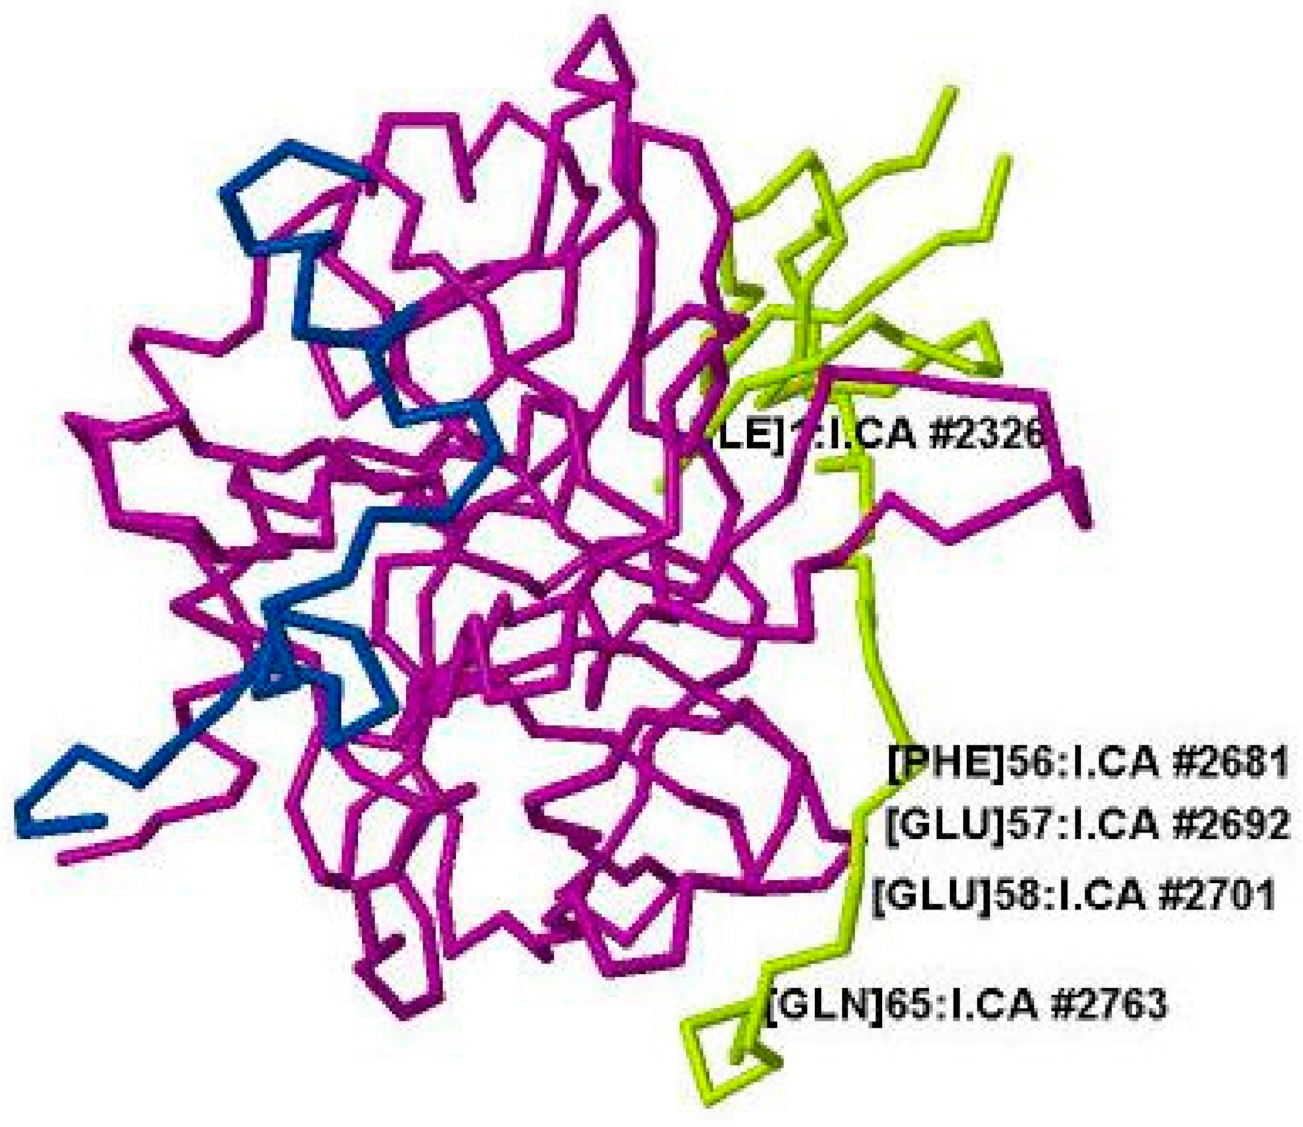
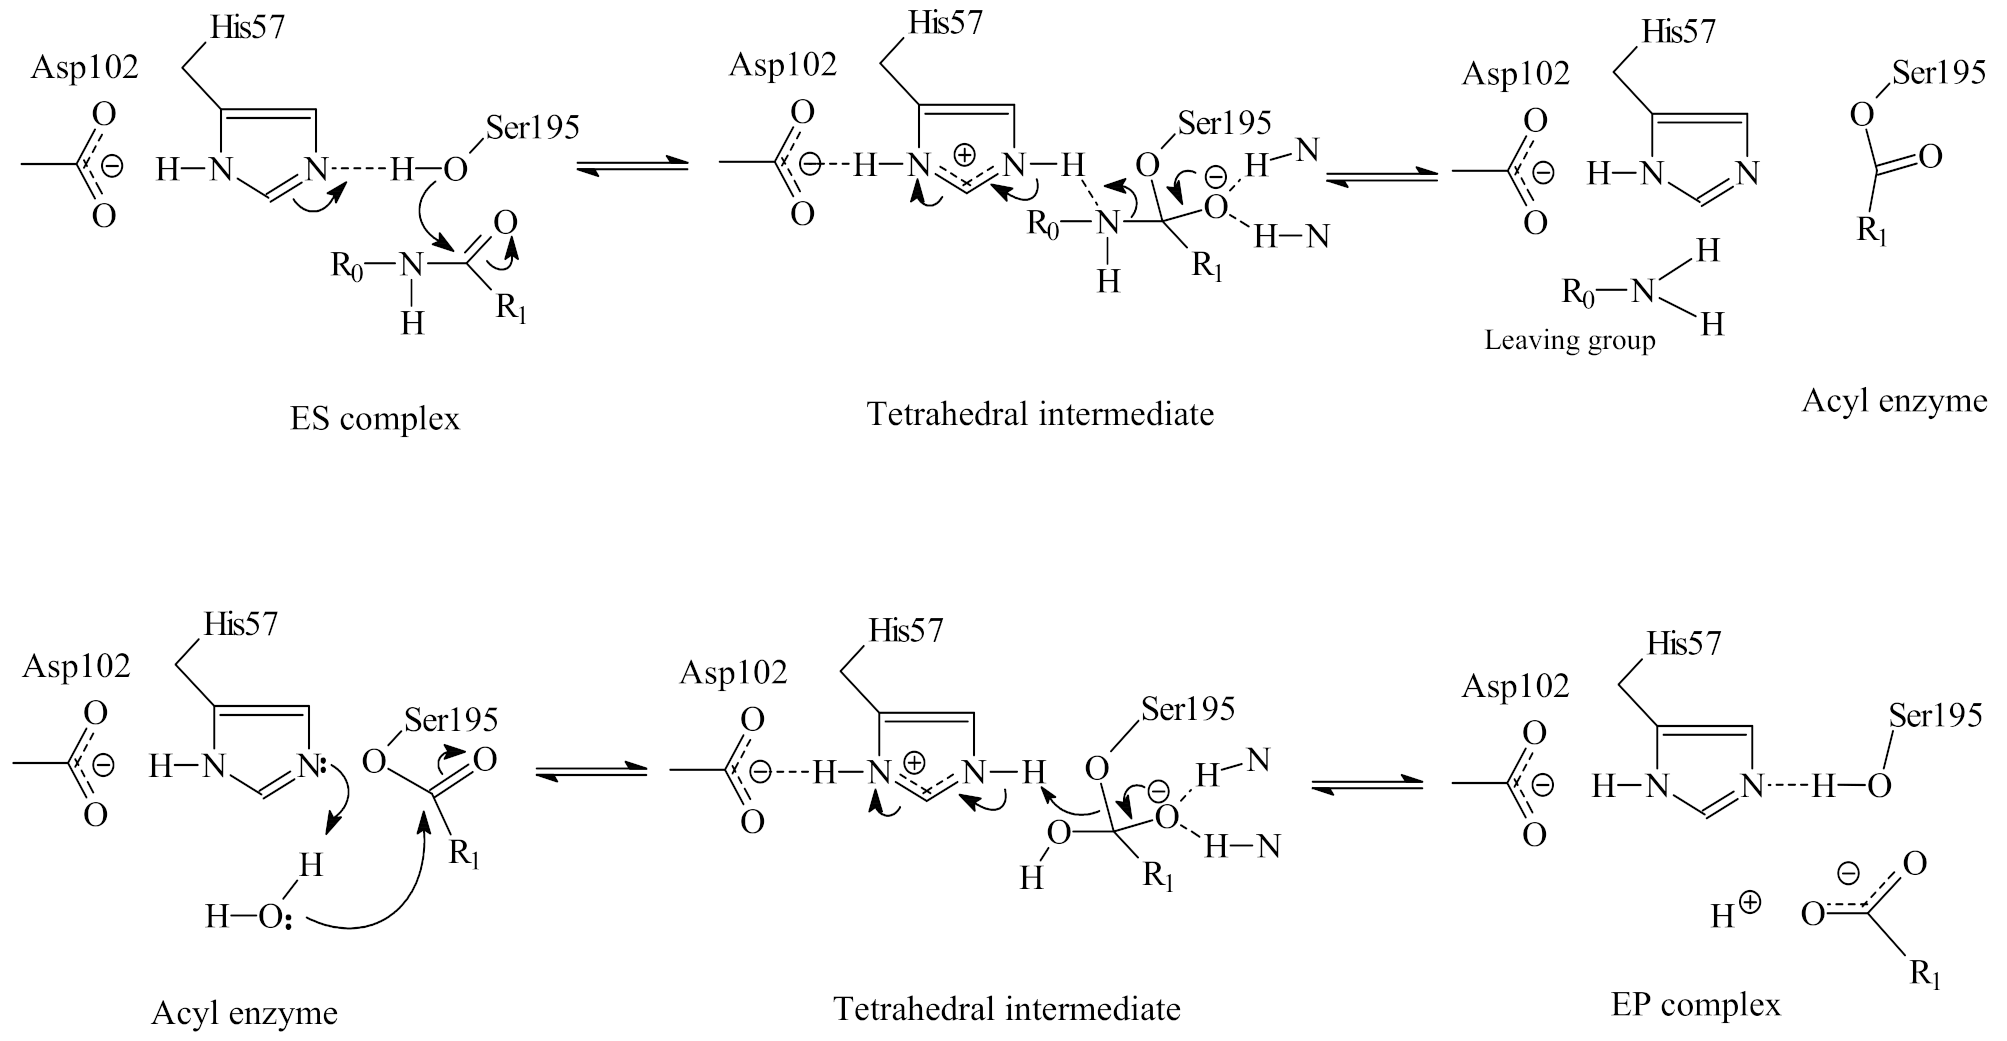
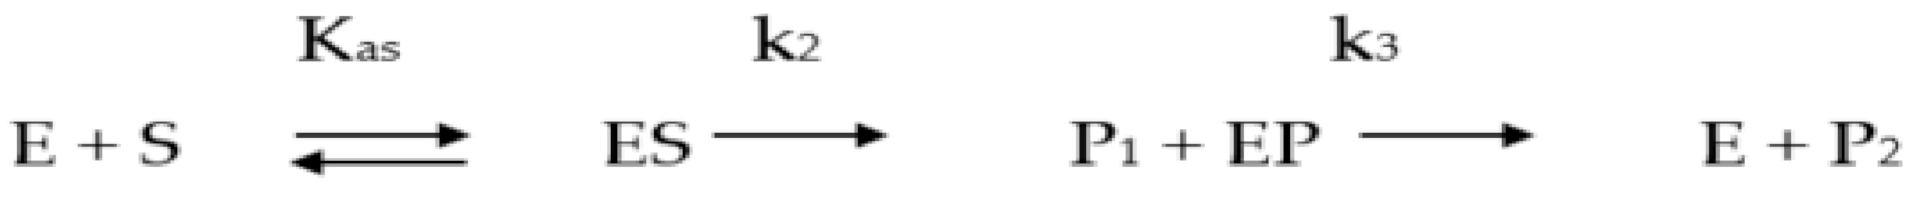
Chart 1.
The most useful models for fitting proton inventory data.
| Information Obtained | Equation |
|---|---|
| TS1 | kn = kH (1 − n + n ɸ1) |
| TS1, solv. | kn = kH (1 − n + n ɸ1) Sn |
| 2TS1 | kn = kH (1 − n + n ɸ1)2 |
| 2TS1, solv. | kn = kH (1 − n + n ɸ1)2 Sn |
| TS1, TS2 | kn = kH (1 − n + n ɸ1)(1 − n + n ɸ2) |
Table 1.
Fractionation factors fitting various models for the hydrolysis of N-t-Val-Pro-Arg 7-AMC (amido-4-methylcoumarin) catalyzed by thrombin at pH 8.40, 0.02 M Tris, 0.30 M NaCl, 1% dimethyl sulfoxide (DMSO), 0.1% polyethelene glycole PEG-4000 at 26.0 ± 0.1 °C. Data were fit using explicit weighting by incorporating individual errors [20].
| ɸ1 | ɸ2 | ɸs | χ2 | |
|---|---|---|---|---|
| kn/kH | ||||
| TS1 | 0.32 ± 0.01 | ---- | ---- | 4.997 |
| TS1, solv. | 0.44 ± 0.05 | ---- | 0.70 ± 0.10 | 2.526 |
| 2TS1 | 0.57 ± 0.01 | 0.57 ± 0.01 | (1.00) | 2.278 |
| 2TS1, solv. | 0.56 ± 0.04 | 0.56 ± 0.04 | 1.04 ±0.15 | 2.514 |
| TS1, TS2 | 0.49 ± 0.15 | 0.66 ± 0.20 | (1.00) | 2.515 |
| (kcat/Km)n/(kcat/Km)H | ||||
| TS1 | 0.73 ± 0.03 | ---- | ---- | 1.335 |
| TS1, solv. | 0.42 ± 0.03 | ---- | 1.65 ± 0.10 | 0.274 |
| 2TS1 | 0.86 ± 0.02 | 0.86 ± 0.02 | (1.00) | 1.514 |
| 2TS1, solv. | 0.55 ± 0.02 | 0.55 ± 0.02 | 2.4 ±0.2 | 0.236 |
| TS1, TS2 | 0.47 ± 0.02 | 1.50 ± 0.06 | (1.00) | 0.222 |
Table 2.
Summary of kinetic solvent isotope effects (KSIEs) and fractionation factors (transition state (TS), ɸTS; solvent, ɸS).
Table 2.
Summary of kinetic solvent isotope effects (KSIEs) and fractionation factors (transition state (TS), ɸTS; solvent, ɸS).
| Residues 1 | DODkcat(SD) | ɸTS; ɸs | DOD(kcat/Km)(SD) | ɸTS; ɸs |
|---|---|---|---|---|
| Thrombin. [20] | ||||
| PR | 3.27(0.13) | 0.38; 0.80 | 2.09(0.04) | 0.38; 1.22 |
| VPR | 3.05(0.05) | 0.44; 0.70 | 1.40(0.05) | 0.42; 1.65 |
| Or | 0.57x 3 | 0.55x2; 2.4 | ||
| SPR-SFQ | 2.24(0.08) | 0.44 | 0.94(0.03) | 0.44; 2.4 2 |
| FPR-SFR | 2.25(0.24) | 0.36x2; 3.1 | 0.81(0.08) | -; 1.2 2 |
| FVR | 2.86(0.06) | 0.63x2 3 | 1.8(0.1) | 0.63x2; 1.2 |
| FPiR | 2.86(0.07) | 0.40x2; 2.0 | 1.0(0.2) | |
| APC [134] | ||||
| IPR | 2.35(0.04) | 0.60x2 3 | 1.80(0.01) | |
| EPR | 2.42(0.01) | 0.60x2 3 | 1.90(0.02) | |
| Plasmin [134] | ||||
| EFK | 3.48(0.02) | 0.60x2 3; 0.7 | 1.83(0.01) | 0.5; 2.1 |
| VFK | 2.32(0.02) | 0.3; 1.3 | 1.56(0.01) | 0.3; 2.5 |
| VLK | 2.76(0.02) | 0.2; 1.4 | 2.52(0.01) | |
| Factor Xa [22] | ||||
| RGR | 3.90(0.05) | 0.60x2 3; 0.72 | 1.88(0.03) | 0.72x2 3 |
| IPR | 2.39(0.53) | 0.66x2 3 | 1.79(0.19) | - |
1 flanking scissile bond to AMC, lines 1–3; internal quench, lines 4–5; 4-nitoranilide, lines 6–12; 2 results confirmed under first-order conditions; 3 two identical fractionation factors; standard deviation (SD).
Table 3.
Summary of kinetic data for the covalent inhibition of human α-thrombin at 25.0 ± 0.1 °C [23].
Table 3.
Summary of kinetic data for the covalent inhibition of human α-thrombin at 25.0 ± 0.1 °C [23].
| Inhibitor | pKa 1 | pKa 2 | ki/Ki, M−1 s−1 max | ki, s−1 pH 7.00 | Ki, M pH 7.00 | ΔH‡ kcal/mol | ΔS‡ cal/mol, K |
|---|---|---|---|---|---|---|---|
| PPACK | 7.3 ± 0.2 | 8.8 ± 0.3 | (2.2 ± 0.3) × 107 | 0.24 ± 0.12 | (2.4 ± 1.3) × 10−8 | 10.6 ± 0.7 | 9 ± 2 |
| Paraoxon | 7.8 ± 0.2 | 9.3 ± 0.3 | 0.47 ± 0.05 | >10−5 | |||
| NPMP | 8.0 ± 0.1 | 8.6 ± 0.2 | 6.2 ± 0.1 | >10−5 |
Publisher’s Note: MDPI stays neutral with regard to jurisdictional claims in published maps and institutional affiliations. |
© 2021 by the author. Licensee MDPI, Basel, Switzerland. This article is an open access article distributed under the terms and conditions of the Creative Commons Attribution (CC BY) license (https://creativecommons.org/licenses/by/4.0/).
Share and Cite
MDPI and ACS Style
Kovach, I.M. Proton Bridging in Catalysis by and Inhibition of Serine Proteases of the Blood Cascade System. Life 2021, 11, 396. https://doi.org/10.3390/life11050396
AMA Style
Kovach IM. Proton Bridging in Catalysis by and Inhibition of Serine Proteases of the Blood Cascade System. Life. 2021; 11(5):396. https://doi.org/10.3390/life11050396
Chicago/Turabian StyleKovach, Ildiko M. 2021. "Proton Bridging in Catalysis by and Inhibition of Serine Proteases of the Blood Cascade System" Life 11, no. 5: 396. https://doi.org/10.3390/life11050396
Note that from the first issue of 2016, this journal uses article numbers instead of page numbers. See further details here.