Dietary Nutrient Intake, Alcohol Metabolism, and Hangover Severity

 ,
,  , , and
Abstract
:1. Introduction
2. Materials and Methods
2.1. Subjects
2.2. Procedures
2.3. Alcohol Consumption and Hangover Severity
2.4. Dietary Recall
2.5. Statistical Analysis
3. Results
4. Discussion
5. Conclusions
Author Contributions
Conflicts of Interest
References
- Van Schrojenstein Lantman, M.; van de Loo, A.J.; Mackus, M.; Verster, J.C. Development of a definition for the alcohol hangover: Consumer descriptions and expert consensus. Curr. Drug Abuse Rev. 2016, 9, 148–154. [Google Scholar] [CrossRef] [PubMed]
- Palmer, E.; Tyacke, R.; Sastre, M.; Lingford-Hughes, A.; Nutt, D.; Ward, R.J. Alcohol Hangover: Underlying Biochemical, Inflammatory and Neurochemical Mechanisms. Alcohol Alcohol. 2019, 54, 196–203. [Google Scholar] [CrossRef] [PubMed]
- Penning, R.; van Nuland, M.; Fliervoet, L.A.L.; Olivier, B.; Verster, J.C. The pathology of alcohol hangover. Curr. Drug Abuse Rev. 2010, 3, 68–75. [Google Scholar] [CrossRef] [PubMed]
- Kim, H.; Kim, Y.J.; Jeong, H.Y.; Kim, J.Y.; Choi, E.K.; Chae, S.W.; Kwon, O. A standardized extract of the fruit of Hovenia dulcis alleviated alcohol-induced hangover in healthy subjects with heterozygous ALDH2: A randomized, controlled, crossover trial. J. Ethnopharmacol. 2017, 209, 167–174. [Google Scholar] [CrossRef] [PubMed]
- Van de Loo, A.J.A.E.; Mackus, M.; Korte-Bouws, G.A.H.; Brookhuis, K.A.; Garssen, J.; Verster, J.C. Urine ethanol concentration and alcohol hangover severity. Psychopharmacology 2017, 234, 73–77. [Google Scholar] [CrossRef] [PubMed]
- Min, J.A.; Lee, K.; Ki, D.J. The application of minerals in managing alcohol hangover: A preliminary review. Curr. Drug Abuse Rev. 2010, 3, 110–115. [Google Scholar] [CrossRef] [PubMed]
- Wang, F.; Li, Y.; Zhang, Y.J.; Zhou, Y.; Li, S.; Li, H.B. Natural Products for the Prevention and Treatment of Hangover and Alcohol Use Disorder. Molecules 2016, 21, 64. [Google Scholar] [CrossRef] [PubMed]
- Sadler, D.W.; Fox, J. Intra-individual and inter-individual variation in breath alcohol pharmacokinetics: The effect of food on absorption. Sci. Justice 2011, 51, 3–9. [Google Scholar] [CrossRef] [PubMed]
- Watkins, R.L.; Adler, E.V. The effect of food on alcohol absorption and elimination patterns. J. Forensic Sci. 1993, 38, 285–291. [Google Scholar] [CrossRef]
- Lin, Y.; Weidler, D.J.; Garg, D.C.; Wagner, J.G. Effects of solid food on blood levels of alcohol in man. Res. Commun. Chem. Pathol. Pharmacol. 1976, 13, 713–722. [Google Scholar] [PubMed]
- Millar, K.; Hammersley, R.H.; Finnigan, F. Reduction of alcohol-induced performance impairment by prior ingestion of food. Br. J. Psychol. 1992, 83 Pt 2, 261–278. [Google Scholar] [CrossRef]
- Pikaar, N.A.; Wedel, M.; Hermus, R.J. Influence of several factors on blood alcohol concentrations after drinking alcohol. Alcohol Alcohol. 1988, 23, 289–297. [Google Scholar] [PubMed]
- Finnigan, F.; Hammersley, R.; Millar, K. Effects of meal composition on blood alcohol level, psychomotor performance and subjective state after ingestion of alcohol. Appetite 1998, 31, 361–375. [Google Scholar] [CrossRef] [PubMed]
- Kim, M.J.; Lim, S.W.; Kim, J.H.; Choe, D.J.; Kim, J.I.; Kang, M.J. Effect of Mixed Fruit and Vegetable Juice on Alcohol Hangovers in Healthy Adults. Prev. Nutr. Food Sci. 2018, 23, 1–7. [Google Scholar] [CrossRef] [PubMed]
- Hong, Y.H. Effects of the herb mixture, DTS20, on oxidative stress and plasma alcoholic metabolites after alcohol consumption in healthy young men. Integr. Med. Res. 2016, 5, 309–316. [Google Scholar] [CrossRef] [PubMed]
- Bullock, C. The biochemistry of alcohol metabolism—A brief review. Biochem. Educ. 1990, 18, 62–66. [Google Scholar] [CrossRef]
- Cederbaum, A.I. Alcohol metabolism. Clin. Liver Dis. 2012, 16, 667–685. [Google Scholar] [CrossRef]
- Kawai, S.; Murata, K. Structure and function of NAD kinase and NADP phosphatase: Key enzymes that regulate the intracellular balance of NAD(H) and NADP(H). Biosci. Biotechnol. Biochem. 2008, 72, 919–930. [Google Scholar] [CrossRef]
- Heier, C.; Xie, H.; Zimmermann, R. Nonoxidative ethanol metabolism in humans-from biomarkers to bioactive lipids. IUBMB Life 2016, 68, 916–923. [Google Scholar] [CrossRef]
- Goodsell, D.S. Molecule of the Month: Alcohol Dehydrogenase. 2001. Available online: https://pdb101.rcsb.org/motm/13 (accessed on 7 July 2019).
- Kägi, J.H.; Vallee, B.L. The role of zinc in alcohol dehydrogenase. V. The effect of metal-binding agents on the structure of the yeast alcohol dehydrogenase molecule. J. Biol. Chem. 1960, 235, 3188–3192. [Google Scholar]
- Kirkland, J.B.; Meyer-Ficca, M.L. Niacin. Adv. Food Nutr. Res. 2018, 83, 83–149. [Google Scholar] [PubMed]
- Plum, L.M.; Rink, L.; Haase, H. The essential toxin: The impact of zinc on human health. Int. J. Environ. Res. Public Health 2010, 7, 1342–1365. [Google Scholar] [CrossRef] [PubMed]
- Roohani, N.; Hurrell, R.; Kelishadi, R.; Schulin, R. Zinc and its importance for human health: An integrative review. J. Res. Med. Sci. 2013, 18, 144–157. [Google Scholar] [PubMed]
- Horwitt, M.K.; Harper, A.E.; Henderson, L.M. Niacin-tryptophan relationships for evaluating niacin equivalents. Am. J. Clin. Nutr. 1981, 34, 423–427. [Google Scholar] [CrossRef] [PubMed] [Green Version]
- Watson, P.E.; Watson, I.D.; Batt, R.D. Prediction of blood alcohol concentrations in human subjects. Updating the Widmark Equation. J. Stud. Alcohol Drugs 1981, 42, 547–556. [Google Scholar] [CrossRef]
- Verster, J.C.; de Klerk, S.; Bervoets, A.C.; Kruisselbrink, L.D. Can hangover immunity really be claimed? Curr. Drug Abuse Rev. 2013, 6, 253–254. [Google Scholar] [CrossRef]
- Kruisselbrink, L.D.; Bervoets, A.C.; de Klerk, S.; van de Loo, A.J.A.E.; Verster, J.C. Hangover resistance in a Canadian university student population. Addict. Behav. Rep. 2017, 5, 14–18. [Google Scholar] [CrossRef]
- Scholey, A.; Benson, S.; Kaufman, J.; Terpstra, C.; Ayre, E.; Verster, J.C.; Allen, C.; Devilly, G. Effects of alcohol hangover on cognitive performance: A field/internet mixed methodology approach. J. Clin. Med. 2019, 8, 440. [Google Scholar] [CrossRef]
- Fernstrand, A.M.; Bury, D.; Garssen, J.; Verster, J.C. Dietary intake of fibers: Differential effects in men and women on general health and perceived immune functioning. Food Nutr. Res. 2017, 61, 1297053. [Google Scholar] [CrossRef]
- Hogewoning, A.; van de Loo, A.J.A.E.; Mackus, M.; Raasveld, S.J.; de Zeeuw, R.; Bosma, E.R.; Bouwmeester, N.H.; Brookhuis, K.A.; Garssen, J.; Verster, J.C. Characteristics of social drinkers with and without a hangover after heavy alcohol consumption. Subst. Abuse Rehabil. 2016, 7, 161–167. [Google Scholar] [CrossRef]
- Eetmeter. Available online: https://mijn.voedingscentrum.nl/nl/eetmeter/ (accessed on 7 July 2019).
- List of Components in NEVO Online 2016. Available online: https://www.voedingswaardetabel.nl (accessed on 7 July 2019).
- Efron, B. Bootstrap methods: Another look at the jackknife. Ann. Stat. 1979, 7, 1–26. [Google Scholar] [CrossRef]
- Efron, B.; Tibshirani, R. An Introduction to the Bootstrap; Chapman & Hall/CRC: Boca Raton, FL, USA, 1993. [Google Scholar]
- Rahman, S.; Majumber, A.K. Use of Bootstrapping in Hypothesis Testing: Bootstrapping for Estimation and Hypothesis Testing; LAP LAMBERT Academic Publishing: Riga, Latvia, 2013. [Google Scholar]
- Sideridis, G.D.; Simos, P. What is the actual correlation between expressive and receptive measures of vocabulary? Approximating the sampling distribution of the correlation coefficient using the bootstrapping method. Int. J. Educ. Psychol. Assess. 2010, 5, 117–133. [Google Scholar]
- Efron, B. Better bootstrap confidence intervals. J. Am. Stat. Assoc. 1987, 82, 171–185. [Google Scholar] [CrossRef]
- Trumbo, P.; Yates, A.A.; Schlicker, S.; Poos, M. Dietary reference intakes: Vitamin, A. vitamin K, arsenic, boron, chromium, copper, iodine, iron, manganese, molybdenum, nickel, silicon, vanadium, and zinc. J. Am. Diet. Assoc. 2001, 101, 294–301. [Google Scholar] [CrossRef]
- Briefel, R.R.; Bialostosky, K.; Kennedy-Stephenson, J.; McDowell, M.A.; Ervin, R.B.; Wright, J.D. Zinc intake of the U.S. population: Findings from the third National Health and Nutrition Examination Survey, 1988–1994. J. Nutr. 2000, 130, 1367S–1373S. [Google Scholar] [CrossRef]
- Institute of Medicine (US) Standing Committee on the Scientific Evaluation of Dietary Reference Intakes and its Panel on Folate, Other B Vitamins, and Choline. Dietary Reference Intakes for Thiamin, Riboflavin, Niacin, Vitamin B6, Folate, Vitamin B12, Pantothenic Acid, Biotin, and Choline; National Academies Press: Washington, DC, USA, 1998. [Google Scholar]
- U.S. Food and Drug Administration. Food labelling: Revision of the nutrition and supplement facts labels. Fed. Regist. 2016, 81, 33741. [Google Scholar]
- Carpenter, K.J.; Lewin, W.J. A reexamination of the composition of diets associated with pellagra. J. Nutr. 1985, 115, 543–552. [Google Scholar] [CrossRef]
- Prousky, J.E. The Treatment of Alcoholism with Vitamin B3. J. Orthomol. Med. 2014, 29, 123–131. [Google Scholar]
- Mackus, M.; van Schrojenstein Lantman, M.; van de Loo, A.J.A.E.; Nutt, D.J.; Verster, J.C. An effective hangover treatment: Friend or foe? Drug Sci. Policy Law 2017. [Google Scholar] [CrossRef]
- Pittler, M.H.; Verster, J.C.; Ernst, E. Interventions for preventing or treating alcohol hangover: Systematic review of randomized trials. Br. Med. J. 2005, 331, 1515–1518. [Google Scholar] [CrossRef]
- Verster, J.C.; Penning, R. Treatment and prevention of alcohol hangover. Curr. Drug Abuse Rev. 2010, 3, 103–109. [Google Scholar] [CrossRef] [PubMed]
- Jayawardena, R.; Thejani, T.; Ranasinghe, P.; Fernando, D.; Verster, J.C. Interventions for treatment and/or prevention of alcohol hangover: Systematic review. Hum. Psychopharmacol. 2017, 32, e2600. [Google Scholar] [CrossRef] [PubMed]
- Lee, H.S.; Isse, T.; Kawamoto, T.; Baik, H.W.; Park, J.Y.; Yang, M. Effect of Korean pear (Pyruspyrifolia cv. Shingo) juice on hangover severity following alcohol consumption. Food Chem. Toxicol. 2013, 58, 101–106. [Google Scholar] [CrossRef] [PubMed]
- Lee, M.H.; Kwak, J.H.; Jeon, G.; Lee, J.W.; Seo, J.H.; Lee, H.S.; Lee, J.H. Red ginseng relieves the effects of alcohol consumption and hangover symptoms in healthy men: A randomized crossover study. Food Funct. 2014, 5, 528–534. [Google Scholar] [CrossRef] [PubMed]
- Pittler, M.H.; White, A.R.; Stevinson, C.; Ernst, E. Effectiveness of artichoke extract in preventing alcohol-induced hangovers: A randomized controlled trial. CMAJ 2003, 169, 1269–1273. [Google Scholar] [PubMed]
- Kelly, M.; Myrsten, A.-L.; Goldberg, L. Intravenous vitamins in acute intoxication: Effects on physiological and psychological functions. Br. J. Addict. 1971, 66, 19–30. [Google Scholar] [CrossRef]
- Kahn, M.A.; Jensen, K.; Krogh, H.J. Alcohol-induced hangover. A double-blind comparison of pyritinol and placebo in preventing hangover symptoms. Q. J. Stud. Alcohol 1973, 34, 1195–1201. [Google Scholar]
- Laas, I. A double-blind placebo-controlled study on the effects of Morning Fit on hangover symptoms after a high level of alcohol consumption in healthy volunteers. J. Clin. Res. 1999, 2, 9–15. [Google Scholar]
- Ylikahri, R.H.; Leino, T.; Huttunen, M.O.; Pösõ, A.R.; Eriksson, C.J.P.; Nikkilä, E.A. Effects of fructose and glucose on ethanol-induced metabolic changes and on the intensity of alcohol intoxication and hangover. Eur. J. Clin. Investig. 1976, 6, 93–102. [Google Scholar] [CrossRef]
- Bang, J.S.; Chung, Y.H.; Chung, S.J.; Lee, H.S.; Song, E.H.; Shin, Y.K.; Lee, Y.J.; Kim, H.C.; Nam, Y.; Jeong, J.H. Clinical effect of a polysaccharide-rich extract of Acanthopanax senticosus on alcohol hangover. Pharmazie 2015, 70, 269–273. [Google Scholar]
- Mackus, M.; Van de Loo, A.J.A.E.; Raasveld, S.J.; Hogewoning, A.; Sastre Toraño, J.; Flesch, F.M.; Korte-Bouws, G.A.H.; Van Neer, R.H.P.; Wang, X.; Nguyen, T.T.; et al. Biomarkers of the alcohol hangover state: Ethyl glucuronide (EtG) and ethyl sulfate (EtS). Hum. Psychopharmacol. 2017, 32, e2624. [Google Scholar] [CrossRef] [PubMed] [Green Version]
- Mackus, M.; van de Loo, A.J.A.E.; Korte-Bouws, G.A.H.; van Neer, R.H.P.; Wang, X.; Nguyen, T.T.; Brookhuis, K.A.; Garssen, J.; Verster, J.C. Urine methanol concentration and alcohol hangover severity. Alcohol 2017, 59, 37–41. [Google Scholar] [CrossRef] [PubMed]
- Van de Loo, A.J.A.E.; Knipping, K.; Mackus, M.; Kraneveld, A.D.; Garssen, J.; Scholey, A.; Bruce, G.; Verster, J.C. Differential effects on acute saliva cytokine response following alcohol consumption and alcohol hangover: Preliminary results from two independent studies. Alcohol. Clin. Exp. Res. 2018, 42 (Suppl. S2), 20A. [Google Scholar]
- Mackus, M.; van Schrojenstein Lantman, M.; van de Loo, A.J.A.E.; Brookhuis, K.A.; Kraneveld, A.D.; Garssen, J.; Verster, J.C. Alcohol metabolism in hangover sensitive versus hangover resistant social drinkers. Drug Alcohol Depend. 2018, 185, 351–355. [Google Scholar] [CrossRef] [PubMed]
- Van Schrojenstein Lantman, M.; van de Loo, A.J.A.E.; Mackus, M.; Brookhuis, K.A.; Kraneveld, A.D.; Garssen, J.; Verster, J.C. Susceptibility to alcohol hangovers: Not just a matter of being resilient. Alcohol Alcohol. 2018, 53, 241–244. [Google Scholar] [CrossRef] [PubMed]
- Van de Loo, A.J.A.E.; Mackus, M.; van Schrojenstein Lantman, M.; Kraneveld, A.D.; Garssen, J.; Scholey, A.; Verster, J.C. Susceptibility to alcohol hangovers: The association with self-reported immune status. Int. J. Environ. Res. Public Health 2018, 15, 1286. [Google Scholar] [CrossRef]
- Van Lawick van Pabst, A.E.; Devenney, L.E.; Verster, J.C. Sex differences in the presence and severity of alcohol hangover symptoms. J. Clin. Med. 2019, 8, 867. [Google Scholar] [CrossRef] [PubMed]
- Verster, J.C.; Roth, T. Gender differences in highway driving performance after administration of sleep medication: A review of the literature. Traffic Inj. Prev. 2012, 13, 286–292. [Google Scholar] [CrossRef] [PubMed]
- Leclercq, S.; Matamoros, S.; Cani, P.D.; Neyrinck, A.M.; Jamar, F.; Stärkel, P.; Windey, K.; Tremaroli, V.; Bäckhed, F.; Verbeke, K.; et al. Intestinal permeability, gut-bacterial dysbiosis, and behavioral markers of alcohol-dependence severity. Proc. Natl. Acad. Sci. USA 2014, 111, E4485–E4493. [Google Scholar] [CrossRef] [Green Version]
- Engen, P.A.; Green, S.J.; Voigt, R.M.; Forsyth, C.B.; Keshavarzian, A. The Gastrointestinal Microbiome: Alcohol Effects on the Composition of Intestinal Microbiota. Alcohol Res. 2015, 37, 223–236. [Google Scholar]
- Moritani, K.; Takeshita, T.; Shibata, Y.; Ninomiya, T.; Kiyohara, Y.; Yamashita, Y. Acetaldehyde production by major oral microbes. Oral Dis. 2015, 21, 748–754. [Google Scholar] [CrossRef] [PubMed]


| Nutrient | Control Day | Alcohol Day | p-Value | 2-Day Average |
|---|---|---|---|---|
| Nicotinic acid (mg) | 22.0 (17.1) | 34.8 (19.4) | 0.075 | 28.4 (14.9) |
| Zinc (mg) | 9.7 (3.4) | 12.6 (8.3) | 0.134 | 11.2 (5.3) |
| Total fat (g) | 83.6 (19.2) | 103.1 (47.6) | 0.221 | 93.4 (26.7) |
| Saturated fat (g) | 27.3 (10.2) | 35.5 (20.2) | 0.249 | 31.4 (11.6) |
| Carbohydrates (g) | 208.0 (57.8) | 330.3 (86.7) | 0.002 | 269.2 (62.2) |
| Proteins (g) | 91.6 (38.3) | 108.2 (69.0) | 0.650 | 99.9 (45.9) |
| Fibers (g) | 22.7 (7.5) | 26.2 (5.5) | 0.158 | 24.5 (4.8) |
| Salt (g) | 7.5 (3.0) | 10.1 (5.6) | 0.055 | 8.8 (3.8) |
| Alcohol (g) | 0 (0) | 128.2 (45.3) | 0.001 * | 64.1 (22.6) |
| Water (ml) | 942.7 (347.6) | 3165.2 (933.9) | 0.001 * | 2053.9 (533.8) |
| Sodium (mg) | 2989.3 (1121.5) | 3843.4 (1946.8) | 0.016 | 3416.3 (1396.2) |
| Potassium (mg) | 2987.1 (695.6) | 4228.5 (1287.1) | 0.003 | 3607.8 (901.2) |
| Calcium (mg) | 749.4 (356.7) | 863.2 (472.4) | 0.552 | 806.3 (285.3) |
| Magnesium (mg) | 301.6 (86.9) | 454.4 (168.3) | 0.003 | 378.0 (111.4) |
| Iron (mg) | 10.2 (2.2) | 11.7 (4.7) | 0.311 | 11.0 (2.9) |
| Selenium (mg) | 52.8 (30.4) | 60.8 (34.5) | 0.916 | 56.8 (26.4) |
| Iodine (mg) | 188.8 (51.4) | 187.1 (76.6) | 0.600 | 187.3 (52.6) |
| Phosphorus (mg) | 1464.3 (504.9) | 1622.2 (1134.5) | 0.701 | 1543.3 (693.4) |
| Vitamin A (mg) | 665.6 (640.6) | 769.3 (521.8) | 0.345 | 717.5 (451.8) |
| Vitamin B1 (mg) | 0.9 (0.2) | 1.2 (0.9) | 0.421 | 1.1 (0.5) |
| Vitamin B2 (mg) | 1.3 (0.5) | 1.8 (0.9) | 0.133 | 1.5 (0.5) |
| Vitamin B6 (mg) | 1.7 (0.9) | 2.7 (1.3) | 0.011 | 2.2 (0.9) |
| Vitamin B11 (mg) | 238.4 (100.8) | 349.4 (129.0) | 0.033 | 293.9 (86.3) |
| Vitamin B12 (mg) | 7.4 (12.4) | 4.3 (2.8) | 0.861 | 5.8 (6.0) |
| Vitamin C (mg) | 89.2 (52.6) | 97.1 (95.4) | 0.969 | 93.2 (65.4) |
| Vitamin D (mg) | 2.0 (1.9) | 3.1 (1.8) | 0.084 | 2.5 (1.4) |
| Vitamin E (mg) | 13.3 (5.7) | 14.4 (7.0) | 0.807 | 13.8 (4.7) |
| Energy (Kcal) | 2003.7 (406.8) | 3655.8 (1030.0) | 0.001 * | 2829.8 (621.1) |
| Original Sample | Bootstrapping Results | ||||||
|---|---|---|---|---|---|---|---|
| Nutrients | rP | p-Value | Bias | SE | rPB | Lower CIB Limit | Upper CIB Limit |
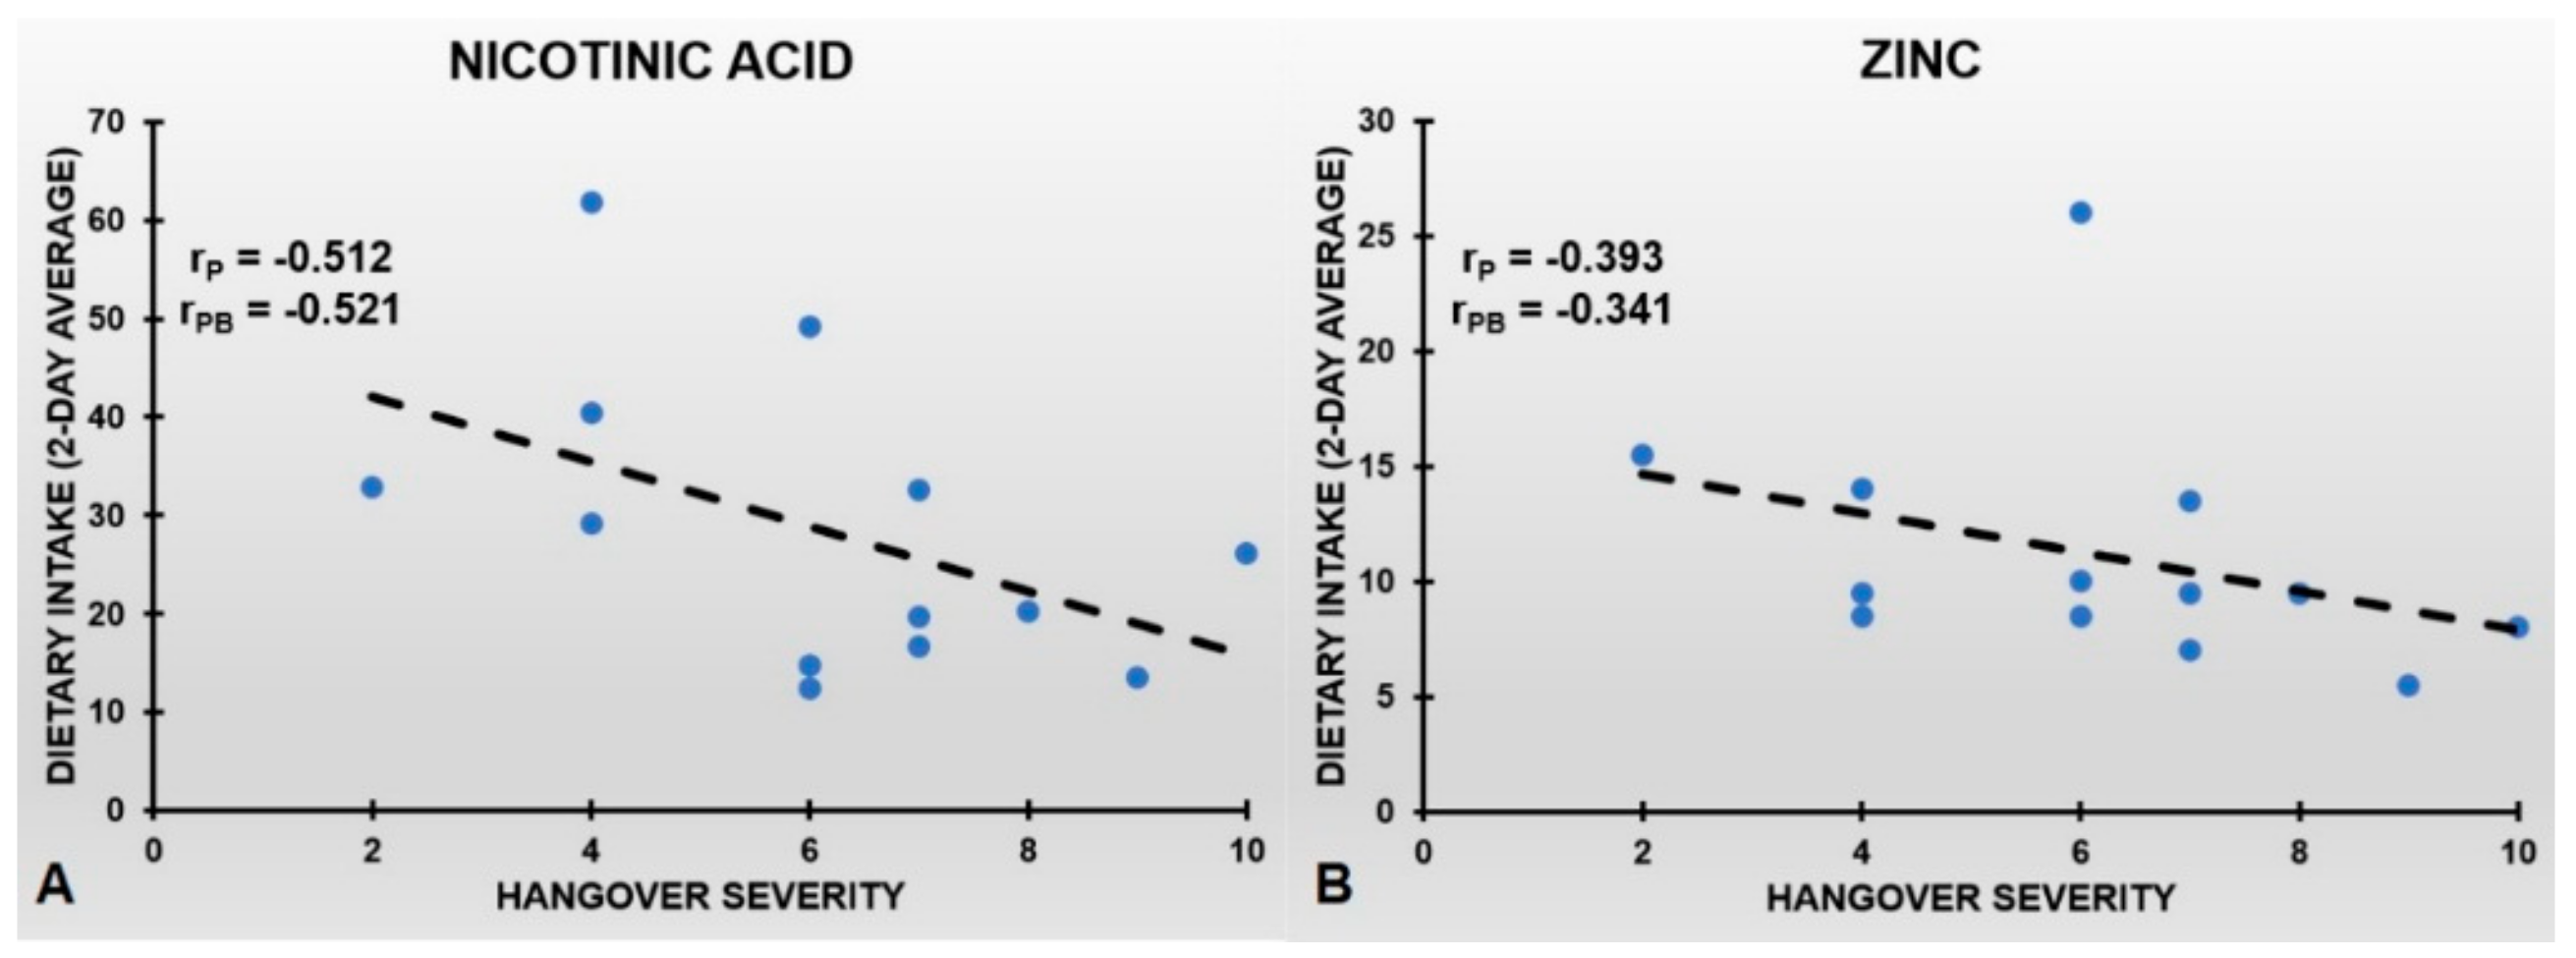
| Nicotinic acid * | −0.512 | 0.089 | 0.009 | 0.185 | −0.521 | −0.893 | −0.032 |
| Zinc * | −0.393 | 0.206 | −0.052 | 0.219 | −0.341 | −0.829 | −0.109 |
| Total fat | −0.014 | 0.967 | 0.018 | 0.338 | −0.032 | −0.993 | +0.998 |
| Saturated fat | 0.021 | 0.948 | −0.011 | 0.331 | −0.010 | −0.917 | +0.910 |
| Carbohydrates | −0.223 | 0.485 | −0.029 | 0.274 | −0.204 | −0.991 | +0.940 |
| Proteins | −0.285 | 0.370 | 0.000 | 0.269 | −0.285 | −0.997 | +0.939 |
| Fibers | −0.157 | 0.627 | 0.004 | 0.319 | −0.161 | −1.000 | +0.999 |
| Salt | −0.059 | 0.855 | −0.073 | 0.424 | −0.014 | −0.981 | +0.973 |
| Alcohol | 0.138 | 0.669 | −0.026 | 0.294 | 0.112 | −0.858 | +0.910 |
| Water | −0.103 | 0.749 | −0.037 | 0.277 | −0.066 | −0.880 | +0.764 |
| Sodium | −0.157 | 0.626 | −0.041 | 0.365 | −0.116 | −0.973 | +0.856 |
| Potassium | −0.409 | 0.187 | 0.004 | 0.266 | −0.413 | −0.985 | +0.846 |
| Calcium | −0.045 | 0.890 | 0.006 | 0.282 | −0.051 | −0.933 | +0.946 |
| Magnesium | −0.499 | 0.098 | 0.007 | 0.233 | −0.506 | −0.954 | +0.328 |
| Iron | −0.250 | 0.433 | 0.008 | 0.282 | −0.258 | −1.000 | +1.000 |
| Selenium | −0.356 | 0.256 | 0.017 | 0.292 | −0.373 | −0.971 | +0.912 |
| Iodine | −0.347 | 0.270 | 0.024 | 0.255 | −0.371 | −0.967 | +0.885 |
| Phosphorus | −0.355 | 0.258 | 0.034 | 0.247 | −0.389 | −1.000 | +0.872 |
| Vitamin A | 0.125 | 0.698 | 0.012 | 0.243 | 0.137 | −0.848 | +0.962 |
| Vitamin B1 | 0.019 | 0.952 | 0.017 | 0.272 | 0.036 | −0.883 | +0.874 |
| Vitamin B2 | −0.193 | 0.549 | 0.000 | 0.288 | −0.193 | −0.986 | +0.723 |
| Vitamin B6 | −0.407 | 0.189 | 0.000 | 0.293 | −0.407 | −0.994 | +0.950 |
| Vitamin B11 | −0.175 | 0.586 | −0.014 | 0.354 | −0.161 | −0.996 | +0.897 |
| Vitamin B12 | 0.096 | 0.768 | −0.046 | 0.279 | 0.050 | −0.875 | +0.697 |
| Vitamin C | 0.489 | 0.107 | −0.125 | 0.417 | 0.364 | −0.885 | +0.947 |
| Vitamin D | −0.146 | 0.651 | −0.023 | 0.341 | −0.123 | −0.976 | +0.956 |
| Vitamin E | 0.083 | 0.797 | −0.003 | 0.273 | 0.080 | −0.770 | +0.917 |
| Energy (Kcal) | −0.145 | 0.652 | −0.009 | 0.259 | −0.136 | −0.961 | +0.925 |
| Original Sample | Bootstrapping Results | ||||||
|---|---|---|---|---|---|---|---|
| Hangover Symptoms | rP | p-Value | Bias | SE | rPB | Lower CIB Limit | Upper CIB Limit |
| Concentration problems | −0.163 | 0.612 | 0.049 | 0.329 | −0.212 | −0.940 | +0.948 |
| Sleepiness | −0.248 | 0.437 | −0.022 | 0.386 | −0.226 | −0.985 | +0.885 |
| Being tired | −0.448 | 0.145 | 0.043 | 0.348 | −0.531 | −1.000 | +0.998 |
| Thirst | −0.157 | 0.625 | −0.013 | 0.255 | −0.144 | −0.897 | +0.634 |
| Nausea | −0.447 | 0.145 | 0.103 | 0.347 | −0.550 | −1.000 | +1.000 |
| Clumsiness | −0.272 | 0.392 | 0.029 | 0.302 | −0.301 | −0.975 | +0.942 |
| Reduced appetite | −0.181 | 0.573 | 0.080 | 0.360 | −0.261 | −1.000 | +0.998 |
| Headache | −0.561 | 0.058 | 0.049 | 0.234 | −0.610 | −0.987 | +0.911 |
| Weakness | −0.141 | 0.662 | 0.028 | 0.348 | −0.169 | −0.998 | +1.000 |
| Dizziness | −0.281 | 0.376 | 0.062 | 0.334 | −0.343 | −0.940 | +0.792 |
| Apathy | −0.303 | 0.339 | 0.120 | 0.419 | −0.423 | −0.987 | +0.994 |
| Stomach pain | −0.363 | 0.246 | 0.027 | 0.299 | −0.390 | −0.973 | +0.813 |
| Sensitivity to light | −0.352 | 0.262 | 0.082 | 0.345 | −0.434 | −0.985 | +0.919 |
| Sensitivity to sound | −0.406 | 0.190 | 0.064 | 0.349 | −0.470 | −1.000 | +0.865 |
| Shaking, shivering | −0.430 | 0.163 | 0.018 | 0.248 | −0.448 | −0.999 | +0.940 |
| Confusion | −0.204 | 0.524 | 0.047 | 0.334 | −0.251 | −0.999 | +0.987 |
| Depression | −0.335 | 0.287 | 0.061 | 0.354 | −0.396 | −0.982 | +0.961 |
| Regret | −0.324 | 0.304 | 0.078 | 0.365 | −0.402 | −0.994 | +0.998 |
| Heart pounding | −0.514 | 0.087 | 0.054 | 0.282 | −0.568 | −1.000 | +0.997 |
| Sweating | −0.347 | 0.268 | 0.071 | 0.366 | −0.418 | −0.994 | +0.973 |
| Vomiting | −0.506 | 0.093 | 0.016 | 0.235 | −0.522 | −0.999 | +0.985 |
| Heart racing | −0.439 | 0.154 | 0.066 | 0.325 | −0.505 | −1.000 | +0.980 |
| Anxiety | −0.379 | 0.224 | 0.059 | 0.346 | −0.438 | −0.977 | +0.842 |
| Original Sample | Bootstrapping Results | ||||||
|---|---|---|---|---|---|---|---|
| Hangover Symptoms | rP | p-Value | Bias | SE | rPB | Lower CIB Limit | Upper CIB Limit |
| Concentration problems | −0.128 | 0.691 | −0.007 | 0.314 | −0.121 | −0.854 | +0.887 |
| Sleepiness | −0.055 | 0.865 | −0.072 | 0.326 | 0.023 | −0.855 | +0.741 |
| Being tired | −0.195 | 0.544 | −0.020 | 0.305 | −0.175 | −0.979 | +0.933 |
| Thirst | −0.045 | 0.888 | 0.000 | 0.224 | −0.045 | −0.816 | +0.659 |
| Nausea | −0.077 | 0.813 | −0.050 | 0.370 | −0.027 | −0.904 | +0.806 |
| Clumsiness | −0.209 | 0.514 | −0.054 | 0.275 | −0.155 | −0.910 | +0.703 |
| Reduced appetite | 0.105 | 0.745 | −0.048 | 0.404 | 0.057 | −0.956 | +0.939 |
| Headache | −0.260 | 0.414 | −0.022 | 0.241 | −0.238 | −0.882 | +0.611 |
| Weakness | −0.002 | 0.995 | −0.128 | 0.473 | 0.126 | −0.963 | +0.932 |
| Dizziness | −0.005 | 0.988 | −0.052 | 0.403 | 0.047 | −0.952 | +0.933 |
| Apathy | 0.060 | 0.853 | −0.019 | 0.373 | 0.041 | −0.972 | +0.965 |
| Stomach pain | −0.117 | 0.718 | −0.103 | 0.389 | −0.014 | −0.978 | +0.765 |
| Sensitivity to light | −0.138 | 0.669 | −0.031 | 0.292 | −0.107 | −0.845 | +0.674 |
| Sensitivity to sound | −0.157 | 0.627 | −0.047 | 0.298 | −0.110 | −0.851 | +0.699 |
| Shaking, shivering | −0.370 | 0.236 | −0.076 | 0.290 | −0.294 | −0.958 | +0.492 |
| Confusion | −0.113 | 0.726 | −0.071 | 0.390 | −0.042 | −0.961 | +0.982 |
| Depression | −0.160 | 0.618 | −0.085 | 0.425 | −0.075 | −0.960 | +0.984 |
| Regret | −0.150 | 0.641 | −0.061 | 0.431 | −0.089 | −0.980 | +0.987 |
| Heart pounding | −0.298 | 0.347 | −0.067 | 0.384 | −0.231 | −0.995 | +0.952 |
| Sweating | −0.136 | 0.674 | −0.061 | 0.479 | −0.075 | −0.964 | +0.972 |
| Vomiting * | −0.609 | 0.035 | −0.032 | 0.179 | −0.577 | −0.944 | −0.059 |
| Heart racing | −0.211 | 0.511 | −0.076 | 0.411 | −0.135 | −0.976 | +0.962 |
| Anxiety | −0.214 | 0.505 | −0.065 | 0.466 | −0.149 | −0.990 | +0.993 |
© 2019 by the authors. Licensee MDPI, Basel, Switzerland. This article is an open access article distributed under the terms and conditions of the Creative Commons Attribution (CC BY) license (http://creativecommons.org/licenses/by/4.0/).
Share and Cite
Verster, J.C.; Vermeulen, S.A.; van de Loo, A.J.A.E.; Balikji, S.; Kraneveld, A.D.; Garssen, J.; Scholey, A. Dietary Nutrient Intake, Alcohol Metabolism, and Hangover Severity. J. Clin. Med. 2019, 8, 1316. https://doi.org/10.3390/jcm8091316
Verster JC, Vermeulen SA, van de Loo AJAE, Balikji S, Kraneveld AD, Garssen J, Scholey A. Dietary Nutrient Intake, Alcohol Metabolism, and Hangover Severity. Journal of Clinical Medicine. 2019; 8(9):1316. https://doi.org/10.3390/jcm8091316
Chicago/Turabian StyleVerster, Joris C., Sterre A. Vermeulen, Aurora J. A. E. van de Loo, Stephanie Balikji, Aletta D. Kraneveld, Johan Garssen, and Andrew Scholey. 2019. "Dietary Nutrient Intake, Alcohol Metabolism, and Hangover Severity" Journal of Clinical Medicine 8, no. 9: 1316. https://doi.org/10.3390/jcm8091316