
The Lrat−/− Rat: CRISPR/Cas9 Construction and Phenotyping of a New Animal Model for Retinitis Pigmentosa

 , , ,
, , , 
Abstract
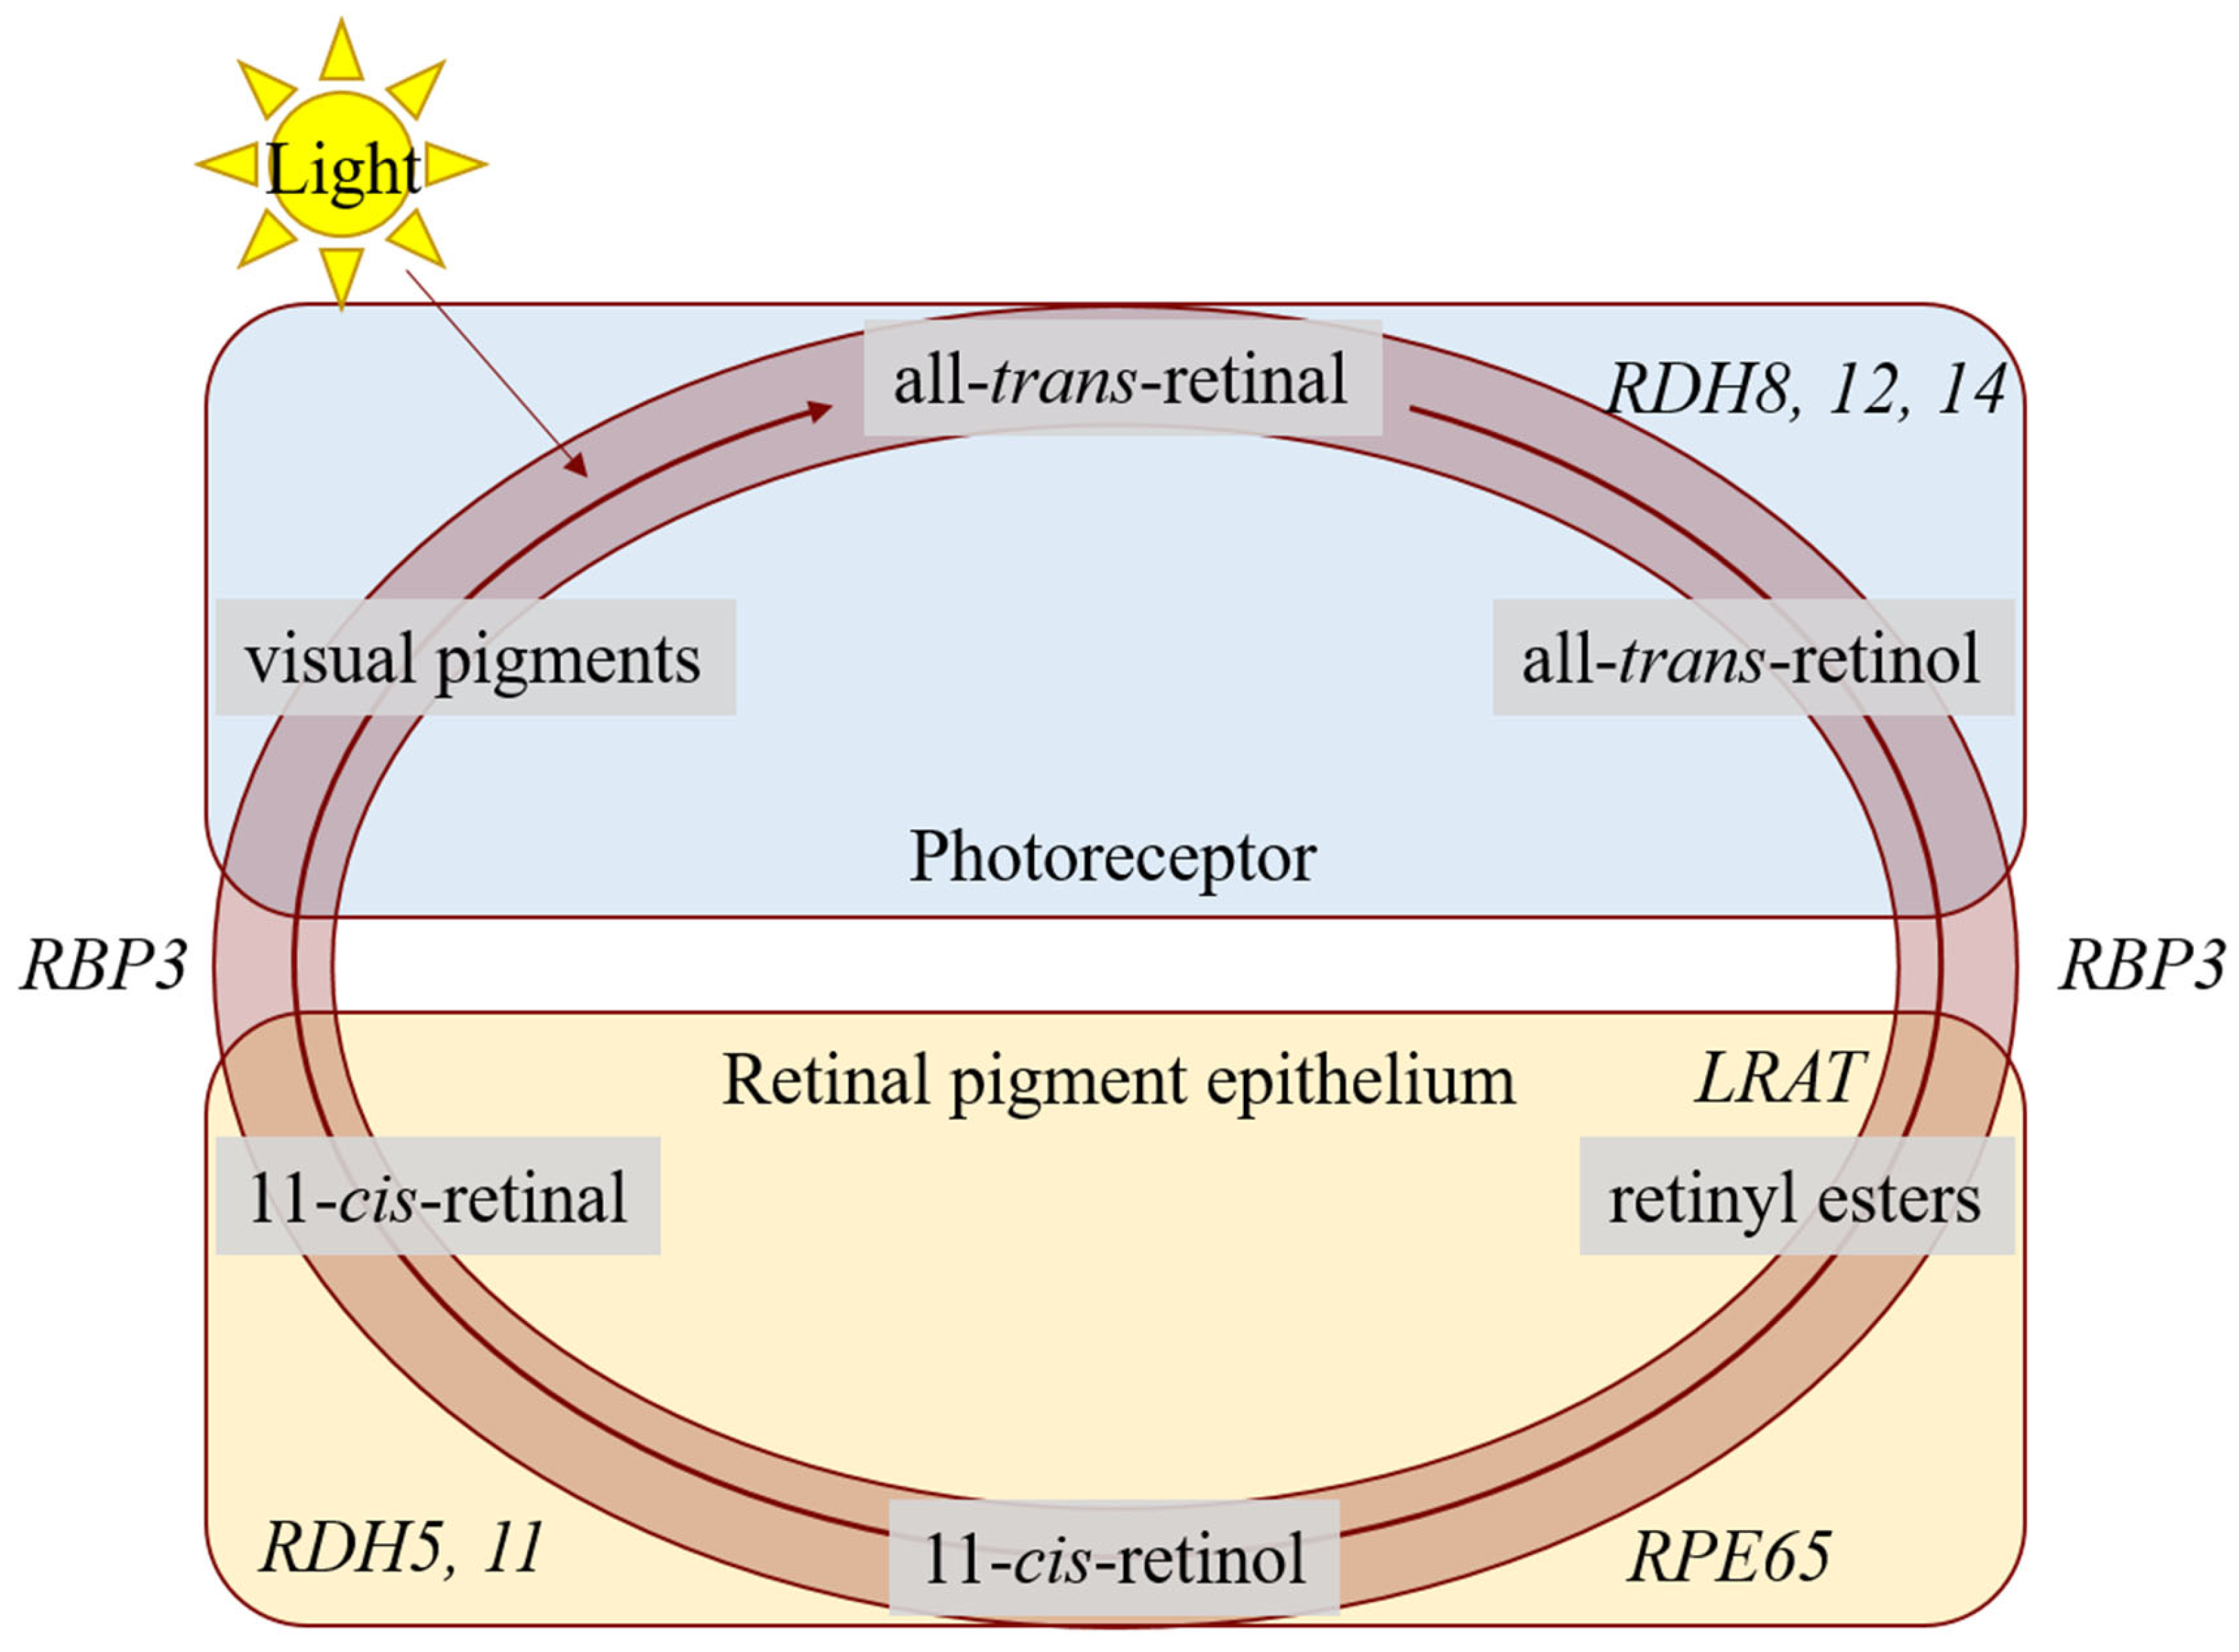
:1. Introduction
2. Results
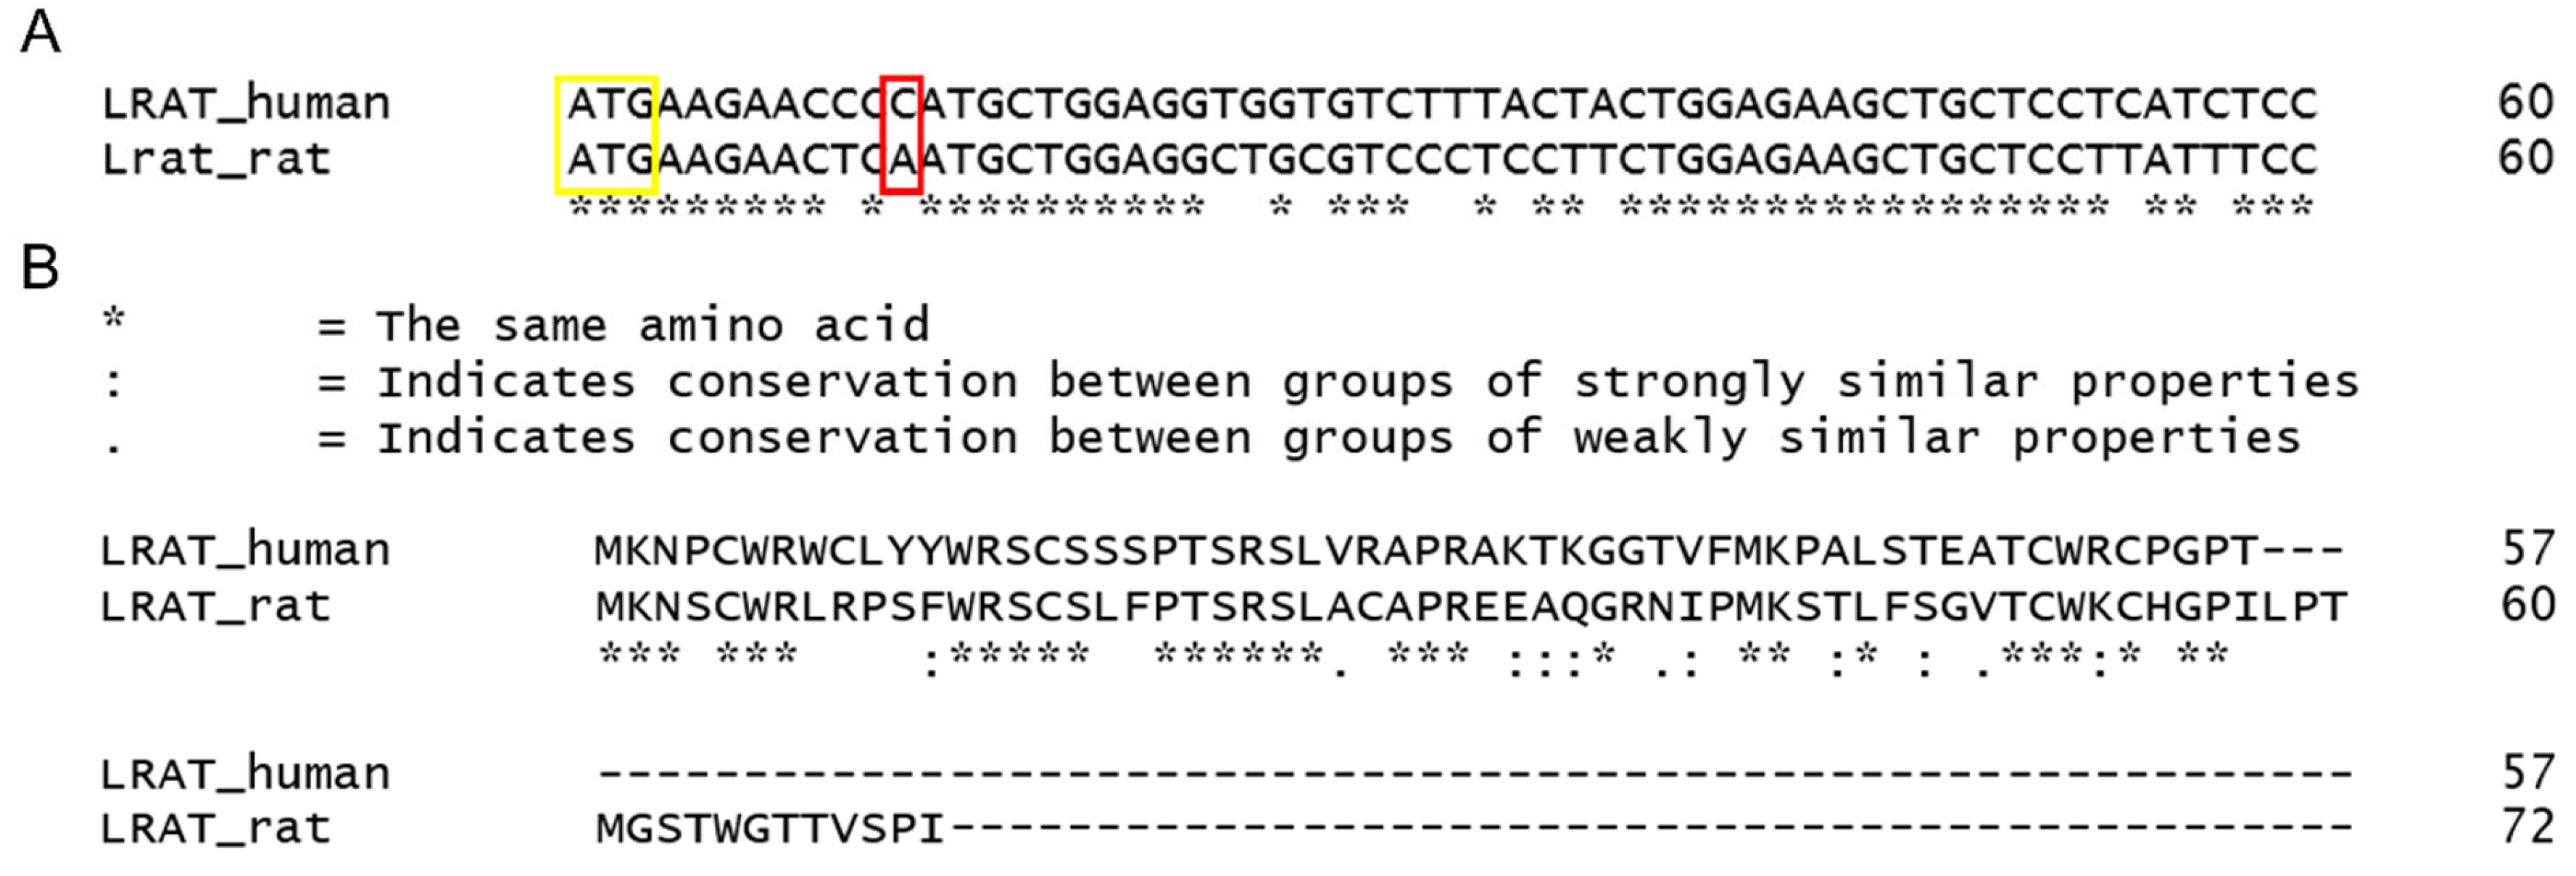
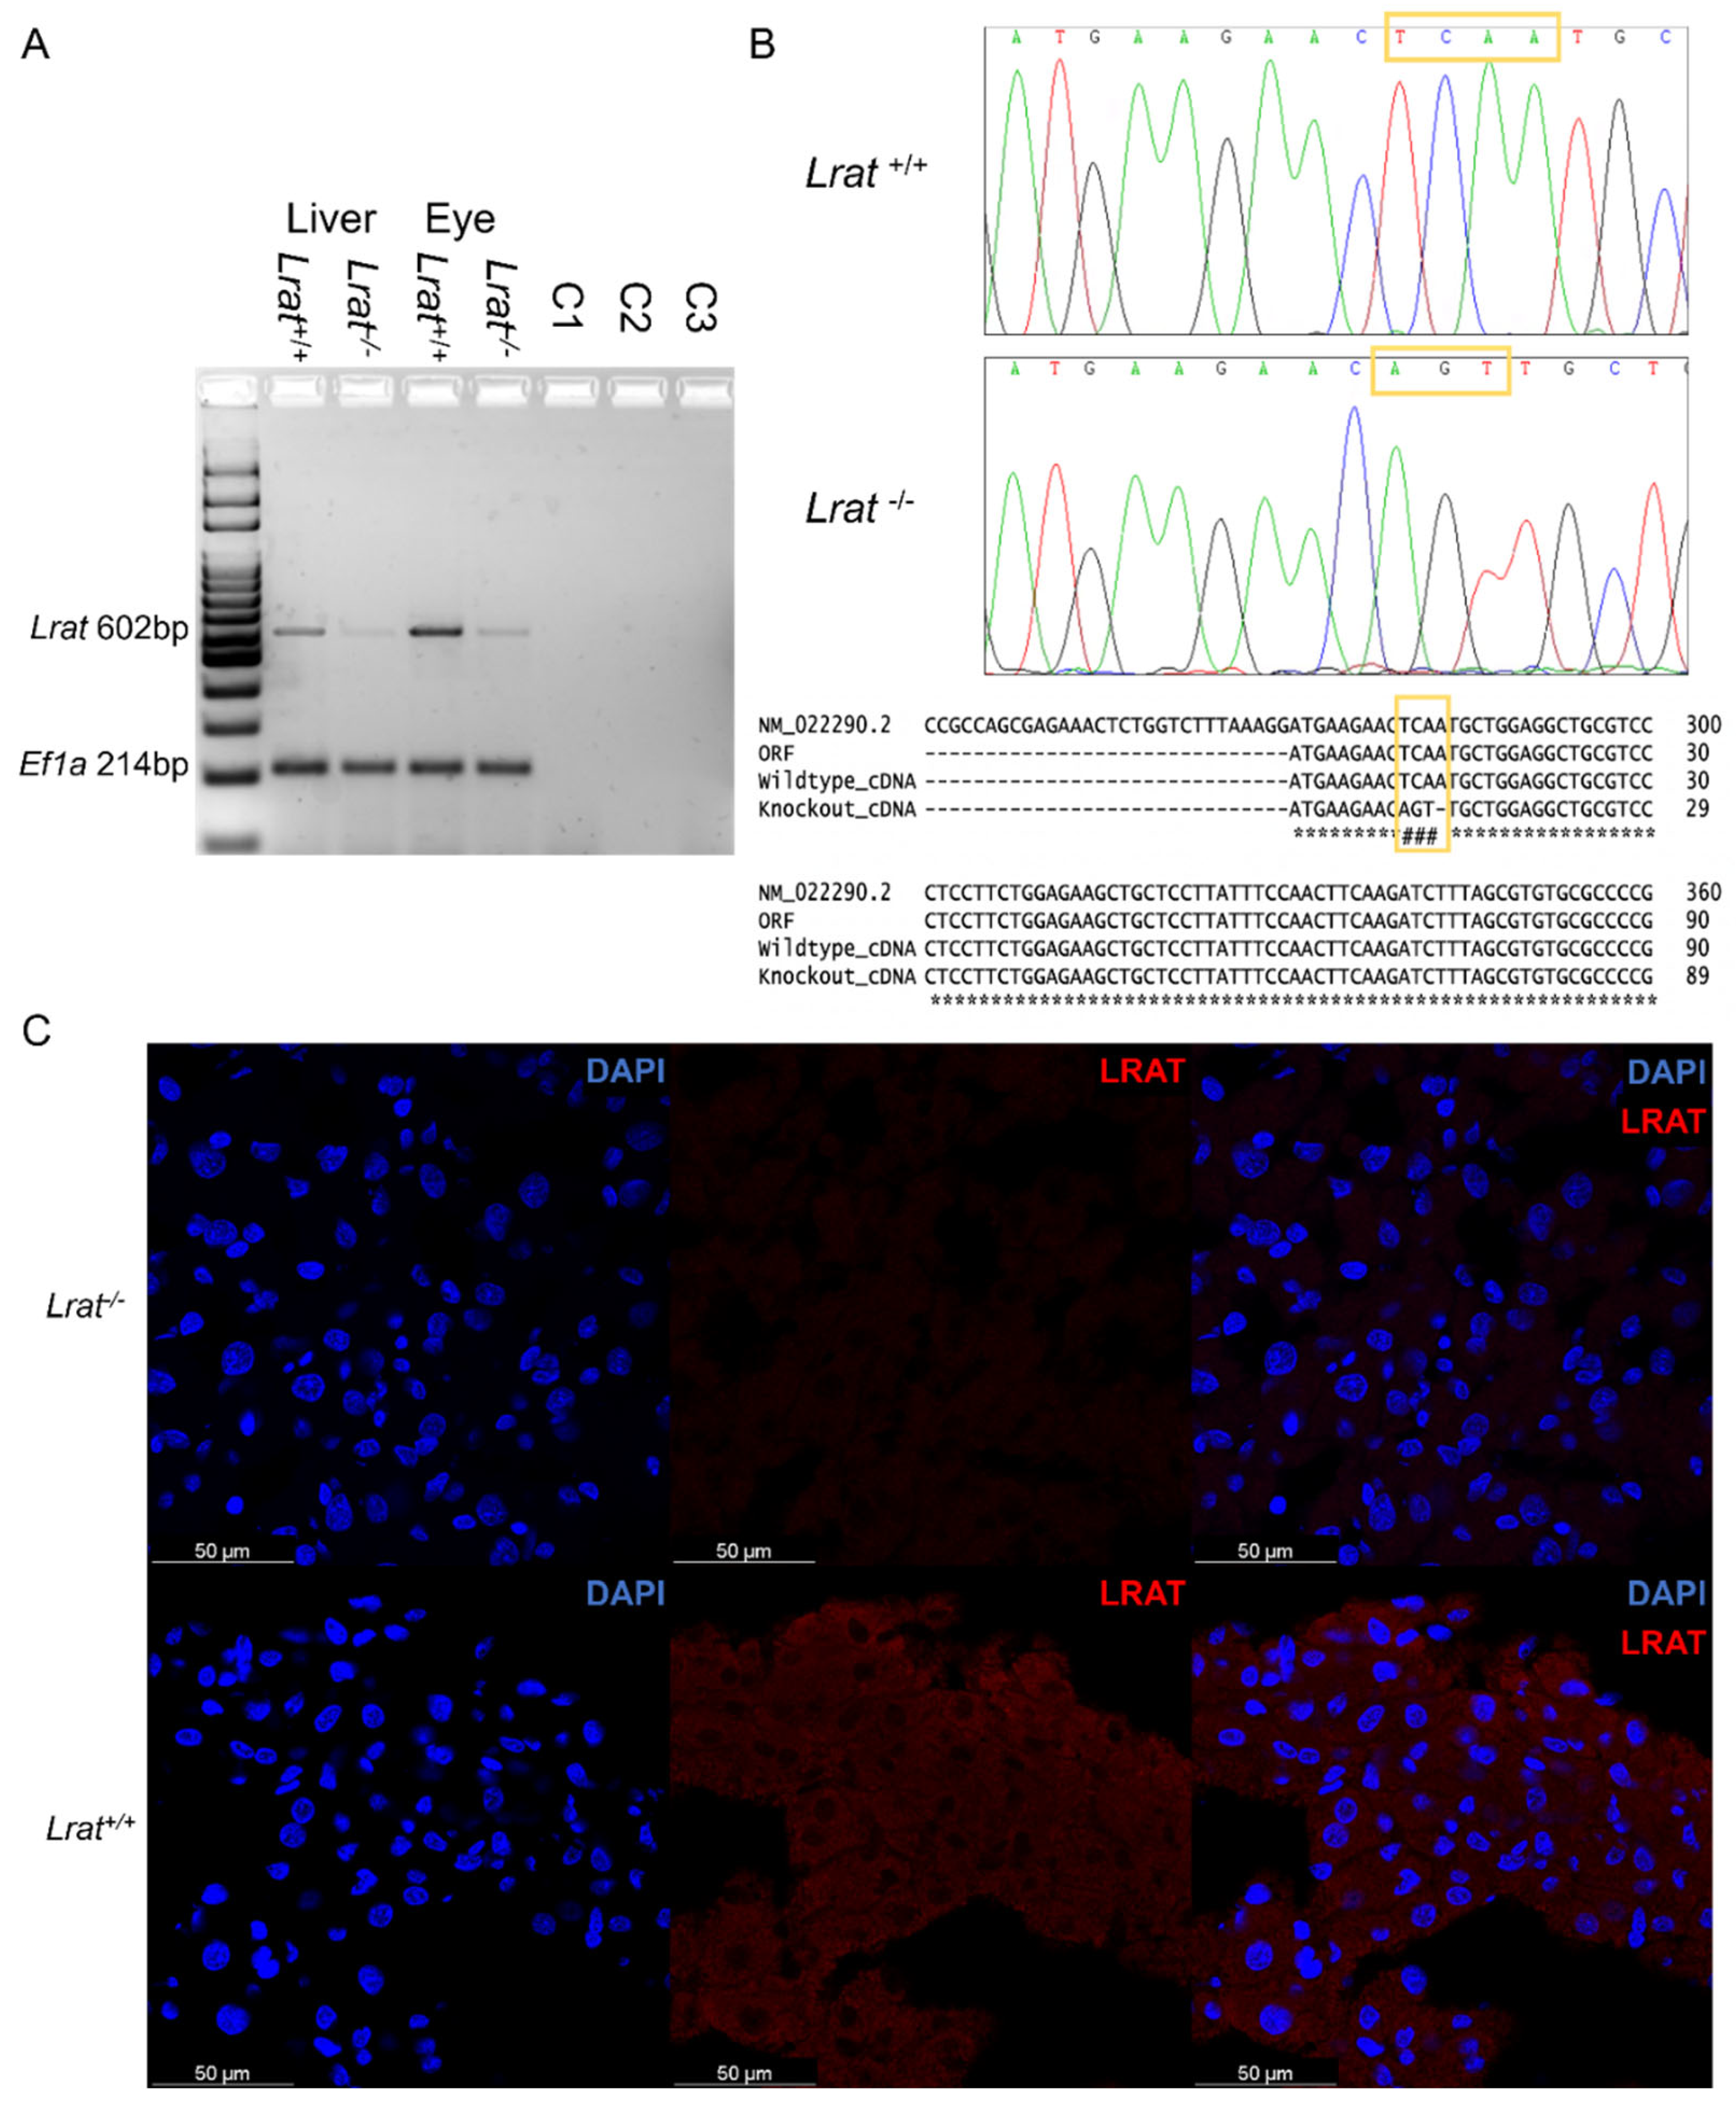
2.1. Generation of Lrat Knockout (KO) Rats
2.2. Lrat Gene and Protein Expression in Rat Tissues of Wildtype, Heterozygous, and Lrat Knockout (KO) Rats
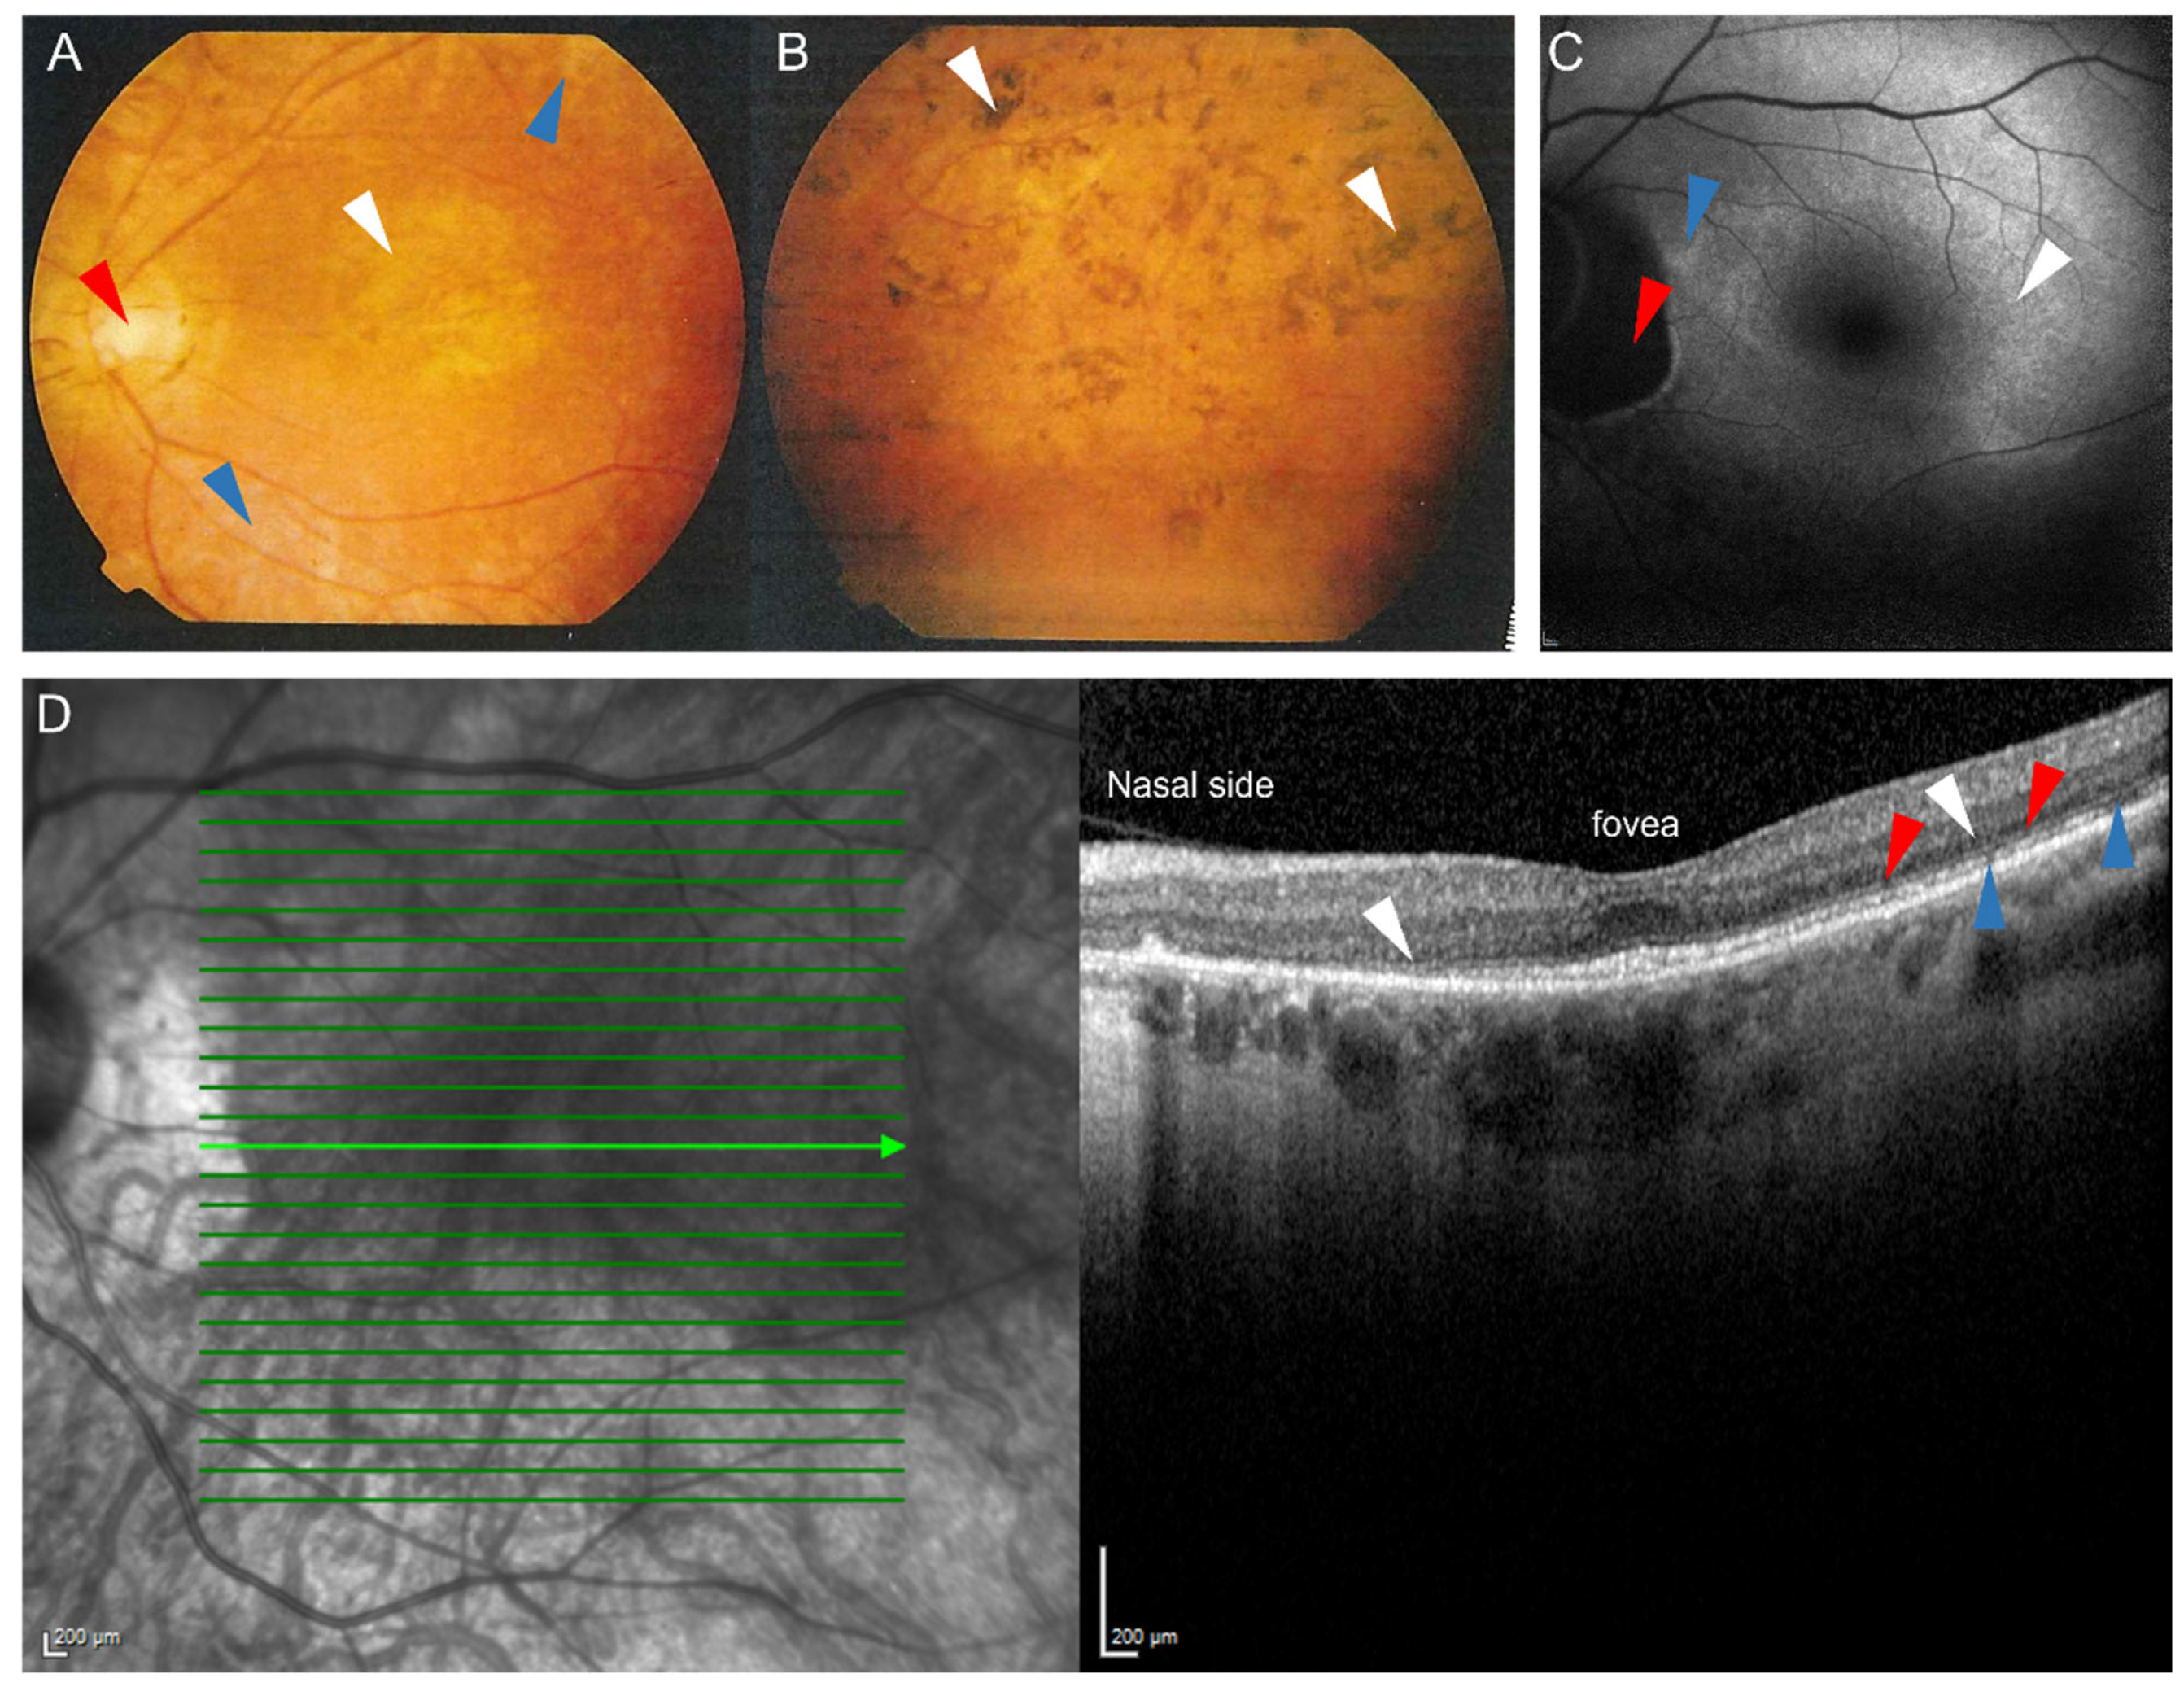
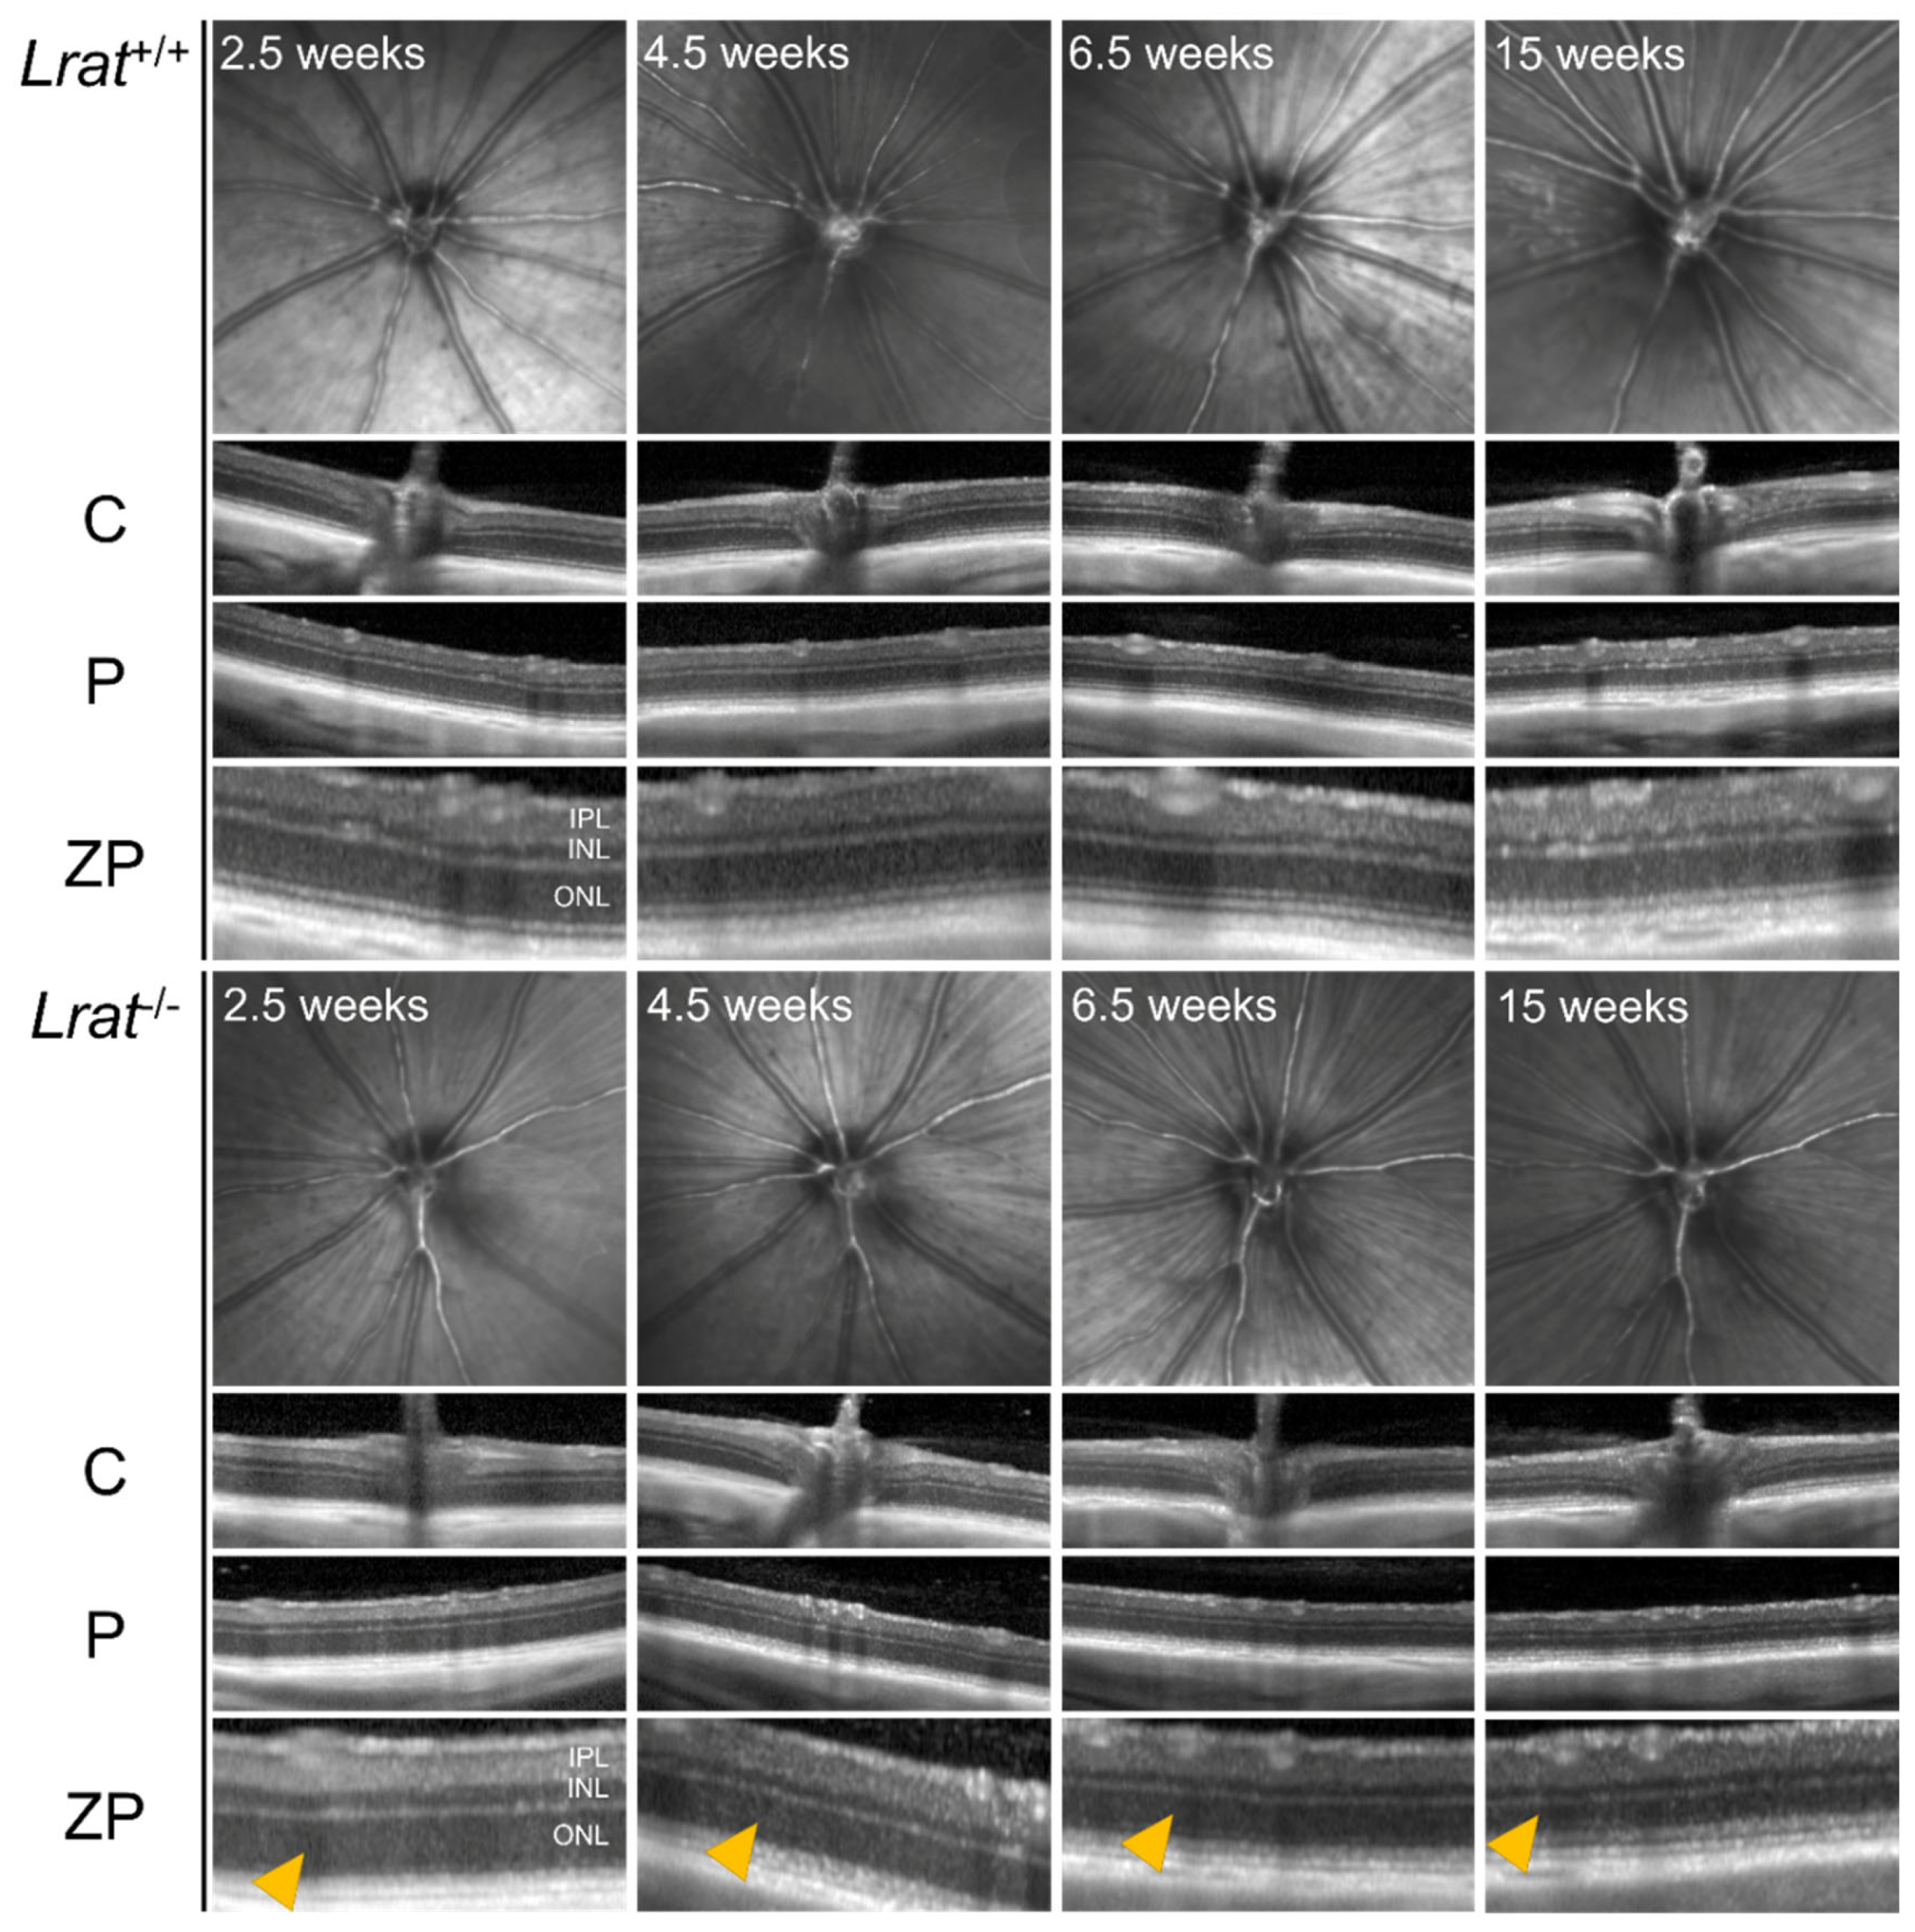
2.3. In Vivo Imaging of Retinal Structures Using Non-Invasive Scanning Laser Ophthalmoscopy (SLO) and Optical Coherence Tomography (OCT)
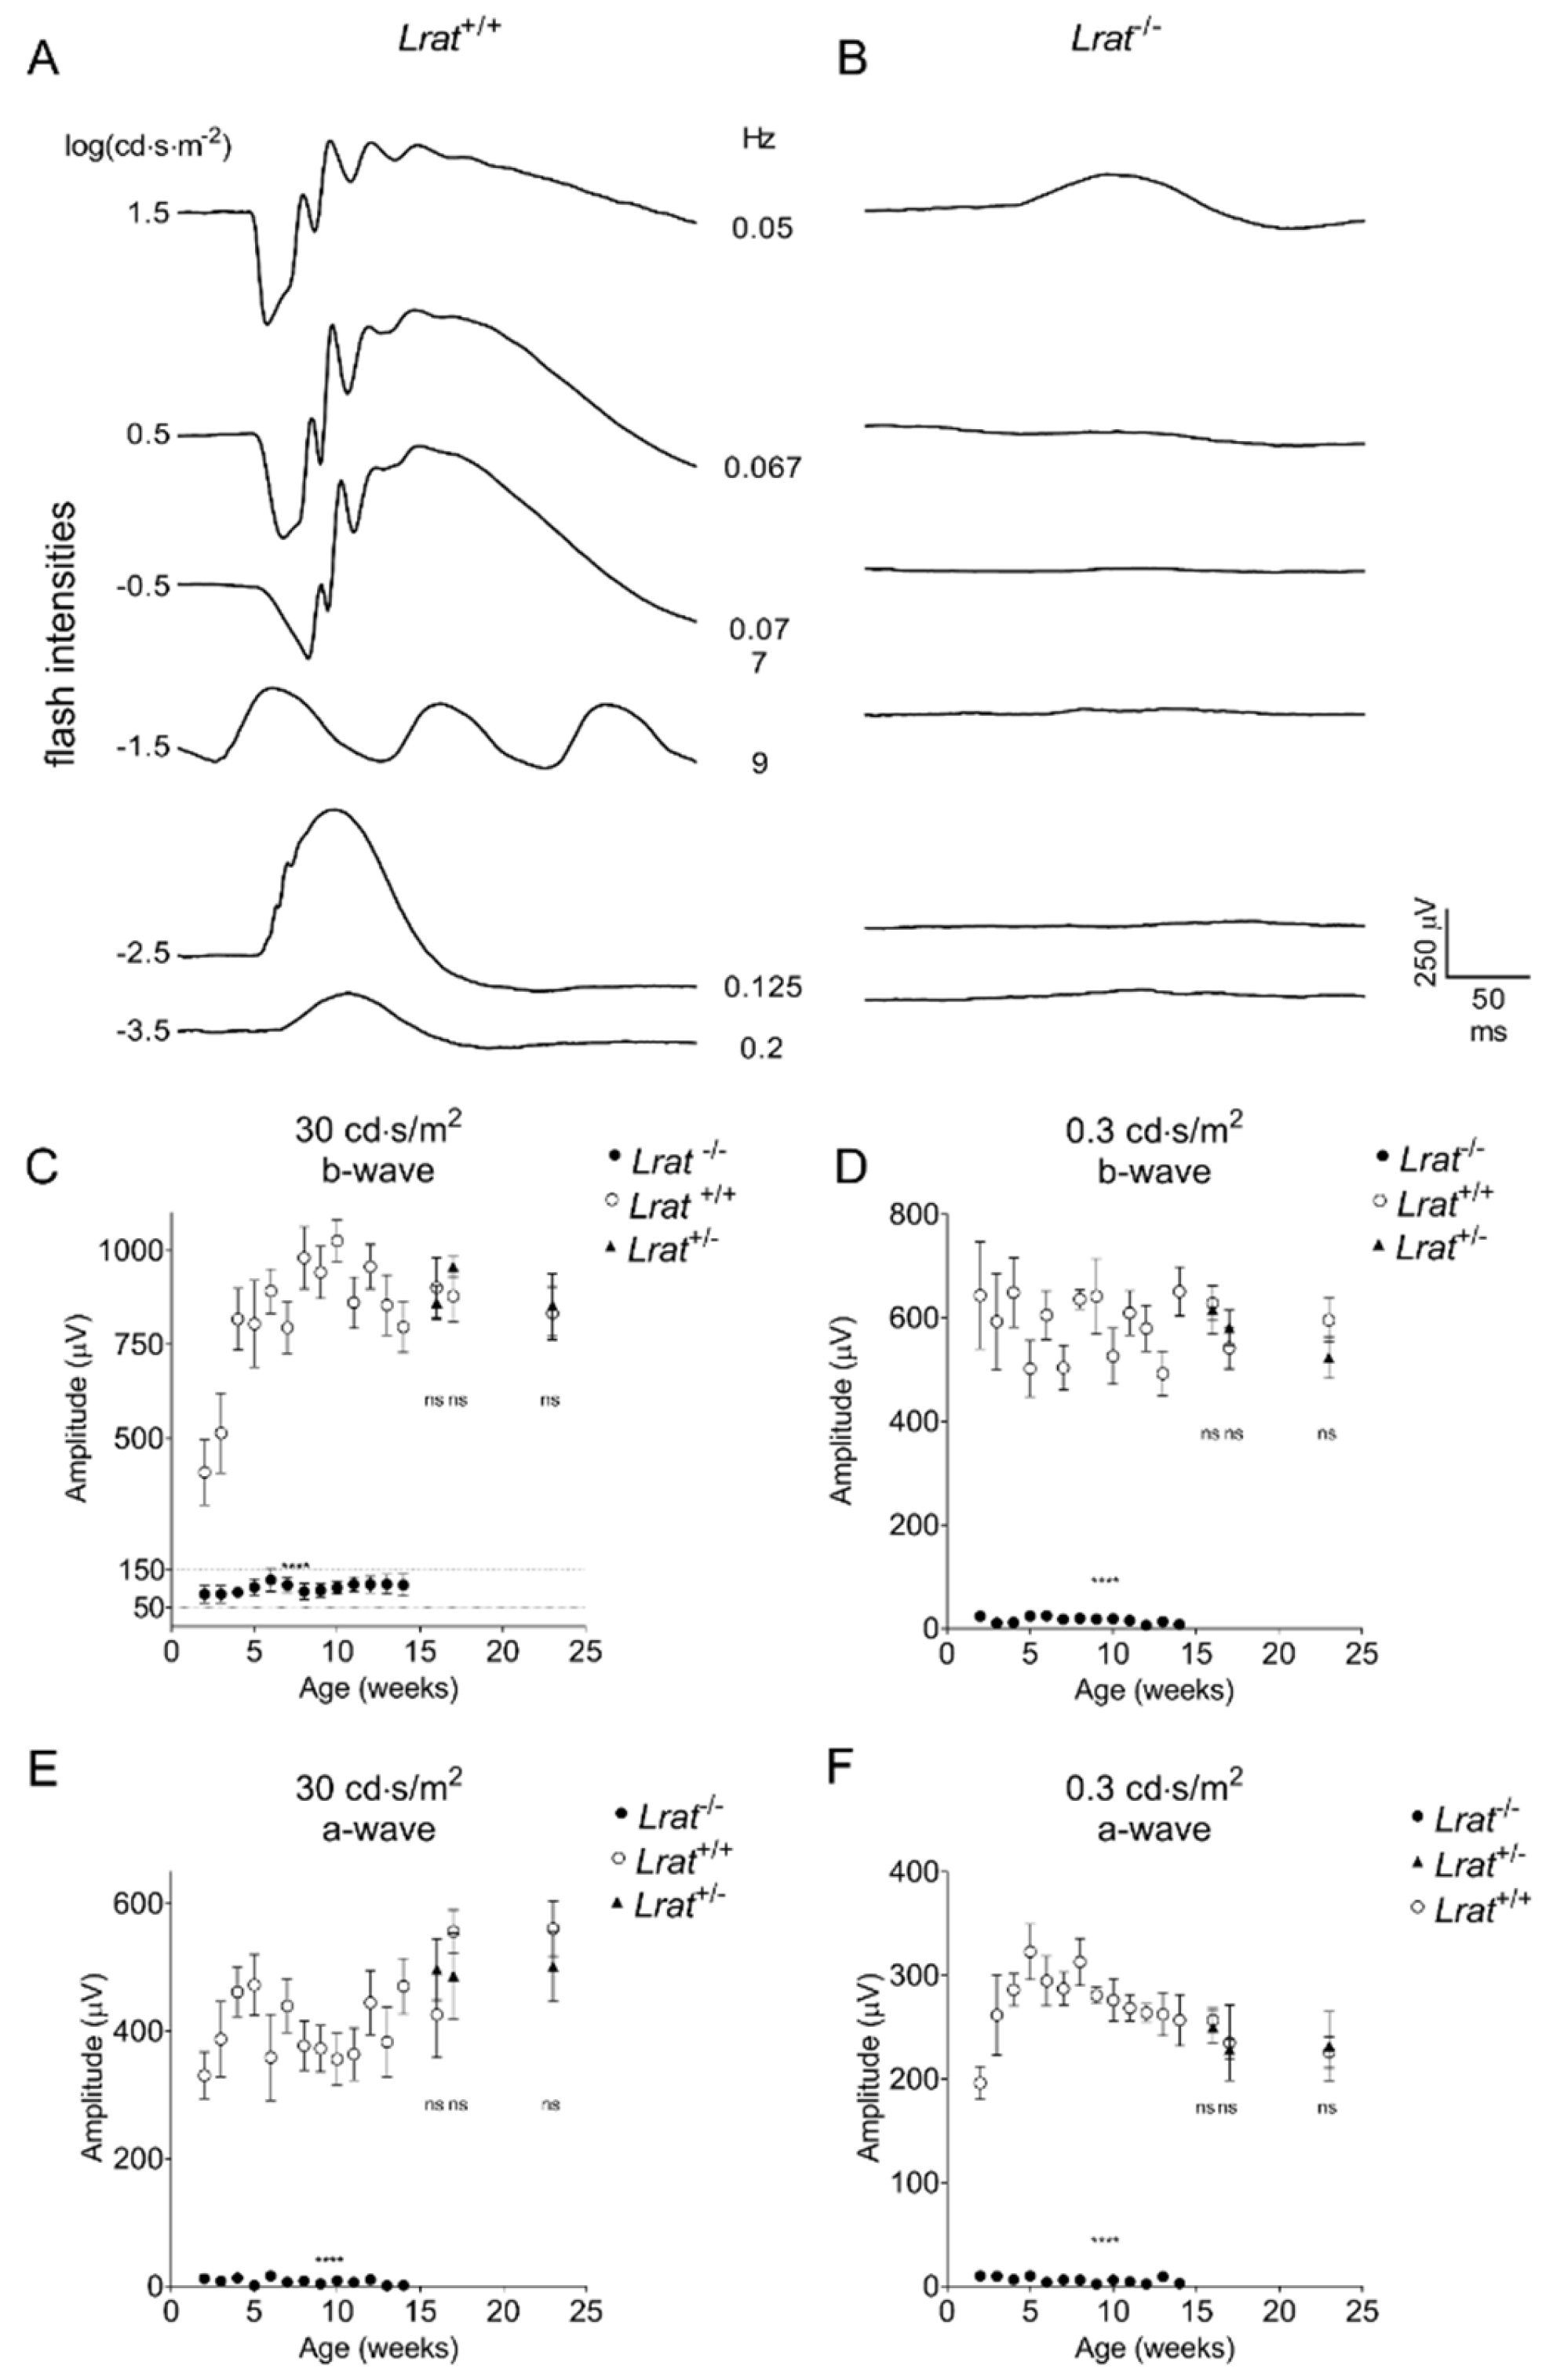
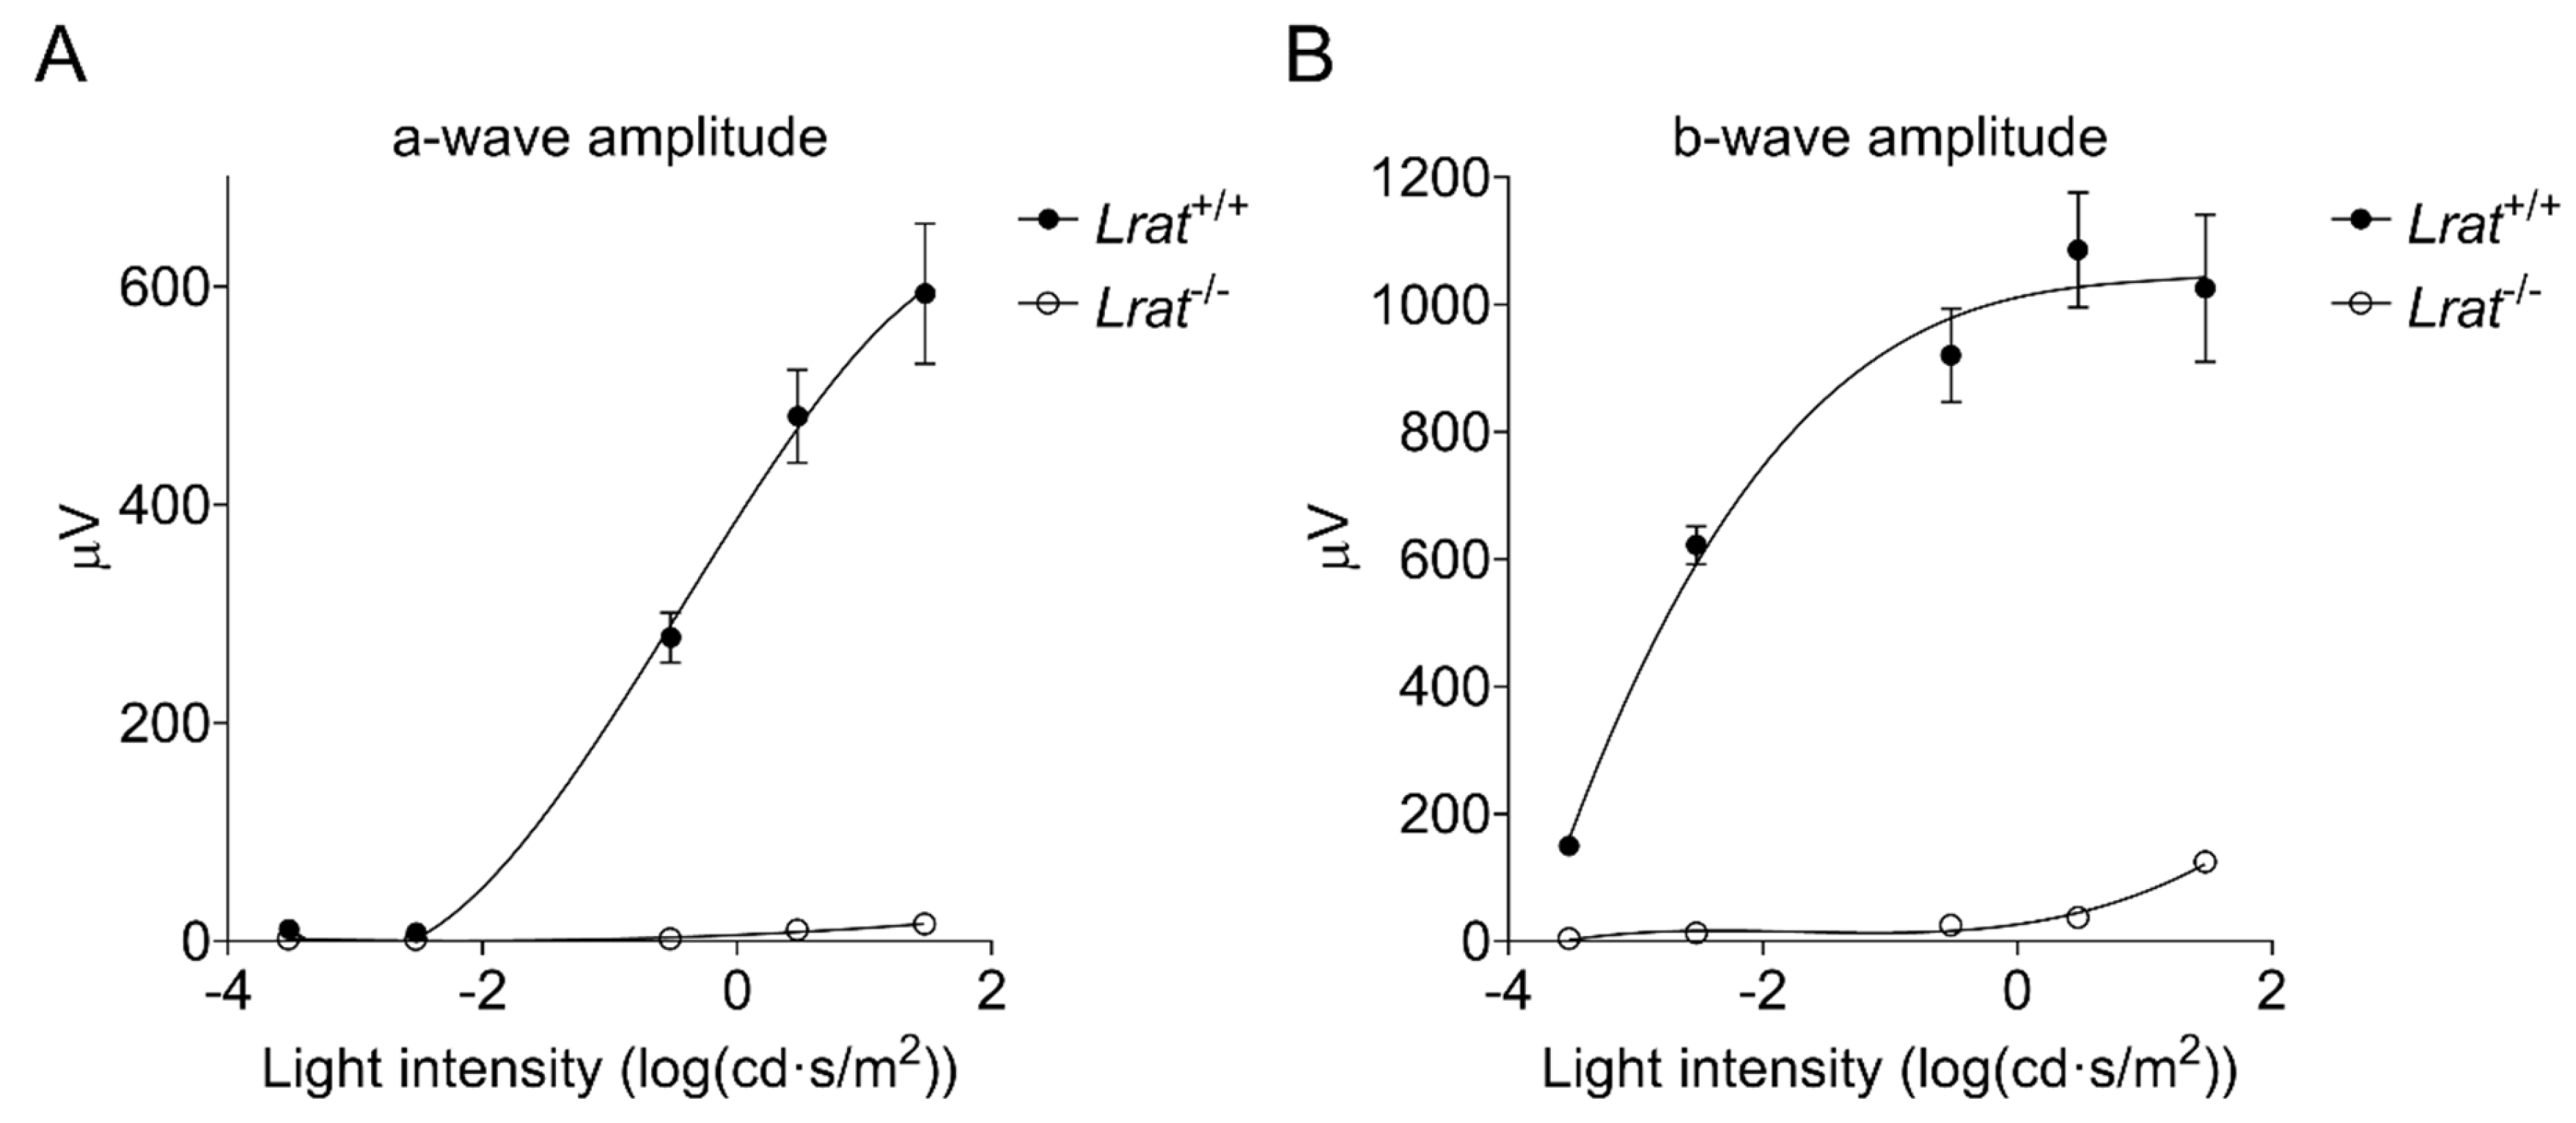
2.4. In Vivo Assessment of the Retinal Function Using Electroretinography (ERG)
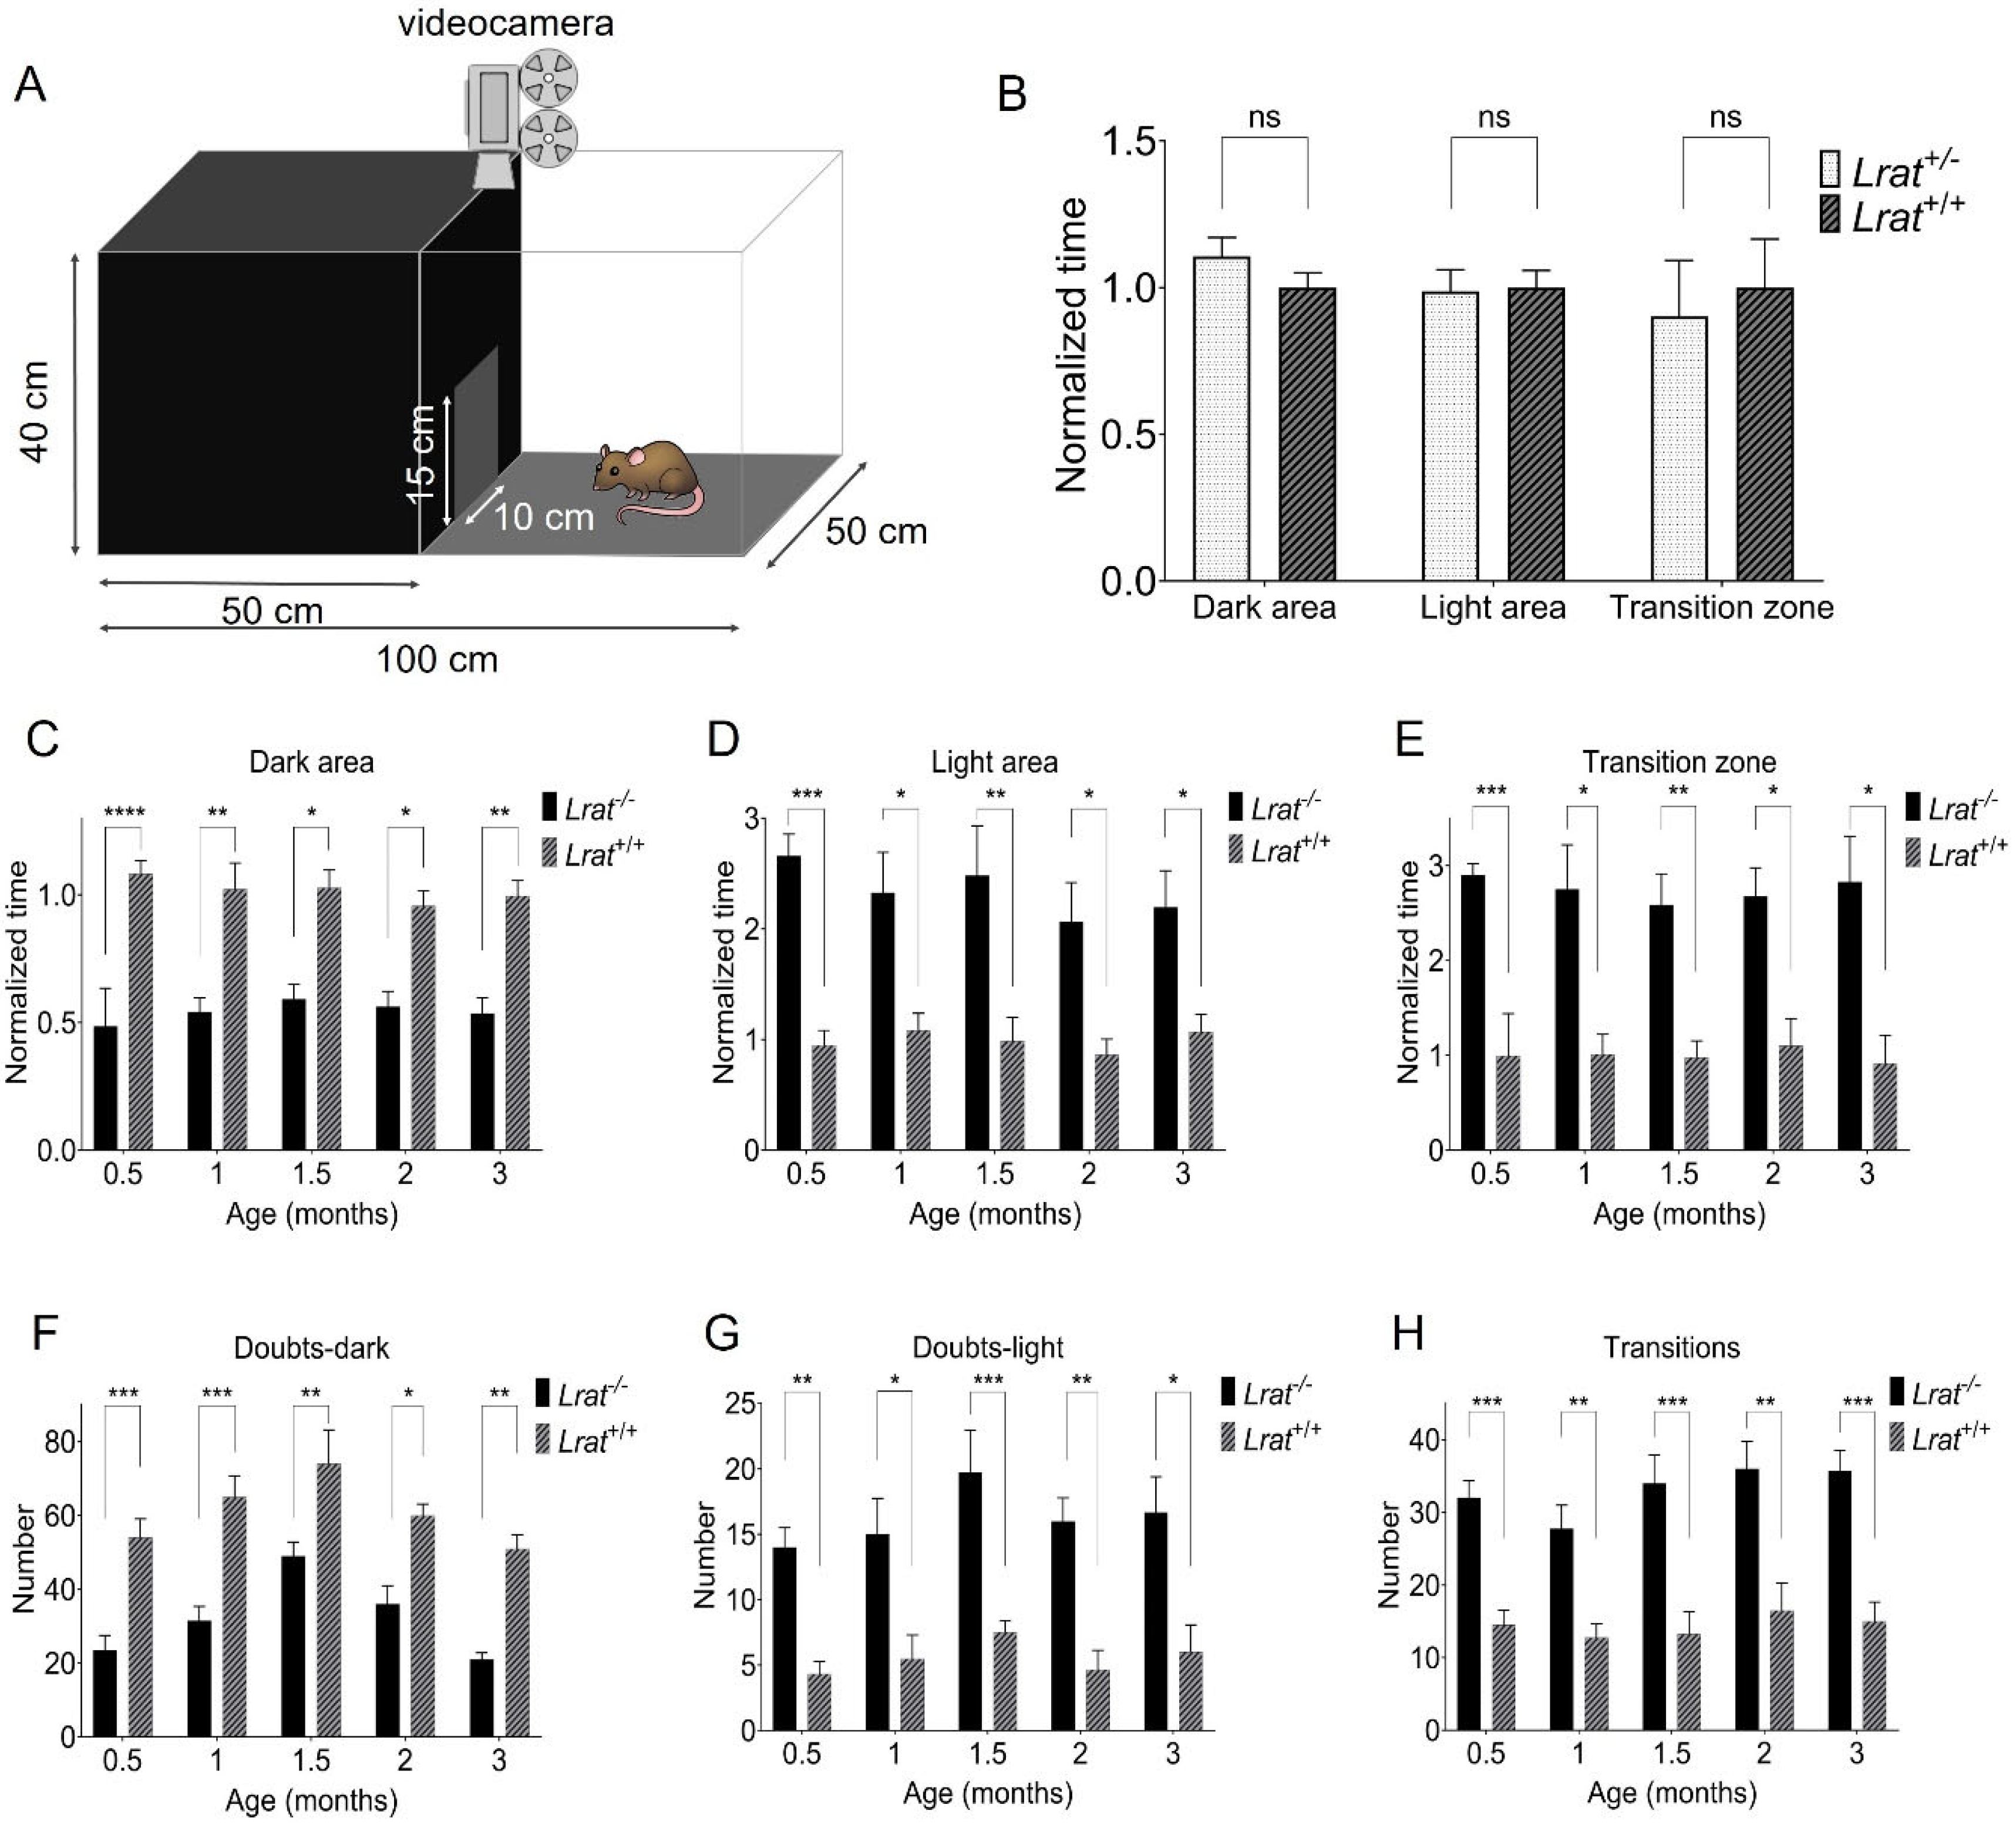
2.5. Vision-Based Behavioral Analysis
3. Discussion
4. Methods
4.1. Construction of the Animal Model
4.2. Mutation Analysis and Expression of the Lrat Gene
4.3. LRAT Detection Using Immunofluorescence
4.4. The Experimental Set-Up, Randomization, Blinding, and Drop-Outs
4.5. Scanning Laser Ophthalmoscopy (SLO) and Optical Coherence Tomography (OCT) Measurements
4.6. Electroretinography (ERG)
4.7. Light/Dark-Box Behavioral Assay
4.8. Statistical Analyses Performed
Supplementary Materials
Author Contributions
Funding
Institutional Review Board Statement
Informed Consent Statement
Data Availability Statement
Acknowledgments
Conflicts of Interest
Abbreviations
| LRAT | Lecithin:retinol acetyltransferase |
| AAV | Adeno-associated virus |
| ANOVA | Analysis of variance |
| BSA | Bovine Serum Albumin |
| c.12delA | Deletion of coding nucleotide 12 adenosine |
| c.12delC | Deletion of coding nucleotide 12 cytosine |
| cDNA | Complementary DNA |
| CRISPR/Cas9 | Clustered Regularly Interspaced Short Palindromic Repeats/CRISPR associated protein 9 |
| DAPI | 4’,6-Diamidino-2-Phenylindole |
| DNA | Deoxyribonucleic acid |
| EF1A | Elongation factor 1-alpha |
| ERG | Electroretinography |
| Faster R-CNN | Faster recursive convolutional neural networks |
| gRNA | Guide RNA |
| INL | Inner nuclear layer |
| IPL | Inner plexiform layer |
| KO | Knockout |
| LCA | Leber Congenital Amaurosis |
| Mertk | Proto-oncogene tyrosine-protein kinase MER |
| mRNA | messenger RNA |
| O.C.T. | Optimal cutting temperature |
| OCT | Optical coherence tomography |
| ONL | Outer nuclear layer |
| OP | Oscillatory potentials |
| ORF | Open reading frame |
| p.M5CfsX53 | Frameshift from aminoacid 5 onwards (methionine) resulting in a premature stopcodon 53 aminoacids downstream |
| p.M5CfsX72 | Frameshift from aminoacid 5 onwards (methionine) resulting in a premature stopcodon 72 aminoacids downstream |
| PBS | Phosphate-buffered saline |
| PCR | Polymerase chain reaction |
| PFA | Paraformaldehyde |
| PR | Photoreceptor |
| QLT091001 | 9-cis-retinyl acetate |
| RBP3 | Retinoid-binding protein |
| RCS | Royal College of Surgeons |
| RD | Retinal degeneration |
| RDH | Retinol dehydrogenase |
| RNA | Ribonucleic acid |
| RP | Retinitis Pigmentosa |
| RPA | Retinitis Punctata Albescens |
| RPE | Retinal pigment epithelium |
| RPE65 | Retinal pigment epithelium-specific protein 65 kDa |
| RT | Room temperature |
| RT-PCR | Reverse transcriptase—polymerase chain reaction |
| SD-OCT | Spectral domain optical coherence tomography |
| Ser | Serine |
| sgRNA | Single guide RNA |
| SLO | Scanning laser ophthalmoscopy |
| ssODN | Single-stranded oligonucleotide |
| UTR | Untranslated region |
References
- Chelstowska, S.; Widjaja-Adhi, M.A.K.; Silvaroli, J.A.; Golczak, M. Impact of LCA-Associated E14L LRAT Mutation on Protein Stability and Retinoid Homeostasis. Biochemistry 2017, 56, 4489–4499. [Google Scholar] [CrossRef]
- Den Hollander, A.I.; Lopez, I.; Yzer, S.; Zonneveld, M.N.; Janssen, I.M.; Strom, T.M.; Hehir-Kwa, J.Y.; Veltman, J.A.; Arends, M.L.; Meitinger, T.; et al. Identification of novel mutations in patients with Leber congenital amaurosis and juvenile RP by genome-wide homozygosity mapping with SNP microarrays. Investig. Ophthalmol. Vis. Sci. 2007, 48, 5690–5698. [Google Scholar] [CrossRef]
- Dev Borman, A.; Ocaka, L.A.; Mackay, D.S.; Ripamonti, C.; Henderson, R.H.; Moradi, P.; Hall, G.; Black, G.C.; Robson, A.G.; Holder, G.E.; et al. Early onset retinal dystrophy due to mutations in LRAT: Molecular analysis and detailed phenotypic study. Investig. Ophthalmol. Vis. Sci. 2012, 53, 3927–3938. [Google Scholar] [CrossRef] [Green Version]
- Littink, K.W.; van Genderen, M.M.; van Schooneveld, M.J.; Visser, L.; Riemslag, F.C.; Keunen, J.E.; Bakker, B.; Zonneveld, M.N.; den Hollander, A.I.; Cremers, F.P.; et al. A homozygous frameshift mutation in LRAT causes retinitis punctata albescens. Ophthalmology 2012, 119, 1899–1906. [Google Scholar] [CrossRef]
- Redmond, T.M.; Yu, S.; Lee, E.; Bok, D.; Hamasaki, D.; Chen, N.; Goletz, P.; Ma, J.X.; Crouch, R.K.; Pfeifer, K. Rpe65 is necessary for production of 11-cis-vitamin A in the retinal visual cycle. Nat. Genet. 1998, 20, 344–351. [Google Scholar] [CrossRef] [PubMed]
- Batten, M.L.; Imanishi, Y.; Maeda, T.; Tu, D.C.; Moise, A.R.; Bronson, D.; Possin, D.; Van Gelder, R.N.; Baehr, W.; Palczewski, K. Lecithin-retinol acyltransferase is essential for accumulation of all-trans-retinyl esters in the eye and in the liver. J. Biol. Chem. 2004, 279, 10422–10432. [Google Scholar] [CrossRef] [Green Version]
- den Hollander, A.I.; Roepman, R.; Koenekoop, R.K.; Cremers, F.P. Leber congenital amaurosis: Genes, proteins and disease mechanisms. Prog. Retin. Eye Res. 2008, 27, 391–419. [Google Scholar] [CrossRef] [PubMed]
- Russell, S.; Bennett, J.; Wellman, J.A.; Chung, D.C.; Yu, Z.F.; Tillman, A.; Wittes, J.; Pappas, J.; Elci, O.; McCague, S.; et al. Efficacy and safety of voretigene neparvovec (AAV2-hRPE65v2) in patients with RPE65-mediated inherited retinal dystrophy: A randomised, controlled, open-label, phase 3 trial. Lancet 2017, 390, 849–860. [Google Scholar] [CrossRef]
- Maguire, A.M.; Russell, S.; Wellman, J.A.; Chung, D.C.; Yu, Z.F.; Tillman, A.; Wittes, J.; Pappas, J.; Elci, O.; Marshall, K.A.; et al. Efficacy, Safety, and Durability of Voretigene Neparvovec-rzyl in RPE65 Mutation-Associated Inherited Retinal Dystrophy: Results of Phase 1 and 3 Trials. Ophthalmology 2019, 126, 1273–1285. [Google Scholar] [CrossRef] [Green Version]
- Talib, M.; Boon, C.J.F. Retinal Dystrophies and the Road to Treatment: Clinical Requirements and Considerations. Asia Pac. J. Ophthalmol. 2020, 9, 159–179. [Google Scholar] [CrossRef] [PubMed]
- Thompson, D.A.; Li, Y.; McHenry, C.L.; Carlson, T.J.; Ding, X.; Sieving, P.A.; Apfelstedt-Sylla, E.; Gal, A. Mutations in the gene encoding lecithin retinol acyltransferase are associated with early-onset severe retinal dystrophy. Nat. Genet. 2001, 28, 123–124. [Google Scholar] [CrossRef] [PubMed]
- Senechal, A.; Humbert, G.; Surget, M.O.; Bazalgette, C.; Bazalgette, C.; Arnaud, B.; Arndt, C.; Laurent, E.; Brabet, P.; Hamel, C.P. Screening genes of the retinoid metabolism: Novel LRAT mutation in leber congenital amaurosis. Am. J. Ophthalmol. 2006, 142, 702–704. [Google Scholar] [CrossRef]
- Talib, M.; van Schooneveld, M.J.; van Duuren, R.J.G.; Van Cauwenbergh, C.; Ten Brink, J.B.; De Baere, E.; Florijn, R.J.; Schalij-Delfos, N.E.; Leroy, B.P.; Bergen, A.A.; et al. Long-Term Follow-Up of Retinal Degenerations Associated With LRAT Mutations and Their Comparability to Phenotypes Associated With RPE65 Mutations. Transl. Vis. Sci. Technol. 2019, 8, 24. [Google Scholar] [CrossRef] [Green Version]
- Ruiz, A.; Winston, A.; Lim, Y.H.; Gilbert, B.A.; Rando, R.R.; Bok, D. Molecular and biochemical characterization of lecithin retinol acyltransferase. J. Biol. Chem. 1999, 274, 3834–3841. [Google Scholar] [CrossRef] [Green Version]
- Zolfaghari, R.; Ross, A.C. Lecithin:retinol acyltransferase from mouse and rat liver. CDNA cloning and liver-specific regulation by dietary vitamin a and retinoic acid. J. Lipid Res. 2000, 41, 2024–2034. [Google Scholar] [CrossRef]
- Zolfaghari, R.; Ross, A.C. Cloning, gene organization and identification of an alternative splicing process in lecithin:retinol acyltransferase cDNA from human liver. Gene 2004, 341, 181–188. [Google Scholar] [CrossRef] [PubMed] [Green Version]
- Zolfaghari, R.; Wang, Y.; Chen, Q.; Sancher, A.; Ross, A.C. Cloning and molecular expression analysis of large and small lecithin:retinol acyltransferase mRNAs in the liver and other tissues of adult rats. Biochem. J. 2002, 368, 621–631. [Google Scholar] [CrossRef] [PubMed] [Green Version]
- Wright, C.B.; Chrenek, M.A.; Foster, S.L.; Duncan, T.; Redmond, T.M.; Pardue, M.T.; Boatright, J.H.; Nickerson, J.M. Complementation test of Rpe65 knockout and tvrm148. Investig. Ophthalmol. Vis. Sci. 2013, 54, 5111–5122. [Google Scholar] [CrossRef] [PubMed] [Green Version]
- Fan, J.; Rohrer, B.; Frederick, J.M.; Baehr, W.; Crouch, R.K. Rpe65−/− and Lrat−/− mice: Comparable models of leber congenital amaurosis. Investig. Ophthalmol. Vis. Sci. 2008, 49, 2384–2389. [Google Scholar] [CrossRef] [PubMed] [Green Version]
- Van Hooser, J.P.; Aleman, T.S.; He, Y.G.; Cideciyan, A.V.; Kuksa, V.; Pittler, S.J.; Stone, E.M.; Jacobson, S.G.; Palczewski, K. Rapid restoration of visual pigment and function with oral retinoid in a mouse model of childhood blindness. Proc. Natl. Acad. Sci. USA 2000, 97, 8623–8628. [Google Scholar] [CrossRef] [PubMed] [Green Version]
- Scholl, H.P.; Moore, A.T.; Koenekoop, R.K.; Wen, Y.; Fishman, G.A.; van den Born, L.I.; Bittner, A.; Bowles, K.; Fletcher, E.C.; Collison, F.T.; et al. Safety and Proof-of-Concept Study of Oral QLT091001 in Retinitis Pigmentosa Due to Inherited Deficiencies of Retinal Pigment Epithelial 65 Protein (RPE65) or Lecithin:Retinol Acyltransferase (LRAT). PLoS ONE 2015, 10, e0143846. [Google Scholar] [CrossRef] [PubMed] [Green Version]
- Batten, M.L.; Imanishi, Y.; Tu, D.C.; Doan, T.; Zhu, L.; Pang, J.; Glushakova, L.; Moise, A.R.; Baehr, W.; Van Gelder, R.N.; et al. Pharmacological and rAAV gene therapy rescue of visual functions in a blind mouse model of Leber congenital amaurosis. PLoS Med. 2005, 2, e333. [Google Scholar] [CrossRef] [PubMed] [Green Version]
- Roman, A.J.; Boye, S.L.; Aleman, T.S.; Pang, J.J.; McDowell, J.H.; Boye, S.E.; Cideciyan, A.V.; Jacobson, S.G.; Hauswirth, W.W. Electroretinographic analyses of Rpe65-mutant rd12 mice: Developing an in vivo bioassay for human gene therapy trials of Leber congenital amaurosis. Mol. Vis. 2007, 13, 1701–1710. [Google Scholar]
- Kostic, C.; Crippa, S.V.; Pignat, V.; Bemelmans, A.P.; Samardzija, M.; Grimm, C.; Wenzel, A.; Arsenijevic, Y. Gene therapy regenerates protein expression in cone photoreceptors in Rpe65(R91W/R91W) mice. PLoS ONE 2011, 6, e16588. [Google Scholar] [CrossRef]
- Pang, J.; Boye, S.E.; Lei, B.; Boye, S.L.; Everhart, D.; Ryals, R.; Umino, Y.; Rohrer, B.; Alexander, J.; Li, J.; et al. Self-complementary AAV-mediated gene therapy restores cone function and prevents cone degeneration in two models of Rpe65 deficiency. Gene 2010, 17, 815–826. [Google Scholar] [CrossRef] [Green Version]
- Georgiadis, A.; Duran, Y.; Ribeiro, J.; Abelleira-Hervas, L.; Robbie, S.J.; Sünkel-Laing, B.; Fourali, S.; Gonzalez-Cordero, A.; Cristante, E.; Michaelides, M.; et al. Development of an optimized AAV2/5 gene therapy vector for Leber congenital amaurosis owing to defects in RPE65. Gene 2016, 23, 857–862. [Google Scholar]
- Bemelmans, A.P.; Kostic, C.; Crippa, S.V.; Hauswirth, W.W.; Lem, J.; Munier, F.L.; Seeliger, M.W.; Wenzel, A.; Arsenijevic, Y. Lentiviral gene transfer of RPE65 rescues survival and function of cones in a mouse model of Leber congenital amaurosis. PLoS Med. 2006, 3, e347. [Google Scholar] [CrossRef]
- Li, Y.; Tsai, Y.T.; Hsu, C.W.; Erol, D.; Yang, J.; Wu, W.H.; Davis, R.J.; Egli, D.; Tsang, S.H. Long-term safety and efficacy of human-induced pluripotent stem cell (iPS) grafts in a preclinical model of retinitis pigmentosa. Mol. Med. 2012, 18, 1312–1319. [Google Scholar] [CrossRef]
- Ben M’Barek, K.; Habeler, W.; Plancheron, A.; Jarraya, M.; Regent, F.; Terray, A.; Yang, Y.; Chatrousse, L.; Domingues, S.; Masson, Y.; et al. Human ESC-derived retinal epithelial cell sheets potentiate rescue of photoreceptor cell loss in rats with retinal degeneration. Sci. Transl. Med. 2017, 9, 421. [Google Scholar] [CrossRef] [Green Version]
- Strauss, O.; Stumpff, F.; Mergler, S.; Wienrich, M.; Wiederholt, M. The Royal College of Surgeons rat: An animal model for inherited retinal degeneration with a still unknown genetic defect. Acta Anat. 1998, 162, 101–111. [Google Scholar] [CrossRef] [PubMed]
- D’Cruz, P.M.; Yasumura, D.; Weir, J.; Matthes, M.T.; Abderrahim, H.; LaVail, M.M.; Vollrath, D. Mutation of the receptor tyrosine kinase gene Mertk in the retinal dystrophic RCS rat. Hum. Mol. Genet. 2000, 9, 645–651. [Google Scholar] [CrossRef] [PubMed] [Green Version]
- Koster, C.; Wever, K.E.; Wagstaff, P.E.; Hirk, K.; Hooijmans, C.R.; Bergen, A.A. A Systematic Review on Transplantation Studies of the Retinal Pigment Epithelium in Animal Models. Int. J. Mol. Sci. 2020, 21, 2719. [Google Scholar] [CrossRef] [PubMed] [Green Version]
- Valter, K.; Maslim, J.; Bowers, F.; Stone, J. Photoreceptor dystrophy in the RCS rat: Roles of oxygen, debris, and bFGF. Investig. Ophthalmol. Vis. Sci. 1998, 39, 2427–2442. [Google Scholar]
- Owusu, S.A.; Ross, A.C. Retinoid Homeostatic Gene Expression in Liver, Lung and Kidney: Ontogeny and Response to Vitamin A-Retinoic Acid (VARA) Supplementation from Birth to Adult Age. PLoS ONE 2016, 11, e0145924. [Google Scholar] [CrossRef] [PubMed] [Green Version]
- Hu, J.; Li, P.; Shi, B.; Tie, J. Importin β1 mediates nuclear import of the factors associated with nonsense-mediated RNA decay. Biochem. Biophys. Res. Commun. 2021, 542, 34–39. [Google Scholar] [CrossRef] [PubMed]
- Gong, Q.; Stump, M.R.; Zhou, Z. Position of premature termination codons determines susceptibility of hERG mutations to nonsense-mediated mRNA decay in long QT syndrome. Gene 2014, 539, 190–197. [Google Scholar] [CrossRef] [Green Version]
- Zarraga, I.G.; Zhang, L.; Stump, M.R.; Gong, Q.; Vincent, G.M.; Zhou, Z. Nonsense-mediated mRNA decay caused by a frameshift mutation in a large kindred of type 2 long QT syndrome. Heart Rhythm 2011, 8, 1200–1206. [Google Scholar] [CrossRef] [PubMed] [Green Version]
- Seeger, T.; Shrestha, R.; Lam, C.K.; Chen, C.; McKeithan, W.L.; Lau, E.; Wnorowski, A.; McMullen, G.; Greenhaw, M.; Lee, J.; et al. A Premature Termination Codon Mutation in MYBPC3 Causes Hypertrophic Cardiomyopathy via Chronic Activation of Nonsense-Mediated Decay. Circulation 2019, 139, 799–811. [Google Scholar] [CrossRef]
- Ahmed, J.N.; Ali, R.G.; Warr, N.; Wilson, H.M.; Bellchambers, H.M.; Barratt, K.S.; Thompson, A.J.; Arkell, R.M. A murine Zic3 transcript with a premature termination codon evades nonsense-mediated decay during axis formation. Dis. Model. Mech 2013, 6, 755–767. [Google Scholar] [CrossRef] [Green Version]
- Koenekoop, R.K.; Sui, R.; Sallum, J.; van den Born, L.I.; Ajlan, R.; Khan, A.; den Hollander, A.I.; Cremers, F.P.; Mendola, J.D.; Bittner, A.K.; et al. Oral 9-cis retinoid for childhood blindness due to Leber congenital amaurosis caused by RPE65 or LRAT mutations: An open-label phase 1b trial. Lancet 2014, 384, 1513–1520. [Google Scholar] [CrossRef]
- Watson, C. Chapter 25—Visual System. In The Mouse Nervous System; Watson, C., Paxinos, G., Puelles, L., Eds.; Academic Press: San Diego, CA, USA, 2012; pp. 646–652. [Google Scholar]
- Carter-Dawson, L.D.; LaVail, M.M. Rods and cones in the mouse retina—I: Structural analysis using light and electron microscopy. J. Comp. Neurol. 1979, 188, 245–262. [Google Scholar] [CrossRef] [PubMed]
- Carter-Dawson, L.D.; LaVail, M.M. Rods and cones in the mouse retina—II: Autoradiographic analysis of cell generation using tritiated thymidine. J. Comp. Neurol. 1979, 188, 263–272. [Google Scholar] [CrossRef] [PubMed]
- Patel, U.; Boucher, M.; de Léséleuc, L.; Visintini, S. Voretigene Neparvovec: An Emerging Gene Therapy for the Treatment of Inherited Blindness. In CADTH Issues in Emerging Health Technologies; Canadian Agency for Drugs and Technologies in Health: Ottawa, ON, Canada, 2016; pp. 1–11. [Google Scholar]
- Miraldi Utz, V.; Coussa, R.G.; Antaki, F.; Traboulsi, E.I. Gene therapy for RPE65-related retinal disease. Ophthalmic Genet. 2018, 39, 671–677. [Google Scholar] [CrossRef] [PubMed]
- Kang, C.; Scott, L.J. Voretigene Neparvovec: A Review in RPE65 Mutation-Associated Inherited Retinal Dystrophy. Mol. Diagn. 2020, 24, 487–495. [Google Scholar] [CrossRef]
- Ding, K.; Shen, J.; Hafiz, Z.; Hackett, S.F.; e Silva, R.L.; Khan, M.; Lorenc, V.E.; Chen, D.; Chadha, R.; Zhang, M.; et al. AAV8-vectored suprachoroidal gene transfer produces widespread ocular transgene expression. J. Clin. Investig. 2019, 129, 4901–4911. [Google Scholar] [CrossRef]
- Maeda, T.; Lee, M.J.; Palczewska, G.; Marsili, S.; Tesar, P.J.; Palczewski, K.; Takahashi, M.; Maeda, A. Retinal pigmented epithelial cells obtained from human induced pluripotent stem cells possess functional visual cycle enzymes in vitro and in vivo. J. Biol. Chem. 2013, 288, 34484–34493. [Google Scholar] [CrossRef] [Green Version]
- Gouras, P.; Kong, J.; Tsang, S.H. Retinal degeneration and RPE transplantation in Rpe65−/− mice. Investig. Ophthalmol. Vis. Sci. 2002, 43, 3307–3311. [Google Scholar]
- Ilmarinen, T.; Hiidenmaa, H.; Koobi, P.; Nymark, S.; Sorkio, A.; Wang, J.H.; Stanzel, B.V.; Thieltges, F.; Alajuuma, P.; Oksala, O.; et al. Ultrathin Polyimide Membrane as Cell Carrier for Subretinal Transplantation of Human Embryonic Stem Cell Derived Retinal Pigment Epithelium. PLoS ONE 2015, 10, e0143669. [Google Scholar] [CrossRef]
- Kamao, H.; Mandai, M.; Okamoto, S.; Sakai, N.; Suga, A.; Sugita, S.; Kiryu, J.; Takahashi, M. Characterization of human induced pluripotent stem cell-derived retinal pigment epithelium cell sheets aiming for clinical application. Stem Cell Rep. 2014, 2, 205–218. [Google Scholar] [CrossRef] [Green Version]
- Yaji, N.; Yamato, M.; Yang, J.; Okano, T.; Hori, S. Transplantation of tissue-engineered retinal pigment epithelial cell sheets in a rabbit model. Biomaterials 2009, 30, 797–803. [Google Scholar] [CrossRef]
- Kanemura, H.; Go, M.J.; Shikamura, M.; Nishishita, N.; Sakai, N.; Kamao, H.; Mandai, M.; Morinaga, C.; Takahashi, M.; Kawamata, S. Tumorigenicity studies of induced pluripotent stem cell (iPSC)-derived retinal pigment epithelium (RPE) for the treatment of age-related macular degeneration. PLoS ONE 2014, 9, e85336. [Google Scholar] [CrossRef] [PubMed]
- Diniz, B.; Thomas, P.; Thomas, B.; Ribeiro, R.; Hu, Y.; Brant, R.; Ahuja, A.; Zhu, D.; Liu, L.; Koss, M.; et al. Subretinal implantation of retinal pigment epithelial cells derived from human embryonic stem cells: Improved survival when implanted as a monolayer. Investig. Ophthalmol. Vis. Sci. 2013, 54, 5087–5096. [Google Scholar] [CrossRef] [Green Version]
- Kaplan, H.; Chiang, C.-W.; Chen, J.; Song, S.-K. Vitreous volume of the mouse measured by quantitative high-resolution MRI. Investig. Ophthalmol. Vis. Sci. 2010, 51, 4414. [Google Scholar]
- Sha, O.; Kwong, W. Postnatal developmental changes of vitreous and lens volumes in Sprague-Dawley rats. Neuroembryol. Aging 2006, 4, 183–188. [Google Scholar] [CrossRef]
- Aitman, T.; Dhillon, P.; Geurts, A.M. A RATional choice for translational research? Dis. Model. Mech. 2016, 9, 1069–1072. [Google Scholar] [CrossRef] [Green Version]
- Ellenbroek, B.; Youn, J. Rodent models in neuroscience research: Is it a rat race? Dis. Model. Mech. 2016, 9, 1079–1087. [Google Scholar] [CrossRef] [PubMed] [Green Version]
- Timberlake, W. Integrating niche-related and general process approaches in the study of learning. Behav. Process. 2001, 54, 79–94. [Google Scholar] [CrossRef] [Green Version]
- Timberlake, W. Niche-related learning in laboratory paradigms: The case of maze behavior in Norway rats. Behav. Brain Res. 2002, 134, 355–374. [Google Scholar] [CrossRef]
- Sheedlo, H.J.; Gaur, V.; Li, L.X.; Seaton, A.D.; Turner, J.E. Transplantation to the diseased and damaged retina. Trends Neurosci. 1991, 14, 347–350. [Google Scholar] [CrossRef]
- Yu, D.Y.; Cringle, S.J. Retinal degeneration and local oxygen metabolism. Exp. Eye Res. 2005, 80, 745–751. [Google Scholar] [CrossRef]
- Nakazawa, M.; Hara, A.; Ishiguro, S.I. Optical Coherence Tomography of Animal Models of Retinitis Pigmentosa: From Animal Studies to Clinical Applications. Biomed. Res. Int. 2019, 2019, 8276140. [Google Scholar] [CrossRef] [PubMed] [Green Version]
- LaVail, M.M.; Yasumura, D.; Matthes, M.T.; Yang, H.; Hauswirth, W.W.; Deng, W.T.; Vollrath, D. Gene Therapy for MERTK-Associated Retinal Degenerations. Adv. Exp. Med. Biol. 2016, 854, 487–493. [Google Scholar] [PubMed] [Green Version]
- Rösch, S.; Aretzweiler, C.; Müller, F.; Walter, P. Evaluation of Retinal Function and Morphology of the Pink-Eyed Royal College of Surgeons (RCS) Rat: A Comparative Study of in Vivo and in Vitro Methods. Curr. Eye Res. 2017, 42, 273–281. [Google Scholar] [CrossRef] [PubMed]
- Ryals, R.C.; Andrews, M.D.; Datta, S.; Coyner, A.S.; Fischer, C.M.; Wen, Y.; Pennesi, M.E.; McGill, T.J. Long-term Characterization of Retinal Degeneration in Royal College of Surgeons Rats Using Spectral-Domain Optical Coherence Tomography. Investig. Ophthalmol. Vis. Sci. 2017, 58, 1378–1386. [Google Scholar] [CrossRef] [Green Version]
- Zhao, T.; Li, Y.; Weng, C.; Yin, Z. The changes of potassium currents in RCS rat Müller cell during retinal degeneration. Brain Res. 2012, 1427, 78–87. [Google Scholar] [CrossRef] [PubMed]
- Remy, S.; Chenouard, V.; Tesson, L.; Usal, C.; Ménoret, S.; Brusselle, L.; Heslan, J.M.; Nguyen, T.H.; Bellien, J.; Merot, J.; et al. Generation of gene-edited rats by delivery of CRISPR/Cas9 protein and donor DNA into intact zygotes using electroporation. Sci. Rep. 2017, 7, 16554. [Google Scholar] [CrossRef]
- Kobayashi, T.; Namba, M.; Koyano, T.; Fukushima, M.; Sato, M.; Ohtsuka, M.; Matsuyama, M. Successful production of genome-edited rats by the rGONAD method. BMC Biotechnol. 2018, 18, 19. [Google Scholar] [CrossRef] [Green Version]


Publisher’s Note: MDPI stays neutral with regard to jurisdictional claims in published maps and institutional affiliations. |
© 2021 by the authors. Licensee MDPI, Basel, Switzerland. This article is an open access article distributed under the terms and conditions of the Creative Commons Attribution (CC BY) license (https://creativecommons.org/licenses/by/4.0/).
Share and Cite
Koster, C.; van den Hurk, K.T.; Lewallen, C.F.; Talib, M.; ten Brink, J.B.; Boon, C.J.F.; Bergen, A.A. The Lrat−/− Rat: CRISPR/Cas9 Construction and Phenotyping of a New Animal Model for Retinitis Pigmentosa. Int. J. Mol. Sci. 2021, 22, 7234. https://doi.org/10.3390/ijms22137234
Koster C, van den Hurk KT, Lewallen CF, Talib M, ten Brink JB, Boon CJF, Bergen AA. The Lrat−/− Rat: CRISPR/Cas9 Construction and Phenotyping of a New Animal Model for Retinitis Pigmentosa. International Journal of Molecular Sciences. 2021; 22(13):7234. https://doi.org/10.3390/ijms22137234
Chicago/Turabian StyleKoster, Céline, Koen T. van den Hurk, Colby F. Lewallen, Mays Talib, Jacoline B. ten Brink, Camiel J. F. Boon, and Arthur A. Bergen. 2021. "The Lrat−/− Rat: CRISPR/Cas9 Construction and Phenotyping of a New Animal Model for Retinitis Pigmentosa" International Journal of Molecular Sciences 22, no. 13: 7234. https://doi.org/10.3390/ijms22137234