Article

The Crete Isl. (Greece) Mw6.0 Earthquake of 27 September 2021: Expecting the Unexpected

by
Ioanna Triantafyllou
1,*,
Andreas Karavias
2,
Ioannis Koukouvelas
3,
Gerassimos A. Papadopoulos
4 and
Issaak Parcharidis
2
1
Department of Dynamic Tectonic Applied Geology, Faculty of Geology and Geoenvironment, National and Kapodistrian University of Athens, 15784 Athens, Greece
2
Department of Geography, Harokopio University, 17671 Athens, Greece
3
Department of Geology, University of Patras, 26504 Patras, Greece
4
International Society for the Prevention & Mitigation of Natural Hazards, 10681 Athens, Greece
*
Author to whom correspondence should be addressed.
GeoHazards 2022, 3(1), 106-124; https://doi.org/10.3390/geohazards3010006
Submission received: 31 December 2021 / Revised: 8 February 2022 / Accepted: 21 February 2022 / Published: 25 February 2022

Abstract

:
The 27 September 2021 damaging mainshock (Mw6.0) is the first known strong earthquake that ruptured the Arkalochori area, Crete Isl., Greece, during the entire historical period, making it an unexpected event in the long-term sense. The area is characterized by the presence of the normal active Kastelli Fault (KF) striking NNE-SSW and dipping towards ~WNW. The KF, of surface exposure only ~6 km, at its southern tip is truncated by the nearly perpendicular active Nipiditos fault. The main shock was preceded by foreshock activity lasting for ~3.9 months, thus the mainshock turned out to be an expected event in the short-term sense. Maximum ground subsidence of ~20 cm was estimated from InSAR images, but this also incorporates deformation that may have been caused by the largest aftershock (Mw5.1) of 28 September 2021. The fault model produced from the inversion of InSAR observations indicated strike 216°, dip towards ~NW at angle 53°, rake −95°, and is consistent with fault-plane solutions obtained from routine moment tensor analysis. The geodetic seismic moment calculated from the Okada’s formalism is 1.14 × 10¹⁸ N·m (Mw6.0), while a maximum slip of 1.03 m was found at depths from 3.5 km to 5 km. The entire aftershock epicenters cloud strikes in a ~SW-NE direction but is distributed in two clusters, the southern and the northern ones. The foreshock cloud, the main slip patch, the deformation area, and the strongest aftershocks all fall within the southern cluster. The foreshocks concentration at the deepest edge of the main slip patch was a foreshadow of the mainshock nucleation area. The northern cluster, which is very likely due to the gradual expansion of aftershocks, is situated in the KF hanging wall block. To interpret the main seismic slip in the southern cluster area we propose the existence of a buried KF segment at the SSW-wards prolongation of the emerged at the surface segment. Assuming a rectangular seismic fault stress drop Δσ~7 bars was found. However, for a circular fault area, which in this case is more realistic, we get Δσ = 55 bars. This is a relatively large value for Greek earthquakes but is explainable by increased fault rigidity as a result of the long repeat time of strong earthquakes in KF.

1. Introduction

On 27 September 2021 (06:17:21.3 UTC) a strong earthquake associated with normal faulting ruptured the central part of the island of Crete, Greece, at ~20 km to the south of Heraklion, the capital city of the island (Figure 1). Moment magnitude, Mw, of 5.9 or 6.0 has been determined by various seismological centers (see data compilation in https://www.emsc-csem.org/Earthquake/index_tensors.php; last access 17 December 2021) but local magnitude ML5.8 was initially calculated by the National Observatory of Athens (NOA, http://www.gein.noa.gr/en/seismicity/earthquake-catalogs; last access 17 December 2021). The earthquake caused one fatality, about 20 injuries and extensive building damage in the area of Arkalochori town and in other villages of the area. No co-seismic surface faulting along the fault trace was observed in association with that earthquake. The main shock was preceded by a persisting foreshock activity since the beginning of June 2021, with the strongest foreshock of Mw4.6/ML4.8 occurring on 24 July 2021. Intense aftershock activity followed the main shock with the largest aftershock (Mw5.1/ML5.3) taking place on 28 September 2021.
Crete is situated at the front-arc of the Hellenic Subduction Zone (HSZ) (Figure 1) and, therefore, it is characterized by high seismicity with earthquake magnitudes that reach up to ~8.0 (see review in [1]). From an exhaustive examination of the seismic history of the area [2], it comes out that no shallow strong earthquakes with epicenters lying on the island occurred during the instrumental period of seismology, i.e., since 1900. During the less complete historical period, there is evidence for only very few strong earthquakes that possibly ruptured on the island (Figure 2). The mainshock of 27 September 2021 is the only known strong earthquake that ruptured the Arkalochori area ever. Therefore, the study of this earthquake is of particular importance for understanding the seismotectonics of the area.
In this paper, we investigate the seismogenic process, the causative fault associated with the Arkalochori mainshock and the seismic potential of the area from the short- and long-term perspective. To this aim, we compiled tectonic data and mapped the main faults which have surface exposure in the study area, evaluated fault-plane solutions, developed a fault model for the mainshock based on the inversion of ground deformation detected by InSAR, analyzed the main features of the foreshock and aftershock sequences and calculated the co-seismic stress drop.

2. Materials and Methods

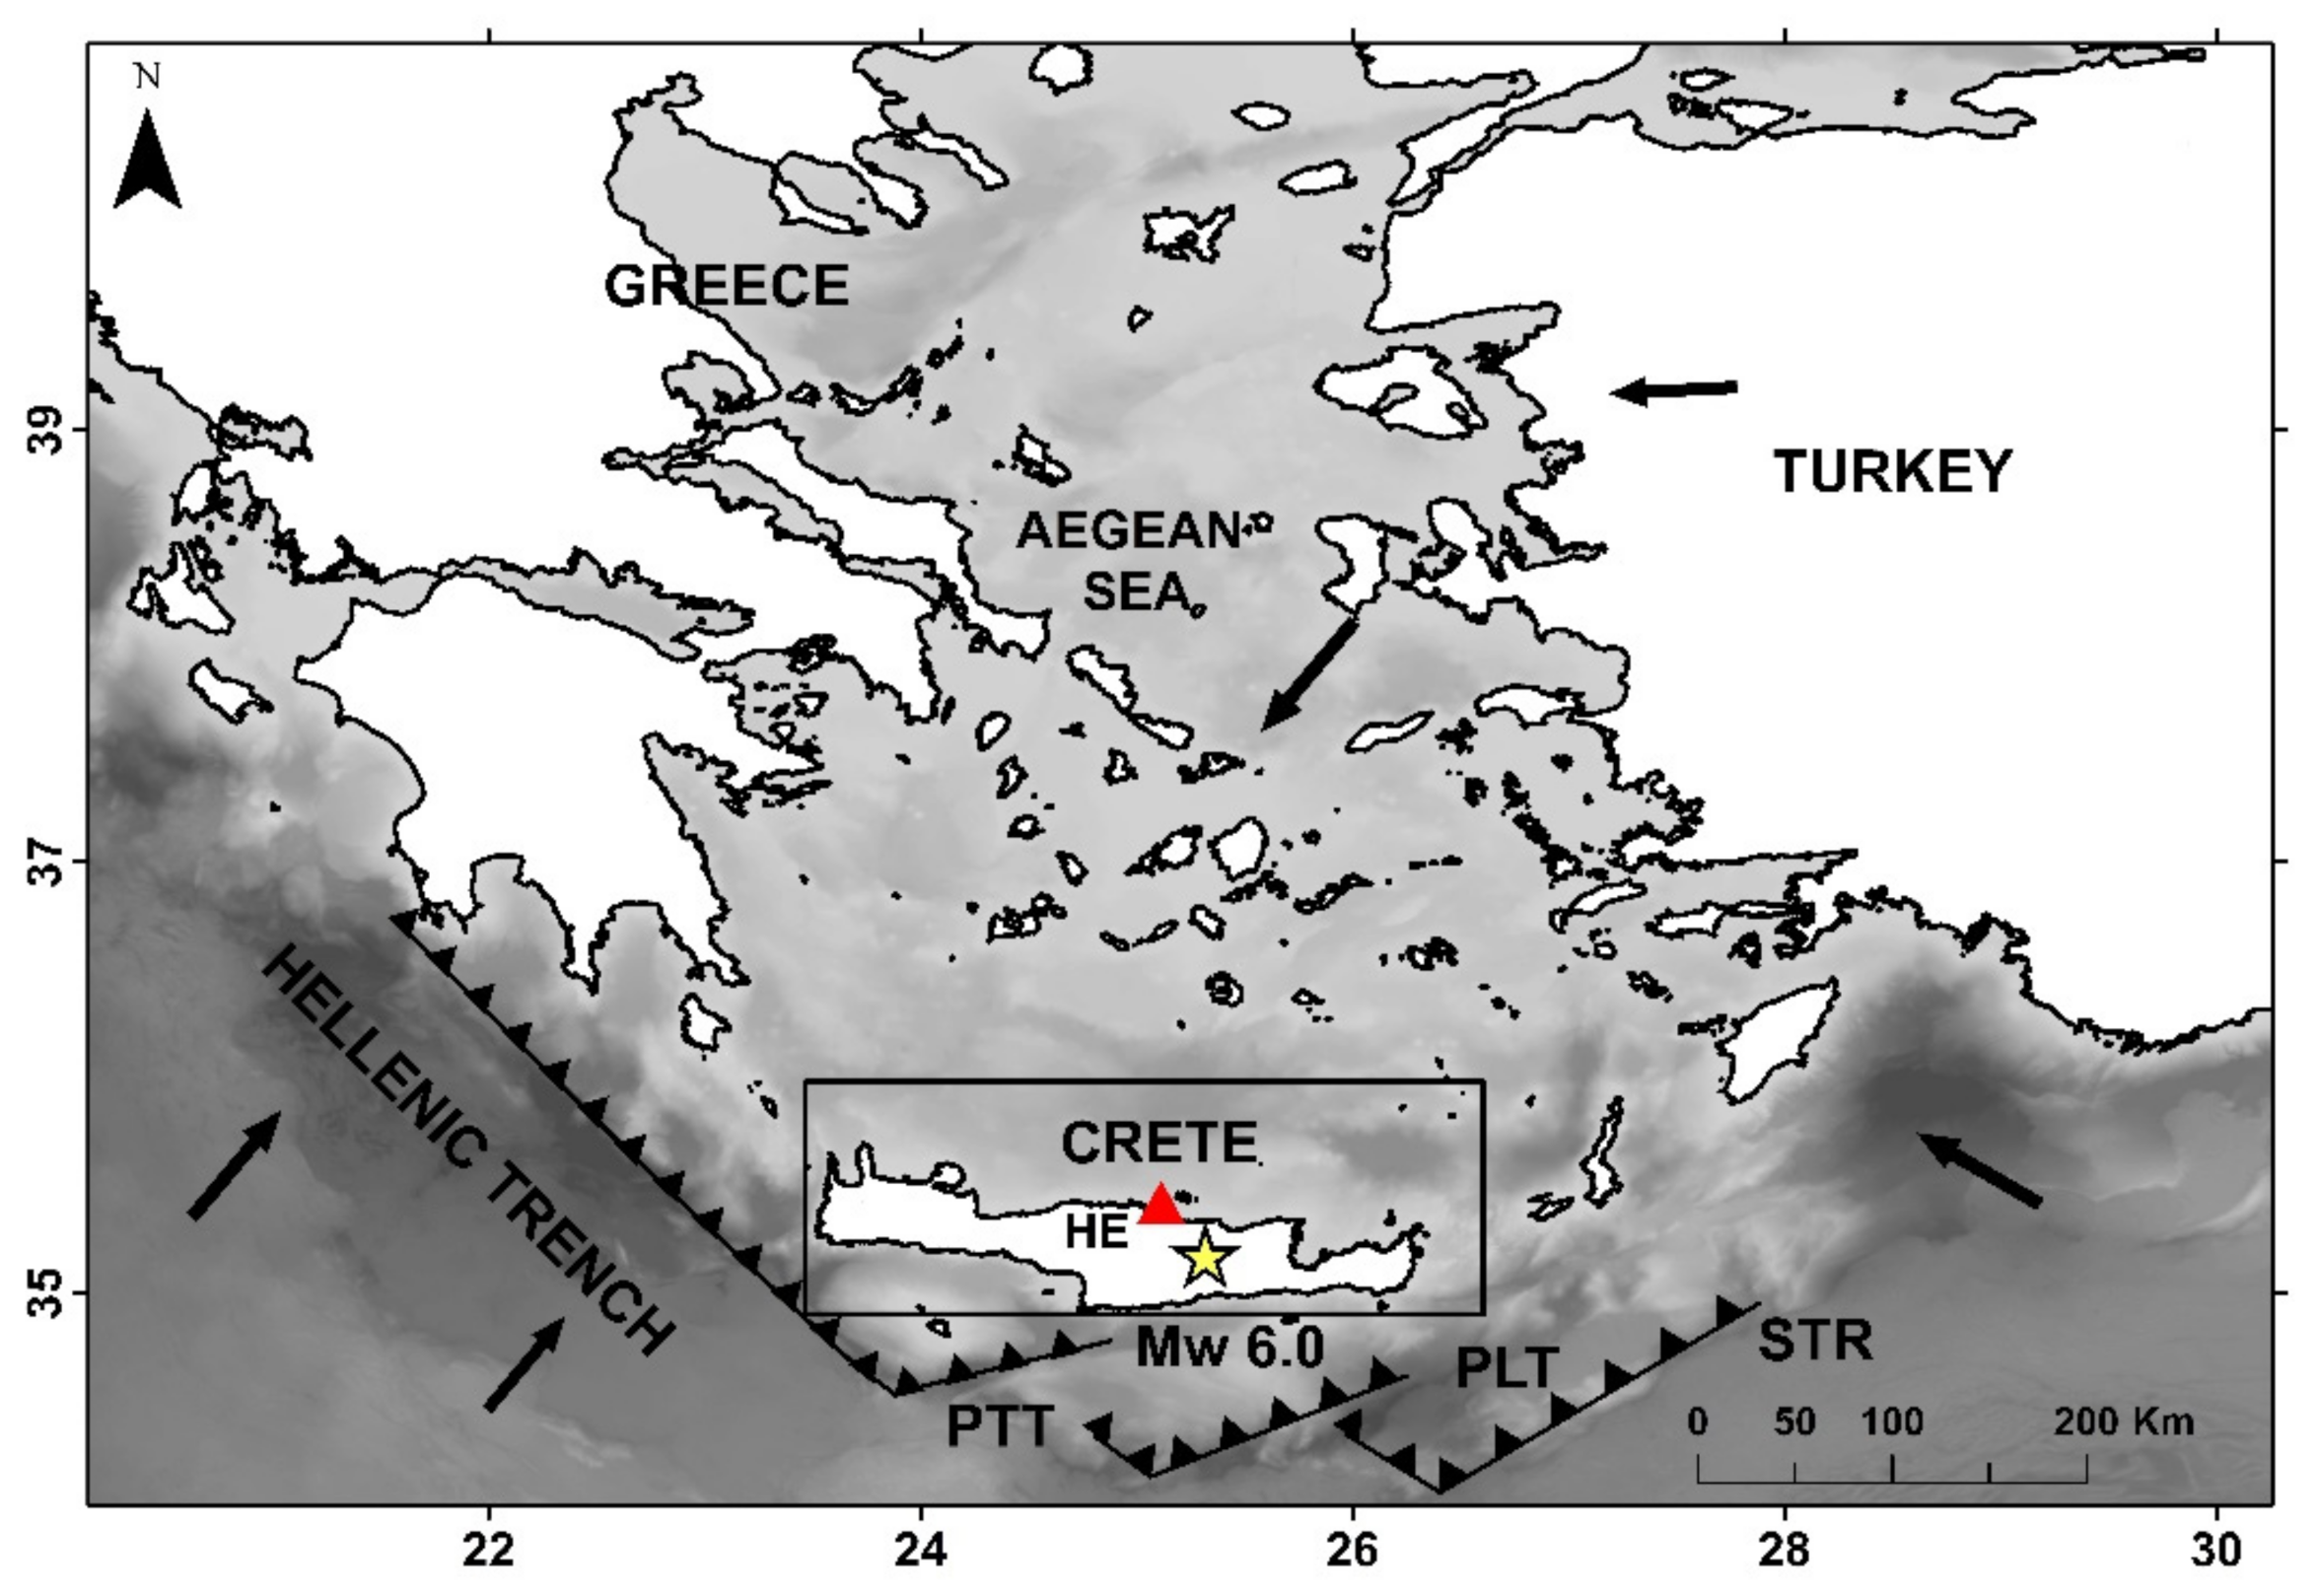
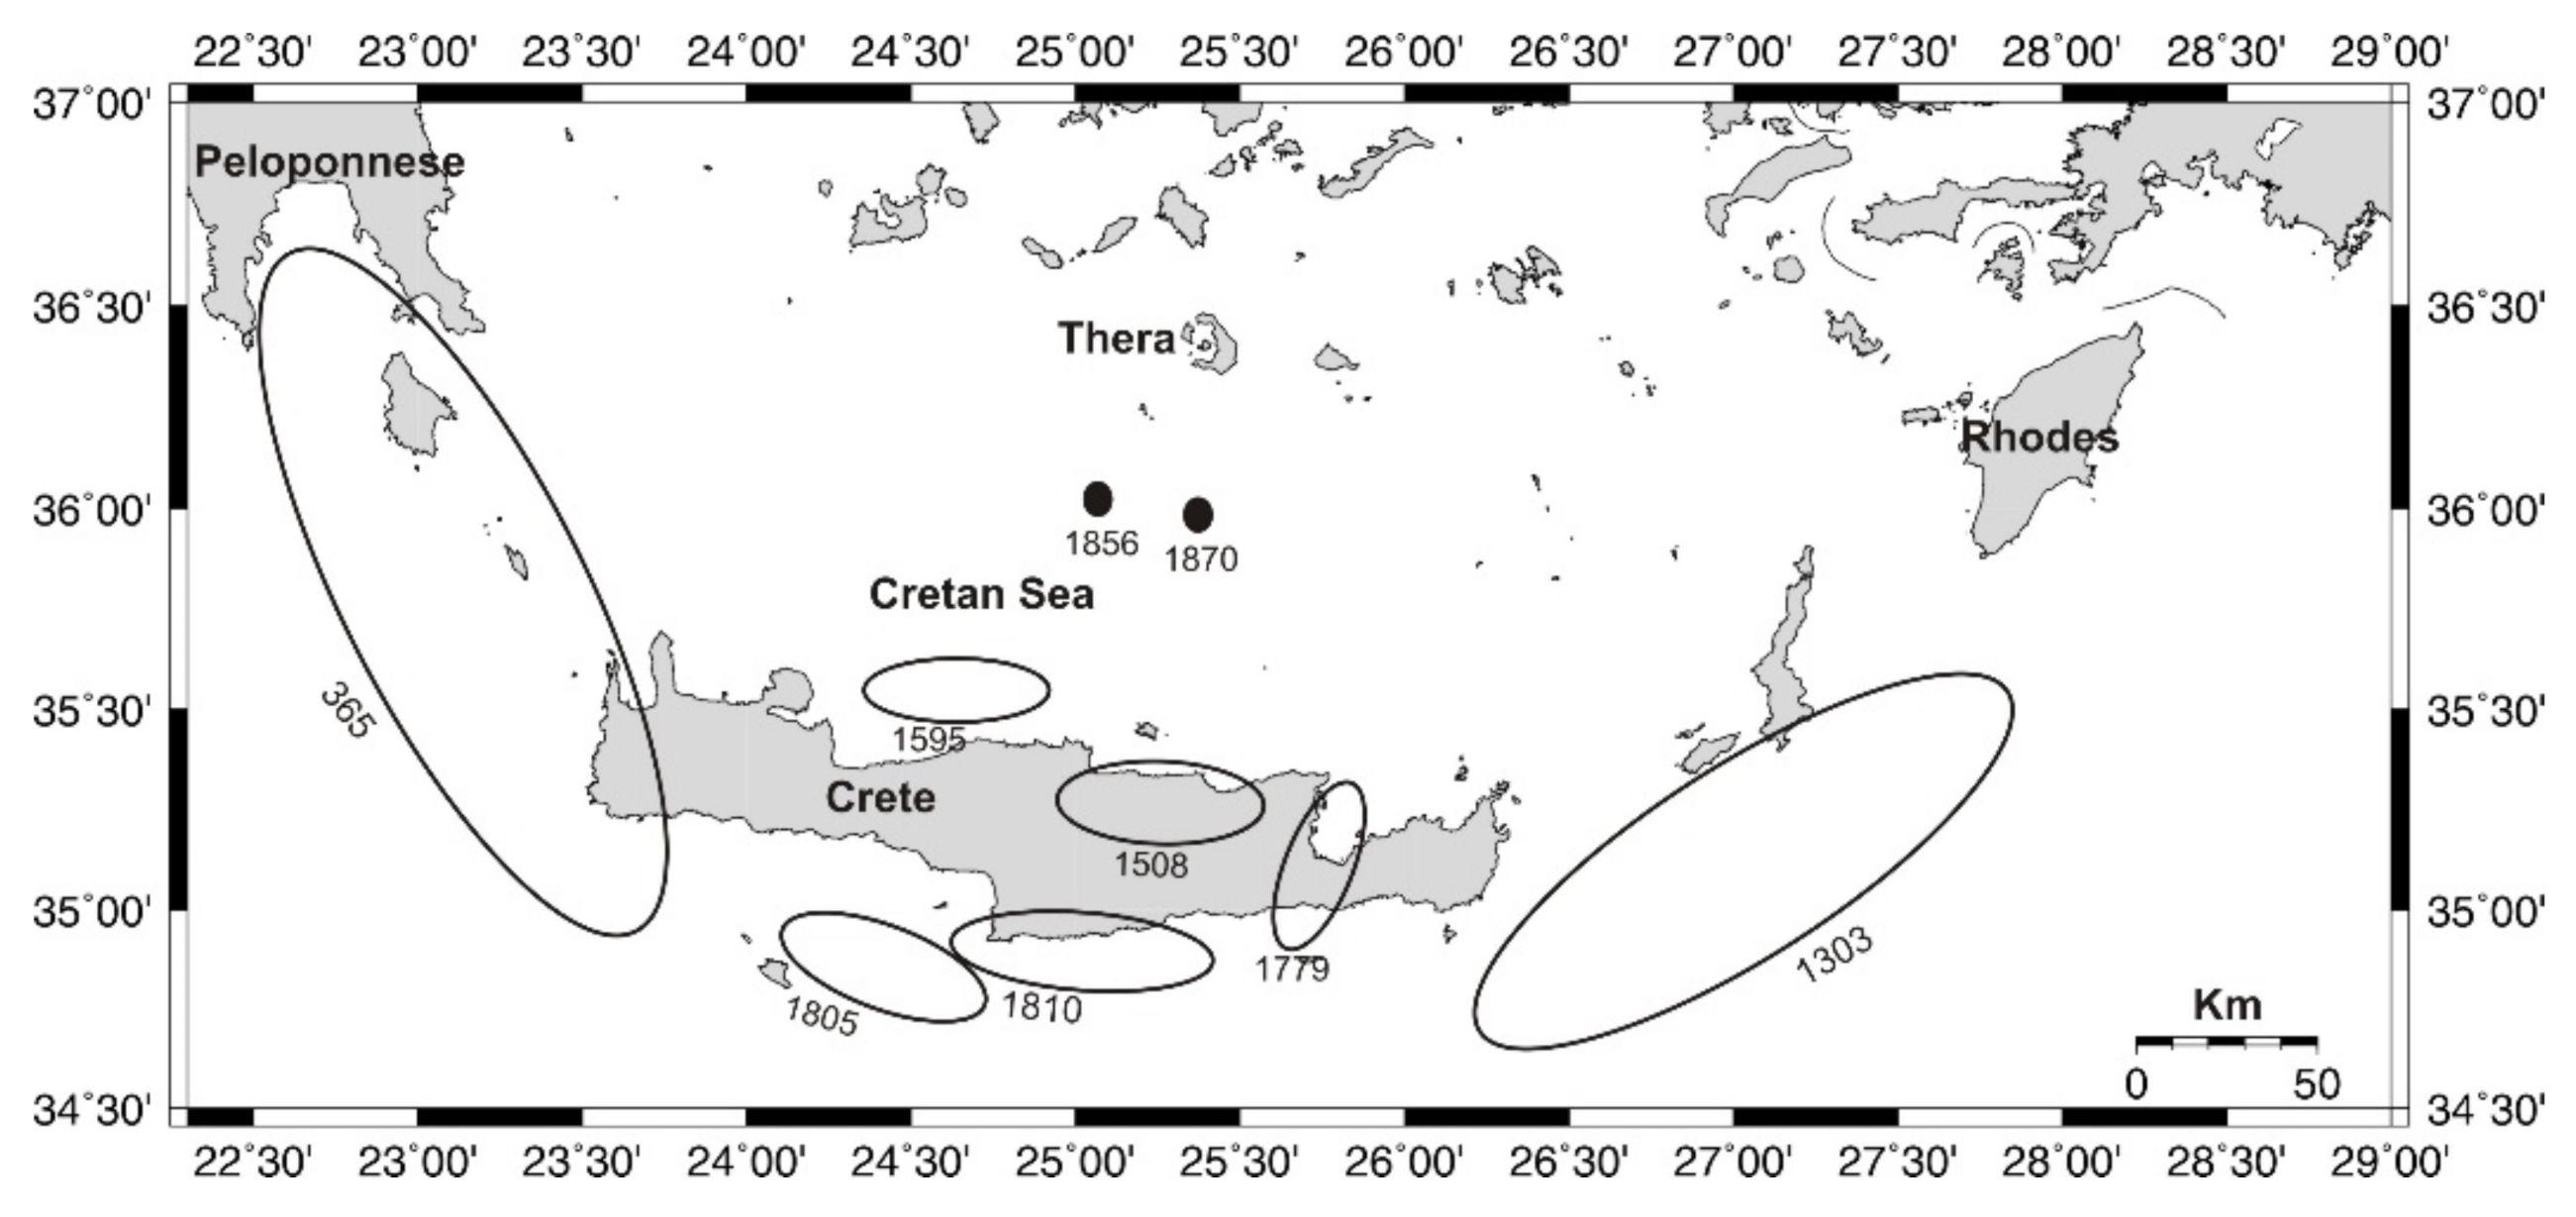
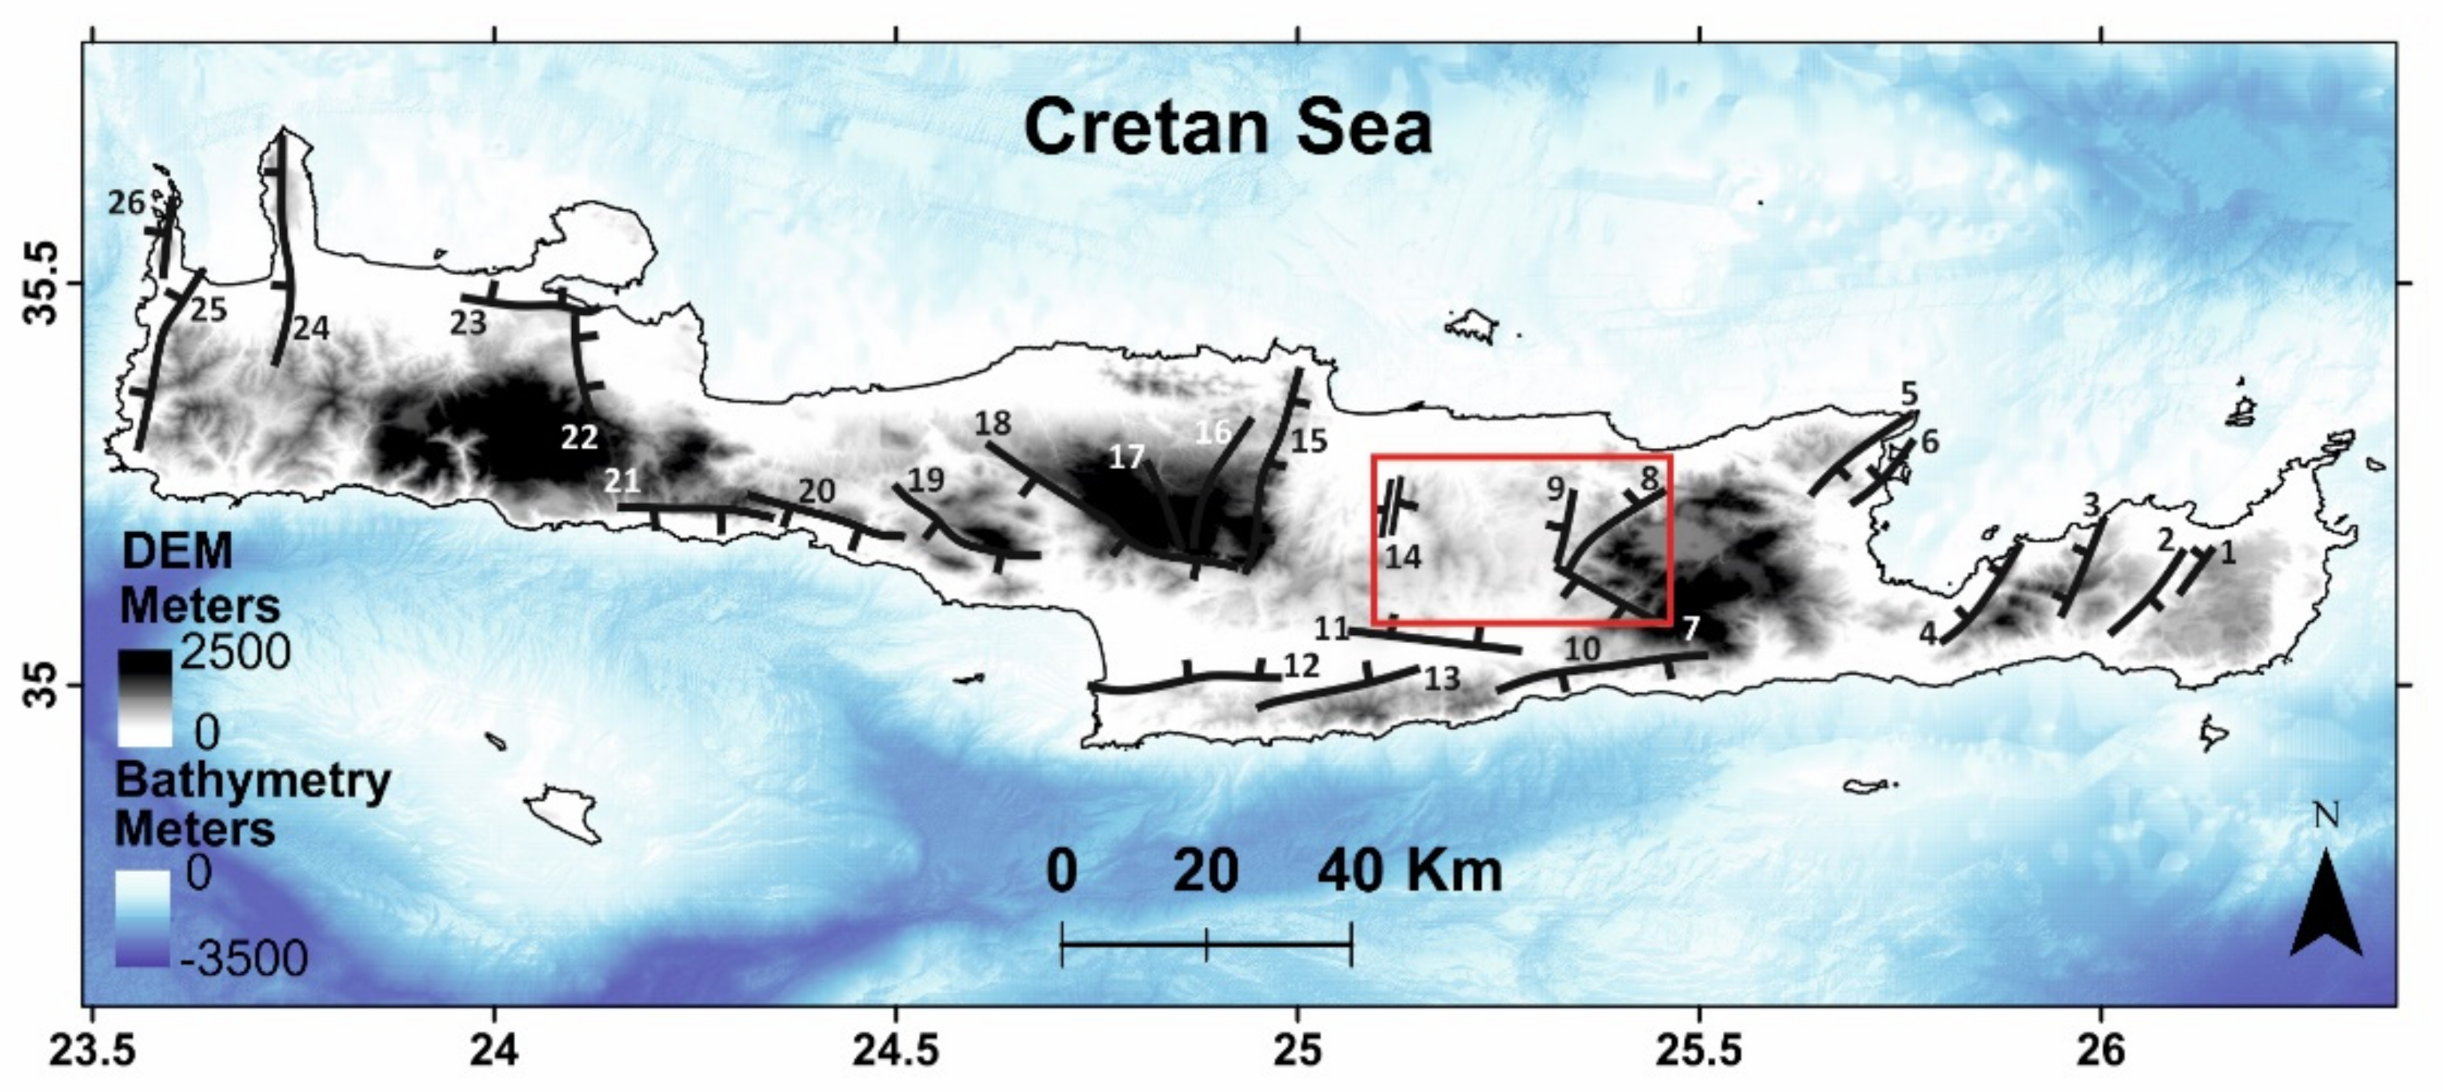
2.1. Geotectonic Setting

The island of Crete is located in the central part of the HSZ and on the overriding plate (Figure 1). The geotectonic position of the island explains the intense Late Quaternary active tectonics [4,5,6] and the high level of seismicity in the area [1,2,7,8,9]. Active faults have been mapped in several sites on the island [10,11,12,13,14,15,16,17] (Figure 3). The active tectonics on Crete is associated with significant regional uplift (>6 mma−1) and fresh traces of normal faults [18]. The stress field on the island and its surroundings appears complex, with NNE-SSW shortening prevailing offshore, close to the Hellenic trench to the south of Crete [19,20,21,22] (Figure 1). In contrast, onshore and close to the island extension prevails in directions E(SE)–W(NW) and roughly N–S. The extensional field is associated with steep young scarps along normal or oblique-slip faults [13,18].
The epicentral area near Arkalochori town is situated within the Heraklion sedimentary basin, which is fault-controlled and characterized by a tabular in shape basin that accumulates Neogene sediments. The Kastelli Fault (KF), which is of particular interest for understanding the seismotectonics of the 2021 earthquake, bounds the Heraklion basin to the east (Figure 3 and Figure 4). However, based on fault features such as trace length, offset, and proximity of fault traces to the basin border (Table 1), we concluded that the Geraki Fault is the major fault in the area although the KF is the most active one. Very likely the two faults belong to a crustal-scale fault zone. On the other hand, the Nipiditos Fault is the best well-exposed fault near the epicentral area and truncates the southward prolongation of both the Geraki and Kastelli Faults. The Heraklion basin is dominated by a high called “the Giouchtas horst” [10,23,24,25,26]. This structure is delimited by the East and West Giouchtas Faults, which are two ~N-S trending antithetic faults (Figure 4). To the south, the Heraklion basin is bounded by an almost E-W mountainous range that separates the Heraklion Basin from the Messara Basin lying to the south.
From the main fault features summarized in Table 1, we concluded that most faults expose fresh fault scarps, run along the mountain range fronts, separate topographic highs from the basin and accumulate a surface offset ranging from 160 m to 690 m. In general, these faults juxtapose Triassic limestones against flysch, marls and unconsolidated alluvial to colluvial sediments [10,23,26]. Almost all these faults appear to control triangular facets and relatively fresh fault scarps. In addition, within the southern part of the Heraklion basin rivers are characterized by deep incision, suggesting that the basin is a youthful stage of landforms. Based on the fault truncation, we consider the Nipiditos Fault as the youngest in the area. Faults like the Kastelli, Geraki and East Giouchtas ones are older but still active.

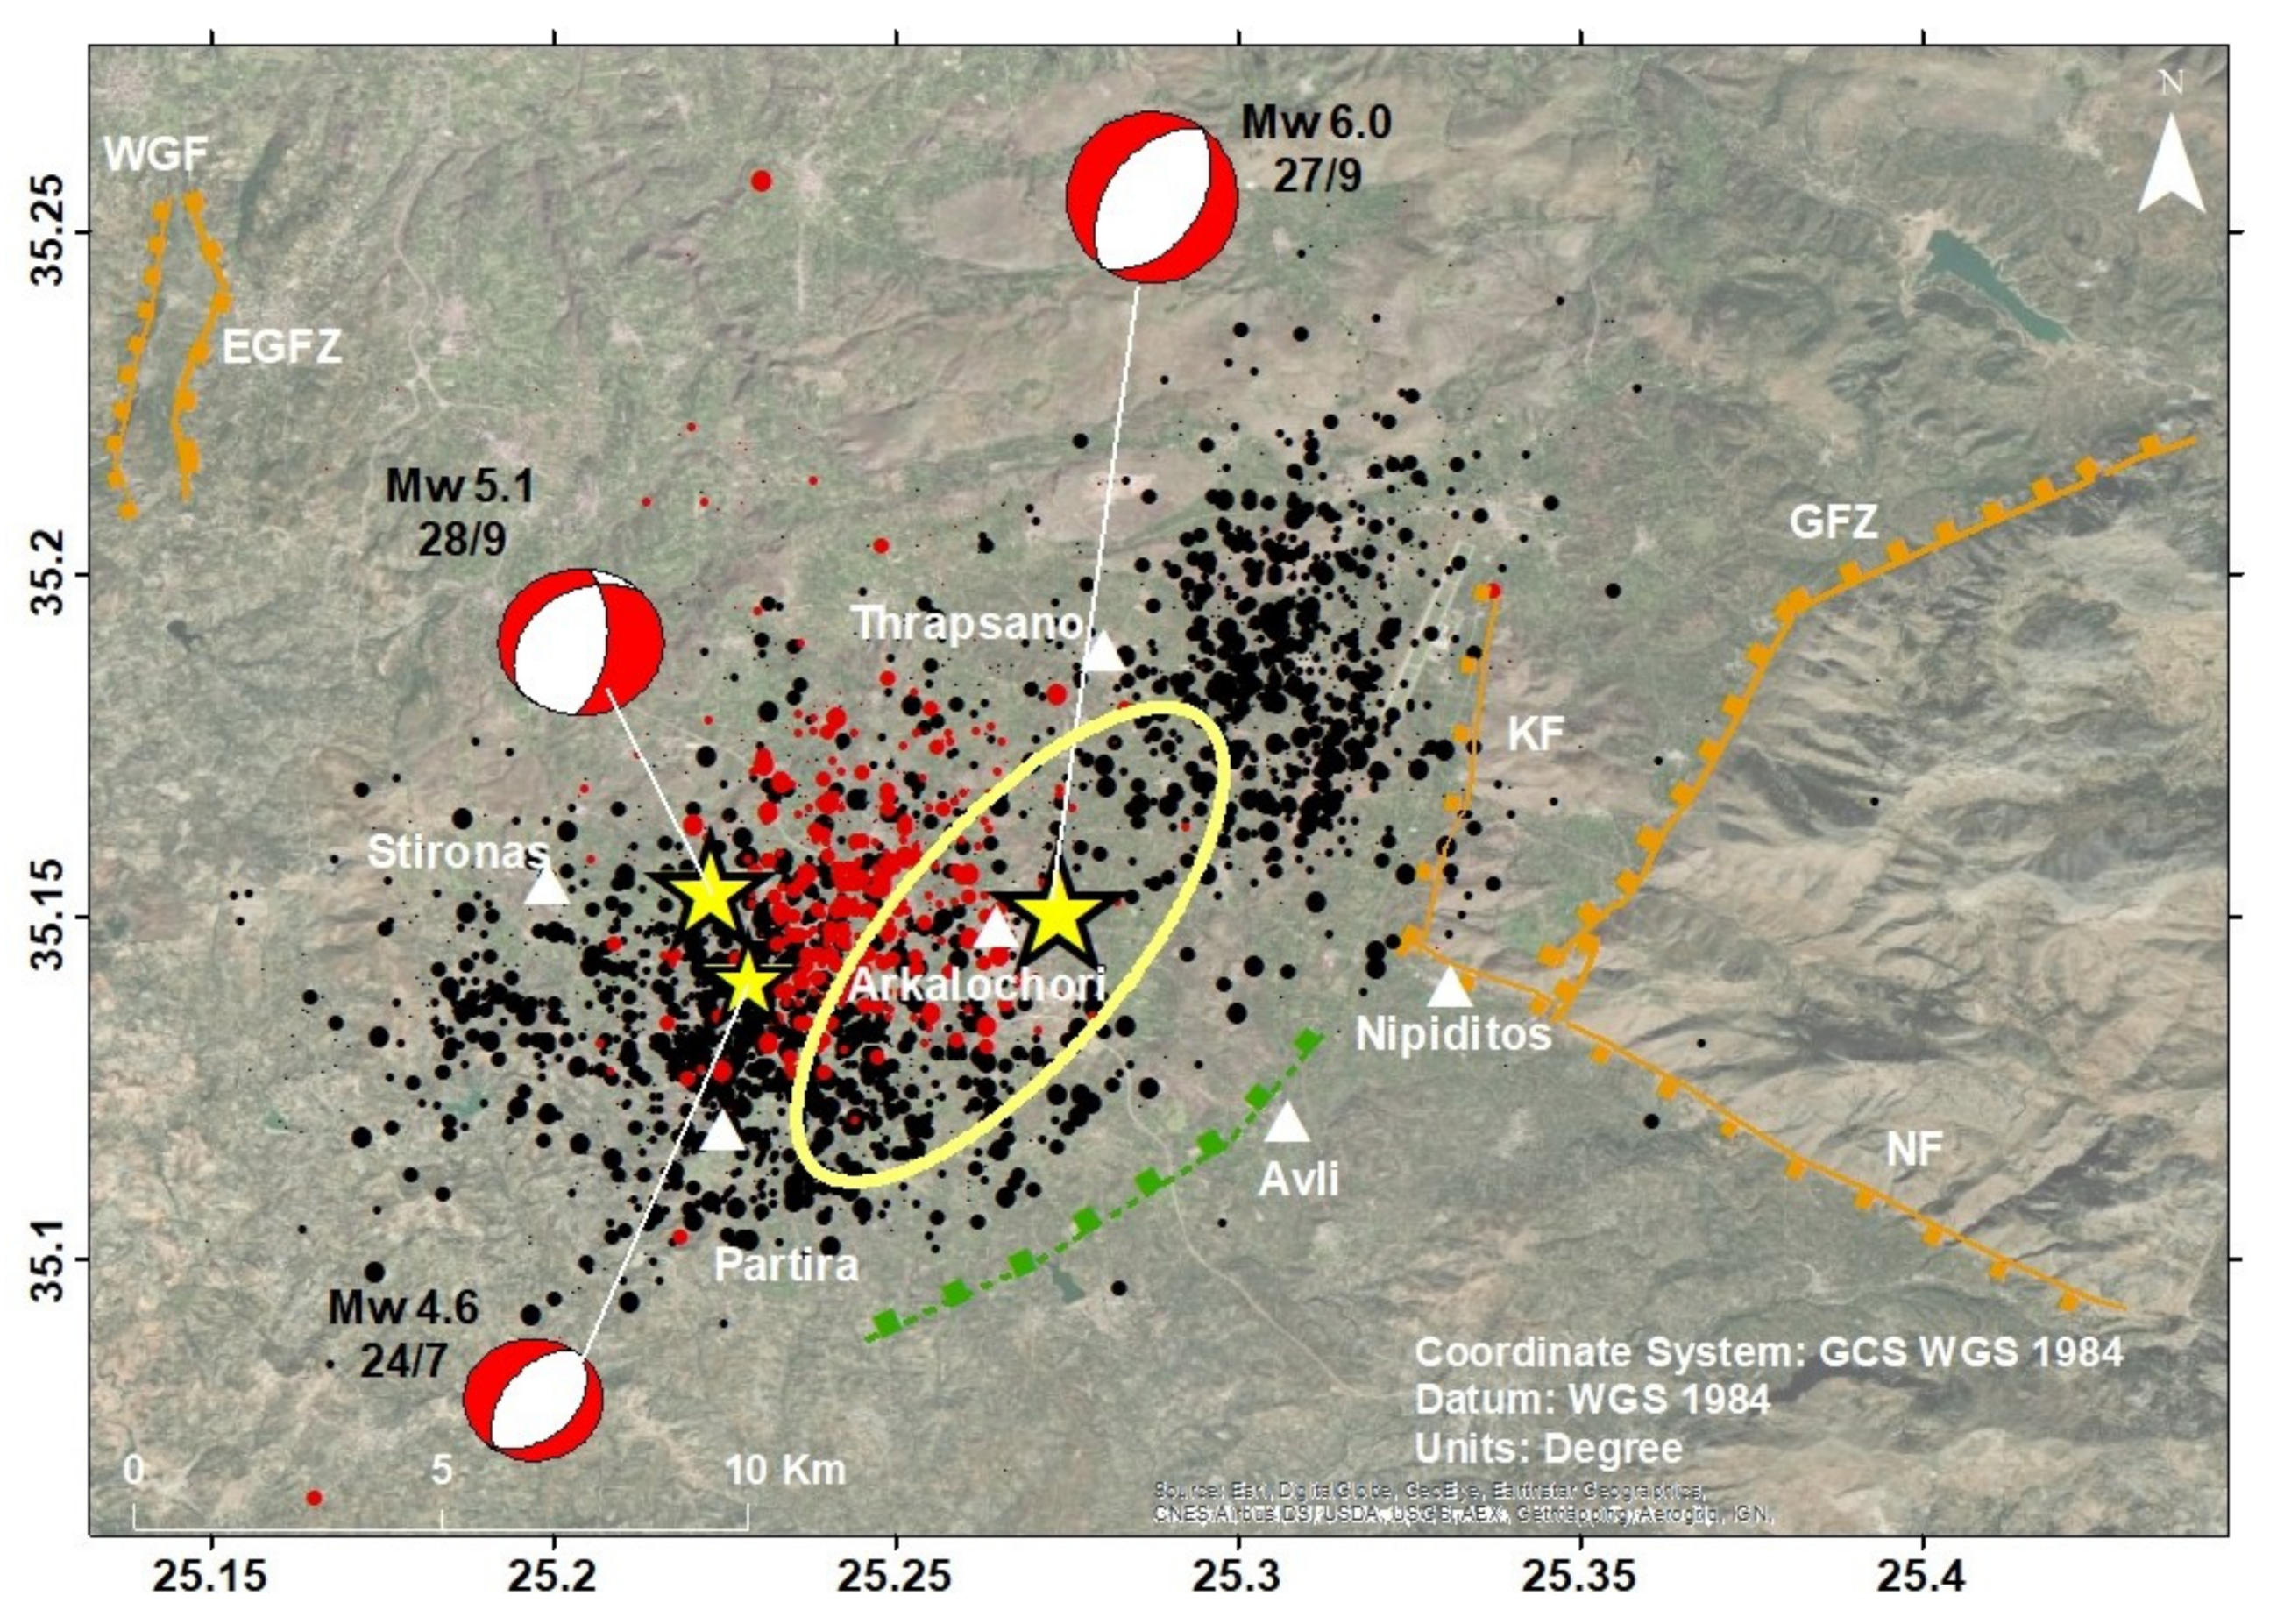
2.2. Fault-Plane Solutions

A compilation of fault-plane solutions produced for the Arkalochori main shock through moment tensor solutions can be found in the EMSC site (Table 2). Although the fault-plane solutions are in general consistent with each other, their similarities and differences are reflected in the average strike, dip and rake (slip vector) calculated for each one of the two nodal planes (NP’s) (Table 2). The fault-plane solutions indicate that the mainshock was associated with normal faulting and only a small strike-slip component was involved. A similar solution is evident for the largest foreshock (Mw4.6) and aftershock (Mw5.1) (Table 2) although, in the latter, the strike-slip component is increased. However, the methods for the determination of fault-plane solutions do not disclose which one of the two NP’s is the true fault-plane. In the absence of surface fault rupture, the geometry and kinematics of the mainshock causative fault were determined from the geodetic ground deformation detected by InSAR images and supported by the spatial distribution of the foreshocks and aftershocks as well as of the geotectonic setting of the area.

2.3. Deformation and Fault Model from InSAR

Synthetic Aperture Radar (SAR) is a powerful remote sensing satellite sensor used for Earth observation [27]. It emits electromagnetic radiation and then coherently records the amplitude and phase of the returned signal to produce images of the ground. Spaceborne SAR interferometry is a technique that produces 3D topographic data of Earth’s surface directly from two SAR images [28]. An extension of the basic technique, called differential SAR interferometry (DInSAR), allows measurements of land deformation very precisely with millimeter resolution. The DInSAR technique is based on the phase comparison of multiple SAR images, gathered either simultaneously or at different times with slightly different looking angles. Phase differences between pairs of SAR images gathered at different times contain a phase term proportional to the target motion occurring along the Line-Of-Sight (LOS) direction during that time interval [29]. Satellite radars are coherent systems, i.e., they acquire both the amplitude data of the electromagnetic field detected (module value) and the information associated with the sensor-target distance (phase value). The capability of SAR interferometry to remotely monitor areas much wider than traditional surveying techniques, without the need to install in situ instrumentation, makes this technique particularly suitable for regional-scale characterization in order to map co-seismic deformation [30,31].
The Sentinel-1 Interferometric Wide-Swath (IWS) Single-Look Complex (SLC) images, used for interferometric applications, consist of three sub-swaths and each sub-swath image consists of a series of bursts. In order to generate interferometric pairs, we used (i) two SAR images both ascending and descending geometries before (primary scene) and after (secondary scene) the earthquake occurrence, and (ii) a Digital Elevation Model (DEM, SRTM-3sec) of our study area. The processing steps included co-registration of the two complex images, interferogram and interferometric coherence generation, interferogram flattening using the SRTM-3sec 90 m DEM, adaptive filtering/estimation and generation of phase unwrapping, phase to displacement and geocoding. These steps were performed with the use of the ENVISARscape® software (L3Harris Geospatial, Boulder, CO, USA) ascending and descending geometries. DInSAR displacement map in LOS was only able to measure the path length difference between the earth surface and the satellite. This is the characteristic limitation of SAR sensors. In order to record the vertical (up-down) and horizontal (east-west) deformation, displacement decomposition of ascending and descending LOS displacement products was carried out.
To analyze the co-seismic ground deformation caused by the 27 September 2021 earthquake we used twin mission Sentinel 1 A and B images. These are available for free in medium resolution form [32]. The two interferometric pairs created from the two different geometries of the ascending and descending orbit of the satellite are composed by the next scenes: (i) primary 18 September 2021 and secondary 30 September 2021, track 109, in descending geometry of acquisition, and (ii) primary 23 September 2021 and secondary 29 September 2021, track 102, ascending geometry. Copernicus Sentinel-1 SAR scenes, at C band of microwaves, are available freely from the Sentinel Hub portal (https://scihub.copernicus.eu/dhus/#/home; access date 10 October 2021) and provide improved SAR SLC data covering the above-mentioned periods assuring: (a) continuous, all-weather day and night imagery, (b) rapid revisit period in the same imaging mode (6 days), (c) constant and regular acquisition to build a large global archive, and (d) wide area coverage thanks to the 250 km image swath width.
As a final step, geophysical modeling of the seismic fault based on the Okada [33] formalism was generated, using the geodetic data derived by LOS ascending and descending displacement products. A number of sampled points from the raster displacement DInSAR maps were used in order to generate the modeled co-seismic signal through Non-Linear and Linear inversions, thus allowing inferring the geometry, kinematics and slip distribution in the seismic fault.

2.4. Foreshocks and Aftershocks

The 27 September 2021 mainshock came after a space–time seismicity cluster, which lasted for nearly four months. Based on the seismicity analysis of the area we support that the cluster preceding the main shock was a sequence sharing the two main properties characterizing foreshocks, i.e., high seismicity rate and low b-value. Given that other types of earthquake sequences, such as aftershocks and swarms, are also characterized by high seismicity rates, the b-value is of fundamental importance for the discrimination of foreshocks from other types of earthquake sequences. In background seismicity, the b-value usually equals ~1 [34,35]. It has been found that in foreshocks the b-value is lower than aftershocks, in swarms and background seismicity [35,36,37,38,39,40,41,42,43,44,45].
The parameter b is the slope of the frequency-magnitude distribution (FMD), known as G-R law [46], which is expressed by the formula (1):
logN = α − bM
N is either the discrete frequency of magnitudes M in each magnitude bin or the cumulative frequency of magnitudes ≥M; α, b are parameters determined by the earthquake catalog data, where b expresses the relative number of the small magnitude earthquakes to the large magnitude ones and α is a measure of the seismicity level. In terms of geophysics, the b-value is considered as a stress meter e.g., [35]. In this context, low b indicates high material heterogeneity and concentrated stress while high b implies asymmetrically distributed stress.
In this context we investigated the foreshock nature of the space–time cluster preceding the 2021 mainshock and its discrimination from the background seismicity period. The cluster was characterized by a drastically increased seismicity rate since the beginning of June 2021. The background seismicity was considered for the area extending from 34.95° N to 35.34° N and from 25.02° E to 25.45° E (Figure 4). To secure homogeneity of the seismicity catalog we analyzed background seismicity for the period extending from 1 January 2011 until 31 May 2021. Seismicity data for the foreshocks, the mainshock, the aftershocks as well as for the background seismicity period have been retrieved from the earthquake catalog of the National Observatory of Athens (NOA, http://www.gein.noa.gr/en/seismicity/earthquake-catalogs; last access 9 December 2021), which lists the results of the daily routine seismicity analysis. In this catalog, the earthquake magnitude is given in scale of local magnitude, ML. Moment magnitudes have been also determined but only for a few strong shocks of magnitude over 4.5.
Calculations of the b-value and of the seismicity rate, r, have been performed for complete segments of the earthquake catalog which lists ML magnitudes. The completeness magnitude threshold, Mc, and the respective b-value in a catalog segment were estimated with the Maximum Curvature (MAXC) technique [47,48], which is incorporated in the z-map toolbox for seismicity analysis [49]. The seismicity rate was calculated from the formula (1), which provides rate calculations nearly identical with calculating the mean number, n, of earthquake events occurring in a given time interval, t, expressed in days: r = n/t (events/day). The dimensions of the aftershock area are useful to interpret the seismotectonics of the mainshock and to calculate stress drop. Empirical formulas connecting the length, L (km), and lateral width, W (km), of the aftershock area were calculated from the empirical relationships (2) and (3), which have been found for earthquakes in the Mediterranean region [50]:
logL = −1.49 + 0.47Mw
logW = −1.07 + 0.34Mw

2.5. Stress Drop

The stress drop is an important parameter of the seismic source since it shows the difference between the shear stress before the seismic slip episode and after the slip has terminated. Μost earthquakes have Δσ in the range from 10 to 100 bars, with intraplate and interplate earthquakes trending toward the higher and lower ends of this range [51]. However, the stress drop of Greek and other Mediterranean earthquakes, calculated by several methods and for a wide magnitude range from about 1 to 7.5, is relatively low varying from about 1 to 30 bars [52,53,54,55,56,57,58,59]. The stress drop associated with the 2021 Arkalochori mainshock has been calculated from the seismic fault dimensions based on the InSAR fault model and on the aftershock area. The stress drop averaged over the fault is approximated by:
Δσ = μ · D/L
where μ = shear modulus, D = average slip on the fault plane and L = length of the fault plane. It has been shown (see review in [60]) that for a circular fault model with seismic moment Mo and radius R the stress drop is:
Δσ = 7/16 (Mo/R3)
On the other hand, for a rectangular fault model, for dip-slip faulting and under the assumption that the Lamé constants are λ = μ, we get:
Δσ = 8/3π (Mo/W2L)
where W is the fault width and π = 3.14 is a constant.

3. Results

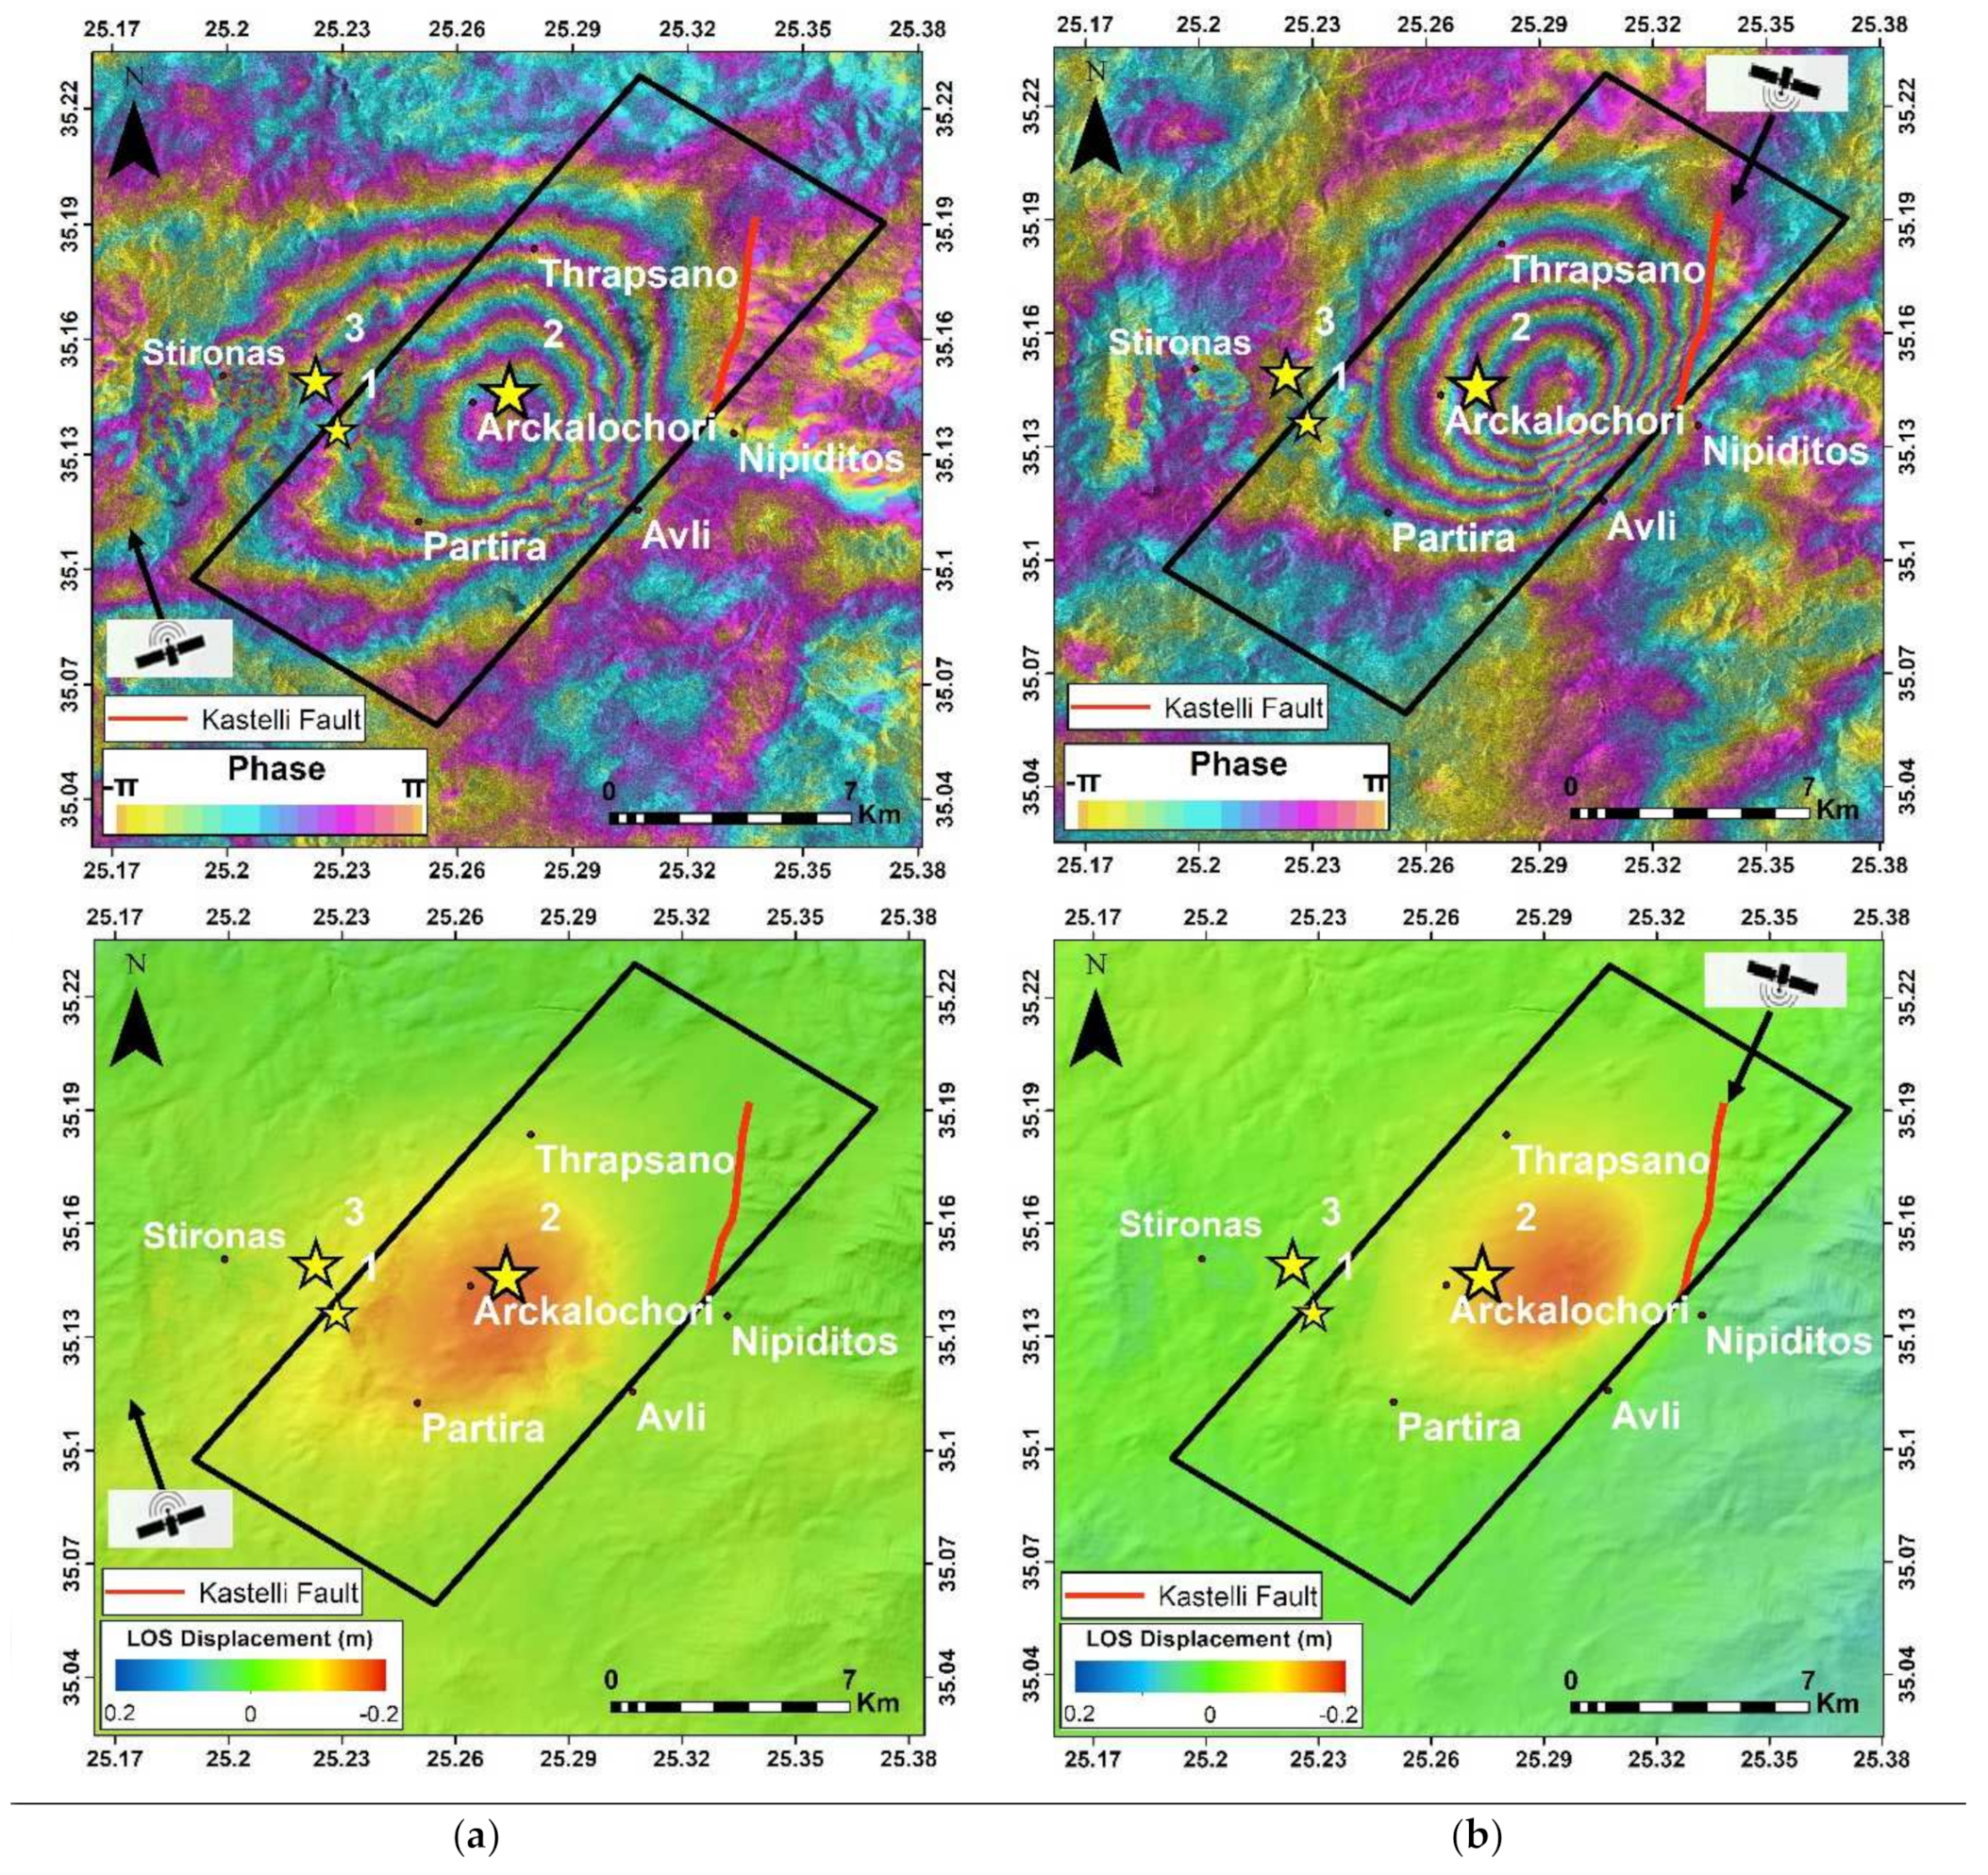
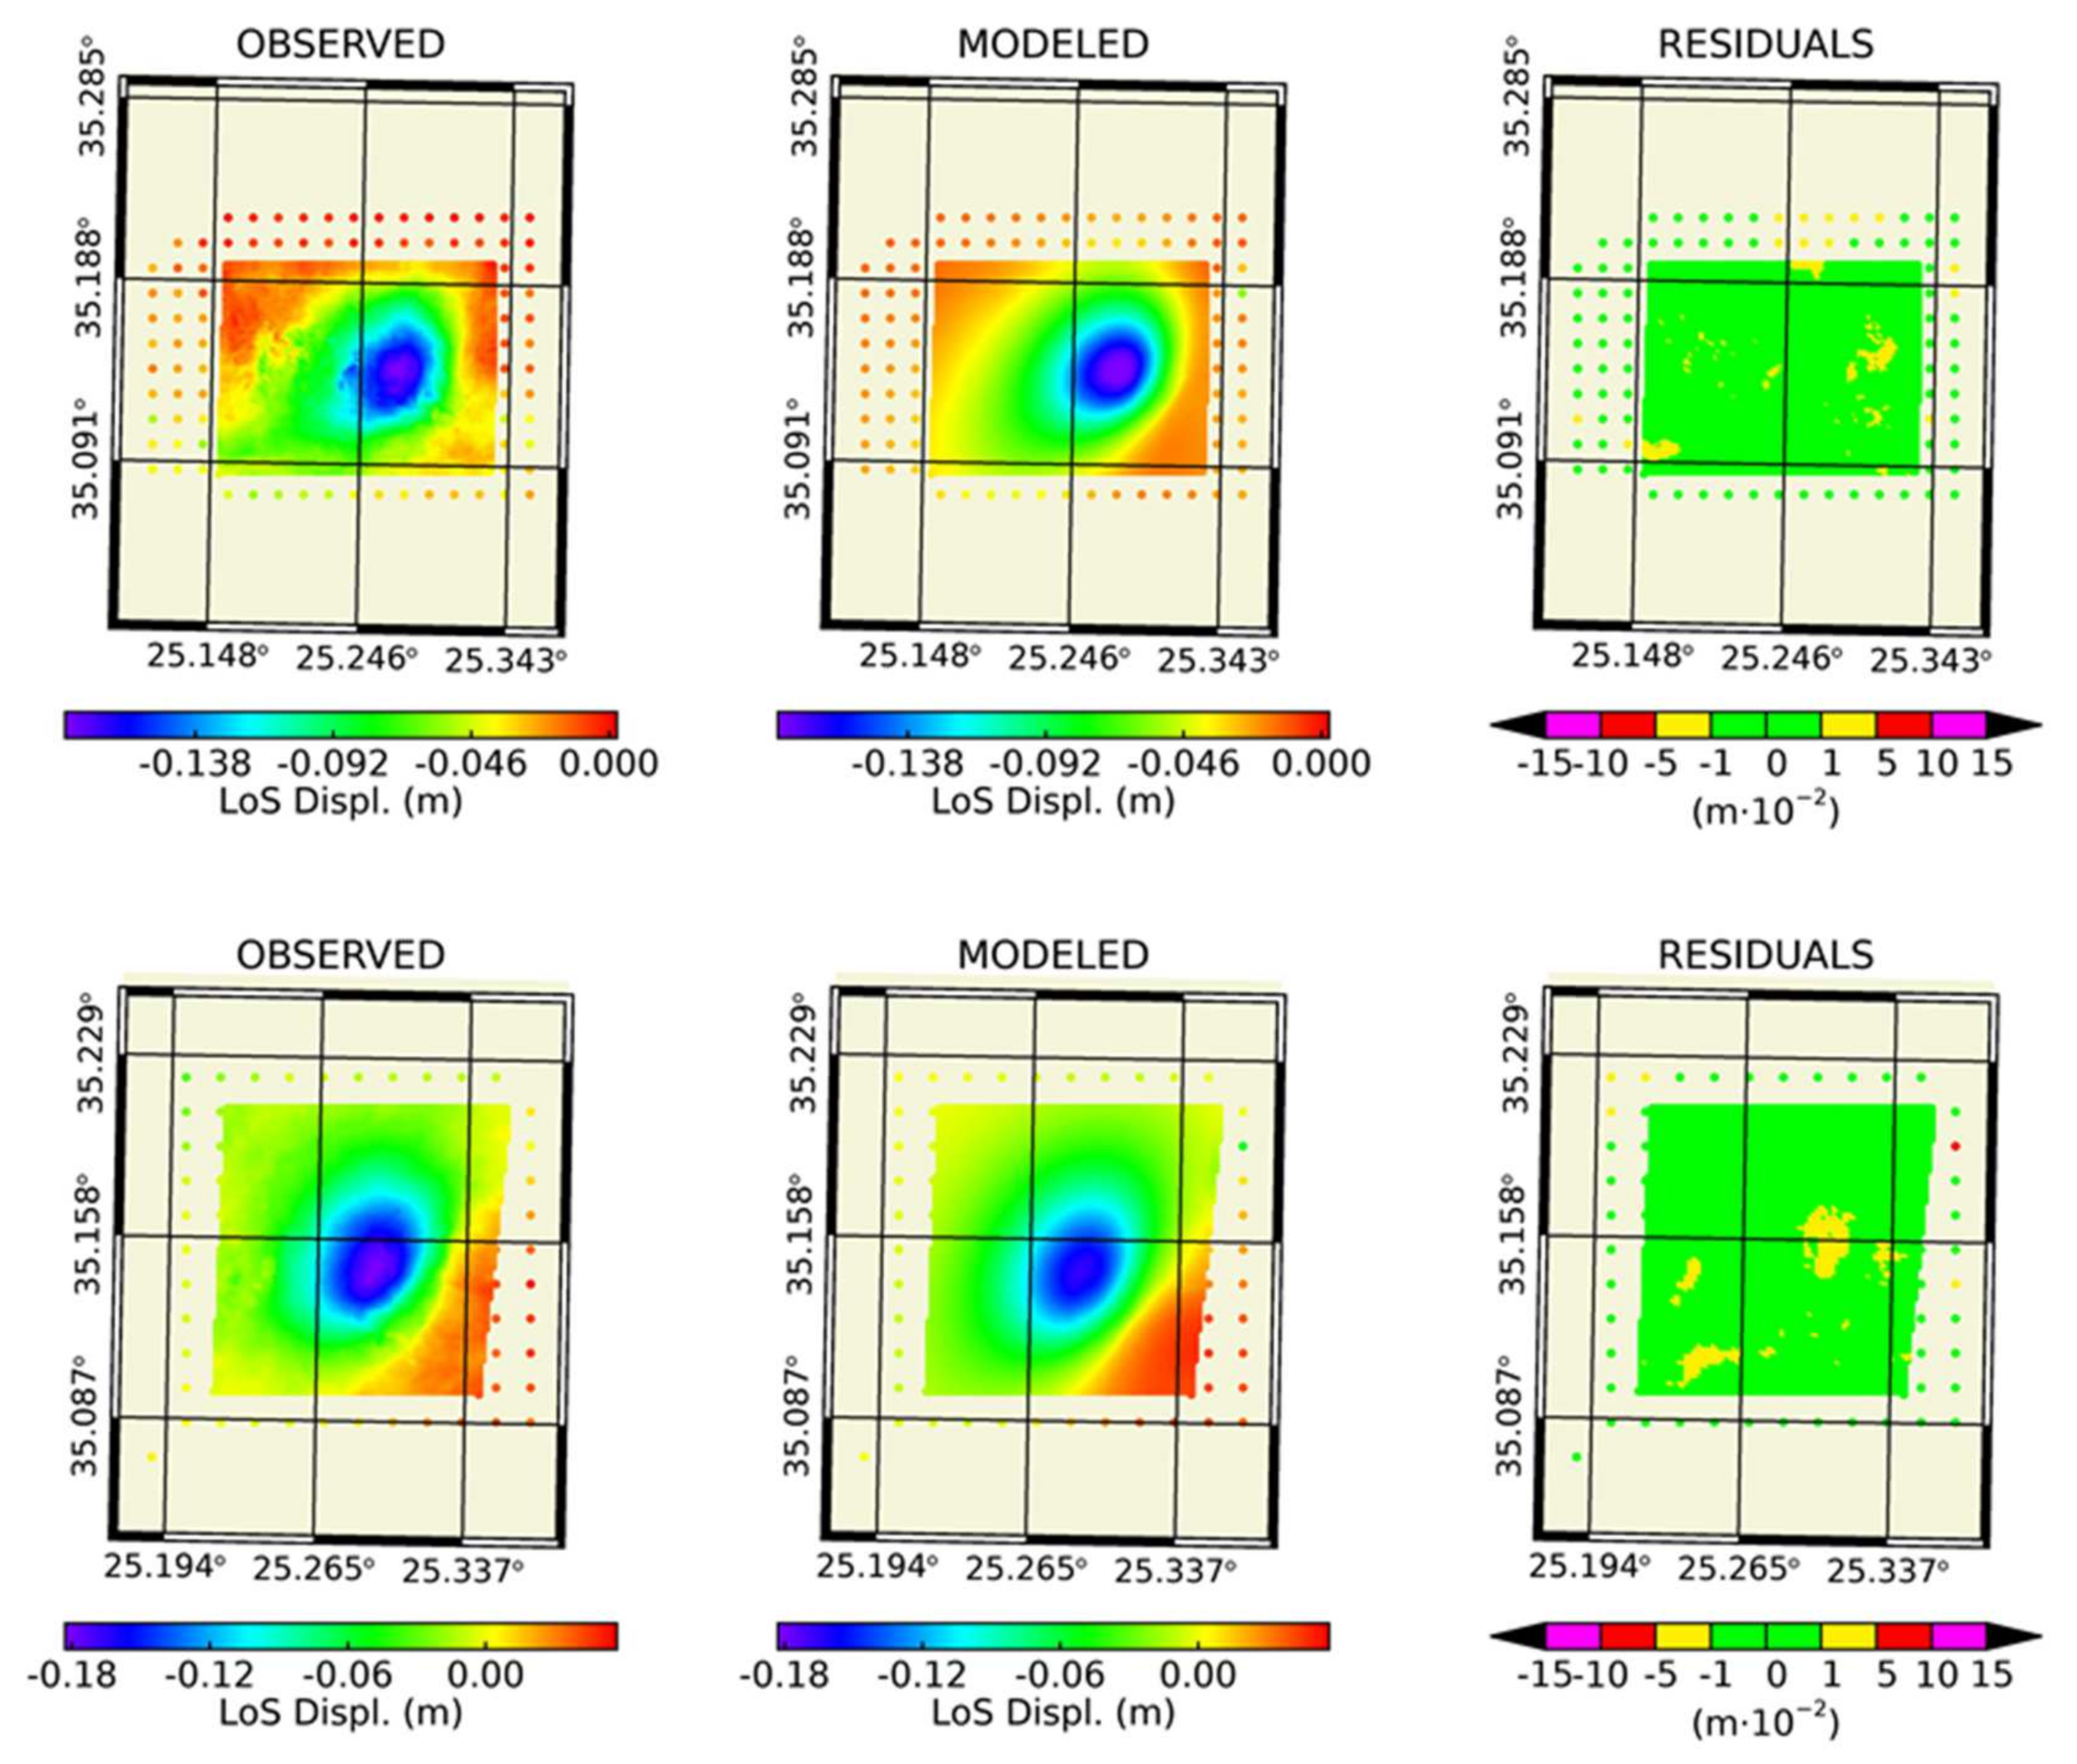
3.1. Ground Deformation from INSAR

The ground deformation caused by the earthquake of 27 September 2021 is displayed in wrapped interferograms and displacement maps in LOS (Figure 5) as well as in vertical and east-west decomposed displacement maps (Figure 6). During the unwrapping step of processing the wrapped interferometric phase was converted to a displacement map in LOS. In this study, the Minimum Cost Flow (MCF) algorithm was used e.g., [61]. A comparison of LOS displacements from the observed and modeled data indicates low residuals for both the ascending and descending geometries, particularly for the former one (Figure 7).
A clear pattern of five fringes forming a relatively small lobe of subsidence is evident in both the wrapped ascending and descending interferograms (Figure 5). From the LOS displacement maps, a ground displacement up to −18 cm has been estimated. Subsidence up to −22 cm has been estimated from the displacement decomposition in the vertical (up-down) direction (Figure 6). However, no uplift displacement was detected. According to the horizontal (east-west) displacement map (Figure 6), a pattern is evident showing an eastward movement (blue color) up to 14 cm to the west of Arckalochori town and westward movement (red color) up to 7 cm to the east of Arckalochori. The horizontal displacement could be attributed to horizontal motion caused by the strike-slip component involved in the focal mechanism of the mainshock.

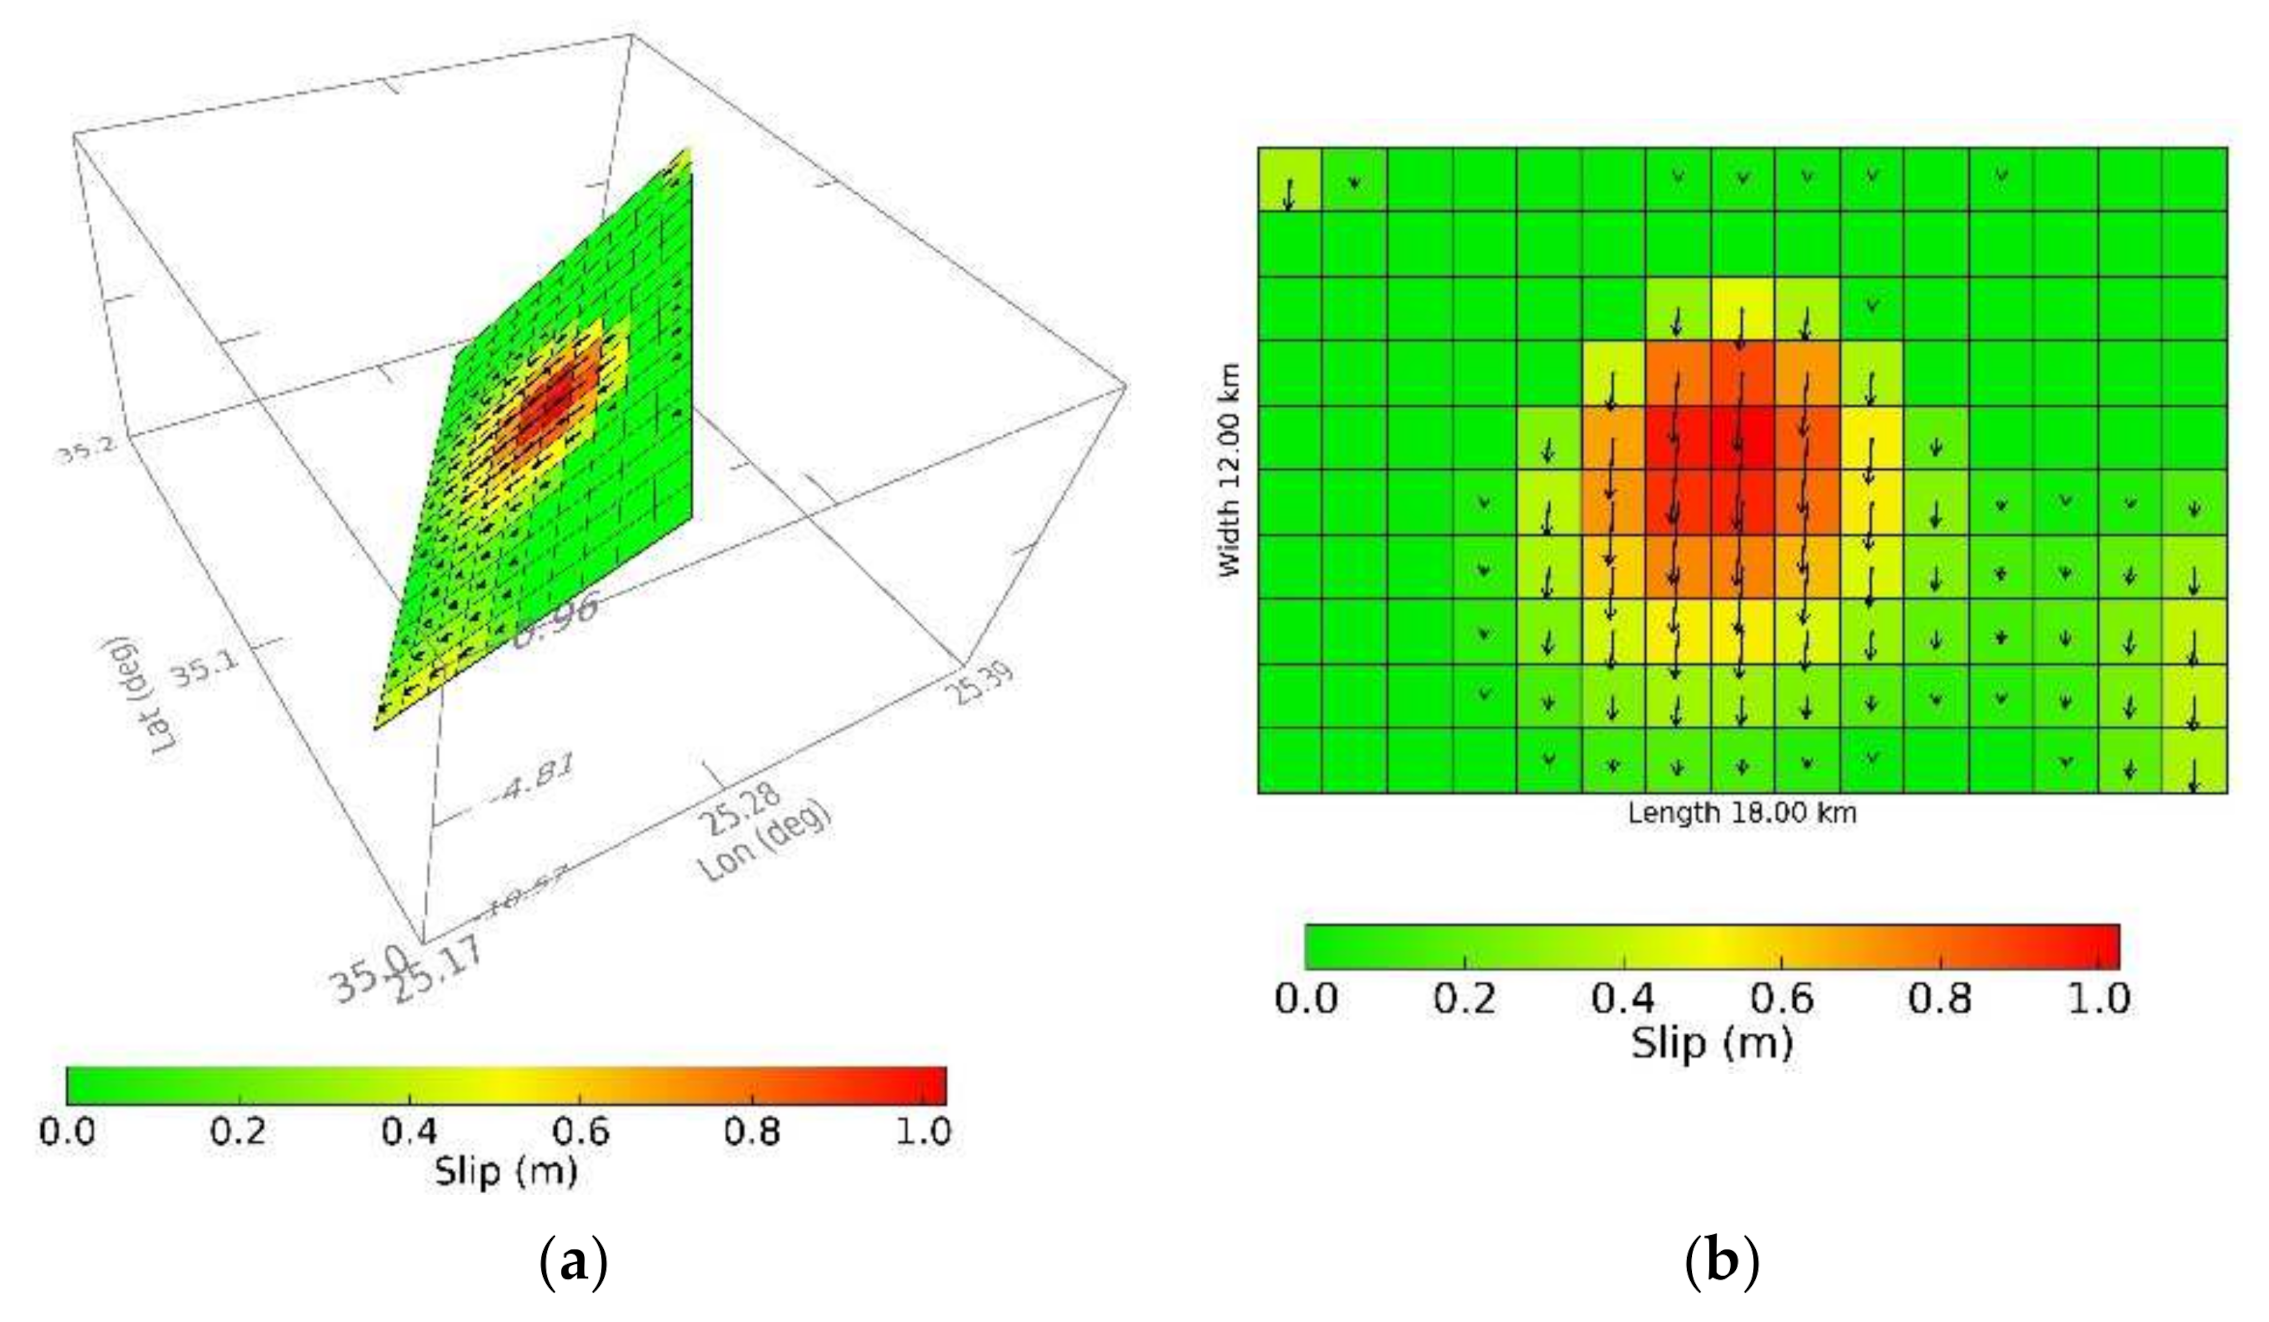
3.2. Fault Model from INSAR Inversion
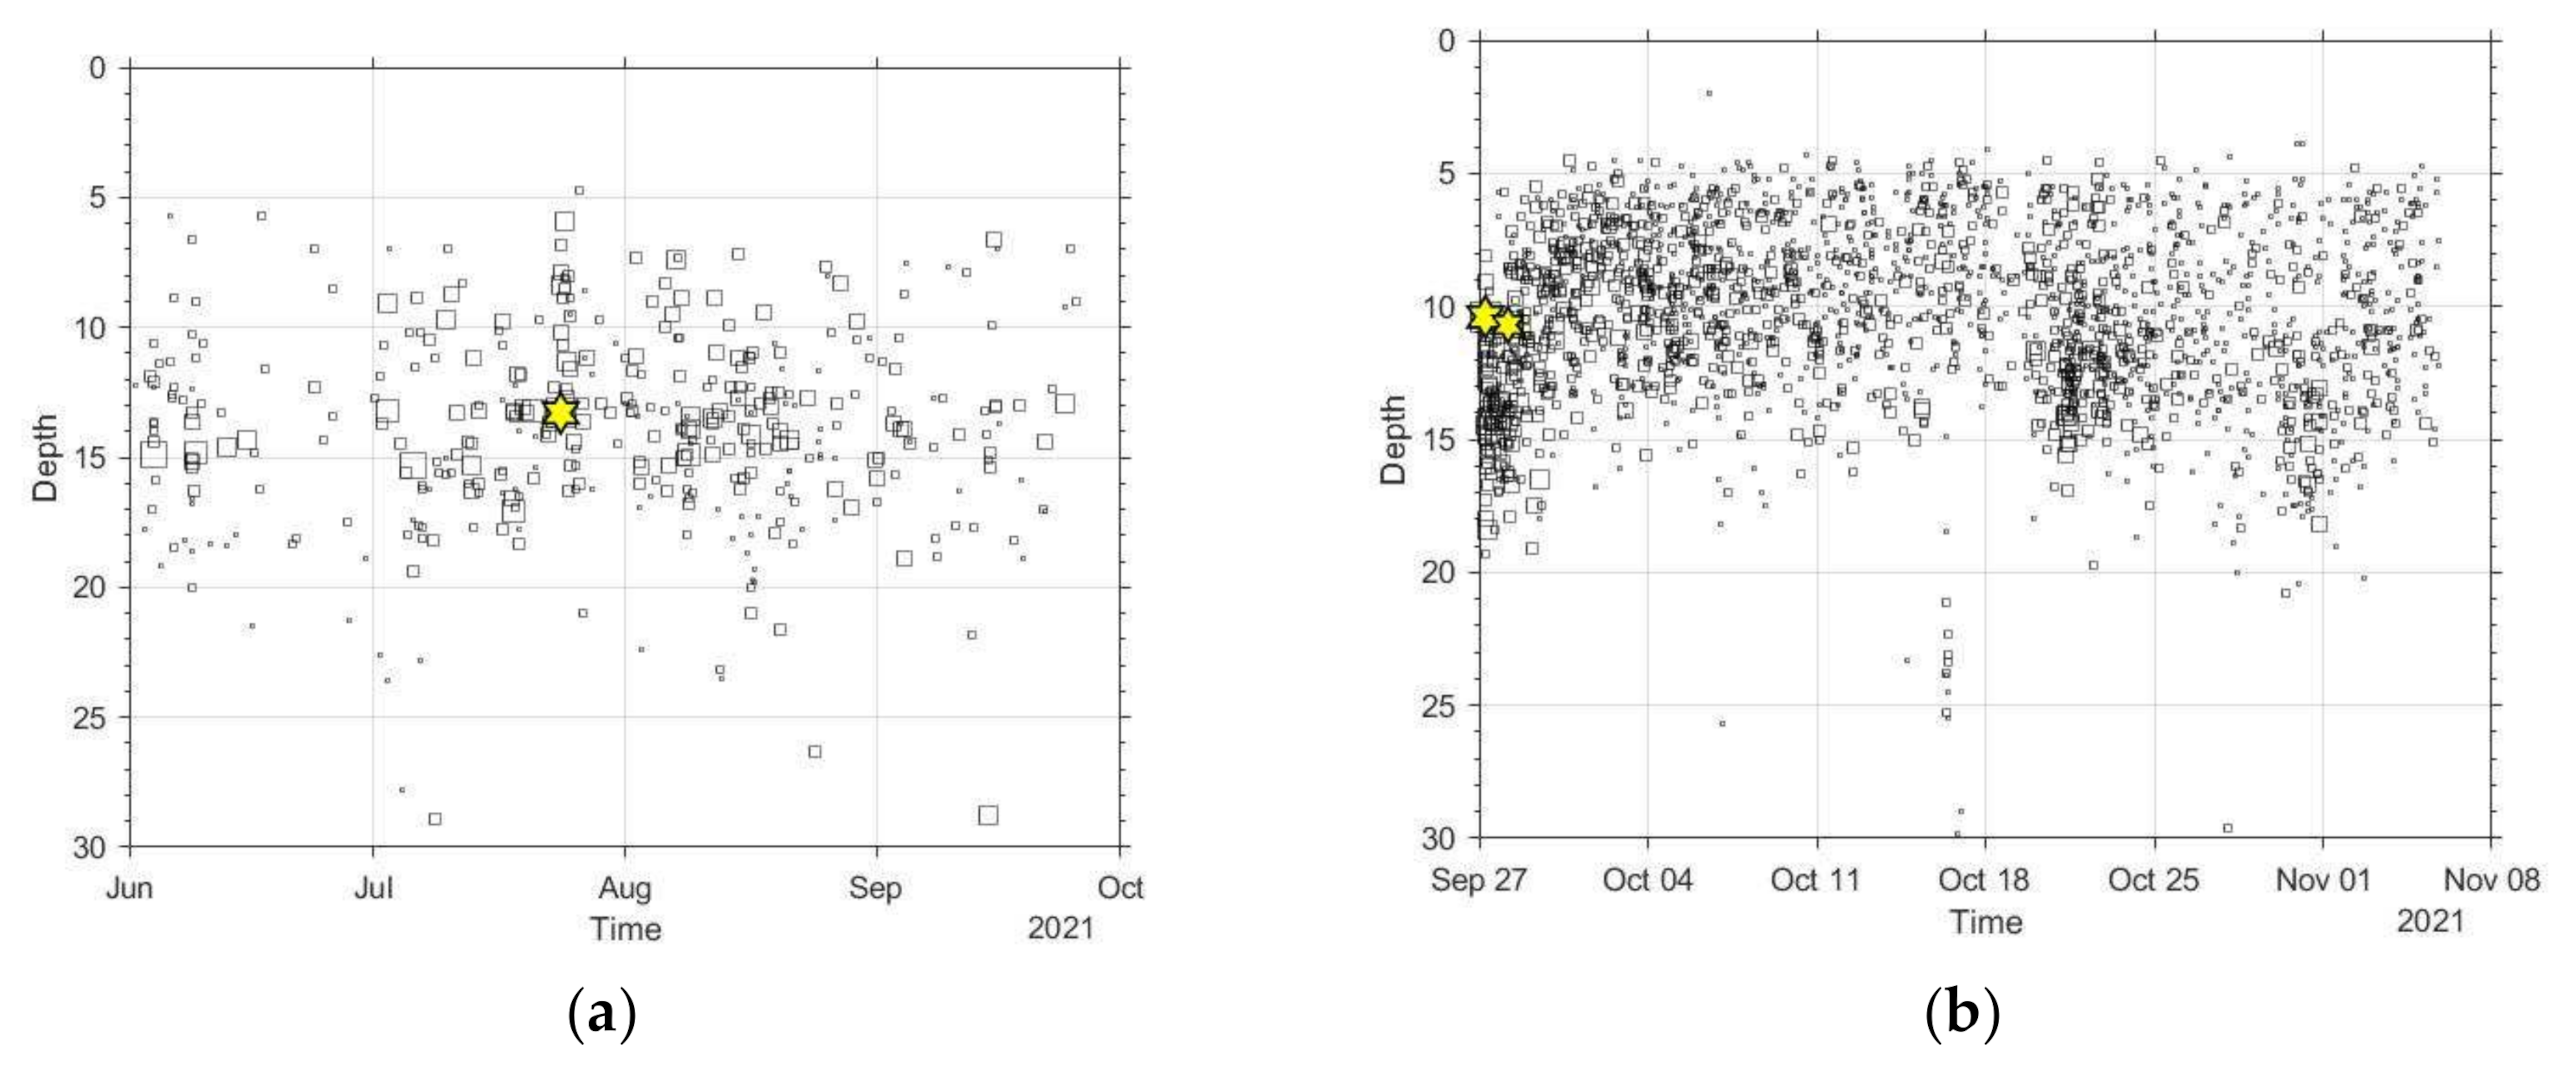
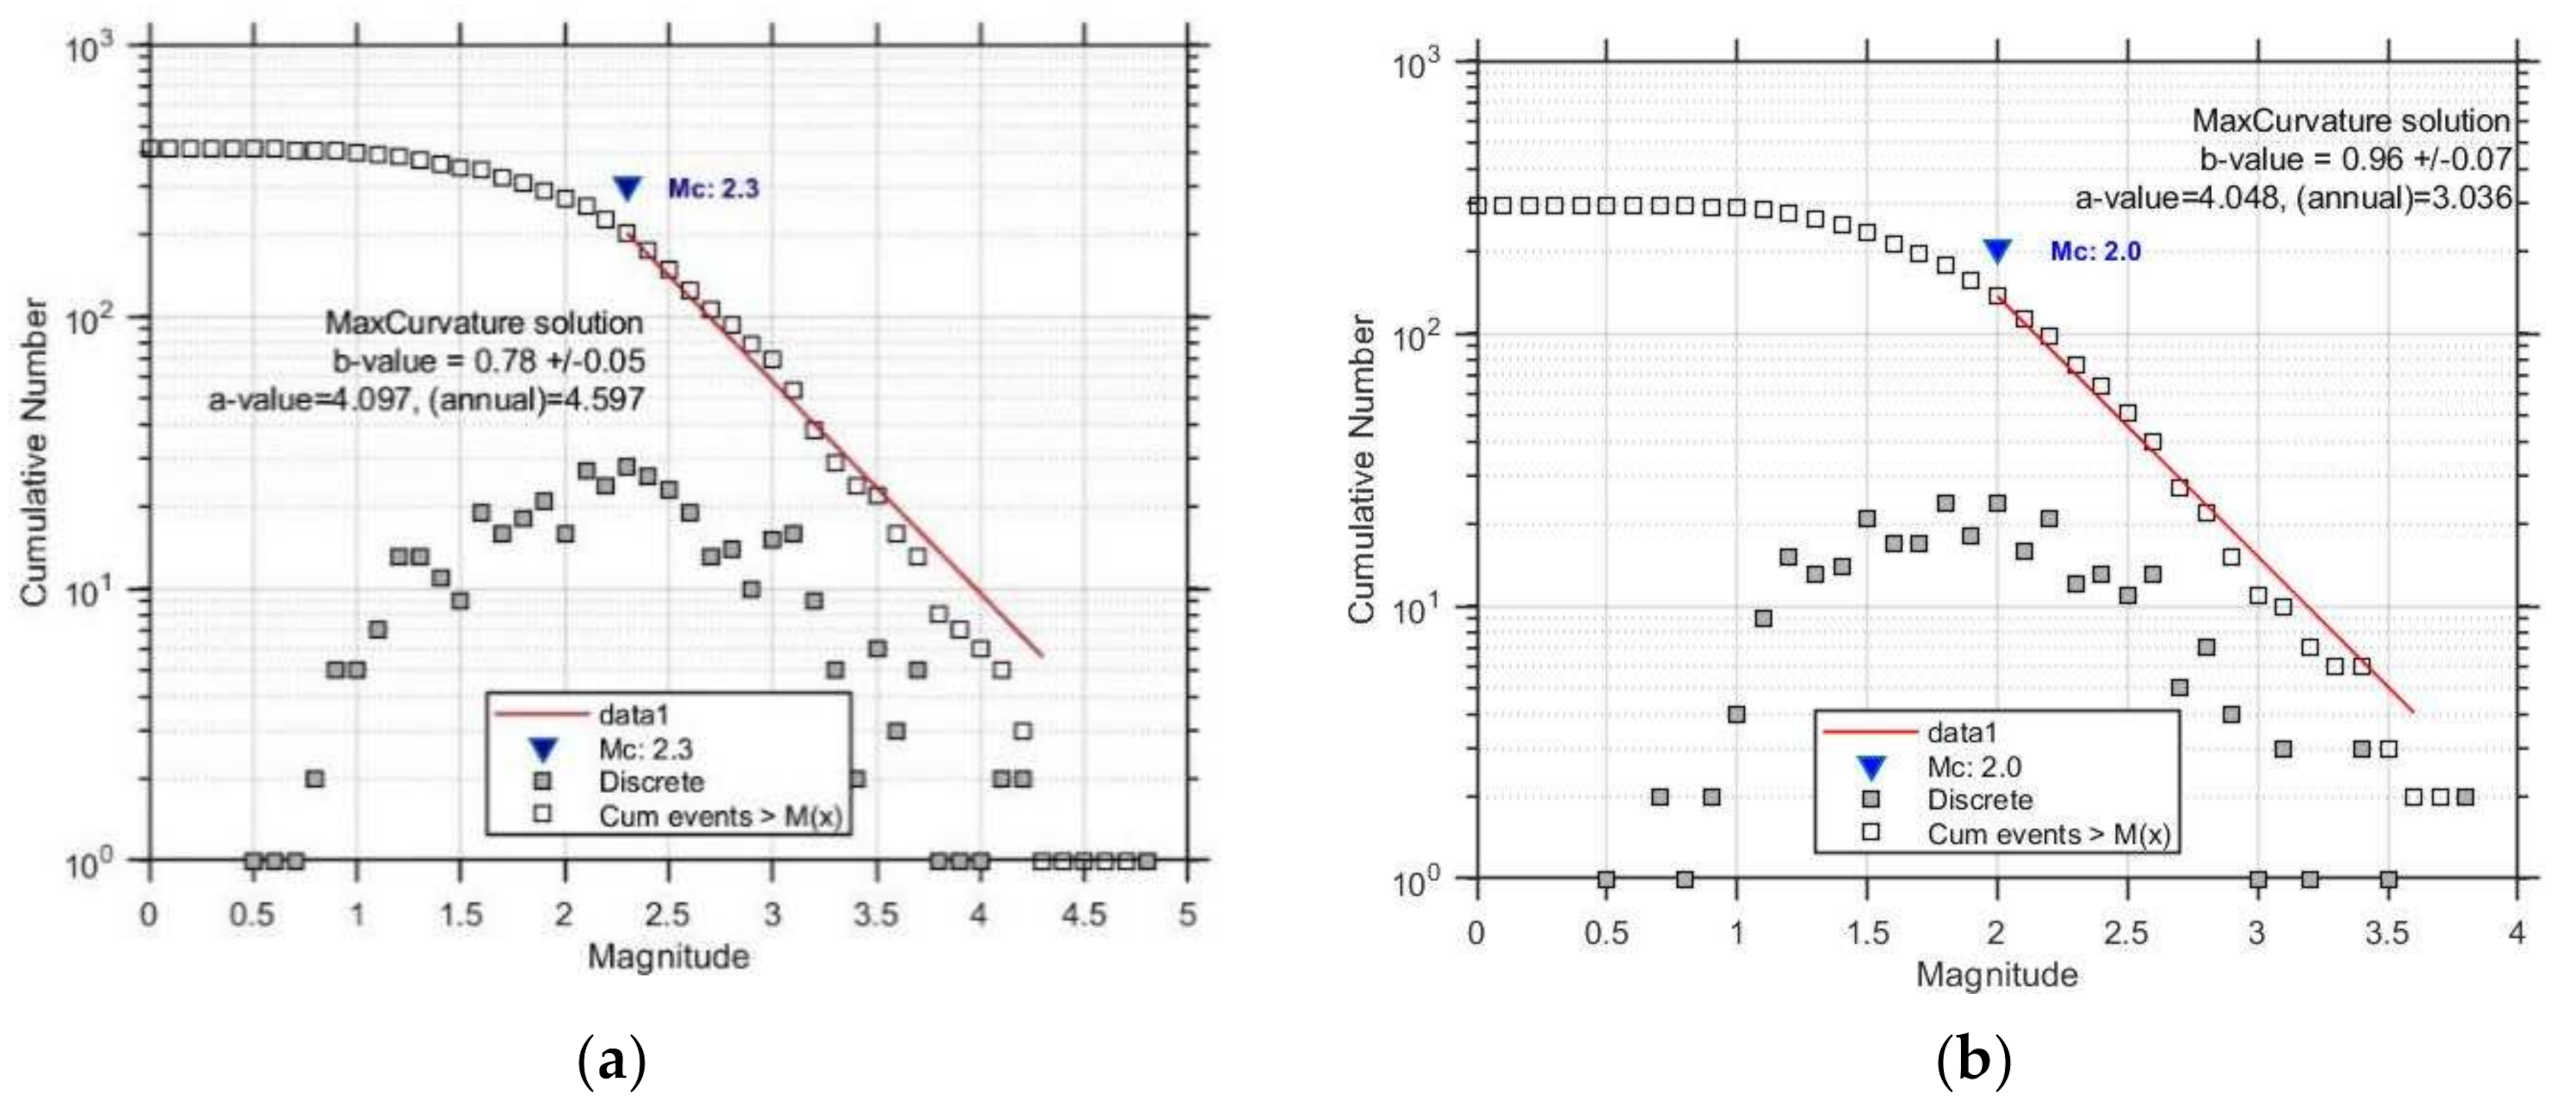
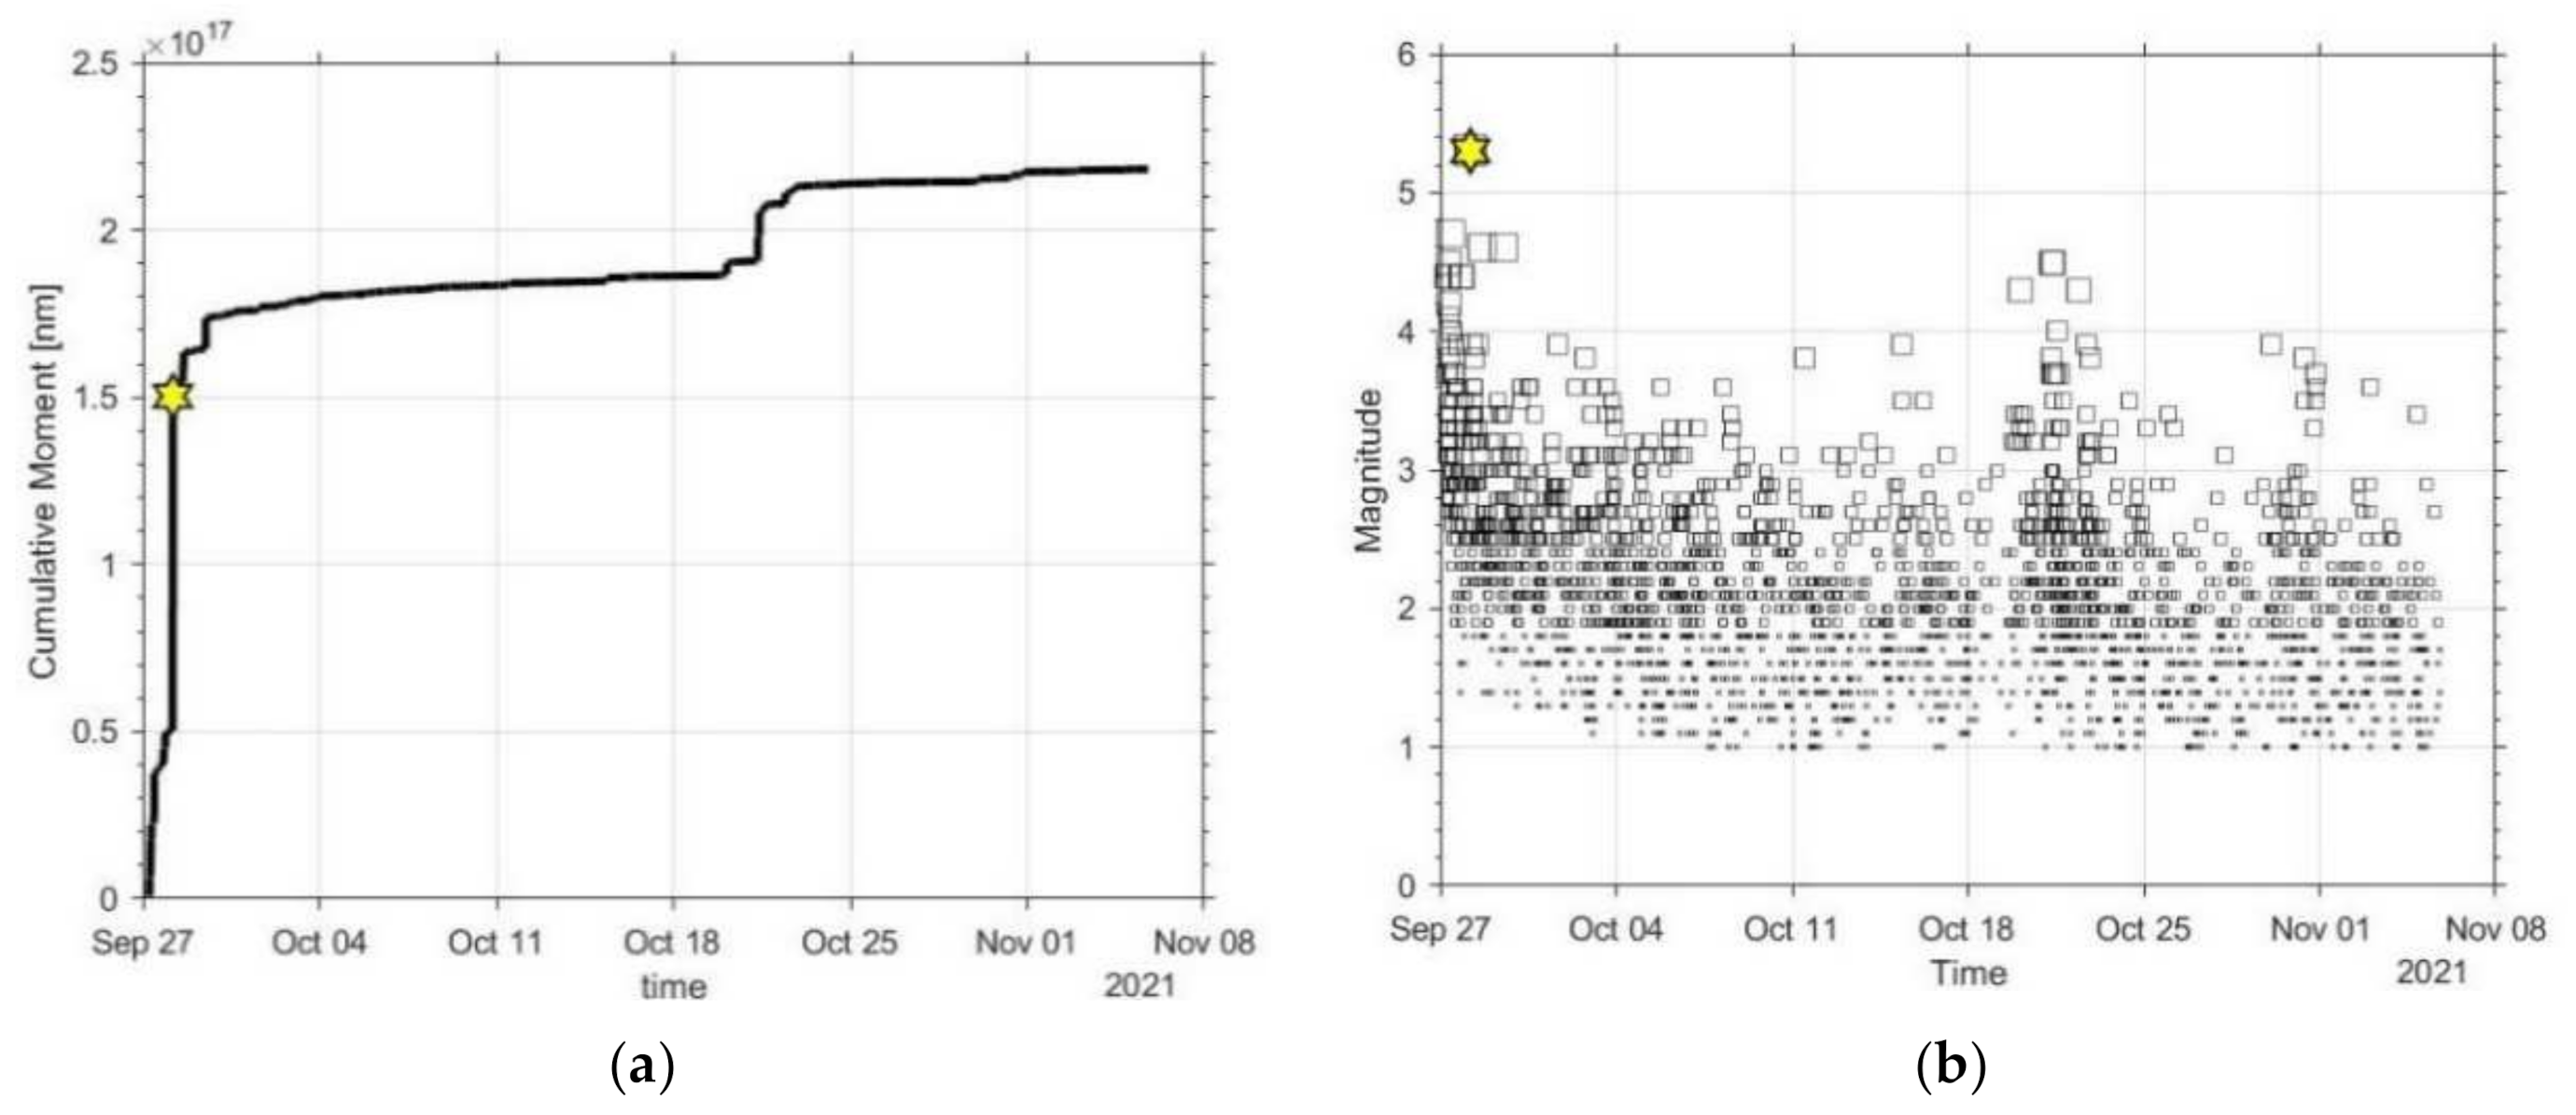
The best-fit geodetic source solution determined for the earthquake of 27 September 2021 (Figure 8) from the inversion of InSAR observations provides a seismic fault dipping to ~NW with strike SW-NE (216°), dip angle 53° and rake −95° (Table 3). This solution is consistent with the NP2 of the fault-plane solution obtained from moment tensor analysis (Table 2). The geodetic seismic moment calculated through the Okada formalism [33] results a seismic moment equal to 1.14 × 10¹⁸ N·m, which corresponds to earthquake magnitude Mw6.0. This is coincident with the magnitude determined from seismic methods. The main seismic slip patch ranges in depth from 2.5 to 10 km but the maximum slip of 1.03 m occurred at a depth range from ~3.5 km to 5 km, which is close to the centroid depth of 6 km determined by NOA (https://www.emsc-csem.org/#2; last access 17 December 2021). The seismic slip pattern indicates a circular source with a radius R ≈ 4.5 km. From a worldwide empirical relationship (7) among magnitude and subsurface rupture length (SRL) for normal faulting [62] we get Mw = 5.8 for SRL = 9 km:
Mw = 4.34 +1.54 ·log(SRL)

3.3. Foreshocks

In the Arkalochori area, the increased activity started on 1 June 2021 and continued until the noon of 25 September 2021 (last event on 13:11:13.0 UTC). It is evident that a lull of activity was noted about the last two days preceding the mainshock. The largest foreshock of Mw4.8 occurred on 24 July 2021. Spatially the foreshock activity concentrated in a relatively small area covering only partly the area that was later occupied by the southern aftershock cluster (Figure 4) and the geodetically determined deformation area (Figure 5). The spatial distribution pattern of the foreshocks illustrated in Figure 4 very likely is not an artificial one given that the RMS of the foreshocks epicenters determination was found equal to 0.16 ± 0.01, which is relatively small. As we will see later the foreshock’s RMS value equals that found for the aftershocks. The foreshocks’ focal depths ranged between 5 and 20 km with an average of 10.6 ± 2.3 km (Figure 9a). The same focal depth range was found for the aftershocks (Figure 9b).
From the application of the MAXC technique in the earthquake catalog covering the time period from 1 June to 25 September 2021 we found Mc = 2.3 and b = 0.78 ± 0.05 (Figure 10a). However, for the background period, which extends from 1 January 2011 up to 31 May 2021 and is characterized by the occurrence of only small magnitude earthquakes (ML < 4.0), we found Mc = 2.0, b = 0.96 ± 0.07 (Figure 10b). For a common lower magnitude threshold of Mc = 2.3 the seismicity rate was found r = 1.72 events/day for the foreshock period and r = 0.02 events/day for the background period. The simultaneous drastic increase of r and drop of b leave no doubt that the intense seismic activity preceding the main shock was a typical foreshock sequence that lasted for about 3.9 months.

3.4. Aftershocks

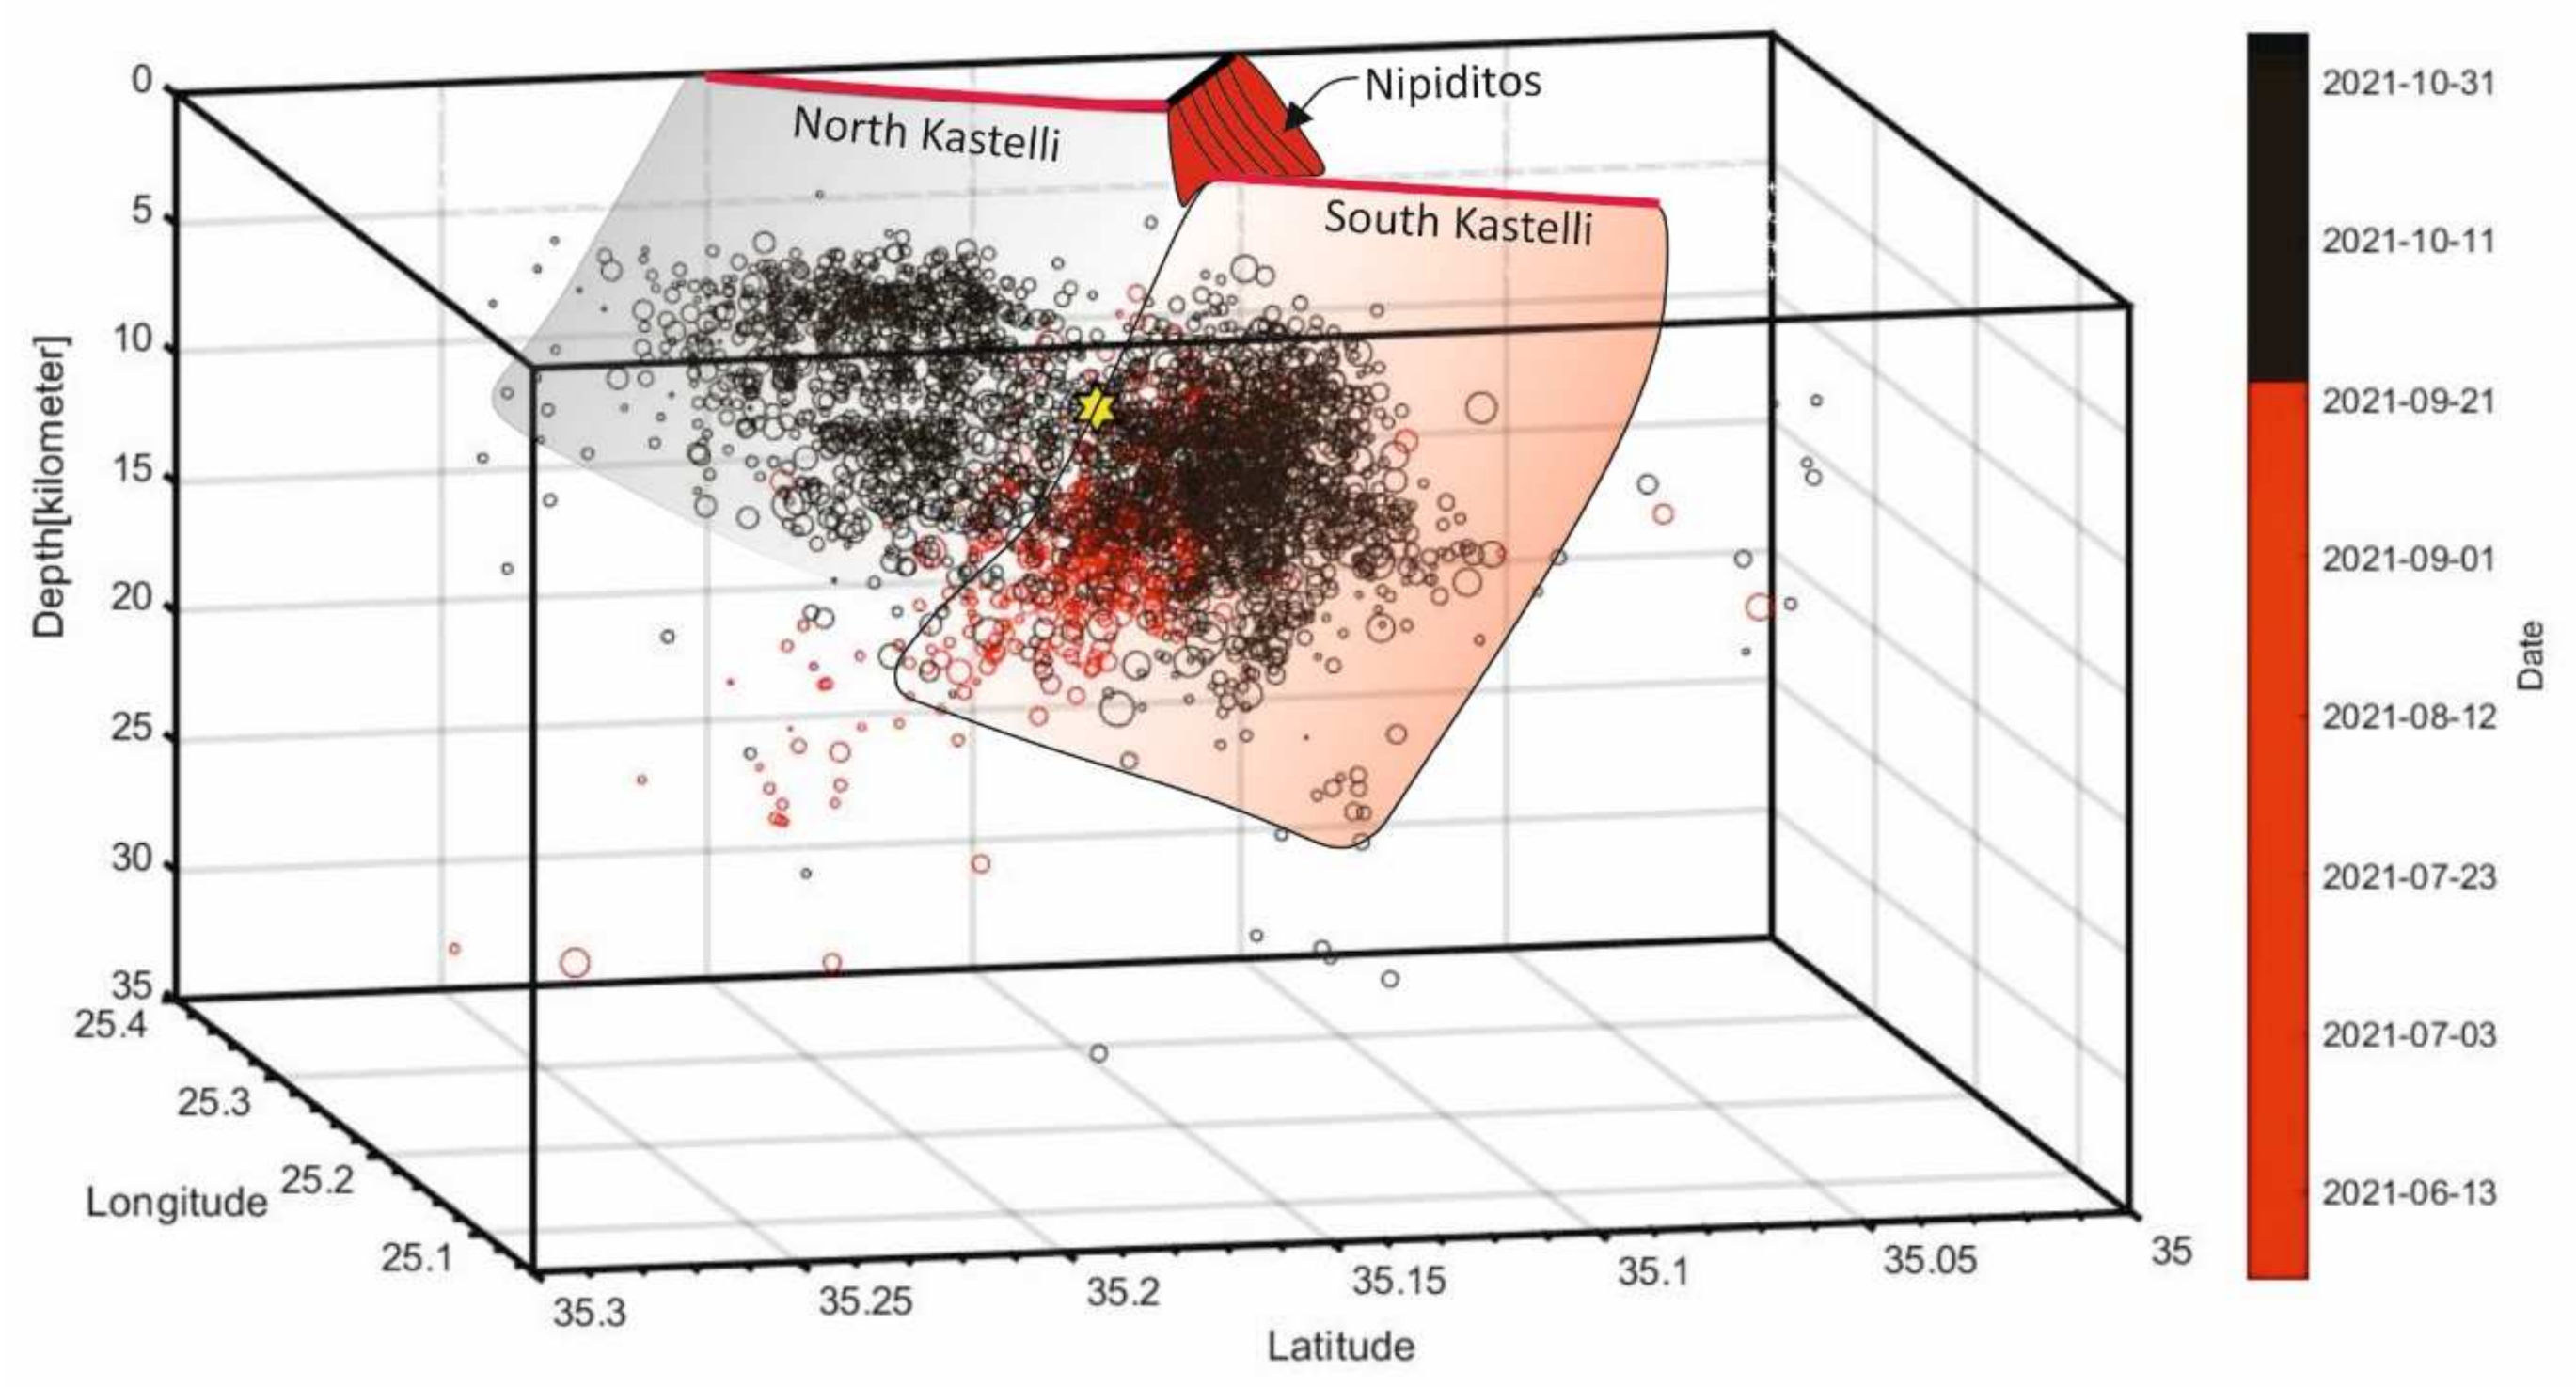
Aftershock Spatial Distribution

The determination of epicenters of aftershocks that occurred up to 5 November 2021 is characterized by average RMS = 0.16 ± 0.06. The aftershock epicenters are clearly distributed in two main clusters covering the southern and northern sides of the entire cloud (Figure 4). The along-strike length of the overall aftershock area (Figure 4) is L~20 km, while the maximum lateral width of W~9 km is evident in the southern cluster. These values are nearly the same as the length and width predicted by the empirical relationships (2) and (3). Only the epicenters of the northern cluster fall in the hanging wall block of the KF normal fault which is exposed at the surface. Furthermore, the northern cluster abuts but does not overlap with the deformation area determined from InSAR images (Figure 5 and Figure 6). On the contrary, the southern cluster, which is the most extensive one, nearly overlaps with the deformation area. The seismogenic layer of aftershocks ranges in depth from 5 to about 20 km with the average depth being 15.1 ± 4.1 km (Figure 9b).
All the earthquakes of magnitude ≥ 4.0 that occurred in the entire foreshock-main shock-aftershock sequence ruptured within the southern aftershock cluster. In addition, the largest aftershocks of magnitude ≥ 4.6 occurred within the first three days from the mainshock occurrence. This is clearly reflected by the cumulative moment release (Figure 11a) and the gradual decrease of aftershock magnitudes (Figure 11b). These results provide strong evidence that the main rupture area did not expand beyond the area covered by the southern aftershock cluster. The smaller in size northern aftershock cluster is very likely due to the gradual expansion of the aftershock area away from the main seismic slip area. These observations are of special importance for better understanding the geometry and dimensions of the causative fault segment, for the calculation of the mainshock stress drop as well as for the estimation of the remaining seismic potential in the area.

3.5. Stress-Drop

A first effort has been made to calculate the stress drop associated with the mainshock on the basis of the seismic fault dimensions. The circular fault model is a good approximation for no large earthquakes (M < 6.0). For the earthquake of 27 September 2021, this model is supported by the nearly circular shape of the seismic slip area determined from our geodetic solution (Figure 8b). Stress-drop of Δσ = 55 bars has been found for geodetic seismic moment Mo = 1.14 × 10¹⁸ N·m and source area with radius R = 4.5 km. Since in the geodetic source model a small portion of seismic slip happened away from the main slip patch, a total seismic slip area equivalent to the circular area of R = 5 km can be considered. Then, the stress drop is reduced to 40 bars.
Although the rectangular fault model is more appropriate for earthquakes of M > 6.0, we considered this case too for reasons of comparison. The fault dimensions have been taken from only the first three-day aftershock activity aiming to avoid overestimation of the seismic slip area. Namely, the fault length is ~9 km and the lateral width is also ~9 km (Figure 4). However, taking into account that the upper limit of the seismic fault surface is at depth 5 km and the average fault dip is 43° (Table 2), the down-dip width has been found equal to 12.3 km. For seismic moment Mo = 1.1 × 10¹⁸ N·m determined from moment tensor solutions, e.g., by GEOFON (https://geofon.gfz-potsdam.de/data/alerts/2021/gfz2021sxyu/mt.txt; last access 9 December 2021) stress-drop Δσ~7 bars has been calculated.

4. Discussion

The results obtained call for the identification of the causative fault of the 27 September 2021 strong earthquake, which is of primary importance not only for understanding the seismogenic process of the particular earthquake but also for the evaluation of the seismic potential of the causative fault. The last issue can be examined in the short-term and long-term time frames.
The geodetic fault model for the mainshock along with fault-plane solutions of the mainshock, of the largest foreshock and of the largest aftershock, leave no doubt that the rupture process was associated with ~WNW-ESE crustal extension of an NNE-SSW striking normal fault. Such a fault geometry fits quite well to the geometrical features of the Kastelli Fault (KF) (Figure 3 and Figure 4). However, the length of the deformation and aftershock areas considered together exceed by ~3 times the length of the KF surface exposure, which is only ~6 km. The reason is that the southern KF exposure is truncated by the very likely younger Nipiditos fault, which strikes nearly perpendicular to the KF (Figure 3, Figure 4 and Figure 12). This implies that the inferred southwards prolongation of KF has to be considered as a buried fault segment as illustrated in Figure 4 and Figure 12. Otherwise, the main aftershock cluster at the south, the foreshock area and a large part of deformation covering the same cluster area, all remain without tectonic interpretation. This analysis implies that the mainshock rupture very likely occurred at the southern inferred KF fault segment. At all evidence, the northern KF segment was activated only during the aftershock period as a result of inelastic stress redistribution and an associated expansion of the aftershock area.
The vertical ground displacement of ~20 cm that we detected with InSAR techniques in association with the 27 September 2021 mainshock (Mw6.0) incorporates also the ground displacement that is possibly caused by the largest aftershock (Mw5.1). However, it is not possible to discriminate the displacement caused by the aftershock since it occurred only the next day after the mainshock. For other shallow earthquake cases of comparable magnitude, it has been found that the displacement caused was on the order of 6 cm [63]. Therefore, the net ground displacement associated with the mainshock perhaps is about 15 cm. A minor deformation that may have been caused by the largest foreshock (Mw4.6) of 24 July 2021 is not incorporated in the displacement detected for the mainshock. For another earthquake of (Mw4.6), which occurred in central Greece on 2 December 2020, ground displacement on the order of 3 cm was estimated from InSAR and GPS measurements [64].
The behavior of the aftershock activity is of significance for the evaluation of the KF seismic potential in the short-term sense. Τhe spatial aftershock distribution leaves a relatively quiescent area between the two clusters (Figure 4). Although we already noted that the spatial distribution is likely true, it should not be ruled out that it might be improved by earthquake relocation techniques in the future. The separation of the aftershock activity in two spatial clusters could be interpreted by the presence of the Nipiditos Fault (NF) in the area (Figure 4 and Figure 12). To the south of the KF truncation by the NF, the KF does not emerge at the surface. However, it is remarkable that the inferred NF prolongation towards WNW strikes between the two aftershock spatial clusters, thus creating a tectonic barrier between the two KF segments. Alternatively, but less likely, the aftershock quiescent area might be due to the existence of an unbroken small asperity, leaving open the possibility for a strong (magnitude ~5) late aftershock.
To evaluate the KF seismic potential in the long-term sense, it is necessary to examine the seismic history of the area. The Arkalochori town dates back to at least the 16th century AD. From a detailed seismic record of Crete [2] no earthquake disaster was reported in the Arkalochori area until the earthquake occurrence of 27 September 2021. Earthquake disasters have been historically reported in various places situated to the north and east of the 2021 seismic source. For example, Heraklion, the capital city of Crete, suffered extensive damage by the 29 May 1508 surface earthquake (Mw6.5) and the 16 February 1810 possibly interplate earthquake (Mw6.9) [1,2] (Figure 2). Heraklion has been also hit heavily by large intermediate-depth earthquakes, such as the 12 October 1856 one of Mw7.6 (Figure 2). However, intermediate-depth earthquakes are irrelevant to our discussion. In pre-historic times, a destruction horizon found in the archaeological site of Archanes, a few kilometers to the south of Heraklion, indicates strong earthquake occurrence possibly during the 17th century BC [65], see also review in [2]. However, the source of that earthquake remains unknown although the Giouchtas Fault Zone (Figure 3 and Figure 4) is a candidate. In conclusion, we propose that it is unlikely to miss historical earthquakes of magnitude ~6 or larger occurring in the Arkalochori area at least since the 16th century AD.
From the long-term perspective it is evident that the seismicity in the Arkalochori area has been very low in the sense that no past strong earthquakes are known there. The long repeat time of strong earthquakes in the study area, estimated on the order of several hundred years, has also been supported by other authors from seismicity statistics e.g., [66]. Palaeoseismological and historical data indicate that the East Giouchtas Fault is characterized by a surface rupture with an estimated recurrence interval of about 2000 years and slip rate in the order of 0.25–0.5 mm/yr [24]. Repeat time of strong earthquakes equal to ~800 years has been estimated from tectonic observations on the KF and the Geraki Fault considered together as a single fault zone [13].
The relatively high stress drop associated with the 27 September 2021 earthquake could be attributed to increased fault rigidity, which is a characteristic of “strong” faults with a long repeat time of strong earthquakes [67]. Further calculation of the stress drop, e.g., from spectra of S-waves, may help with cross-checking the value of stress drop found from the seismic fault dimensions. From the standpoint of the earthquake’s long repeat time, the Arkalochori 2021 mainshock was “unexpected” in the long-term sense and constitutes one more example of the highly distributed seismicity associated with normal faulting in the Greek area. Recent examples include the northern Greece earthquake (Mw6.6) of 13 May 1995 [68], and the central Greece earthquakes of 7 September 1999 (Mw5.9) [69] and of 3 and 4 May 2021 (Mw6.3 and Mw6.2) [70,71,72]. On the other hand, due to the high seismicity rate observed from the beginning of June 2021, the national civil protection services requested from experts the seismicity evaluation during July 2021. As a follow-up, a clear recommendation to the local authorities was given for undertaking urgent preparation measures according to the emergency plans. Consequently, the main shock was “expected” in the short-term sense although no precise estimation of the expected magnitude was possible.

5. Conclusions

The strong (Mw6.0) mainshock that occurred in the Arkalochori area of Crete Isl. on 27 September 2021 came after a nearly 4-month-long foreshock activity, which is characterized by a significant drop of the b-value and increase of the seismicity rate with respect to the background seismicity of the area. The aftershock activity is spatially distributed in two clusters, the southern and northern ones. The northern cluster is bounded to the east by the ~6 km-long surface exposure of the active normal Kastelli Fault (KF). The KF southern tip is truncated by the younger Nipiditos Fault, which strikes nearly perpendicular to KF. The main shock as well as all the foreshocks and aftershocks of ML ≥ 4.0 ruptured within the southern aftershock cluster.
Analysis of InSAR images showed that the deformation area nearly coincides with the southern aftershock cluster while maximum subsidence of ~20 cm has been estimated. From the inversion of InSAR data, a geodetic solution of the seismic source was produced showing the next fault features: strike 216°, dip angle 53°, rake −95°. The normal fault plane dips towards ~NW. This solution is consistent with fault-plane solutions obtained from routine moment tensor analysis. The geodetic seismic moment calculated through the Okada’s formalism is 1.14 × 10¹⁸ N·m and corresponds to Mw6.0. The seismic slip occurred at depths from 2.5 to 10 km while a maximum slip of 1.03 m was found at the depth range from ~3.5 km to 5 km. The foreshock activity was developed at the southwestern edge of the mainshock slip area and down-dip of it. This implies that the foreshock activity was a foreshadow of the mainshock nucleation area. In the case of the Ionian Sea Mw6.8 earthquake of 25 October 2018, which was associated with thrust-oblique faulting, a similar pattern was observed but the foreshock activity developed at the upper edge, and up-dip, of the mainshock asperity [73].
At all evidence, the Arkalochori mainshock rupture occurred in the area of the southern aftershock cluster. This implies the activation of an inferred buried southern KF segment. The northern aftershock cluster is very likely due to the gradual expansion of the aftershock activity. The stress drop associated with the mainshock was found as high as 55 bars for a geodetic circular source of a radius of ~4.5 km but lower (~7 bars) for a seismic rectangular source. These values are relatively high for Greek earthquakes and could be attributed to increased fault rigidity due to the long repeat time of strong earthquakes in the Kastelli Fault segments.

Author Contributions

Conceptualization, I.T.; methodology, all; software, A.K. and I.T.; data curation, I.T.; A.K.; I.K.; G.A.P.; I.P.; writing—original draft preparation, I.T.; writing—review and editing, I.T.; A.K.; I.K.; G.A.P.; I.P. All authors have read and agreed to the published version of the manuscript.

Funding

This research received no external funding.

Institutional Review Board Statement

Not applicable.

Informed Consent Statement

Not applicable.

Data Availability Statement

Links for seismological data used are provided in the main text and in figure legends. Single Look Complex (SLC) images covering the pre- and post-seismic periods of the 27 September 2021 earthquake were downloaded from the European Space Agency’s (ESA) Sentinel Hub site (https://scihub.copernicus.eu/; access date 10 October 2021).

Acknowledgments

Maps in this paper have been produced with the use of ArcMap 10.1 and of the Generic Mapping Tools-GMT 5 [74]. Diagrams were produced with the z-map toolbox [49]. We are thankful to the three anonymous reviewers and to the Academic Editor for their constructive comments that helped to improve the initial submission of the paper.

Conflicts of Interest

The authors declare no conflict of interest.

References

  1. Papadopoulos, G.A. Εarthquake sources and seismotectonics in the area of Crete. In Minoan Earthquakes-Breaking the Myth through Interdisciplinarity, 1st ed.; Jusseret, S., Sintubin, M., Eds.; Leuven University Press: Leuven, Belgium, 2017; pp. 165–190. [Google Scholar]
  2. Papadopoulos, G.A. A Seismic History of Crete: Earthquakes and Tsunamis, 2000 B.C.–A.D. 2010, 1st ed.; Ocelotos Publ.: Athens, Greece, 2011; p. 415. ISBN 978-960-9499-68-2. [Google Scholar]
  3. Bocchini, G.M.; Brüstle, A.; Becker, D.; Meier, T.; van Keken, P.E.; Ruscic, M.; Papadopoulos, G.A.; Rische, M.; Friederich, W. Tearing, segmentation, and backstepping subduction in the Aegean: New insights from seismicity. Tectonophysics 2018, 734–735, 96–118. [Google Scholar] [CrossRef]
  4. Floyd, M.A.; Billiris, H.; Paradissis, D.; Veis, G.; Avallone, A.; Briole, P.; McClusky, S.; Nocquet, J.-M.; Palamartchouk, K.; Parsons, B.; et al. A new velocity field for Greece: Implications for the kinematics and dynamics of the Aegean. J. Geophys. Res. 2010, 115, B10403. [Google Scholar] [CrossRef]
  5. McClusky, S.; Balassanian, S.; Barka, A.; Demir, C.; Ergintav, S.; Georgiev, I.; Gurkan, O.; Hamburger, M.; Hurst, K.; Kahle, H.; et al. Global Positioning System constraints on plate kinematics and dynamics in the eastern Mediterranean and Caucasus. J. Geophys. Res. 2000, 105, 5695–5719. [Google Scholar] [CrossRef]
  6. Reilinger, R.; McClusky, S.; Paradissis, D.; Ergintav, S.; Vernant, P. Geodetic constraints on the tectonic evolution of the Aegean region and straaccumulation along the Hellenic subduction zone. Tectonophysics 2010, 488, 22–30. [Google Scholar] [CrossRef]
  7. Guidoboni, E.; Comastri, A.; Traina, G. Catalogue of Ancient Earthquakes in the Mediterranean Area Up to the 10th Century; Storia Geofisica Ambiente: Bologna, Italy, 1994; p. 504. [Google Scholar]
  8. Papazachos, B.C.; Papazachou, C. The Earthquakes of Greece; Ziti Publ.: Thessaloniki, Greece, 2003; p. 286. (In Greek) [Google Scholar]
  9. Ambraseys, N.N. Earthquakes in the Mediterranean and Middle East, A Multidisciplinary Study of Seismicity Up to 1900; Cambridge Univ. Press: Cambridge, UK, 2009; p. 947. [Google Scholar]
  10. Fassoulas, C. The tectonic development of a Neogene basat the leading edge of the active European margin: The Heraklion basin, Crete, Greece. J. Geodyn. 2001, 31, 49–70. [Google Scholar] [CrossRef]
  11. Monaco, C.; Tortorici, L. Faulting and effects of earthquakes on Minoan archaeological sites in Crete (Greece). Tectonophysics 2004, 382, 103–116. [Google Scholar] [CrossRef]
  12. Caputo, R.; Monaco, C.; Tortorici, L. Multiseismic cycle deformation rates from Holocene normal fault scarps on Crete (Greece). Terra Nova 2006, 18, 181–190. [Google Scholar] [CrossRef]
  13. Caputo, R.; Catalano, S.; Monaco, C.; Romagnoli, R.; Tortorici, G.; Tortorici, L. Active faulting on the island of Crete (Greece). Geophys. J. Int. 2010, 183, 111–126. [Google Scholar] [CrossRef]
  14. Gaki-Papanastassiou, K.; Karymbalis, E.; Papanastassiou, D.; Maroukian, H. Quaternary marine terraces as indicators of neotectonic activity of the Ierapetra normal fault SE Crete (Greece). Geomorphology 2009, 104, 38–46. [Google Scholar] [CrossRef]
  15. Nicol, A.; Mouslopoulou, V.; Begg, J.; Oncken, O. Displacement accumulation and sampling of paleoearthquakes on active normal faults of Crete in the eastern Mediterranean. Geochem. Geophys. Geosystems 2020, 21, e2020GC009265. [Google Scholar] [CrossRef]
  16. Mountrakis, D.; Kilias, A.; Pavlaki, A.; Fassoulas, C.; Thomaidou, E.; Papazachos, C.; Papaioannou, C.; Roumelioti, Z.; Benetatos, C.; Vamvakaris, D. Neotectonic study of Western Crete and implications for seismic hazard assessment. J. Virtual Explor. 2012, 42, 2. [Google Scholar] [CrossRef]
  17. Mason, J.; Reicherter, K. The palaeoseismological study of capable faults on Crete. In Minoan Earthquakes-Breaking the Myth through Interdisciplinarity, 1st ed.; Jusseret, S., Sintubin, M., Eds.; Leuven University Press: Leuven, Belgium, 2017; pp. 191–216. [Google Scholar]
  18. Kokkalas, S.; Xypolias, P.; Koukouvelas, I.K.; Doutsos, T. Post-Collisional Contractional and Extensional Deformation in the Aegean Region. In Post-Collisional Tectonics and Magmatism in the Mediterranean Region and Asia; Dilek, Y., Pavlides, S., Eds.; Geological Society of America: Boulder, CO, USA, 2006; Volume 409, pp. 97–123. [Google Scholar]
  19. Lyon-Caen, H.; Armijo, R.; Drakopoulos, J.; Baskoutas, J.; Delibassis, N.; Gaulon, R.; Kouskouna, V.; Latoussakis, J.; Makropoulos, K.; Papadimitriou, P.; et al. The 1986 Kalamata (South Peloponnesus) earthquake: Detailed study of a normal fault, evidences for east-west extension in the Hellenic arc. J. Geophys. Res. 1987, 93, 14967–15000. [Google Scholar] [CrossRef]
  20. Taymaz, T.; Jackson, J.; Westaway, R. Earthquke mechanics in the Hellenic Trench near Crete. Geophys. J. Int. 1990, 102, 695–731. [Google Scholar] [CrossRef]
  21. Jost, M.L.; Knabenbauer, O.; Cheng, J.; Harjes, H.P. Fault plane solutions of microearthquakes and small events in the Hellenic arc. Tectonophysics 2002, 356, 87–114. [Google Scholar] [CrossRef]
  22. Kiratzi, A.; Louvari, E. Focal mechanisms of shallow earthquakes in the Aegean Sea and the surrounding lands determined by waveform modelling: A new database. J. Geodyn. 2003, 36, 251–274. [Google Scholar] [CrossRef]
  23. Doutsos, T.; Kokkalas, S. Stress and deformation patterns in the Aegean region. J. Struct. Geol. 2001, 23, 455–472. [Google Scholar] [CrossRef]
  24. Vassilakis, E. Study of the Tectonic Structure of Messara Basin, Central Crete with the Aid of Remote Sensing Techniques and Geographic Information Systems. Ph.D Thesis, National & Kapodistrian University of Athens, Athens, Greece, 2006. (In Greek). [Google Scholar]
  25. Zygouri, V.; Koukouvelas, I.; Ganas, A. Palaeoseismological analysis of the east Giouchtas fault, Heraklion basin, Crete (preliminary results). Bull. Geol. Soc. Greece 2016, 50, 563–571. [Google Scholar] [CrossRef] [Green Version]
  26. Kokinou, E.; Skilodimou, H.D.; Bathrellos, G.D.; Antonarakou, A.; Kamberis, E. Morphotectonic analysis, structural evolution/pattern of a contractional ridge: Giouchtas Mt., Central Crete, Greece. J. Earth Syst. Sci. 2015, 124, 587–602. [Google Scholar]
  27. Curlander, J.; McDonough, R. Synthetic Aperture Radar: Systems and Signal Processing; John Wiley & Sons.: Hoboken, NJ, USA, 1991; ISBN 978-0-471-85770-9. [Google Scholar]
  28. Bamler, R.; Hartl, P. Synthetic aperture radar interferometry. In Inverse Problems; IOP Publishing Limited: Bristol, UK, 1998; Volume 14, pp. R1–R54, PII: S0266-5611(98)78649-6. [Google Scholar]
  29. Rosen, P.A.; Hensley, S.; Joughin, I.R.; Li, F.K.; Madsen, S.N.; Rodriguez, E.; Goldstein, R.M. Synthetic aperture radar interferometry. Proc. IEEE 2000, 88, 333–382. [Google Scholar] [CrossRef]
  30. Massonnet, D.; Rossi, M.; Carmona, C.; Adragna, F.; Peltzer, G.; Feigl, K.; Rabaute, T. The displacement field of the Landers earthquake mapped by radar interferometry. Nature 1993, 364, 138–142. [Google Scholar] [CrossRef]
  31. Zebker, H.A.; Rosen, P.A.; Goldstein, R.M.; Gabriel, A.; Werner, C.L. On the derivation of coseismic displacement fields using differential radar interferometry: The Landers earthquake. J. Geophys. Res. 1994, 99, 19617–19634. [Google Scholar] [CrossRef]
  32. Ramirez, R.; Lee, S.; Kwon, T. Long-term remote monitoring of ground deformation using sentinel-1 interferometric synthetic aperture radar (INSAR): Applications and insights into geotechnical engineering practices. Appl. Sci. 2020, 10, 7447. [Google Scholar] [CrossRef]
  33. Okada, Y. Internal deformation due to shear and tensile faults a half-space. Bull. Seism. Soc. Am. 1992, 82, 1018–1040. [Google Scholar] [CrossRef]
  34. Frohlich, C.; Davis, S.D. Teleseismic b values; or, much ado about 1.0. J. Geophys. Res. 1993, 98, 631–644. [Google Scholar] [CrossRef]
  35. Schorlemmer, D.; Wiemer, S.; Wyss, M. Variations in earthquake-size distribution across different stress regimes. Nature 2005, 437, 539–542. [Google Scholar] [CrossRef]
  36. Mogi, K. Some discussion on aftershocks, foreshocks and earthquake swarms–the fracture of a semi-infinite body caused by an inner stress origand its relation to the earthquake phenomena (3rd paper). Bull. Earthq. Res. Inst. Univ. Tokyo 1963, 41, 615–658. [Google Scholar]
  37. Suyehiro, S.; Sekiya, H. Foreshocks and earthquake prediction. Tectonophysics 1972, 14, 219–225. [Google Scholar] [CrossRef]
  38. Papazachos, B.C. Foreshocks and earthquake prediction. Tectonophysics 1975, 28, 213–226. [Google Scholar] [CrossRef]
  39. Jones, L.M.; Molnar, P. Some characteristics of foreshocks and their possible relationship to earthquake prediction and premonitory slip on faults. J. Geophys. Res. 1979, 84, 3596–3608. [Google Scholar] [CrossRef]
  40. Main, I.; Meredith, P.G.; Jones, C. A reinterpretation of the precursory seismic b-value anomaly from fracture mechanics. Geophys. J. Internat. 1989, 96, 131–138. [Google Scholar] [CrossRef]
  41. Chan, C.-H.; Wu, Y.-M.; Tseng, T.-L.; Lin, T.-L.; Chen, C.-C. Spatial and temporal evolution of b-values before large earthquakes in Taiwan. Tectonophysics 2012, 532–535, 215–222. [Google Scholar] [CrossRef] [Green Version]
  42. Kato, A.; Obara, K.; Igarashi, T.; Tsuruoka, H.; Nakagawa, S.; Hirata, N. Propagation of slow slip leading up to the 2011 Mw 9.0 Tohoku-Oki earthquake. Science 2012, 335, 705–708. [Google Scholar] [CrossRef] [PubMed] [Green Version]
  43. Nanjo, K.Z.; Hirata, N.; Obara, K.; Kasahara, K. Decade-scale decrease b value prior to the M9-class 2011 Tohoku and 2004 Sumatra quakes. Geophys. Res. Lett. 2012, 39, 1–4. [Google Scholar] [CrossRef]
  44. Papadopoulos, G.A.; Minadakis, G. Foreshock Patterns Preceding Great Earthquakes in the Subduction Zone of Chile. Pure Appl. Geophys. 2016, 173, 3247–3271. [Google Scholar] [CrossRef]
  45. Papadopoulos, G.A.; Minadakis, G.; Orfanogiannaki, K. Short-Term Foreshocks and Earthquake Prediction. In AGU Geophysical Monograph Series Book, 1st ed.; Ouzounov, D., Pulinets, S., Hattori, K., Taylor, P., Eds.; John Wiley & Sons, Inc.: Hoboken, NJ, USA, 2018; pp. 127–147. [Google Scholar] [CrossRef]
  46. Gutenberg, B.; Richter, C. Frequency of earthquakes in California. Bull. Seismol. Soc. Am. 1944, 34, 185–188. [Google Scholar] [CrossRef]
  47. Wyss, M.; Hasegawa, A.; Wiemer, S.; Umino, N. Quantitative mapping of precursory seismic quiescence before the 1989, m7.1 off-Sanriku earthquake, Japan. Ann. Geofis. 1999, 42, 851–869. [Google Scholar]
  48. Wiemer, S.; Wyss, M. Minimum magnitude of completeness in earthquake catalogs: Examples from Alaska, the Western United States, and Japan. Bull. Seismol. Soc. Am. 2000, 90, 859–869. [Google Scholar] [CrossRef]
  49. Wiemer, S. A software package to analyze seismicity: ZMAP. Seismol. Res. Lett. 2001, 72, 374–383. [Google Scholar] [CrossRef]
  50. Konstantinou, K.I.; Papadopoulos, G.A.; Fokaefs, A.; Orphanogiannaki, K. Empirical relationships between aftershock area dimensions and magnitude for earthquakes in the Mediterranean Sea region. Tectonophysics 2005, 403, 95–115. [Google Scholar] [CrossRef]
  51. Kanamori, H.; Anderson, D.L. Theoretical Basis of Some Empirical Relations in Seismology. Bull. Seismol. Soc. Am. 1975, 65, 1073–1095. [Google Scholar]
  52. Kiratzi, A.A.; Karakaisis, G.F.; Papadimitriou, E.E.; Papazachos, B.C. Seismic source-parameter relations for earthquakes in Greece. Pure Appl. Geophys. 1985, 123, 27–41. [Google Scholar] [CrossRef]
  53. Margaris, B.N.; Hatzidimitriou, P.M. Source Spectral Scaling and Stress Release Estimates Using Strong-Motion Records in Greece. Bull. Seismol. Soc. Am. 2002, 92, 1040–1059. [Google Scholar] [CrossRef]
  54. Roumelioti, Z.; Kiratzi, A.; Theodoulidis, N.; Papaioannou, C. S-wave spectral analysis of the 1995 Kozani-Grevena (NW Greece) aftershock sequence. J. Seismol. 2002, 6, 219–236. [Google Scholar] [CrossRef]
  55. Papadopoulos, G.A.; Karastathis, V.; Kontoes, C.; Charalampakis, M.; Fokaefs, A.; Papoutsis, I. Crustal deformation associated with east Mediterranean strike-slip earthquakes: The 8 June 2008 Movri (NW Peloponnese), Greece, earthquake (Mw6.4). Tectonophysics 2010, 492, 201–212. [Google Scholar] [CrossRef]
  56. Stavroulopoulou, O.; Sokos, E.; Tselentis, G.-A. S-wave spectral analysis and estimation of spectral parameters in northwestern Greece. Bull. Geol. Soc. Greece 2016, 50, 1232–1240. [Google Scholar] [CrossRef] [Green Version]
  57. Karakostas, V.; Tan, O.; Kostoglou, A.; Papadimitriou, E.; Bonatis, P. Seismotectonic implications of the 2020 Samos, Greece, Mw 7.0 mainshock based on high-resolution aftershock relocation and source slip model. Acta Geophys. 2021, 69, 979–996. [Google Scholar] [CrossRef]
  58. Hofstetter, A.; Shapira, A. Determination of earthquake energy release in the eastern Mediterranean region. Geophys. J. Int. 2000, 143, 898–908. [Google Scholar] [CrossRef] [Green Version]
  59. Konstantinou, K.I. Moment Magnitude–Rupture Area Scaling and Stress-Drop Variations for Earthquakes in the Mediterranean Region. Bull. Seismol. Soc. Am. 2014, 104, 2378–2386. [Google Scholar] [CrossRef]
  60. Stein, S.; Wysession, M. An Introduction to Seismology, Earthquakes and Earth Structure; Blackwell Publ.: Malden, MA, USA, 2003; p. 498. [Google Scholar]
  61. Ferretti, A.; Monti-Guarnieri, A.; Prati, C.; Rocca, F. SAR Principles: Guidelines for SAR Interferometry Processing and Interpretation; ESA Publications: Auckland, New Zealand, 2007. [Google Scholar]
  62. Wells, D.L.; Coppersmith, K.J. New empirical relationships among magnitude, rupture length, rupture width, rupture area, and surface displacement. Bull. Seismol. Soc. Am. 1994, 84, 974–1002. [Google Scholar]
  63. Ganas, A.; Kourkouli, P.; Briole, P.; Moshou, A.; Elias, P.; Parcharidis, I. Coseismic Displacements from Moderate-Size Earthquakes Mapped by Sentinel-1 Differential Interferometry: The Case of February 2017 Gulpinar Earthquake Sequence (Biga Peninsula, Turkey). Remote Sens. 2018, 10, 1089. [Google Scholar] [CrossRef] [Green Version]
  64. Elias, P.; Spingos, I.; Kaviris, G.; Karavias, A.; Gatsios, T.; Sakkas, V.; Parcharidis, I. Combined Geodetic and Seismological Study of the December 2020 Mw= 4.6 Thiva (Central Greece) Shallow Earthquake. Appl. Sci. 2021, 11, 5947. [Google Scholar] [CrossRef]
  65. Sakellarakis, Y.; Sapouna-Sakellaraki, E. Drama of death a Minoan temple. Natl. Geogr. 1981, 74, 205–222. [Google Scholar]
  66. Manakou, M.V.; Tsapanos, T.M. Seismicity and seismic hazard parameters evaluation in the island of Crete and the surrounding area inferred from mixed data files. Tectonophysics 2000, 321, 157–178. [Google Scholar] [CrossRef]
  67. Kanamori, H.; Allen, C.R. Earthquake repeat time and average stress drop. In Earthquake Source Mechanics; Geophys. Monogr. Maurice Ewing, 6; Das, S., Boatwright, J., Scholz, C.H., Eds.; AGU: Washington, DC, USA, 1986; Volume 37, pp. 227–235. [Google Scholar]
  68. Pavlides, S.B.; Zouros, N.C.; Chatzipetros, A.A.; Kostopoulos, D.S.; Mountrakis, D.M. The 13 May 1995 western Macedonia, Greece (Kozani Grevena) earthquake; preliminary results. Terra Nova 1995, 7, 544–549. [Google Scholar] [CrossRef]
  69. Papadopoulos, G.A.; Ganas, A.; Pavlides, S.B. The problem of seismic potential assessment: Case study of the unexpected earthquake of 7 September 1999 athens, Greece. Earth Planets Space 2002, 54, 9–18. [Google Scholar] [CrossRef] [Green Version]
  70. Tolomei, C.; Caputo, R.; Polcari, M.; Famiglietti, N.A.; Maggini, M.; Stramondo, S. The Use of Interferometric Synthetic Aperture Radar for Isolating the Contribution of Major Shocks: The Case of the March 2021 Thessaly, Greece, Seismic Sequence. Geosciences 2021, 11, 191. [Google Scholar] [CrossRef]
  71. Koukouvelas, I.K.; Nikolakopoulos, K.G.; Kyriou, A.; Caputo, R.; Belesis, A.; Zygouri, V.; Verroios, S.; Apostolopoulos, D.; Tsentzos, I. The March 2021 Damasi Earthquake Sequence, Central Greece: Reactivation Evidence across the Westward Propagating Tyrnavos Graben. Geosciences 2021, 11, 328. [Google Scholar] [CrossRef]
  72. Papadopoulos, G.A.; Agalos, A.; Karavias, A.; Triantafyllou, I.; Parcharidis, I.; Lekkas, E. Seismic and Geodetic Imaging (DInSAR) Investigation of the March 2021 Strong Earthquake Sequence in Thessaly, Central Greece. Geosciences 2021, 11, 311. [Google Scholar] [CrossRef]
  73. Papadopoulos, G.A.; Agalos, A.; Minadakis, G.; Triantafyllou, I.; Krassakis, P. Short-Term Foreshocks as Key Information for Mainshock Timing and Rupture: The Mw6.8 25 October 2018 Zakynthos Earthquake, Hellenic Subduction Zone. Sensors 2020, 20, 5681. [Google Scholar] [CrossRef]
  74. Wessel, P.; Smith, W.H.F.; Scharroo, R.; Luis, J.; Wobbe, F. Generic Mapping Tools: Improved Version Released. EOS Trans. AGU 2013, 94, 409–410. [Google Scholar] [CrossRef] [Green Version]
Figure 1. Seismotectonic setting of the study area [1,2]. Key: rectangle shows the Crete area illustrated in Figure 2 and Figure 3; arrows show lithospheric plate motions; the African (Nubian) lithosphere subducts from the Mediterranean underneath the Aegean Sea at the southern Eurasian plate margin along the Hellenic Trench system e.g., [3]; PTT, PLT and STR stand for Ptolemy, Pliny and Strabo trenches, respectively; star shows the epicenter of the Mw6.0 27 September 2021 mainshock; red triangle stands for Heraklion (HE), the capital city of Crete.
Geohazards 03 00006 g001
Figure 2. Rupture zones (ellipses) and occurrence years (AD) of the most important historical shallow earthquakes in the Crete area. Ellipses size scales with the estimated earthquake magnitude, M, which ranges from 6.3 ± 0.2 for 1595, to 8.0 ± 0.3 for 1303 and to 8.3 ± 0.3 for 365; M is equivalent to Mw. Epicenters of the most important historical intermediate-depth earthquakes are also illustrated as black circles; magnitudes are 7.6 ± 0.3 for 1856 and 6.6 ± 0.3 for 1870. Figure reproduced from [1].
Geohazards 03 00006 g002
Figure 3. Simplified map of 26 active faults identified on Crete from several sources (see text in Section 2.1) dashes on downthrown side. Key: rectangle indicates the study area shown in Figure 4; 1: Zou Fault zone, 2: Sykia Fault, 3: Mouliana Fault, 4: Ierapetra Fault zone, 5–6: Elounta Fault zone, 7: Nipiditos Fault, 8: Geraki Fault, 9: Kastelli Fault, 10: Paralia Tersa Fault, 11: Asimi Fault, 12: Pompia Fault, 13: Foumofaraggo Fault, 14: Giouchtas antithetic Faults, 15: Krousonas Fault, 16: Anogia Fault, 17: Ideon Fault, 18: Zaros Fault zone, 19: Spili Fault, 20: Selia Fault, 21: Sfakia Fault, 22: Pemonia Fault, 23: Malaxa Fault, 24: Rodopos Fault zone, 25–26: Gramvousa Fault zone.
Geohazards 03 00006 g003
Figure 4. Foreshocks (red circles) and aftershocks (black circles) of the 27 September 2021 main shock (large star). Stars of small and medium sizes show the largest foreshock of 24 July 2021 and the largest aftershock of 28 September 2021, respectively. Key: star = earthquake epicenter; KF = Kastelli Fault; GFZ = Geraki Fault Zone; NF = Nipiditos Fault; WGF = West Giouchtas Fault; EGFZ = East Giouchtas Fault Zone; white triangle = settlement; the inferred buried KF segment is illustrated in green; ellipse shows the surface projection of the main shock slip area in the fault plane determined from the inversion of InSAR observations (see explanations in Section 3).
Geohazards 03 00006 g004
Figure 5. Wrapped interferograms (up) and LOS displacement maps (down) in ascending (a) and descending (b) geometries for the 27 September 2021 earthquake. Symbol key: red line illustrates the surface exposure of Kastelli Fault (KF in Figure 2 and Figure 4); rectangle shows the surface projection of the geodetically determined fault plane (see Section 3.2); stars show epicenters of the largest foreshock of 24 July 2021 (1), mainshock of 27 September 2021 (2), largest aftershock of 28 September 2021 (3); black dots illustrate positions of settlements.
Geohazards 03 00006 g005
Figure 6. Vertical displacements (a) and E-W (b) direction for the 27 September 2021 earthquake. Symbol key as in Figure 5.
Geohazards 03 00006 g006
Figure 7. Comparison of LOS displacements from observed and modeled data for the 27 September 2021 earthquake using the ascending (up) and descending (down) geometry.
Geohazards 03 00006 g007
Figure 8. Modeled geodetic seismic fault for the 27 September 2021 earthquake in 3-D illustration (a) and in vertical profile along SW-NE strike (b).
Geohazards 03 00006 g008
Figure 9. Focal depth versus time for foreshocks (a) and for aftershocks occurring up to 5 November 2021 (b). Stars show the largest foreshock of 24 July 2021 (a), as well as the main shock of 27 September 2021 and the largest aftershock of 28 September 2021 (b).
Geohazards 03 00006 g009
Figure 10. Frequency-magnitude distribution (FMD) for foreshocks (a) and for the background seismicity (b) in the Arkalochori area.
Geohazards 03 00006 g010
Figure 11. Cumulative seismic moment release (a) and magnitude distribution versus time (b) for the aftershocks occurring up to 5 November 2021. Star shows the largest aftershock (Mw5.1/ML5.3) that occurred on 28 September 2021.
Geohazards 03 00006 g011
Figure 12. 3-D seismotectonic model seen from NW for the interpretation of the seismotectonics associated with the 27 September 2021 Arkalochori main shock (star) and its dependent foreshocks (red circles) and aftershocks occurring up to 5 November 2021 (black circles). The Nipiditos Fault, which is younger than the Kastelli Fault (KF), truncates KF nearly perpendicularly (see also Figure 4). Only the northern KF segment is exposed at surface. The main shock very likely ruptured the inferred southern KF segment since all the foreshocks and aftershocks of ML ≥ 4.0 and a large part of the geodetic deformation area all fall in that segment (see also text in Section 4 and Figure 4). The aftershock activity expanded gradually to the northern KF segment.
Geohazards 03 00006 g012
Table 1. Main tectonic features of the faults in the area of the 2021 Arkalochori strong earthquake.
Fault NameTrace Length (km)StrikeOffset (m)
Kastelli6.0NNE160
Geraki13.5NE677
Nipiditos12.0WNW690
East Giouchtas5.6NNW200
West Giouchtas6.1NNW300
Table 2. Average (Av) geometric features of the nodal planes (NP) determined for the mainshock of 27 September 2021 in 10 fault-plane solutions produced by several national and international seismological centers (see https://www.emsc-csem.org/Earthquake/index_tensors.php, last access 17 December 2021). Average NP geometric features have been also determined for the largest foreshock and the largest aftershock but only from two solutions.
Date
DD.MM.YYYY
Time
HH:MM:SS
MwNPStrike (°)Dip (°)Rake (°)
27 September 202106:17:216.01
2
34 ± 16
220 ± 18
43 ± 17
49 ± 13
−92 ± 16
−85 ± 29
24 July 202102:07:374.61
2
43
214
37
52
−82
−95
28 September 202104:48:085.11
2
5
229
64
33
−112
−51
Table 3. Seismic source solution for the 27 September 2021 earthquake determined from InSAR analysis.
DateTimeStrike (°)Dip (°)Rake (°)Moment
(×1018 N·m)
MwMaximum Slip (m)
DD.MM.YYYYHH:MM:SS
27 September 202106:17:2121653−951.146.01.03
Publisher’s Note: MDPI stays neutral with regard to jurisdictional claims in published maps and institutional affiliations.

