
Potential Climate Change Risks to Meeting Zimbabwe’s NDC Goals and How to Become Resilient

1
STEER Centre, Department of Geography, Loughborough University, Loughborough LE11 3TU, UK
2
Center for Environmental Policy, Imperial College London, London SW7 1NE, UK
3
Industrial Economics, Incorporated, Cambridge, MA 02140, USA
4
Abdul Latif Jameel Water and Food Systems Laboratory, Massachusetts Institute of Technology, Cambridge, MA 02140, USA
5
World Bank Group, Washington, DC 20433, USA
*
Author to whom correspondence should be addressed.
Energies 2021, 14(18), 5827; https://doi.org/10.3390/en14185827
Submission received: 25 April 2021
/
Revised: 5 September 2021
/
Accepted: 7 September 2021
/
Published: 15 September 2021
(This article belongs to the Section B1: Energy and Climate Change)
Abstract
:Almost all countries have committed to develop Nationally Determined Contributions (NDC) to reduce GHG emissions. They determine the level of GHG mitigation that, as a nation, they will commit to reducing. Zimbabwe has ambitious and laudable GHG mitigation targets. Compared to a coal-based future, emissions will be reduced by 33% per capita by 2030. If historical climate conditions continue, it can do this at low or negative cost if suitable sources of climate financing are in place. The NDC plots a positive future. However, much of Zimbabwe’s NDC mitigation center on hydropower generation and other measures that are dangerously vulnerable to climate change. Should the climate change in accordance with recent projections, these investments will be at risk, severely constraining electricity supply and causing high degrees of economic damage. This paper uses the Open-Source energy Modelling SYStem (OSeMOSYS) to consider two adaptation pathways that address this vulnerability. In the first, the country turns to a historically accessible option, namely the deployment of coal. In so doing, the electrical system is made more resilient, but emissions ramp up. The second pathway ‘climate proofs’ the power sector by boosting solar and wind capacity, using hydropower to provide balance for these new renewable resources, and introducing significant energy efficiency measures. This second pathway would require a set of extra accompanying investments and changes to the power market rules, but allows for both system resilience and NDC targets to be met. The paper shows that Zimbabwe’s low emissions growth can be made resilient, and while this path promises strong benefits, it also requires strong commitment and political will. From this paper insights are drawn and requirements for future analysis are made. Two critical insights are that: (i) NDCs that focus on mitigation should include resilience in their design. If they do not, they can introduce deep vulnerability; (ii) a departure from historical electricity market structures appears to hold potential for strong environmental, cost and reliability gains.
1. Introduction
Zimbabwe’s electricity system is both carbon intensive and highly rainfall dependent. In 2017, the International Energy Agency (IEA) estimated production was 46% coal and 54% hydropower [1]. Considerably more electricity generation will be needed in the future to meet the needs of a growing population and planned economic expansion. There is potential for the system to meet increasing demand with the continued use of coal. Coal is reliable, low cost, locally available and increasing local coal mining provides local jobs. However, this electricity development trajectory directly conflicts with meeting the country’s Nationally Determined Contributions (NDC), in which Zimbabwe aims to reduce emissions by 33% per capita by 2030, compared to a coal-based future [2].
The electricity sector and hydropower are a central focus of the country’s NDCs: approximately 88% of the emissions reduction is expected to come from increased production of hydroelectricity (Table 1; [2]). This is consistent with the country’s most recent System Development Plan (SDP; [3]), which was issued in 2017 and then carried through as a nationally determined contributor to lower emissions.
However, hydropower is highly dependent upon climate conditions. Were those conditions to become systematically drier under climate change, achieving the NDCs would be at risk. The devastating droughts Zimbabwe has been experiencing over the last five years—and the resulting electricity shortages due to production shortfalls at Kariba and elsewhere—appear to be occurring more frequently, and this trend of larger extremes is likely to continue based on climate change projections.
In this paper, we seek to evaluate the level of risk to the NDCs from climate change, and to evaluate options to enhance the resilience of the NDCs to ensure that emissions targets are met.
2. Background: Zimbabwe’s Energy Sector and Climate Change
Zimbabwe is heavily reliant on its coal and water resources to produce electricity. The bulk of supply is produced at the Kariba Dam Hydroelectric Power Station (750 MW), at the Hwange Thermal Power Station (920 MW) and at three smaller coal-fired power stations, all of which are managed by the Zimbabwe Electricity Supply Authority (ZESA) subsidiary, the Zimbabwe Power Company [4,5]. However, these coal power plants are old with low dependable capacities. Just under half of the thermal power capacity of 1378 MW is operationally dependable [3]. Total and dependable capacities are provided in Table 2.
2.1. Future Electricity Generation Options
The average solar insolation in Zimbabwe is 5.7 kWh/m2/day. There is an enormous potential for the use of solar photo voltaic (PV) and solar water heaters that has not yet been exploited; at present, only 1% of the technical potential for solar water heaters has been harnessed [6]. There are significant wind potentials with 12.137 TWh, 1000 TWh and 47.3 TWh potential per year at load factors of more than 20%, 30% and 40%, respectively [7].
However, without batteries, large quantities of wind and solar produce electricity intermittently. This is in a manner that can be difficult for the power system to absorb. It can result in a mismatch between when electricity is needed, such as in continuous mining operations, and when it is produced or unavailable, such as on a wind-still summer night. Despite this, there exists significant deployment potential.
One option to overcome this challenge is to store water in reservoirs, rather than electricity in batteries. When intermittent renewables are producing pulses of energy, production from hydro power plants is ramped down. When this happens, reservoirs are filled and water stored. When there are shortages from intermittent generation, hydro power plants are run, drawing on the stored water. This strategy also requires far less water than using hydropower continuously to supply baseload power. Similarly, coal might be stored or stockpiled to do the same.
If the rest of the system can be set up to balance deficits and curtail or eject the excess power through interconnectors, relatively large proportions of intermittent renewables might be incorporated. However, care must be taken to ensure that traditional power plants can ramp up production output fast enough to maintain a stable system.
Another option is energy imports. Zimbabwe is a core member of the Southern African Power Pool [8], and is a net power importer. SAPP generation is dominated by coal from South Africa, and by hydropower from elsewhere [9]. Zimbabwe’s hydropower generation is dependent on the Zambezi River basin, as is hydropower generation from its neighbors to the north. Consequently, when there is a regional water shortage, there is a regional reduction in generation [10].
Further, coal-fired generation is a cornerstone of SAPP production. Zimbabwe has coal reserves and could develop both mines and power plants. Mines would be developed in a manner to reduce their development and running risk. To mitigate risks, long-term coal purchase–production agreements are often put in place. The same holds for the development of the power plant. Fixed quantities of power are often agreed to be purchased at a fixed price. (Under typical market rules, coal and coal-fired power production, would produce firm baseload power.)
There is also significant potential for the introduction of energy efficient policies and measures (PAMs) to reduce the quantity of electricity required per unit of economic output. In neighboring South Africa, between 10–20% of electricity use reductions are economically feasible [11]; this is in a setting where the cost of power production is relatively low. In Zimbabwe, at higher production costs, larger savings may well be possible. Furthermore, improved demand side management is a fast-moving area with innovation, technological and business models being developed rapidly. There has been relatively little energy efficiency progress in Zimbabwe, and much technical stock is old. Thus, techno-economic potentials for deep energy efficiency are, thus, likely to be very high.
2.2. Nationally Determined Contribution (NDC) Submissions and Resilience
Under the Paris Agreement, nations have agreed to national mitigation actions to contain temperatures to within 2 °C above pre-industrial levels while aiming for a limit of 1.5 °C [12]. These contributions vary [13] with criticism leveled against ambition [14], their incremental tightening [15] and relative responsibility [13]. Against this setting, Zimbabwe’s NDC, given the constraints within low and middle income countries (LMIC) is laudable.
Furthermore, Zimbabwe has the extra challenge of improving the reliability of its power system [16]. Unreliability causes power demand to be unserved [17], incurring economic cost [18,19] and economic damage [20]. Energy accounts for over 70% of global emissions [21]. Energy mitigation is a priority, but so is ensuring its secure supply.
Coal has dominated power supply in Southern Africa [22]. It provides employment [23], secure power [24], is CO2 intensive [25], and there are local reserves [26]. Where no effective coal spot market exists, contracts are put in place for the long-term purchase of coal and the power from the plant [27] as this can ‘de-risk’ investments and reduce costs. Coal is normally used to provide baseload power [28]. However, it can be reworked to balance intermittent renewable energy [29].
As a direct replacement for the use of coal, hydropower can provide both baseload [30] supplies and balancing services [31] to increase the share of intermittent renewables [32]. If hydro is used primarily for balancing, it requires lower overall water throughput [33] and does this with lower emissions [34]. However, hydro can be subject to climate impacts [35].
Thus, care must be taken to effectively mitigate emissions, ensure power system reliability and consider the role of coal, hydro, intermittent renewables and climate change resilience. If coal is used, markets should be secured, and, though the literature is growing, there are relatively few analyses of the resilience of NDCs and their associated power systems to climate change [36]. Such analysis is needed in order to illustrate how achieving planned emissions reductions, and therefore meeting NDC targets, might fare under a changed climate.
3. Methodology
In this study, several scenarios are developed and quantified using the Open-Source energy Modelling SYStem (OSeMOSYS). OSeMOSYS has been extensively applied. In this analysis, we use a standard structure and develop a set of scenarios, from which insights are drawn.
3.1. Model
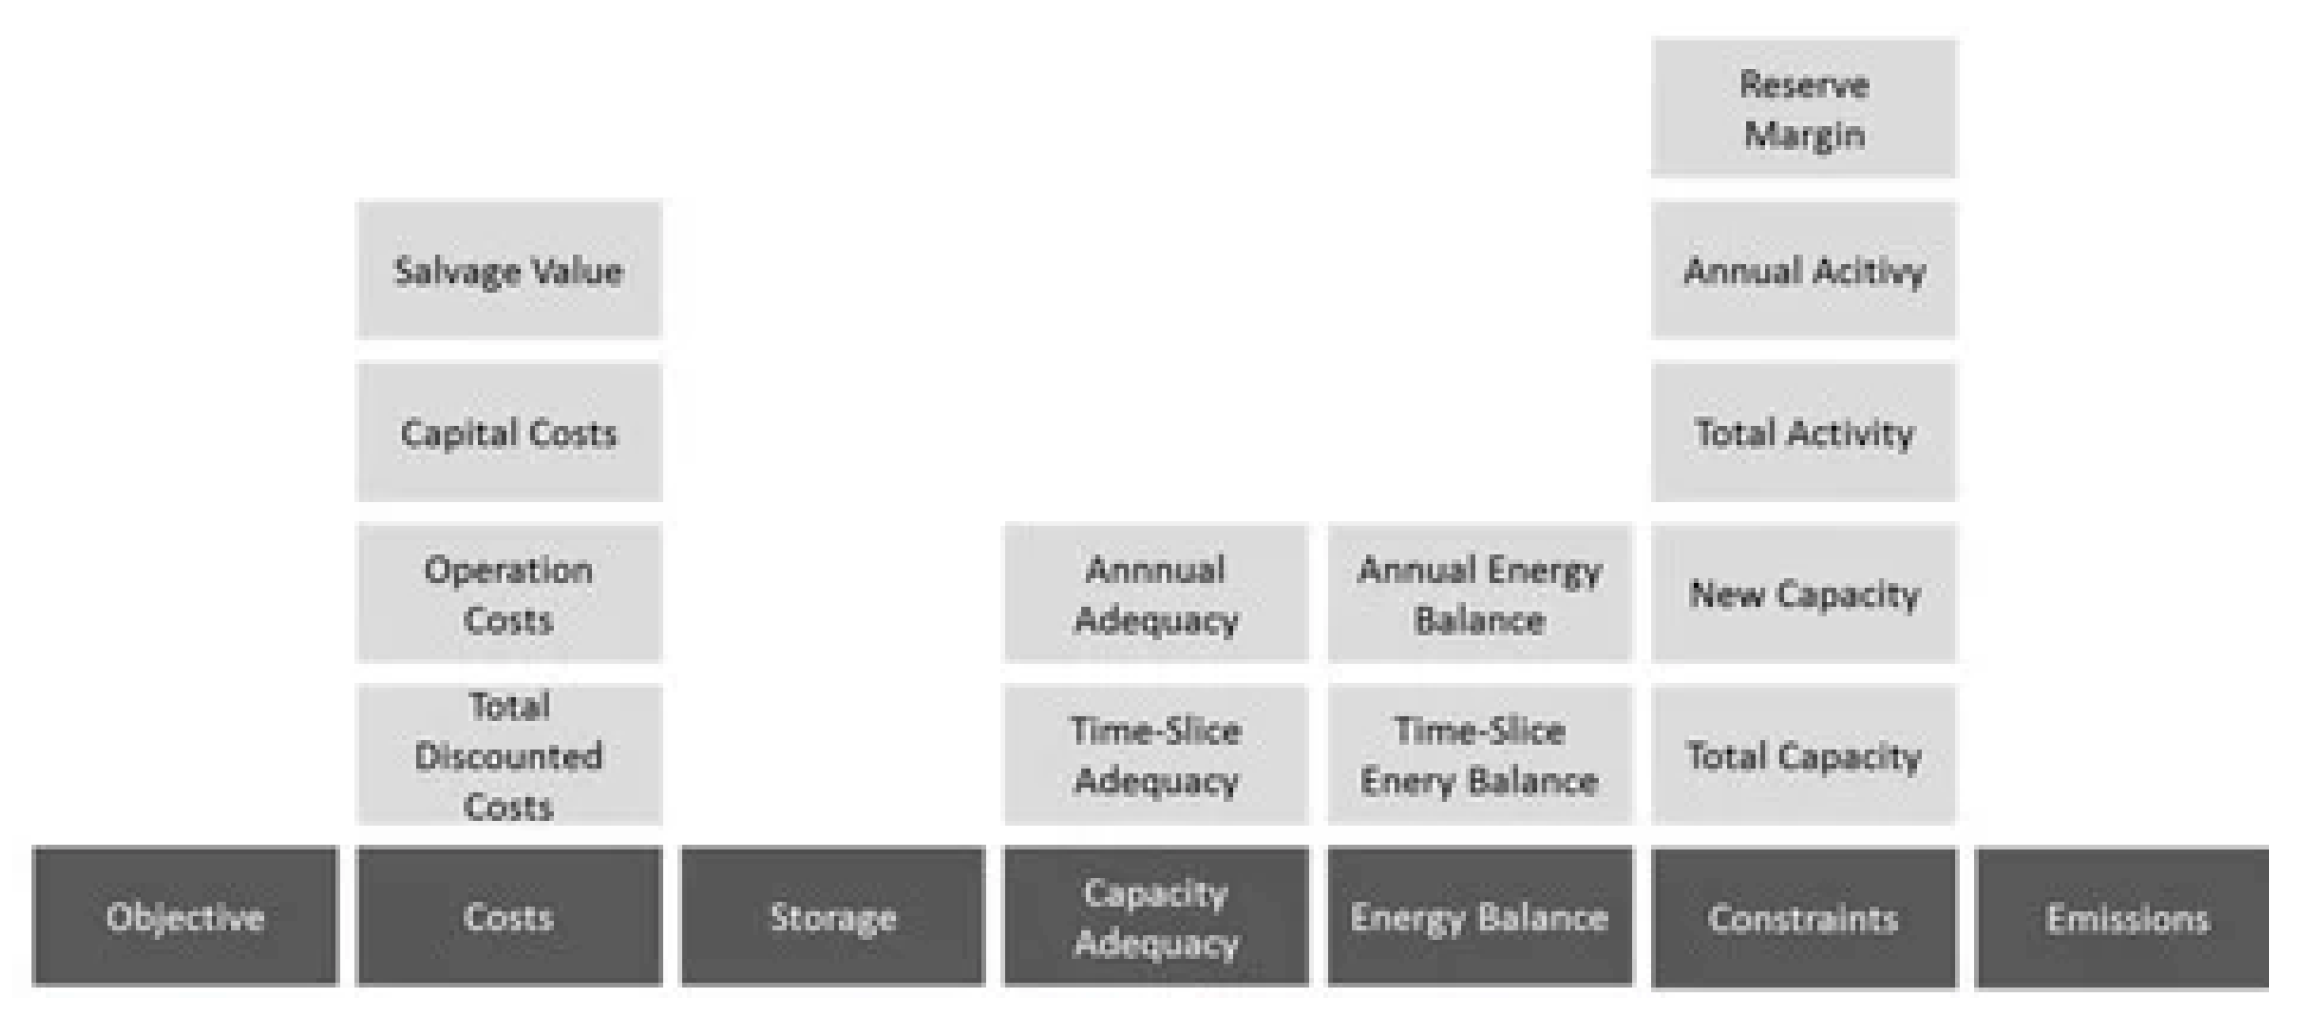
OSeMOSYS is a bottom-up, technology rich, linear programming, energy systems model [37]. It is built in a modular structure (as represented in Figure 1) and has been extensively applied [38,39]. Online teaching material is available [40] and over 59 national starter datasets, plus calibrated models are available online [41], allowing for rapid and custom analysis.
The objective function of OSeMOSYS is to develop a least cost energy system configuration, subject to various expansion and operational constraints. A full mathematical description is available from Howells et al. [37].
The overall objective function is summarized below as the total discounted cost in all (r) regions, (t) technologies and (y) years of the system.
min∑TotalDiscountedCost r,t,y
= ∑DiscountedOperatingCost r,t,y
+ ∑DiscountedCapitalInvestment r,t,y
+ ∑DiscountedTechnologyEmissionsPenalty r,t,y
− ∑DiscountedSalvageValue r,t,y
∀ r,t,y
3.2. Scenarios
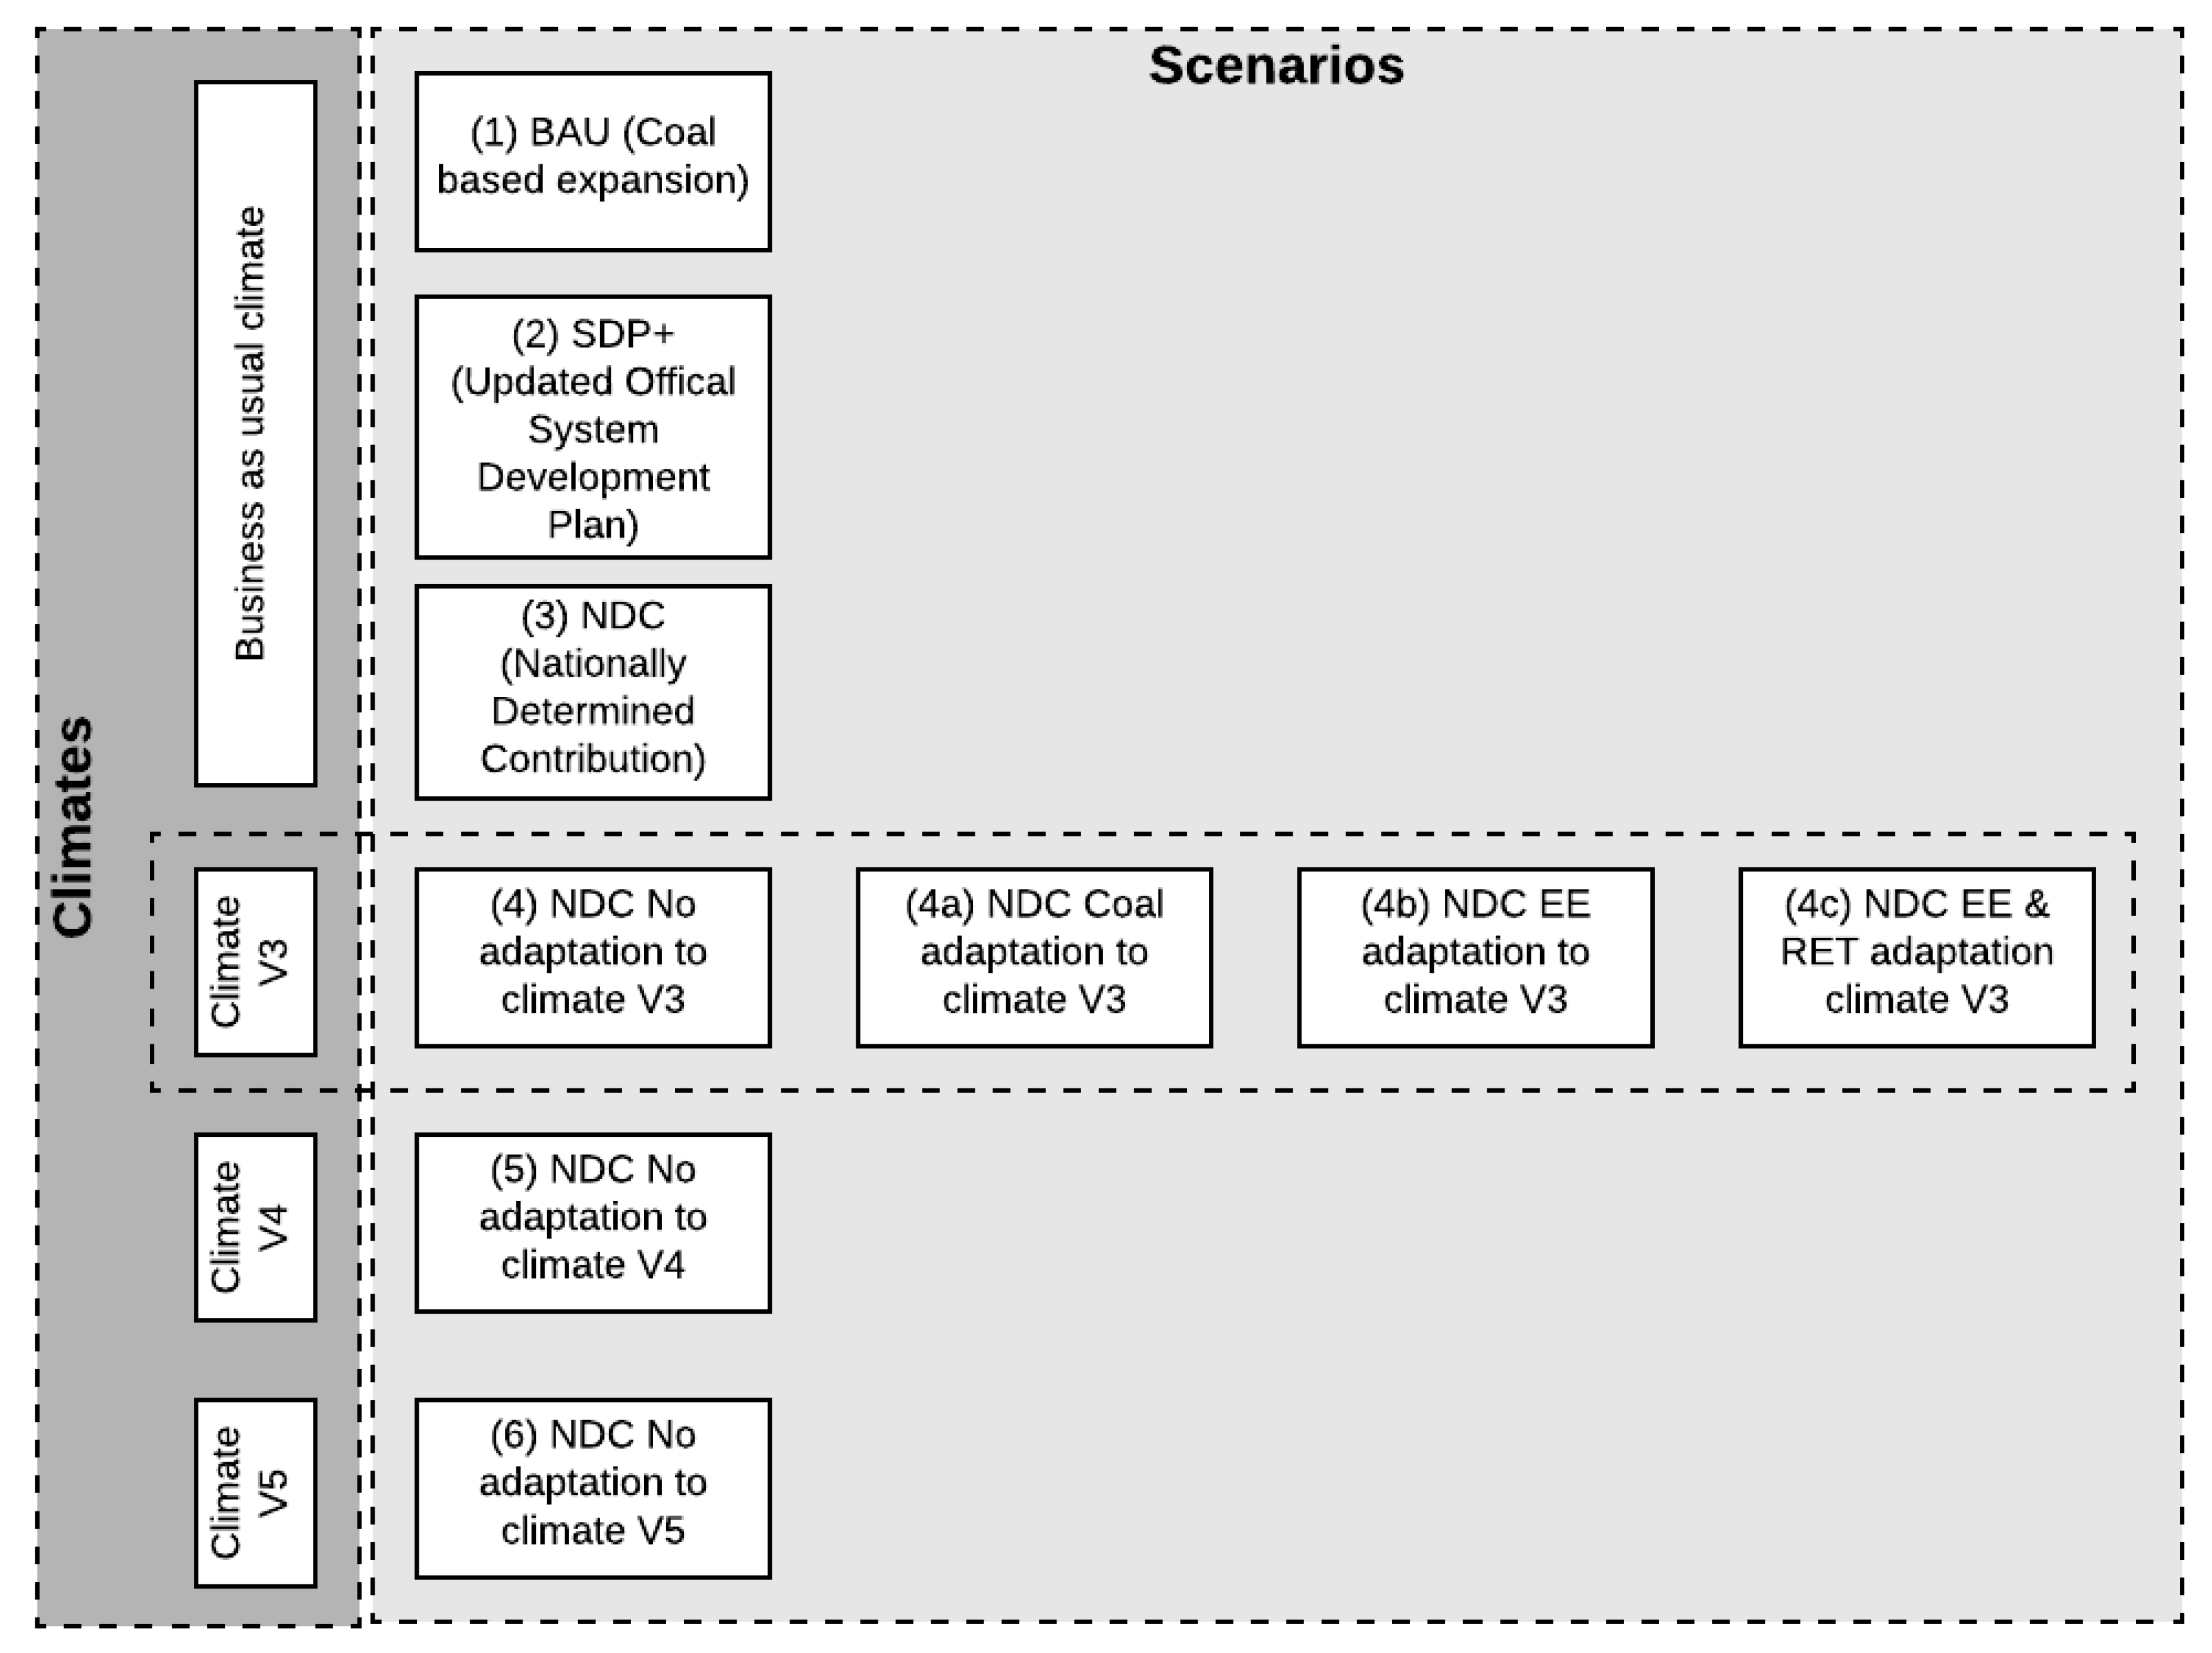
For this analysis, we progressively built a hypothetical NDC scenario based on the most recent national System Development Plan and its last NDC submission (Table 1). We then took that capacity investment scenario and subjected it to three climate futures. To simulate these futures, the quantity of water available for hydro generation, and corresponding capacity factors were altered in a manner that is consistent with those futures. Those load factors were derived from earlier work [10]. Finally, we took one of those climate futures and considered how Zimbabwe might adapt to it using either coal or a mix of renewables and energy efficiency. From these findings we drew insights. A scenario tree for reference is included in the annex.
4. Electricity Futures in Zimbabwe
Were anticipated hydropower regimes realized, Zimbabwe’s Nationally Determined Contributions (NDC) investments would result in a low carbon and cost-effective future. Will that NDC future expose the country’s economy or emissions trajectory to risks if the climate were to change?
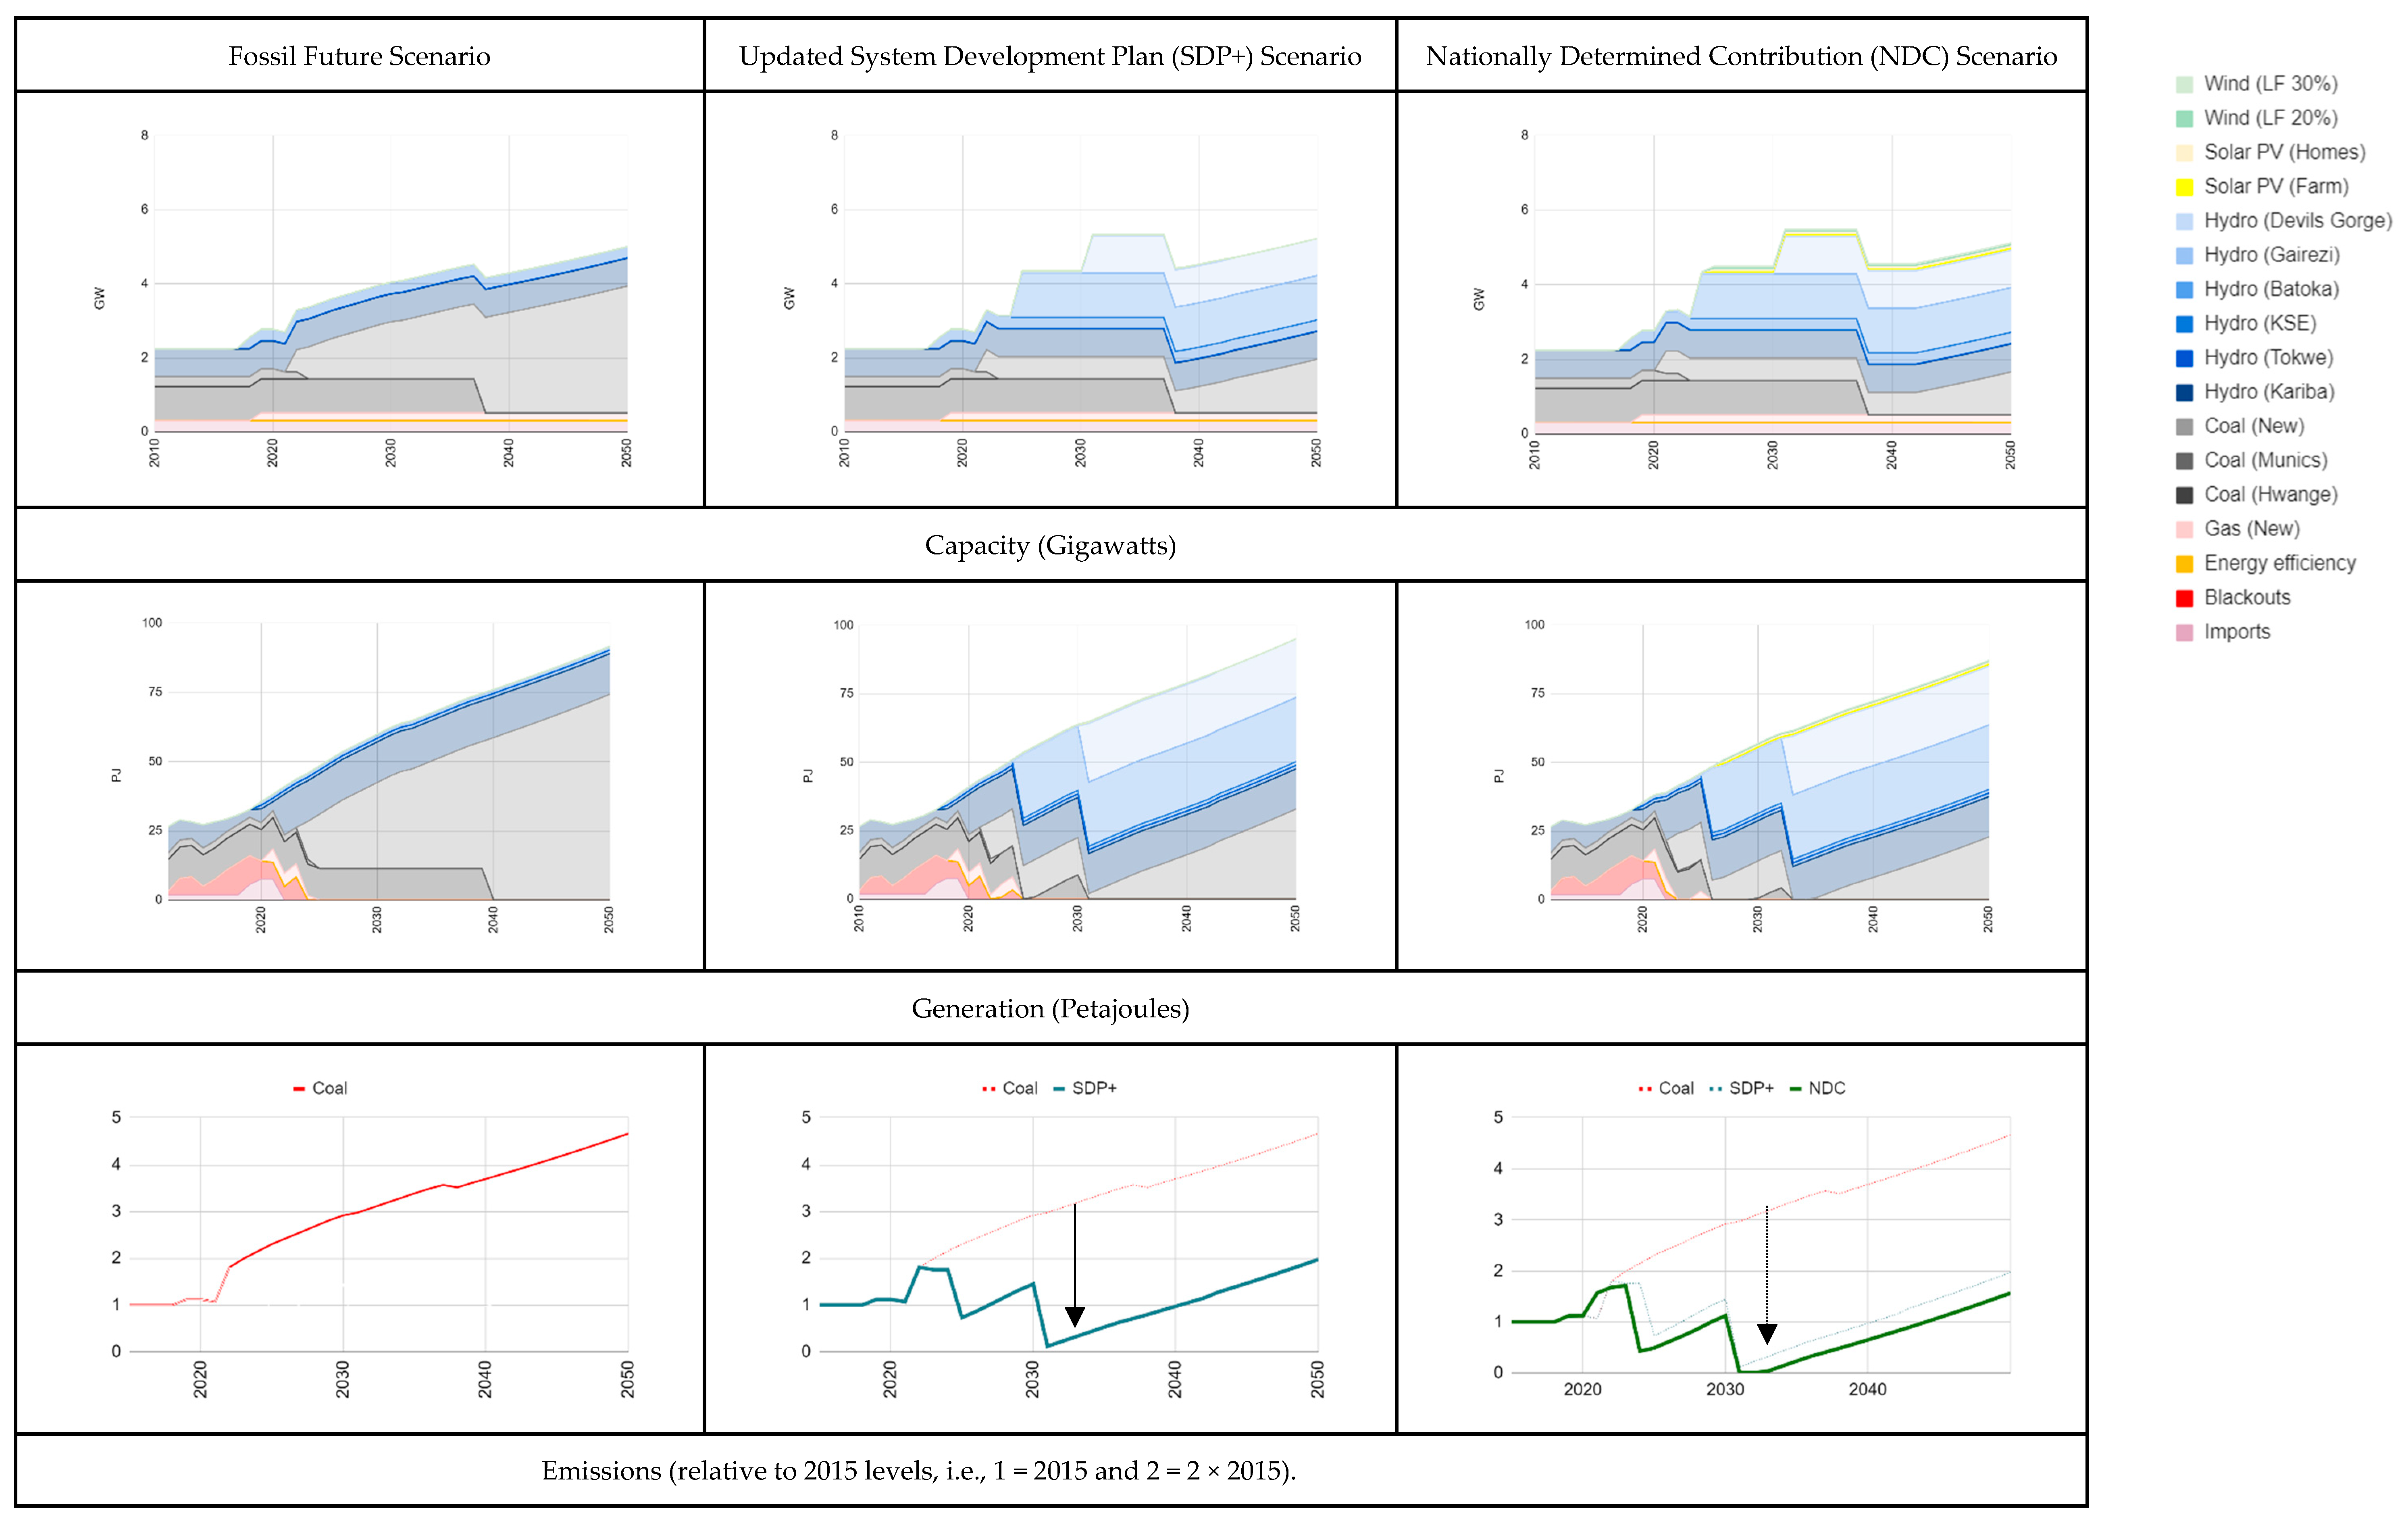
To show the impact on emissions reductions, a hypothetical scenario was first developed wherein the country meets its future energy needs with coal. The second scenario incorporates large, planned injections of hydropower with gas and renewables (solar). This is consistent with—and updates—the national System Development Plan. Finally, in the last scenario, efficiency gains documented in the NDCs are incorporated. In so doing, we developed a ‘Fossil Future’, ‘SDP+’ and ‘NDC’ scenario. Under each scenario, the increase in demand was adapted from the demand projections of the System Development Plan. In the NDC scenario, this demand was further reduced by modest energy efficiency measures. A scenario tree and selected data are highlighted below and in the Appendix A.
4.1. A Fossil Future
A fossil future in Zimbabwe would involve the continued expansion of its coal-fired power plants. In the same way as its water scarce neighbor in the South, dry cooling technology might be employed to ensure its resilience to low water availability [43]. While unlikely, a future based on coal provides this analysis (as it has done others) with a convenient backdrop against which lower carbon futures might be evaluated [44]. It would involve investment in new coal power plants that would compensate for both the increasing demand and the retirement of old power plants.
4.2. The SDP+ (System Development Plan)
The national system development plan [3] and its preferred generation expansion scenario of the national SDP is summarized in Table 3 below. It relies on imports from the SAPP and a set of new power plants to be built.
Although recent, there are deviations from that plan with some projects being late. Thus, aspects of the SDP have been updated to develop an updated version thereof called the SDP+. The only adjustments made are in the timing, so the plan allows for observed delays. Specifically:
Kariba South Extension (KSE) has been implemented [45].
Shilands—delayed (assumed fastest start up is 2022) [46]
Gwanda—delayed with 2.5 MW (i.e., 25%) operational (assumed fastest start is 2021; [47].
Hwange 7 and 8—delayed to 2022 [4]
Hwange 1 and 2 life extension delayed
Batoka—delayed (assumed fastest start is 2025; [48])
Solar investments are assumed to continue as planned.
4.3. The NDC Future
The SDP+ contains important elements of the country’s NDCs [2], most important of which are the hydropower and renewables investments. Not included in the SDP+ are energy efficiency measures. The National NDC indicates that energy efficiency will result in emission reductions that are close to an assumed energy demand reduction of 5% by 2030. With the demand adjustment, a new scenario is developed and modelled, called the NDC future. Note that the only difference between the SDP+ and NDC scenario is that the NDC scenario has 5% lower energy demand. That, in turn, results in lower fossil fuel requirements and emissions.
4.4. Zimbabwe’s Energy Future without Considering Climate Change
Figure 2 presents future capacities, power generation and emissions from the electricity system for a fossil future, an updated system development plan (SDP+) and to meet its nationally determined contributions (NDC). Note the deep emissions reductions in the SDP+ scenario (indicated by the arrow in the second graphic in the last row). Extra reductions due to increased energy efficiency lead to a future scenario that is impressive in its potential (indicated by the arrow in the third graphic of the last row). Next, we consider potential electricity futures in Zimbabwe to understand the potential of its NDCs and their vulnerability to climate change.
5. Climate Change Risks to NDCs
The NDC future creates vulnerability to Zimbabwe’s economy under climate change, and climate change threatens achievement of the NDCs.
The Zimbabwean electricity system is vulnerable to a changing climate. Power plants that use coal require water for cooling. In times of drought, water is scarce and cooling difficult. Hydropower exposes the system to high levels of risk—as in times of drought there is little water to pass through the turbines. In this analysis, we investigate aspects of these risks and how to overcome them. Zimbabwe’s neighbors in the Southern African Power Pool generate electricity from hydropower derived from the Zambezi basin. If there are regional water shortages, Zimbabwe will be unable to import to meet its own shortfalls—domestically or via imports. Furthermore, households rely on biomass for cooking, but biomass demand is outstripping supply. During times of drought biomass growth slows or stops, and this is reflected in slower supplies, which in turn accelerates deforestation. Thus, this too is vulnerable to climate change. (Deforestation rates are high. According to the United Nations Environment Program (UNEP), Zimbabwe lost an annual average of 327,000 hectares of forests between 1990 and 2010 [49]. Much of this was due to tobacco curing.) If cooking were undertaken with electricity, it would be independent of biomass constraints. However, it would be subject to the vulnerabilities associated with the choice of power generation.
At present, low rainfall is causing havoc in the region and Zimbabwe in particular. Zimbabwe is currently facing food shortages and power cuts resulting from drought, and further food shortages are expected during 2020 [50]. Electricity supply to mines, farms and other key economic sectors is being cut due to extremely low elevations in the Kariba reservoir and elsewhere. This cripples the economy [51].
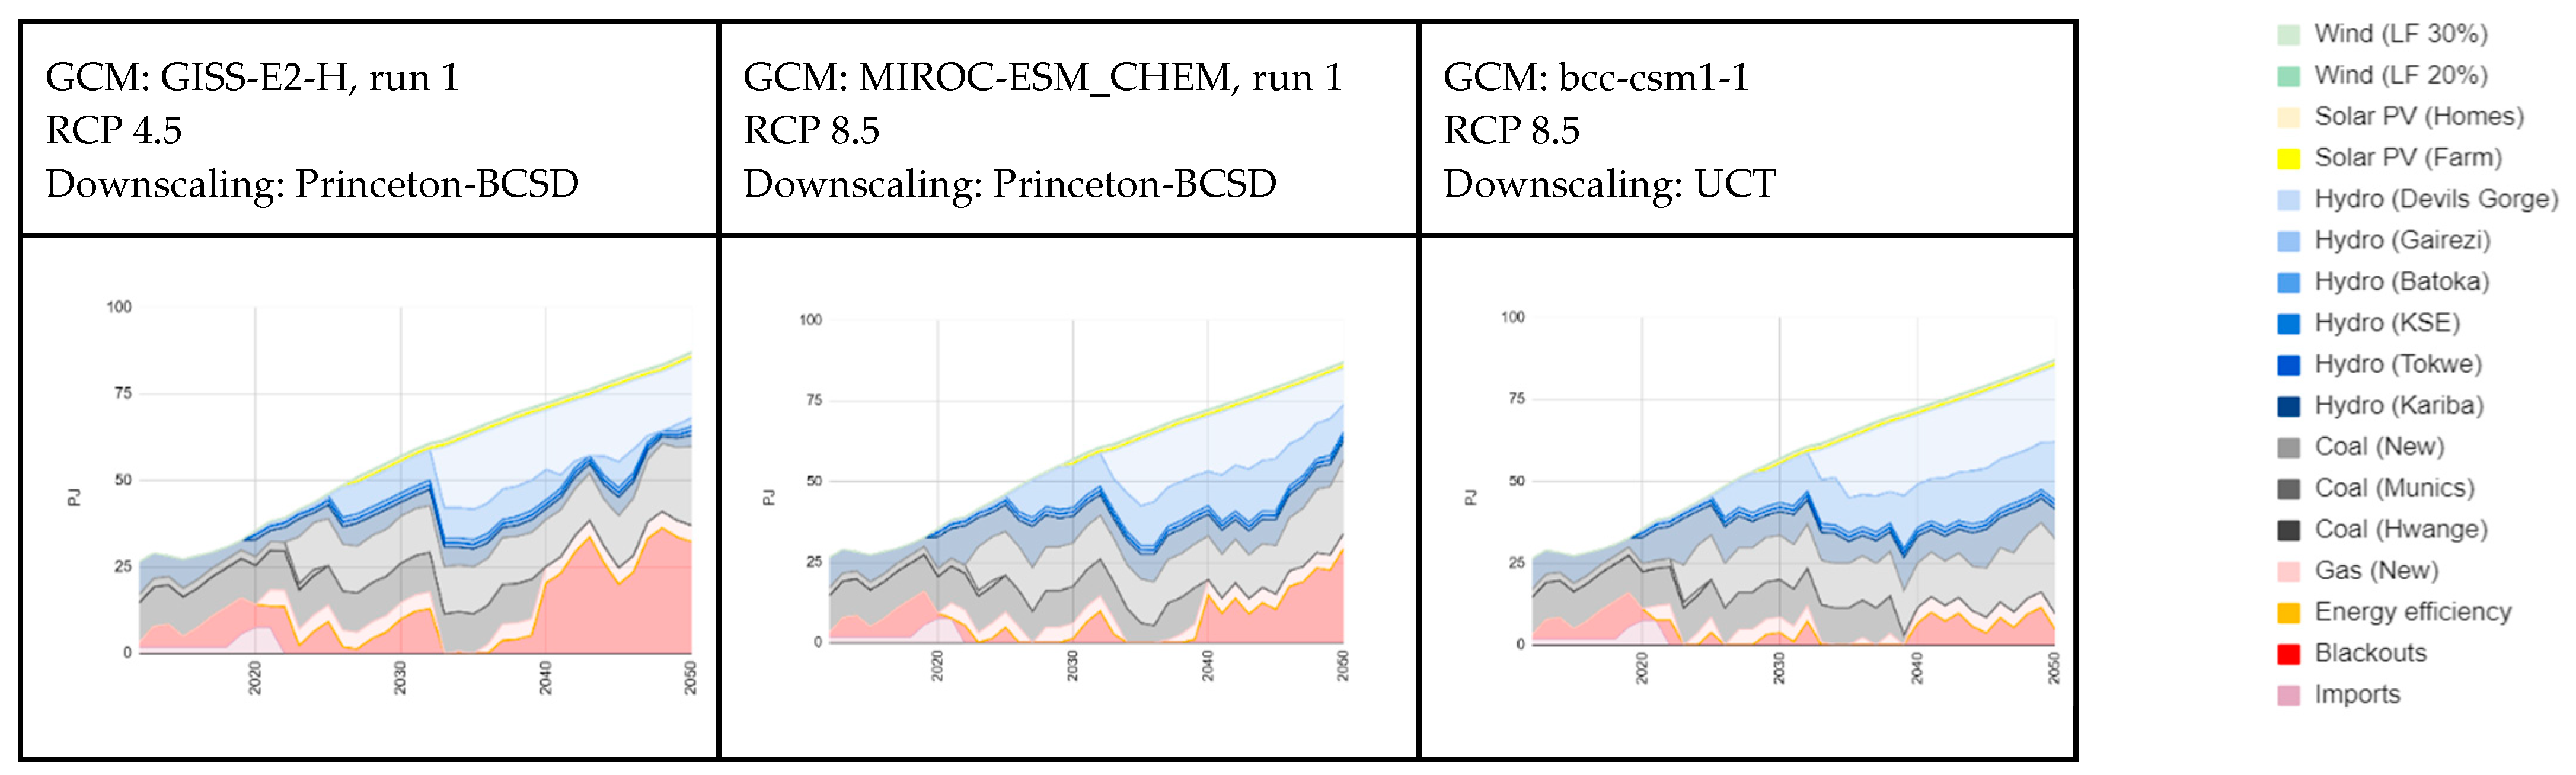
However, of interest is how the NDC infrastructure, if built out, will fare under future climates. We chose three futures from the publicly available climate projections used in the World Bank study, Enhancing the Climate Resilience of Africa’s Infrastructure ECRAI [52]. (The ECRAI work, apart from passing peer-review, developed estimates of potential annual hydropower availability for a set of climate futures. It did so by using downscaled rainfall data to calculate projected runoff, which was then allocated to different uses across the Zambezi basin. Hydropower production data from the water systems model are fed into an energy systems model of Zimbabwe, which then runs an optimization routine to estimate an electric energy price trajectory for the reference case infrastructure.) The three selected futures present a relatively dry set of futures from among the 65 Coupled Model Intercomparison Project Phase 5 (CMIP5) scenarios [53], in order to focus on risks to achieving the NDCs. (CMIP5 is the fifth phase of the Combined Model Intercomparison Project, which includes the suite of climate model runs used in the fifth IPCC assessment). Table 4 provides characteristics of the three scenarios, including the projected change in precipitation, temperature and potential evapotranspiration (PET) from the 1950 to 1999 baseline through to the 2030s. In that table, RCP refers to the Representative Climate Pathway [54]. Note that the specific model run codes are quoted directly from Cervigni et al. [10].
Figure 2 presents the electricity production in the NDC scenario under selected future climates. In all cases the country would experience significant economic damage. We see that, due to projected long-term droughts under the first two scenarios, variable generation from hydropower, in blue, would fall dramatically, resulting in a large share of electricity not being served to the economy. That is illustrated by the red areas in the graphic. As almost all formal economic activity requires electricity, unserved energy retards recovery and growth in an already fragile economy. To avoid these dire outcomes, it is likely that Zimbabwe would rely on coal-based generation or SAPP imports, thus increasing emissions and missing NDC targets.
There are several options for responding to climate change. Two of these are not positive: one results in high economic damage and another in high emissions. A third option is possible that is both economically sensible and has low carbon emissions, but it will require aggressive policy action.
6. Responses to Climate Change
Depending on how the country responds to that climate risk, there may be significant economic damage. There may be complete reversal of any emissions saved, or, by rapid adoption of clean options, there may be improved economic outcomes, reduced emissions and enhanced climate resilience.
Assuming that the NDC investments will be pursued, we consider three actions that might be taken to build resilience to climate change.
6.1. Option 1: Inaction
The first option is to simply do nothing. While extreme, there may be circumstances that lead to this outcome. If the power system cannot meet demand with the investment as laid out in the NDC, it is assumed that any shortfall in generation will simply go unmet, or fossil-based resources from within or outside of Zimbabwe would be deployed. This case will be used to contrast how the system might actively respond to a climate changed future, while keeping the NDC investments.
6.2. Option 2: Coal Reinforcement
In the next option, we assume that planners foresee that electricity demand might go unmet unless new capacity is installed. They do not change the NDC investments but supplement them. In this case, coal-fired power plants are constructed and operated. It is a convenient, conventional and safe option. Coal is inexpensive, there are local reserves and supply chains as well as operating procedures that are well known. This proactive investment pathway would mean not meeting Zimbabwe’s NDC targets.
6.3. Option 3: Clean Adaptation
In the clean adaptation scenario, it is assumed that there is a system transformation. All NDC investments are kept. However, larger quantities of solar and wind power are allowed into the system generating a combined maximum of 50% of the alternative supplies for any one year. Deep energy efficiency cuts allow up to 20% of the energy to be reduced and any extra requirements to meet demand are allowed to be met by new coal investment, as a last resort. Note that a 20% efficiency improvement is well within the range of international studies, and might be exceeded as modernization allows for a significant overhaul of energy-using infrastructure [55].
There are other options that require stronger political ambition. They include enhanced electricity trade between power pools and hydro systems in different basins. An important example is the development of Grand Inga. This mega project in the Democratic republic of Congo requires deep coordination. However, rainfall in the basins are independent (as are dry periods) and the Congo River basin does not show a general drying. A general drying is a characteristic of the Zambezi river basin.
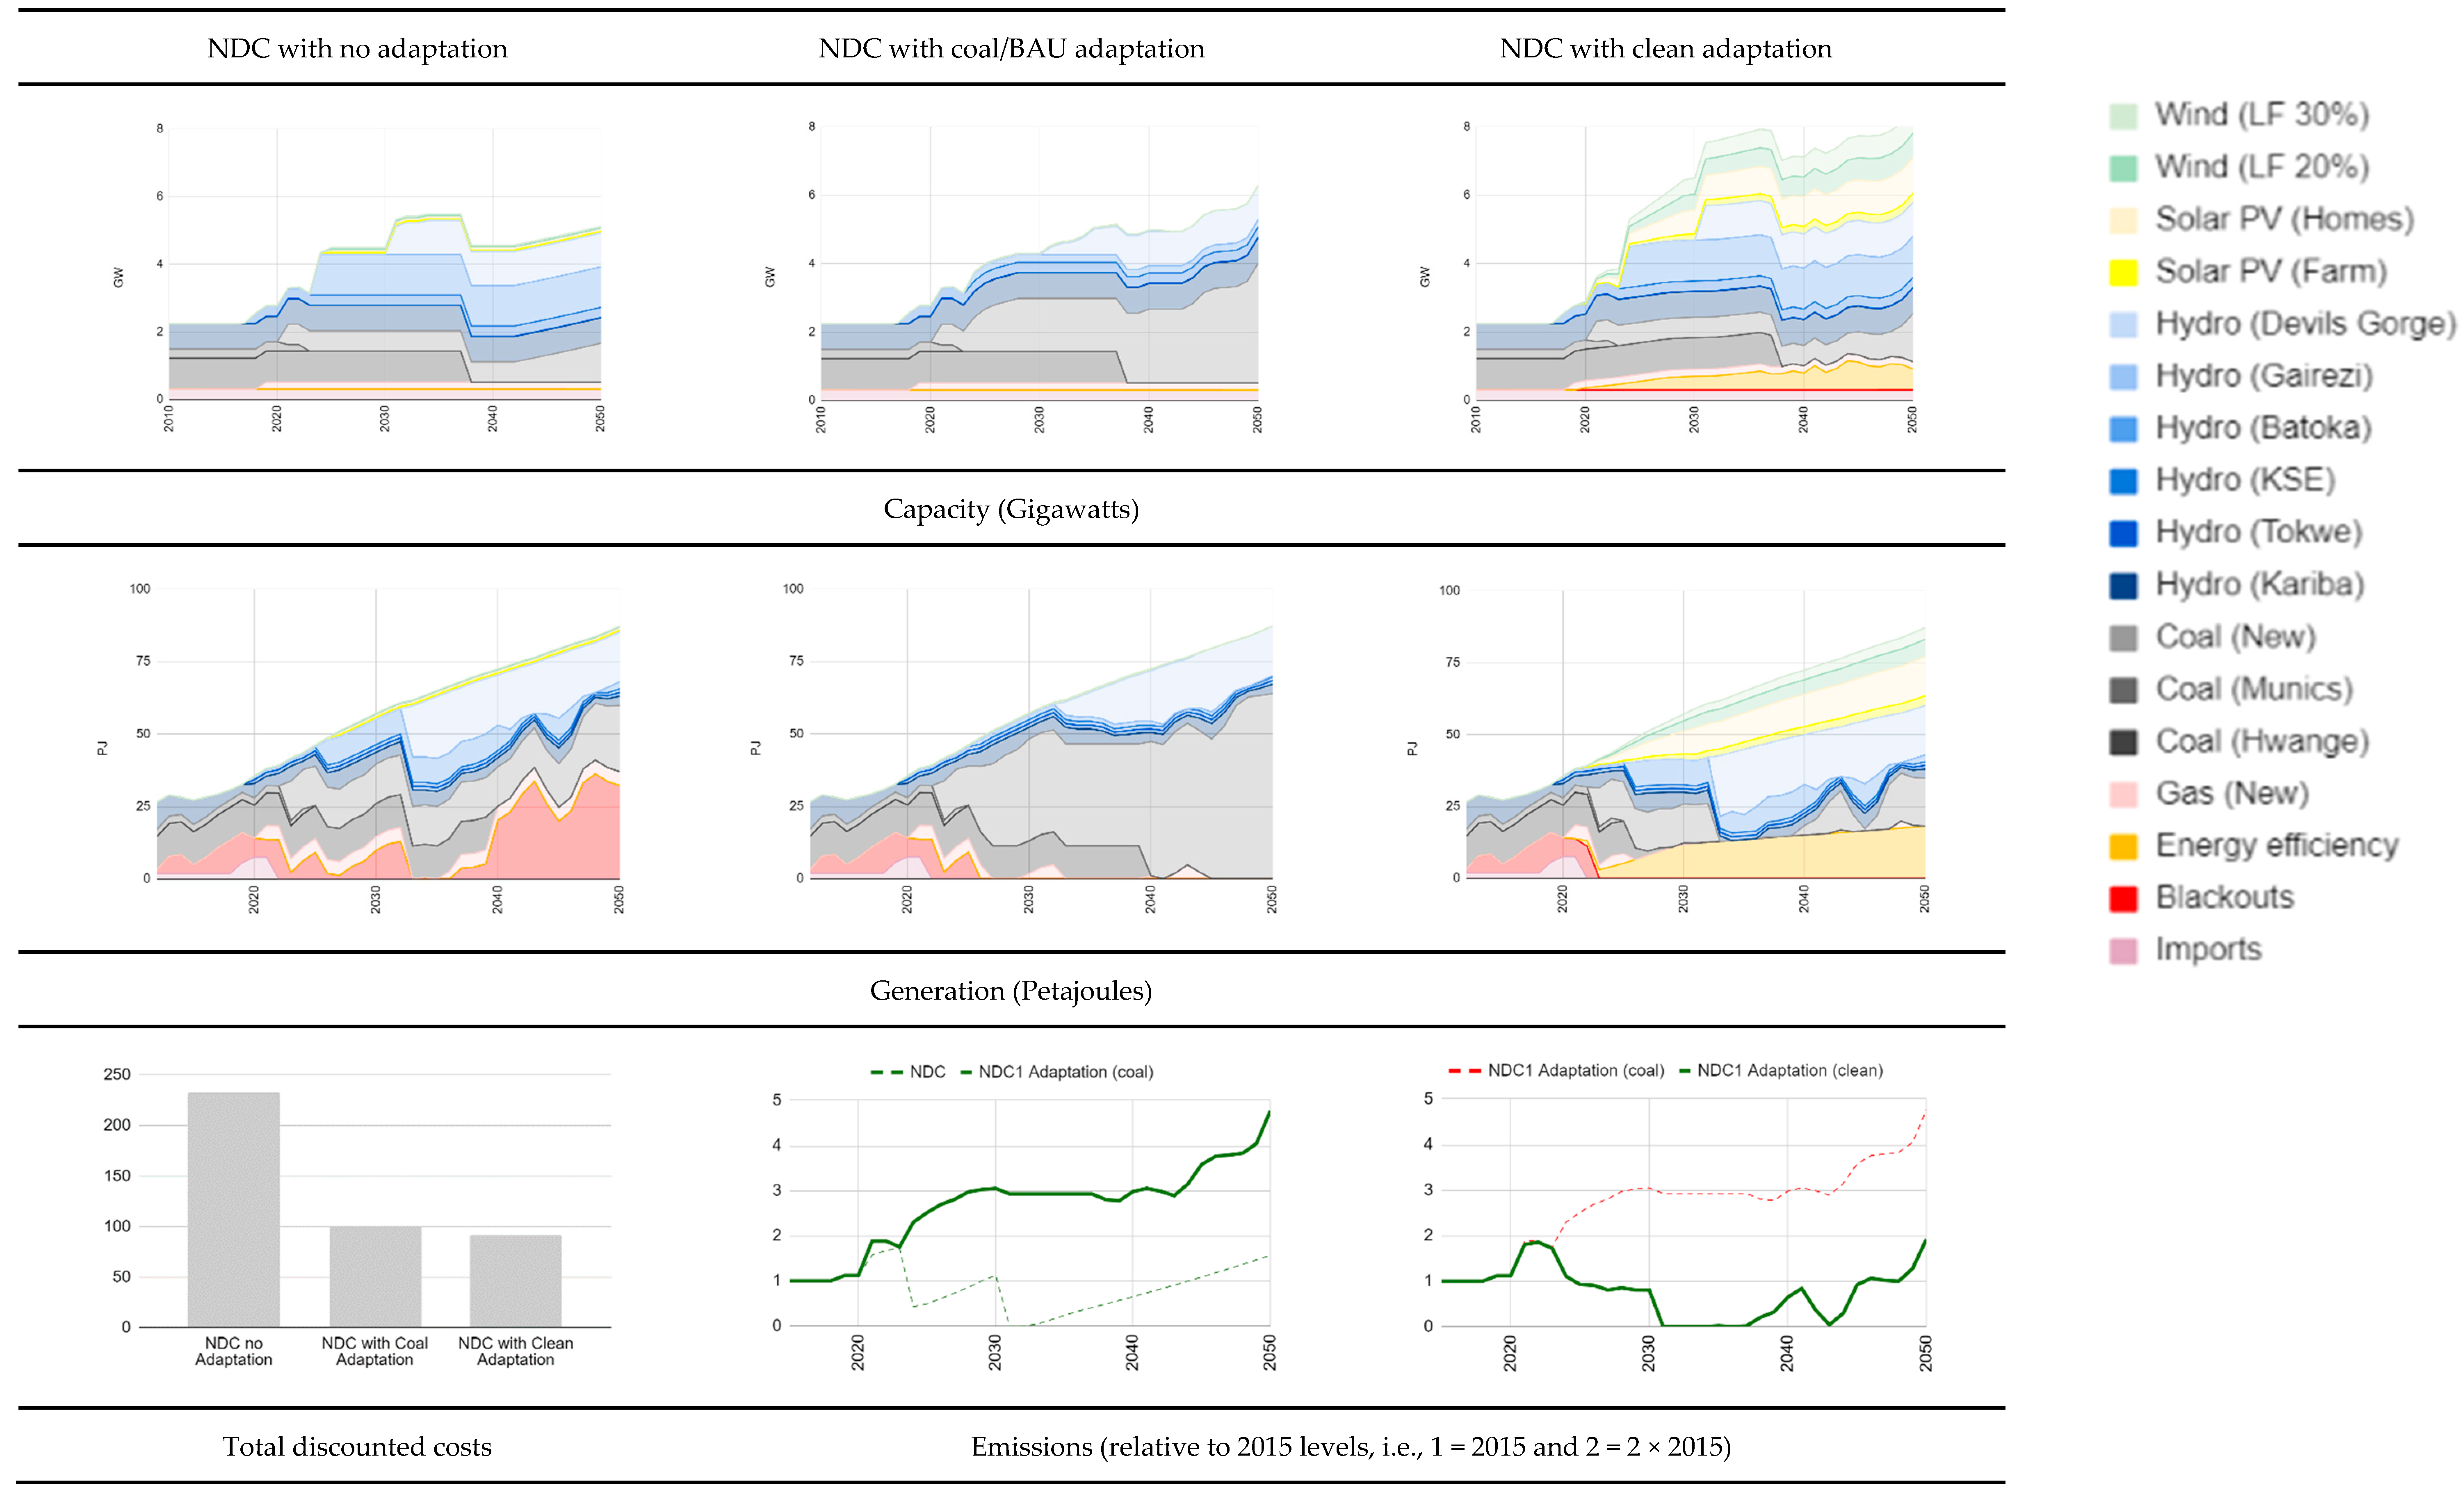
Figure 3 indicates future capacities, power generation and emissions from the electricity system based on NDC investments under the GISS-E2-H climate future with adaptive action. As can be seen in the bottom left hand side of the graphic, inaction results in high economic damage. In fact, the damage of inaction is more than double the cost to the economy of action. High levels of hydropower investments in the NDC scenario expose the system to water shortages that result from a drying climate. Sufficient electricity is not generated. The NDC investments result in national economic calamity, as they were not planned considering these possible climate futures.
In Figure 4, adaptive futures are considered. In both the coal reinforcement and clean adaptation options, there is a reduction in energy-not-served as new power plants are built and operated into the future. This reduces economic damage and results in the supply of reliable electricity. Note, however, that in the short term there are power shortages, indicted by the red areas of the graphics between now and the early 2020s. This occurs, in part, due to an over dependence on hydropower generation; with low rainfall, there is little corrective action can be taken. (New plant simply cannot be built in time). In the medium term, however, this is overcome with new investment.
In the second column of the graphic are the results for the coal reinforcement case. Of importance is the fact that emissions, shown in the middle bottom graphic, skyrocket. The dashed line indicates the NDC target, where the climate is anticipated to be favorable. The solid line indicates a more than quadrupling of emissions by the end of the analysis period. This is almost as high as the Fossil Future scenario with no NDC investment, and almost all NDC environmental gains are lost. However, as shown in the graphic on the bottom left, the avoidance of economic damage avoided, and the total cost of the system to the economy is less than half of that when there is inaction.
The clean adaptation case is critically different. It takes advantage of renewables, high energy efficiency updates and balances the system with hydropower and coal. (In so doing it requires less hydropower and coal). Its emissions are lower than coal reinforcement and lower than the original NDC targets. Furthermore, the extra renewable energy capacity costs are offset by lower fuel costs and reductions in demand due to energy efficiency. However, while the benefits are strong, so too is the level of institutional requirements, new market structures and supporting measures, such as coal stockpiling. This allows coal plants to be re-worked to provide balancing and flexibility, rather than baseload needs. Interestingly very little new coal is needed during most of the clean adaptation case.
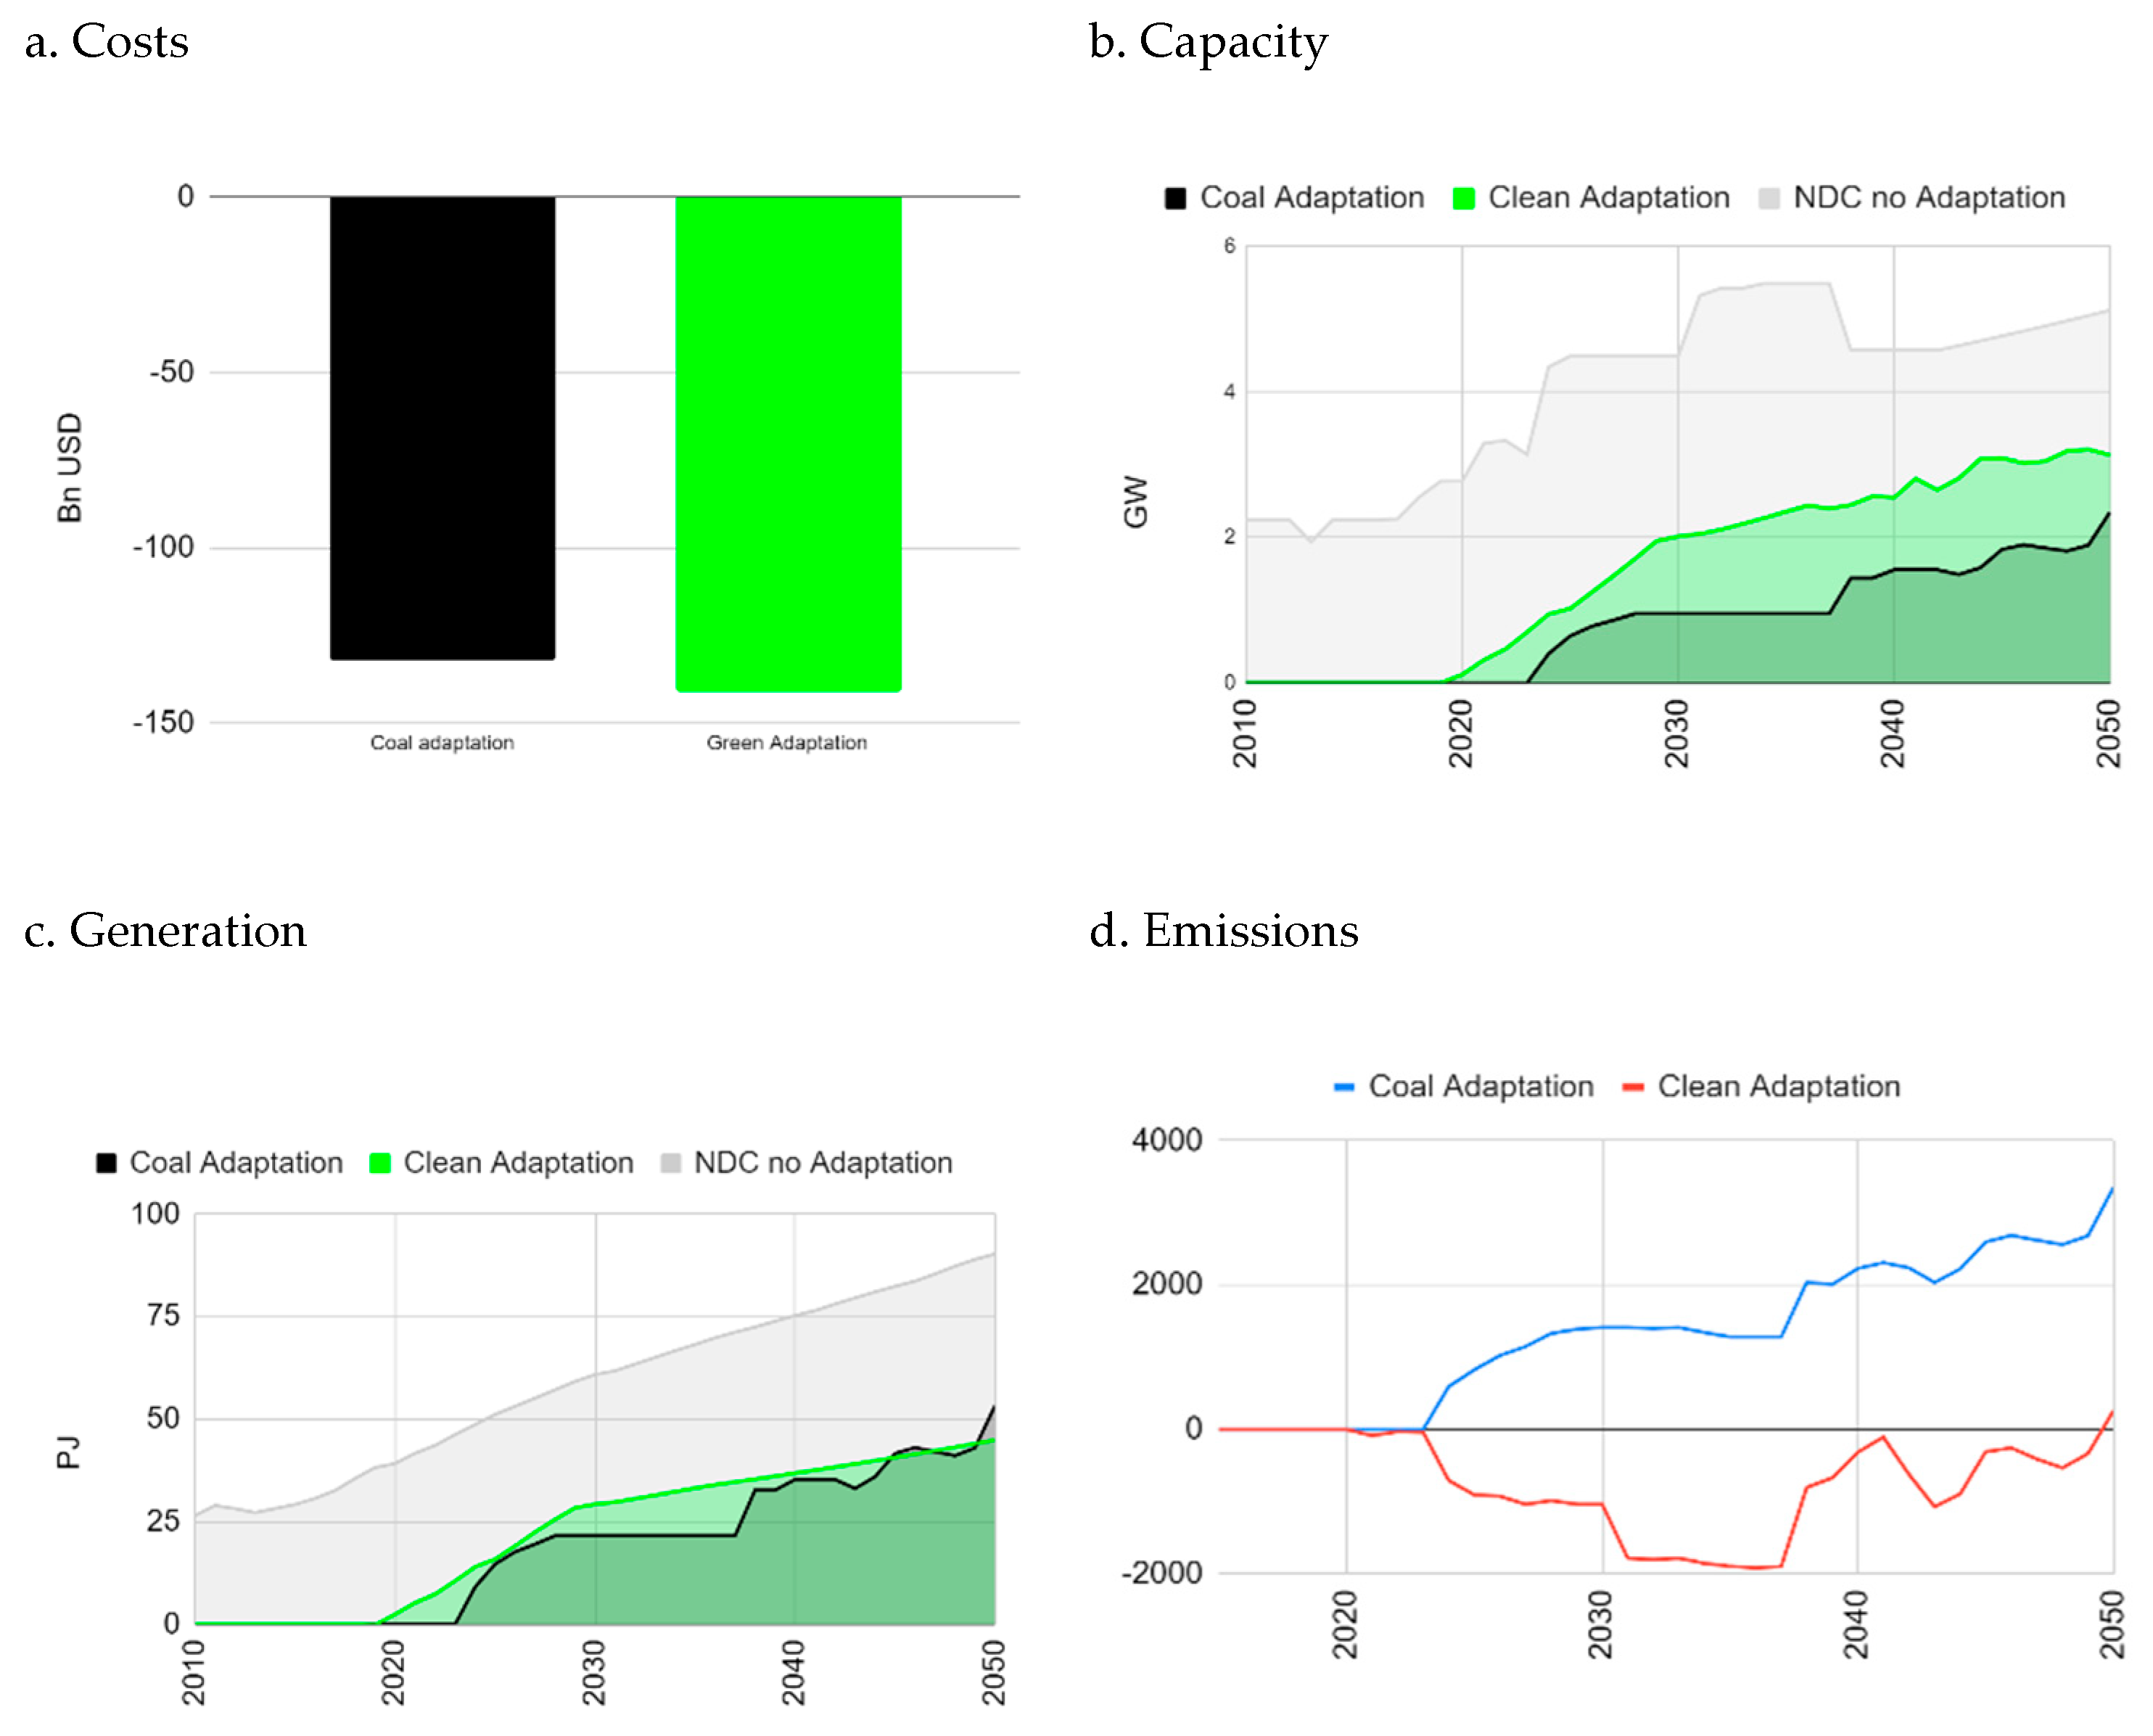
In Figure 5, we summarize critical differences between the NDC–no adaptation future and coal adaptation versus clean adaptation. Noted in Figure 5a, in both cases costs are lower. With the clean adaptation case being of marginally lower cost than the coal adaptation case. The costs included are direct costs, including capital, operating and maintenance, fuel and unserved energy costs. There are other costs associated with clean adaptation that are not accounted for. Those costs include market and institutional restructuring required to expand and manage a structurally different power system, and these should be further investigated.
In Figure 5b, under ‘Clean Adaptation’, we see (noted in green) that there are significant additional investments in renewable energy technologies. This apparent ‘over investment’ is required to overcome relatively low ‘capacity factors’ of the renewables considered. On the other hand, in Figure 5c, we see that comparable quantities of energy are generated from coal in the ‘Coal Adaptation’ and renewables (and displaced by efficiency measures) in the ‘Clean Adaptation’ future.
Importantly, as noted in Figure 5d, emissions are lower than the NDC–‘No Adaptation’ future. They are significantly lower than the ‘Coal Adaptation’.
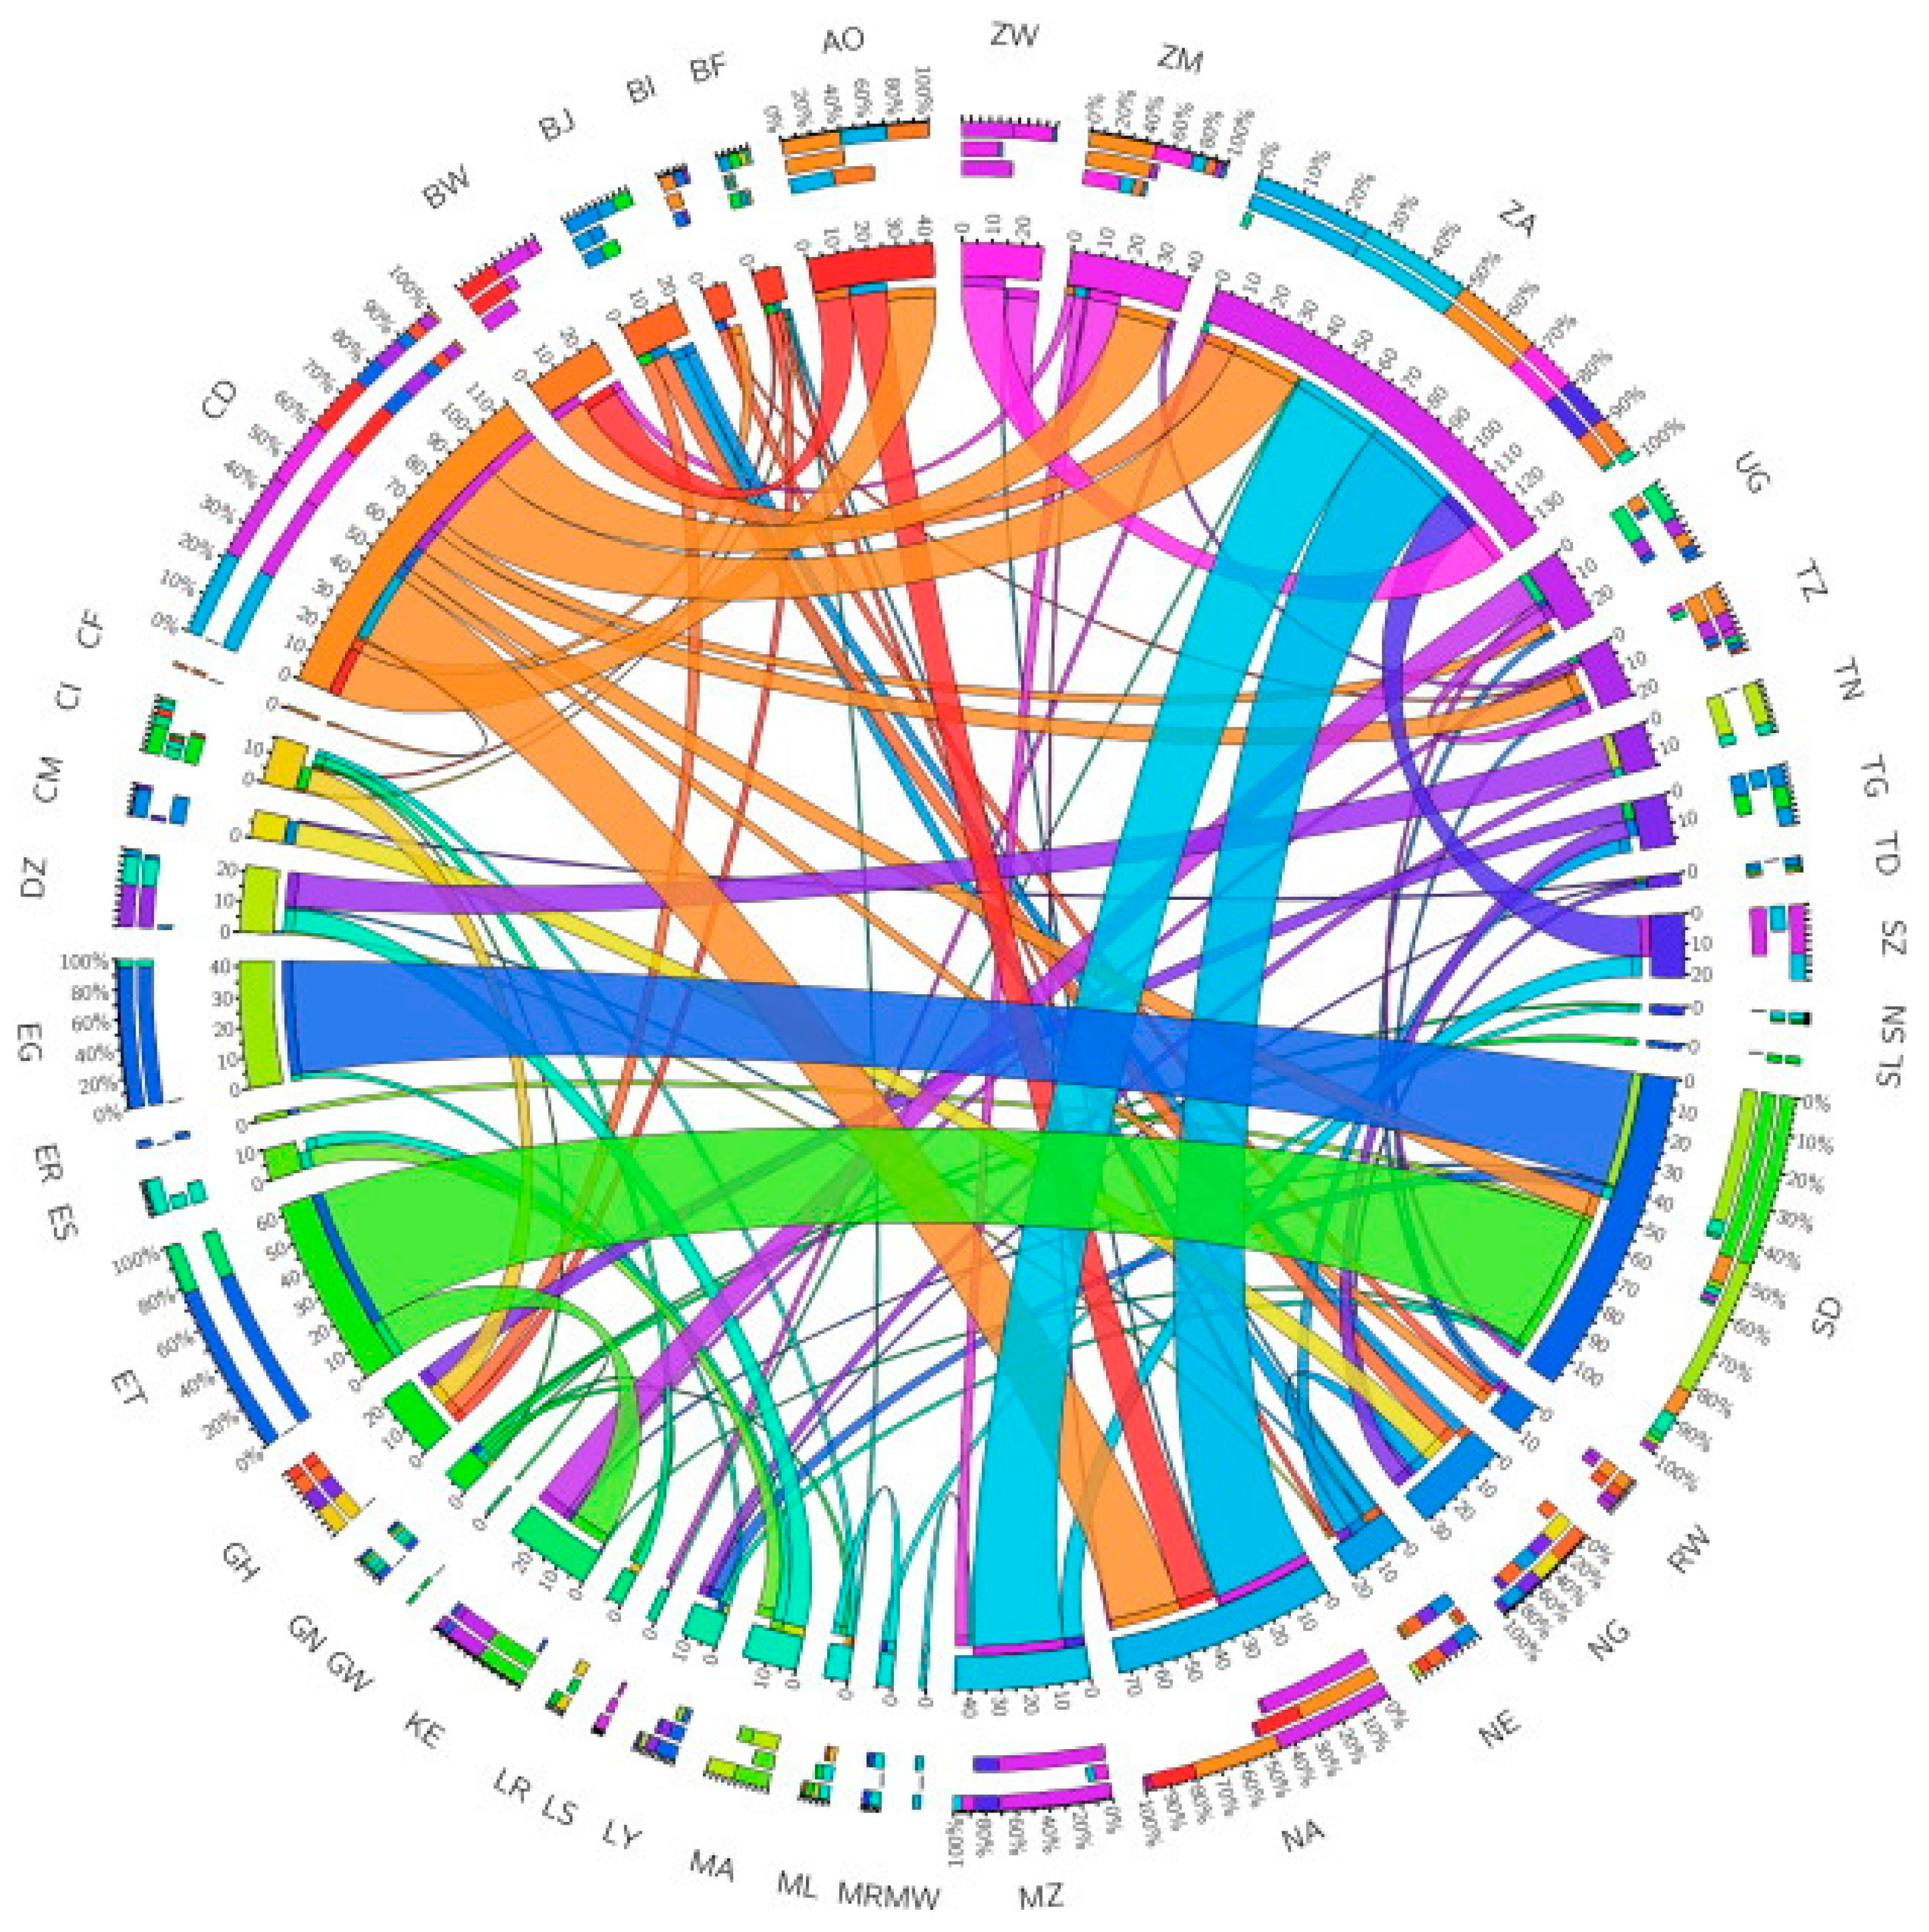
Beyond the scope of this analysis, but critical to highlight, is the role that regional power trade might play. As noted earlier, with political will, imports from other basins will allow for burden sharing when supplies are limited from hydropower in some basins compared to others with more reliable or independent supply. To give an example of the potential, consider the analysis of Taliotis et al. [22] and Figure 6. That focuses on potential trade across Africa. While Taliotis does not consider the impact of climatic change, the inference that trade might be a critical arrow in the quiver to tackle climate change, while exploiting electricity megaprojects, is clear.
The key message is that clean adaptation with NDC’s requires proactive action. At a national level, this is lower cost and lower emitting—securing all of the NDC mitigation and more. Inaction is dangerous and will continue to damage the economy. A fossil future is secure and achievable but is highly emitting.
7. Findings and Limitations
The analysis is a proof-of-concept piece, and, thus, is undertaken with several key limitations. These are appropriate given the setting of the analysis but are worth noting.
Climate proofing NDCs and exceeding mitigation targets is feasible, low carbon and, potentially, economically beneficial. This will require deep market adjustments that are discussed in detail later. However, aiming to meet the NDC targets with no climate resilience plan is economically dangerous. An NDC future is at risk under climate change and, with reactive coal-based reinforcement, it will lead to all emissions gains being lost.
The analysis is a proof-of-concept piece and is undertaken with key limitations. While appropriate given the setting of this analysis, they are worth noting. Analytical limitations include:
- Limited climate runs. The goal was to uncover potential risks associated with following NDCs (with the underpinning System Development Plan). Thus, we simply explore selected dry climate futures. They indicate risk. Future work would do well to evaluate a large ensemble of scenarios in order to capture a more comprehensive picture of the vulnerability, resilience and adaptivity of the country’s NDC future and measures that might improve it.
- Limited scenario calibration. The calibration of the scenarios was necessarily limited. They drew from the best available existing studies. While more scenarios would be useful, in order to generate them, underlying work is required. That would include integrated assessment of water uses and constraints under different scenarios, in order to understand water availability for hydropower generation and balancing.
- Missing detail for policy formulation. Specific detail is missing in this analysis that would allow for more concrete policy formulation. That is deliberate, as such formulation should ideally be undertaken collectively. Its direction should also be informed by analysis of the granularity developed here.
- ○
- Structural changes will be required to realize the clean growth scenario mapped out together with its benefits. Some of those structural changes may be exceeded, some might not be realizable in the timeframes considered given local conditions and constraints. Though scenario limits are consistent with international experience elsewhere, implementation constraints should be explored and fed back into the scenario definition.
- ○
- Technology characteristics are taken from international averages. These should be honed to be consistent with local conditions and realities. However, such data does not yet exist in the public domain. They include detailed and up-to-date: energy efficiency policies and measures by sector, with potentials and costs; an assessment of the operational regimes required to allow for the restructuring of conventional power generation to be used for balancing; an estimate of the costs and performance changes associated with making the latter transition.
- ○
- Regional market design is not considered. Were hydropower regimes to become very wet, would excess power from the SAPP be easily absorbed by South Africa? Would it be feasible to reduce coal-based generation until the subsequent dry spell? This will develop on the dynamism and scale of the spot market.
- Pan-water basin analysis is not considered. This is particularly important as an interconnected Africa might draw from hydropower plants in different basins. Different basins have independent rainfall patterns. The likelihood of two droughts occurring simultaneously become lower.
- No assessment of ecosystem nor institutional requirements is made. Importantly, these requirements should be unpacked into a set of action pathways with clearly delineated milestones that various actors need to reach, without which, systematic progress will be difficult.
8. Summary and Recommendations
Without aggressive action Zimbabwe’s NDC gains may be lost at high economic and environmental costs.
The NDCs and Zimbabwe’s climate compatible growth can be made resilient. A key feature of the clean adaptation path required to get there is the combination of new renewables with hydropower. The model assumes a perfect market is adopted to this new investment and that changes in operation occur. In reality, the market is not perfect and will need to be restructured. The model indicates that deep and achievable changes in the operation of hydropower will need to occur. Those too, while demonstrably achievable, will require a change in the traditional operation of hydropower as baseload generation only. Equally important is the aggressive adoption of deep energy efficiency.
While the clean adaptation path promises strong benefits, it requires strong commitment, political will and restructuring of the power sector. To get there, a pragmatic policy pathway and milestone approach is recommended [56].
A roadmap and milestone approach to the implementation of clean adaptation policies and measures (PAMs) is critical. This begins with clear appraisal of specific PAMs, including the regulatory framework and market rules required for successful deployment (both in terms of investment and, thereafter, operation). It then moves to assess and identify the support required for implementation. That support is delineated with specific target milestones to be reached and is aimed at providing actionable, contextual intelligence.
- Appraisal, testing, evaluation and implementation of clean adaptation policies and measures (PAMs). The efficacy of the PAMs are to be assessed. That includes understanding their cost and benefit. The costs and benefits are to be pragmatically assessed ensuring that climate resilience and policy coherence (within and across sectors) is accounted for.
- Regulatory framework and market rules will be required for successful investment in and running of the PAMs identified. Note that these PAMs can include sharp departures from existing rules. An example is moving from an energy only to a balancing market.
- Supporting measures and decision making are then evaluated. Moving beyond regulations and market rules required, the national context and institutional ability to assimilate the PAMs are assessed. That national context will influence freedom to operate, market absorption, consumer behavior and societal acceptance of the technologies and business models associated with the PAM [57].
Specific milestones are then developed to see through the delivery of the clean adaptation PAMs. These include appropriate: national positioning and allegiances, safety culture development, business management structures, legal framework, regulatory framework, power system stability, institutional mandates, institutional resourcing and human capacity requirements, etc.
A characteristic of planning in Zimbabwe should now include a step change in policy analysis generally so as to take into account, where pragmatic, climate vulnerability. This work demonstrates that billions of USD and economic damage (or livelihood) are at stake. Although how this would propagate throughout government is beyond the scope of the recommendations here, specific suggestions for the planning fir the energy—and electricity—sector are detailed. Key policy recommendations needed in the short term include the specific identification of PAMs to meet clean adaptation aspirations. These should, necessarily, be more granular, specific and substantial than at the level identified here. (This would include, for example, the development of technical interventions, policy measures to implement the intervention, the efficacy of those measures (relative to their technical potential), and cost and benefit by sector and subsector, in enough detail so as to develop investment level information—see [11] for an example in South Africa.) This should also determine the actual feasible levels of wind, solar and energy efficiency penetration, with appropriate subsystem cost curves. The modelling framework employed nationally to develop the SDP and NDCs needs to be updated to allow for a systematic changing of the planning approach to account for uncertainty. A specific advance would be a running analysis across a large ensemble of potential climate futures—as well as other development uncertainties. In so doing, the infrastructure and objectives that are at risk can be identified via an emerging set of techniques. (See recent work for South America and Africa undertaken by the WBG and others [10,35]). This should be undertaken in order to identify optimal trade offs and pragmatic next steps in energy infrastructure deployment.
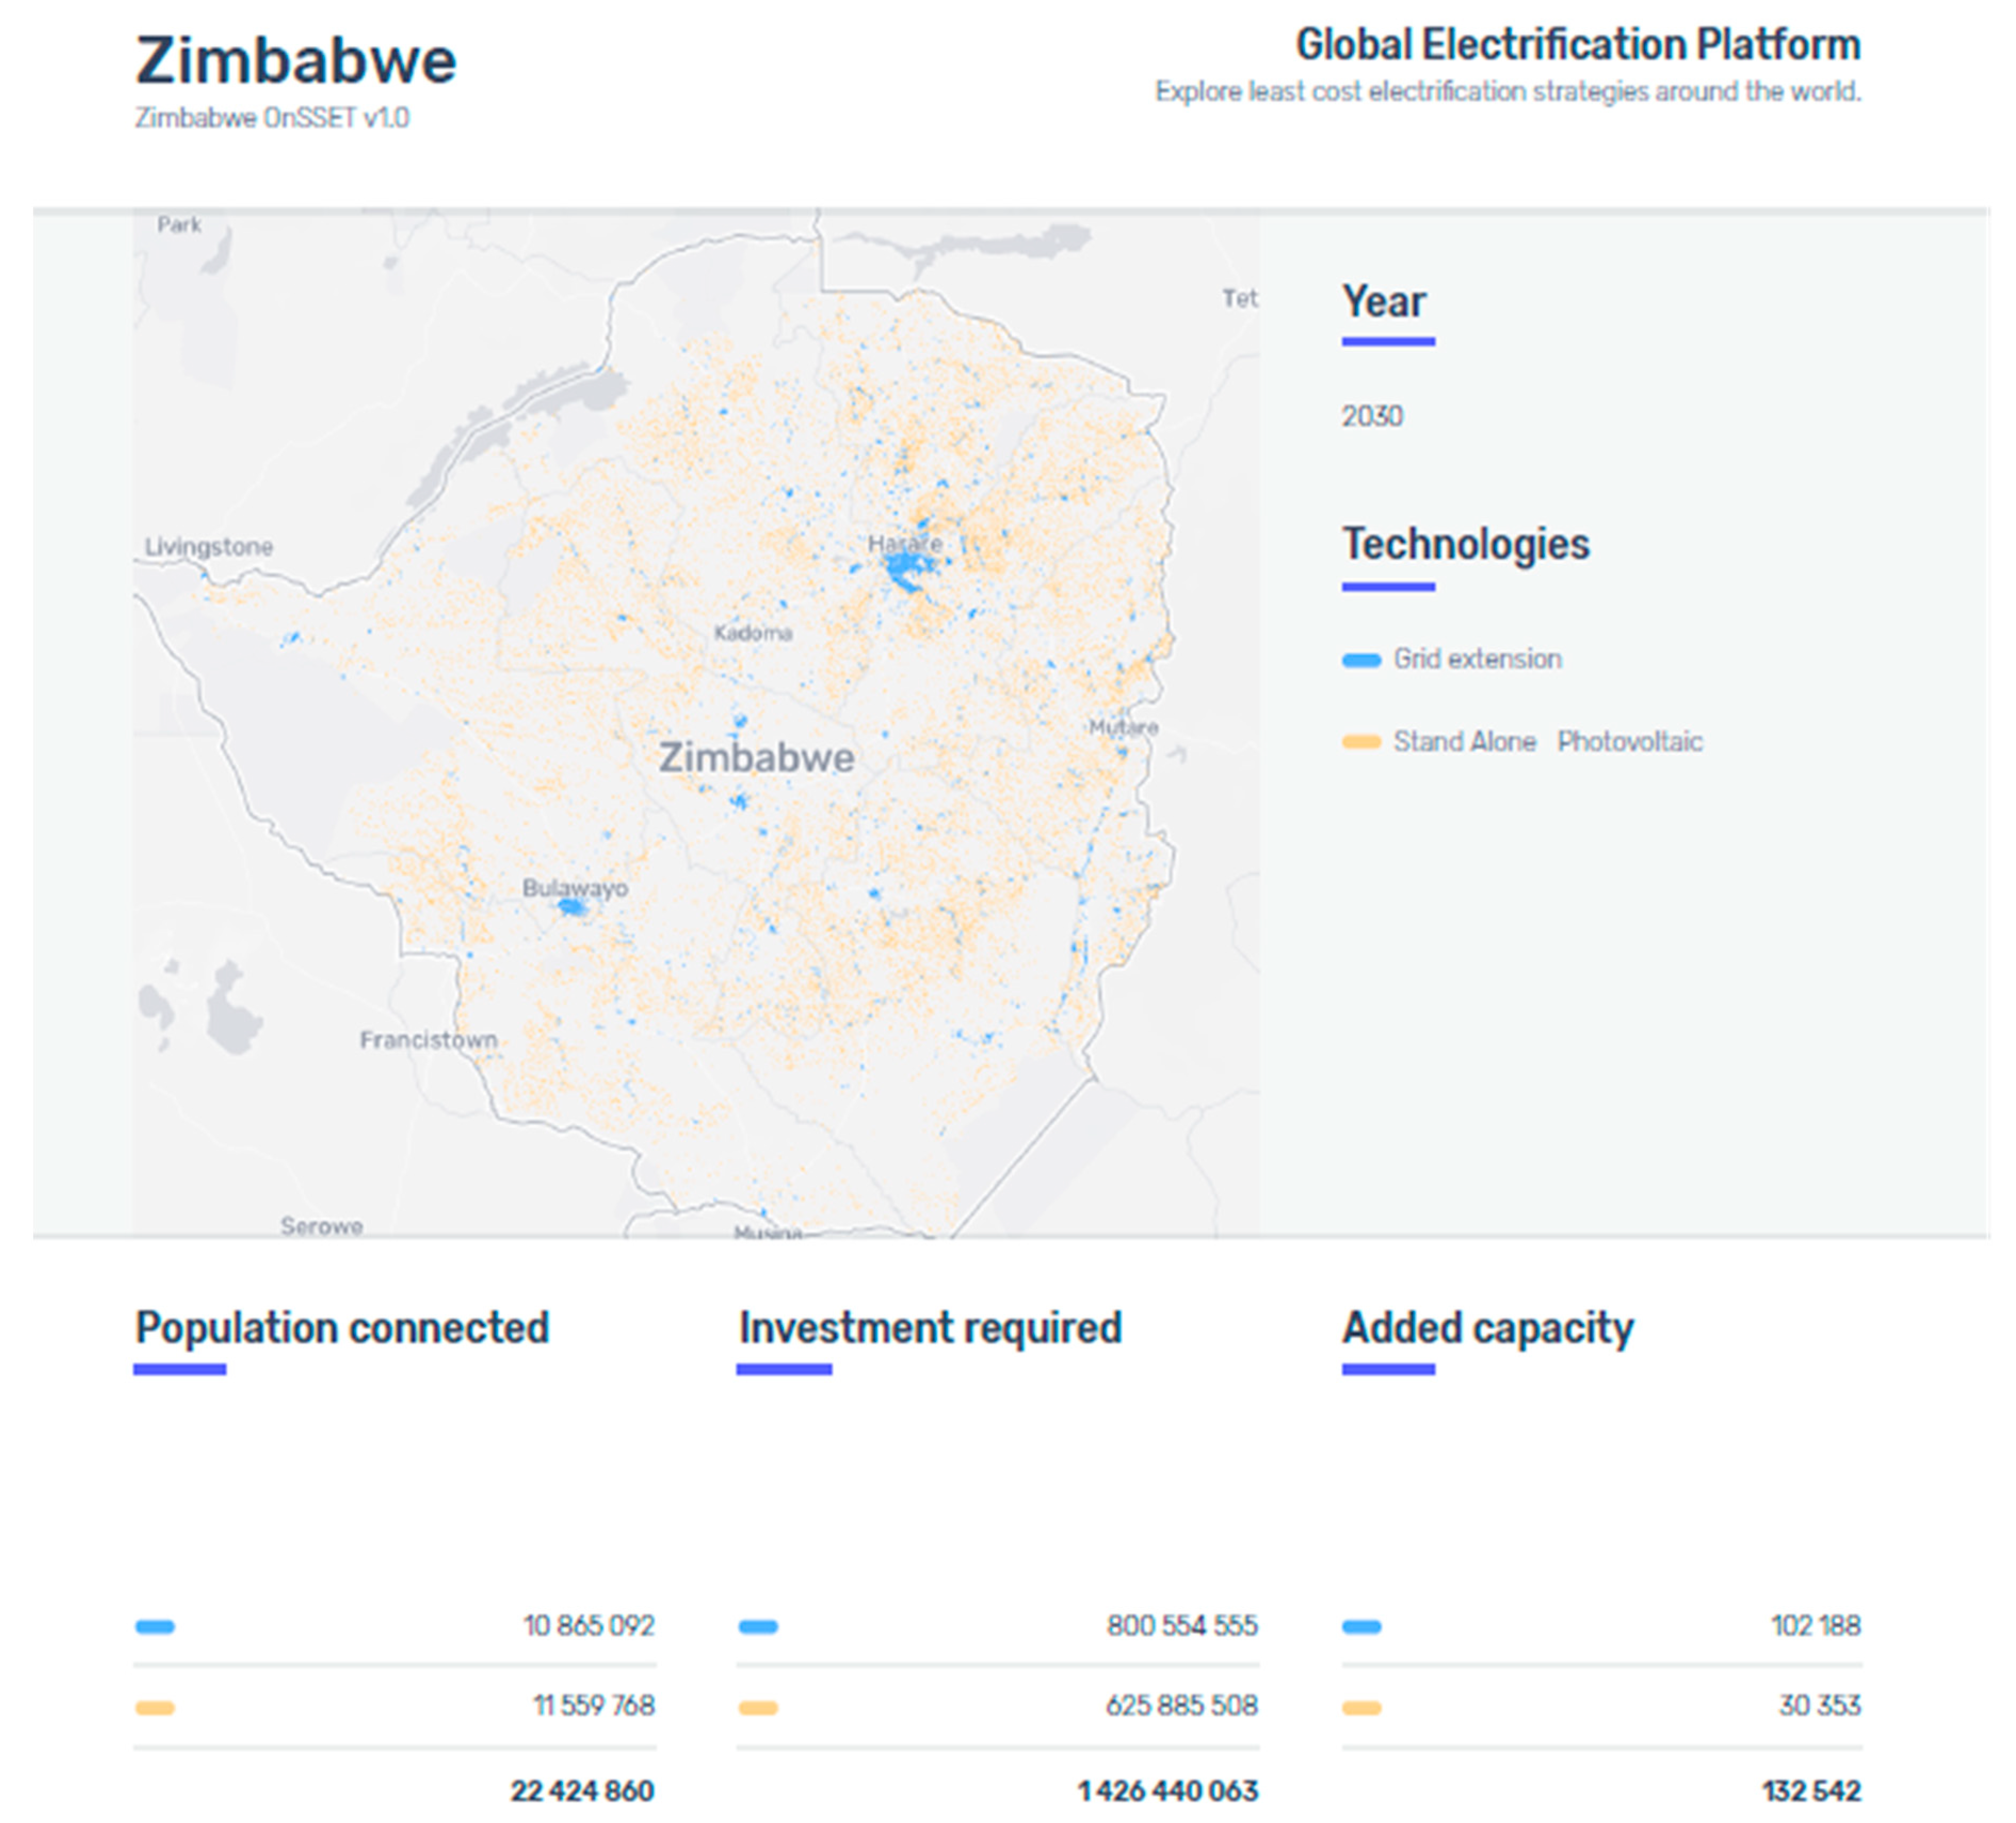
Furthermore, policy coherence within and across sectors is needed. For example, within the electricity sector no systematic integrated analysis between bulk power development (such as the hydropower and coal expansion) and off-grid expansion (illustrated in Figure 7) has been made. Integrating this analysis allows for gains as costs are harmonized and the co-benefits of off-grid electrification and reduced emissions can be simultaneously captured. Examples for such analysis can be found in Moksnes et al. [58] and Mentis et al. [59]. This is especially the case as larger scale investment may be sensibly integrated, and then identified in the national NDC, and such analysis is becoming ubiquitously available. For example, Figure 7 shows information from the Global Electrification Platform that houses hundreds of potential renewable energy off-grid electrification investment scenarios [60].
Across sectors there is a clear need to ensure that there is harmonization between hydropower planning and water and agriculture policy. Approaches to improve inter-sector planning are on the increase. Pathbreaking work for Africa quoted earlier includes Sridharan et al. [35]. However, efforts need to be made to build local capacity to undertake such analysis routinely as a part of the policy process. Work has shown that vulnerabilities can reinforce themselves, and that reinforcing—and deep vulnerability—will go unnoticed without appropriate analysis [61]. An example includes upstream water diversion and pumping for agriculture, simultaneously reducing the potential for hydropower to generate electricity while increasing the demand of electricity for pumping.
In order to develop the clean adaptation strategy outlined in this report, there will need to be changes to the regulatory framework and market rules that govern the power sector and coal-purchases, as well as energy efficiency markets. These are in keeping with trends developing globally, and investigating the potential for the development of a balancing market is, thus, recommended. Such a market should allow conventional power plants to act (or be retrofitted to act) in a manner to allow the power system to absorb electricity from lower carbon intermittent sources such as wind and solar and, while performing the balancing (rather than primarily producing power), they should be financially rewarded. When there is high concurrent production of wind, solar and hydropower, production from coal-fired power plants will drop. However, due to the structure of coal purchase contracts and the employment of miners, coal production is unlikely to stop. A special reserve fund should be developed to allow for the stockpiling of coal when it is not needed. This will allow for continuous mining operations. The level of the stockpile should be sized to allow for its use to support coal-fired generation when it is needed, such that the average continuous production of coal equals the average variable use of coal. Zimbabwe is a part of the Southern African Power Pool (SAPP). At times of high wind, solar and hydropower production there may be cost benefits to exporting power into the SAPP. As with the domestic coal stockpiling described here, it may be that there are similar opportunities in neighboring countries. They might reduce local coal generation and consider developing a similar stockpiling initiative.
Given the impact and transboundary nature of power trade and river basins, as well as the deep vulnerabilities counterbalanced by the opportunity for climate compatible growth (CCG), this work could be valuably extended from Zimbabwe to assess the Southern African region.
Energy efficiency and demand side measures are growing in importance as is the subject of innovation. New business models and remote billing are allowing for the development of new energy efficiency and services need to be developed. A special focus should be the assessment of large-scale, advanced energy efficiency adoption. However, the national context and potential to take advantage of these specific PAMs needs to be developed to account of new technology and business models including: the freedom to operate (including supply chain constraints); the absorptive capacity of the local market; their compatibility with consumers and society, etc.
The steps outlined above will be required while developing a pathway and milestone approach as recommended. Without so doing, clean adaptation policies and measures (PAMs) may be ineffective or have limited use. Without these PAMs, the economy and environmental performance of Zimbabwe is at risk. However, if implemented sensibly, there is clear potential for Zimbabwe’s growth to be both low carbon and economic.
Author Contributions
Conceptualization, M.H., B.B., P.C.B.; Methodology, M.H., B.B., P.C.B.; Writing—Original Draft Preparation, M.H., B.B.; Writing—Review & Editing, P.C.B.; Supervision, P.C.B.; Project Administration, P.C.B. All authors have read and agreed to the published version of the manuscript.
Funding
Core funding from Zimbabwe’s Reconstruction Fund (ZIMREF), supplemental funding from the Climate Compatible Growth (CCG) program of the Foreign Commonwealth and Development Office (FCDO).
Institutional Review Board Statement
Not Applicable.
Informed Consent Statement
Not Applicable.
Data Availability Statement
All data and supporting information are openly available.
The Model File is Available here:
(accessed on 11 April 2021)
All supporting code is described here:
(accessed on 11 April 2021)
The Scenario data files are found in the links below (the scenario key is in the annex
Appendix A.3):
Scenario 1:
(accessed on 11 April 2021)
Scenario 2:
(accessed on 11 April 2021)
Scenario 3:
(accessed on 11 April 2021)
Scenario 4:
(accessed on 11 April 2021)
Scenario 4a:
(accessed on 11 April 2021)
Scenario 4c:
(accessed on 11 April 2021)
Scenario 5:
(accessed on 11 April 2021)
Scenario 6:
(accessed on 11 April 2021)
Open datasets and model kits for all continental African, and several Asian and Latin American countries, to help accelerate this and related analysis, can be found at:
https://climatecompatiblegrowth.com/starter-kits/ (accessed on 11 April 2021).
Free online training to describe the use and development of OSeMOSYS models from the Open University can be found here: https://www.open.edu/openlearncreate/course/view.php?id=6817 (accessed on 11 April 2021).
We adopt U4RIA goals to improve the accountability of Modelling for Policy Support (MOPs) can be found at:
https://climatecompatiblegrowth.com/u4ria/ (accessed on 11 April 2021).
Acknowledgments
The financial support of Zimbabwe’s Reconstruction Fund (ZIMREF) is gratefully acknowledged. Howells acknowledges supplementary support from the Climate Compatible Growth Program (#CCG) of the UK’s Foreign Development and Commonwealth Office (FCDO). The views expressed in this paper do not necessarily reflect the UK government’s official policies.
Conflicts of Interest
The authors declare there is no conflict of interest.
Appendix A
Appendix A.1. Model Description
The model generator used in this analysis was the Open-Source energy Modelling System (OSeMOSYS [37]). This allows for ubiquitous retrievability, repeatability, reconstructability, interoperability and auditability (U4RIA) [62]. It is widely used with accessible with accessible and with a large number of applications [38,39]. Its objective is to find the lowest cost and most feasible configuration of technologies and investments to meet an exogenously entered demand. A full set of documentation, codes and supporting material can be downloaded from www.OSeMOSYS.org (accessed on 11 April 2021).
Appendix A.2. Data in Brief
Note that all data used are public domain. They are also based on official national documents. This is helpful for dialogue. However, it is limited, and should be updated as data are available.
The primary documents used to calibrate the analysis include the National System Development Plan (SDP) (ZETDC 2018) and the International Energy Agency’s Projected Costs of Generating Electricity (IAEA 2015).
| Capital Cost (USD/kW) | Variable Cost (USD/GJ) | Fixed Cost (USD/kW) | Fuel Cost (USD/GJ | Efficiency | |
| Coal | 2100 | (Included in FC) | 40 | 1 | 33% (old)40%(new) |
| Gas | 2100 | (Included in FC) | 40 | 6 | 54% |
| Hydropower | 2500 | (Included in FC) | 20 | N/A | |
| Wind | 2500 | (Included in FC) | 409 | N/A | |
| Solar | 1500 | (Included in FC) | 289 | N/A | |
| Energy Efficiency | 7500 | (Included in FC) | 10 | N/A | |
| CUE | N/A | 1389 | N/A | N/A |
Electricity demand is taken directly from the SDP, and extended with a constant growth rate of 1.9% from 2035. Similarly anticipated hydropower capacity factors (without climate change) are as follows:
| Hydropower Station | Anticipated Capacity Factor |
| Hydro (Kariba) | 0.62 |
| Hydro (Tokwe) | 0.68 |
| Hydro (KSE) | 0.14 |
| Hydro (Batoka) | 0.62 |
| Hydro (Gairezi) | 0.37 |
| Hydro (Devils Gorge) | 0.68 |
Appendix A.3. Scenario Tree

| Scenario Naming | GCM | Emissions | Vintage | Downscaling |
| V5 | bcc-csm1-1-rcp85 | RCP 8.5 | CMIP5 | UCT |
| V3 | GISS-E2-H_run1-rcp45 | RCP 4.5 | CMIP5 | Princeton-BCSD |
| V1 | ipsl_cm4-a2 | A2 | CMIP3 | Princeton-BCSD |
| V2 | micro3_2_medres-a1b | A1B | CMIP3 | Princeton-BCSD |
| V6 | MIROC-ESM_CHEM-rcp45 | RCP 4.5 | CMIP5 | UCT |
| V4 | MIROC-ESM_CHEM-run1_rcp85 | RCP 8.5 | CMIP5 | Princeton-BCSD |
Power Plants Licensing
| Licensee | Technology | Capacity |
| A. Operational | MW | |
| Border Timbers | Biomass-wood | 0.5 |
| Duru | Mini-hydro | 2.2 |
| Green Fuel | Bagasse | 18.3 |
| Nyamingura | Mini-hydro | 1.1 |
| Pungwe A | Mini-hydro | 2.75 |
| Hippo Vally Estates | Bagasse (co-gen) | 33 |
| Triangle Estates | Bagasse (co-gen) | 45 |
| Pungwe B Power Station | Mini-hydro | 15.25 |
| Pungwe C Power Station Pvt Ltd | Mini-hydro | 3.72 |
| Sub-Total | 121.82 | |
| B. Not Yet Operational | ||
| Sengwa Power Station (RioZim) | Thermal (Coal) | 2400 |
| PER Lusulu (Pan African Energy) | Thermal (Coal) | 2000 |
| Southern Energy | Thermal (Coal) | 600 |
| China Africa Sunlight Energy | Thermal (Coal) | 600 |
| Great Zimbabwe Hydro Power (Pvt) Ltd | Mini-hydro | 5 |
| Zimbabwe Power Company Gairezi | Mini-hydro | 30 |
| Manako Power (Pvt) Ltd | Mini-hydro | 2.5 |
| Kupinga Renewable Energy | Mini-hydro | 1.6 |
| Kariba Hudro Power (Pvt) Ltd | Hydro | 300 |
| GeoBase Klean Energy Africa | Solar | 250 |
| Hwange Power Station Stage III | Thermal (Coal) | 600 |
| Yello Africa | Solar | 50 |
| H.T.Gen | Mini-hydro | 3.3 |
| Plum Solar | Solar | 5 |
| Immaculate Technologies | Mini-hydro | 1.7 |
| Shilands Enterprises | Gas-Fired | 345 |
| De Green Rhino Energy | Solar | 50 |
| Lueven Investments | Solar | 10 |
| Hauna Power Station Private Limited | Mini-hydro | 2.3 |
| Sinogy Power | Solar | 175 |
| Centragrid Private | Solar | 25 |
| Utopia Power Company Private Limited | Solar | 15 |
| SolGas (Private) Limited | Solar | 5 |
| Richaw Solar Tech Private Limited | Solar | 5 |
| Sub-Total | 7481.4 | |
| Grand Total | 7603.22 | |
| C.Cancelled Liscences | ||
| Essar Africa Holdings (Pvt) Ltd | Thermal (Coal) | 600 |
| Essare (Captive power) | Thermal (Coal) | 60 |
| Rusitu Power Cooperation | Mini-hydro | 0.75 |
| Sub-Total | 660.5 |
References
- IEA. World Energy Balances (Edition 2020). 2021. Available online: https://www.oecd-ilibrary.org/energy/data/iea-world-energy-statistics-and-balances/world-energy-balances-edition-2020_cde01922-en (accessed on 12 April 2021).
- GoZ. Zimbabwe INDC. 2017. Available online: https://www4.unfccc.int/sites/ndcstaging/PublishedDocuments/Zimbabwe%20First/Zimbabwe%20First%20NDC.pdf (accessed on 12 April 2021).
- ZETDC. Power System Development Plan of Zimabwe. 2017. Available online: https://rise.esmap.org/data/files/library/zimbabwe/Cross%20Cutting/CC%202.pdf (accessed on 11 April 2021).
- ZPC. Hwange 7 & 8 Expansion Project. 2019. Available online: http://www.zpc.co.zw/projects/2/hwange-7-8-expansion-project (accessed on 6 June 2019).
- Country Briefs—GET.invest. Available online: https://www.get-invest.eu/market-information/country-briefs/ (accessed on 6 June 2019).
- Energypedia, Zimbabwe Energy Situation. Available online: https://energypedia.info/wiki/Zimbabwe_Energy_Situation (accessed on 6 June 2019).
- Estimating the Renewable Energy Potential in Africa: A GIS-Based Approach. Available online: https://www.irena.org/publications/2014/Aug/Estimating-the-Renewable-Energy-Potential-in-Africa-A-GIS-based-approach (accessed on 12 April 2021).
- SAPP. About SAPP. Available online: http://www.sapp.co.zw/about-sapp (accessed on 6 June 2019).
- SAPP. SAPP Statistics (Table SAPP EXISTING POWER STATIONS GENERATION MIX 2017/2018, % in File Utility General Statistics and Forecasts 2017_18.pdf). Available online: http://www.sapp.co.zw/sapp-statistics (accessed on 6 June 2019).
- WBG. Enhancing the climate resilience of Africa’s infrastructure: The power and water sectors (English)|The World Bank. Available online: http://documents.worldbank.org/curated/en/857671468179354431/Enhancing-the-climate-resilience-of-Africas-infrastructure-the-power-and-water-sectors (accessed on 12 June 2020).
- Hughes, A.; Howells, M.; Kenny, A. Energy Efficiency Baseline Study. 2002. Available online: http://www.energy.gov.za/EEE/Projects/Energy%20Efficiency%20Baseline%20Study/Main%20Report.pdf (accessed on 6 June 2019).
- Mills-Novoa, M.; Liverman, D.M. Nationally Determined Contributions: Material climate commitments and discursive positioning in the NDCs. WIREs Clim. Change 2019, 10, e589. [Google Scholar] [CrossRef] [Green Version]
- Pan, X.; Tao, J.; Wang, H. Comparing and evaluating the nationally determined contributions of the top six emitters under the Paris Agreement goals. Chin. J. Popul. Resour. Environ. 2018, 16, 211–219. [Google Scholar] [CrossRef]
- Liu, P.R.; Raftery, A.E. Country-based rate of emissions reductions should increase by 80% beyond nationally determined contributions to meet the 2 °C target. Commun. Earth Environ. 2021, 2, 1–10. [Google Scholar] [CrossRef]
- Geiges, A.; Nauels, A.; Parra, P.Y.; Andrijevic, M.; Hare, W.; Pfleiderer, P.; Schaeffer, M.; Schleussner, C.F. Incremental improvements of 2030 targets insufficient to achieve the Paris Agreement goals. Earth Syst. Dyn. 2020, 11, 697–708. [Google Scholar] [CrossRef]
- Bonga, W.G.; Sithole, R. Problematic Infrastructure Factors Affecting Development in the 21st Century for Zimbabwe. Social Science Research Network, Rochester, NY, SSRN Scholarly Paper ID 3591754. May 2020. Available online: https://papers.ssrn.com/abstract=3591754 (accessed on 11 July 2021).
- Cole, M.A.; Elliott, R.J.R.; Occhiali, G.; Strobl, E. Power outages and firm performance in Sub-Saharan Africa. J. Dev. Econ. 2018, 134, 150–159. [Google Scholar] [CrossRef]
- Bose, R.K.; Shukla, M.; Srivastava, L.; Yaron, G. Cost of unserved power in Karnataka, India. Energy Policy 2006, 34, 1434–1447. [Google Scholar] [CrossRef]
- Siddiqui, R.; Jalil, H.H.; Nasir, M.; Malik, W.S.; Khalid, M. The Cost of Unserved Energy: Evidence from Selected Industrial Cities of Pakistan. Pak. Dev. Rev. 2008, 47, 227–246. [Google Scholar]
- Sun, T.; Wang, X.; Ma, X. Relationship between the economic cost and the reliability of the electric power supply system in city: A case in Shanghai of China. Appl. Energy 2009, 86, 2262–2267. [Google Scholar] [CrossRef]
- Ritchie, H.; Roser, M. CO2; and Greenhouse Gas Emissions. Our World Data. 2020. Available online: https://ourworldindata.org/emissions-by-sector (accessed on 11 July 2021).
- Taliotis, C.; Shivakumar, A.; Ramos, E.; Howells, M.; Mentis, D.; Sridharan, V.; Broad, O.; Mofor, L. An indicative analysis of investment opportunities in the African electricity supply sector—Using TEMBA (The Electricity Model Base for Africa). Energy Sustain. Dev. 2016, 31, 50–66. [Google Scholar] [CrossRef]
- Couto, R.A. Changing Technologies and Consequences for Labor in Coal Mining. In Workers, Managers, and Technological Change: Emerging Patterns of Labor Relations; Cornfield, D.B., Ed.; Springer: Boston, MA, USA, 1987; pp. 175–202. [Google Scholar] [CrossRef]
- de Souza, G.F.M. Introduction. In Thermal Power Plant Performance Analysis; de Souza, G.F.M., Ed.; Springer: London, UK, 2012; pp. 1–6. [Google Scholar] [CrossRef]
- Khan, I.; Jack, M.W.; Stephenson, J. Analysis of greenhouse gas emissions in electricity systems using time-varying carbon intensity. J. Clean. Prod. 2018, 184, 1091–1101. [Google Scholar] [CrossRef]
- Veasey, T.J. A review of the minerals industry in Zimbabwe. Miner. Eng. 1997, 10, 1355–1362. [Google Scholar] [CrossRef]
- Ordonez, J.A.; Jakob, M.; Steckel, J.C.; Fünfgeld, A. Coal, power and coal-powered politics in Indonesia. Environ. Sci. Policy 2021, 123, 44–57. [Google Scholar] [CrossRef]
- Squalli, J. Renewable energy, coal as a baseload power source, and greenhouse gas emissions: Evidence from U.S. state-level data. Energy 2017, 127, 479–488. [Google Scholar] [CrossRef]
- Wang, Y.; Lou, S.; Wu, Y.; Wang, S. Flexible Operation of Retrofitted Coal-Fired Power Plants to Reduce Wind Curtailment Considering Thermal Energy Storage. IEEE Trans. Power Syst. 2020, 35, 1178–1187. [Google Scholar] [CrossRef]
- Matek, B.; Gawell, K. The Benefits of Baseload Renewables: A Misunderstood Energy Technology. Electr. J. 2015, 28, 101–112. [Google Scholar] [CrossRef] [Green Version]
- Burden on Hydropower Units for Short-Term Balancing of Renewable Power Systems|Nature Communications. Available online: https://www.nature.com/articles/s41467-018-05060-4 (accessed on 11 July 2021).
- Dujardin, J.; Kahl, A.; Kruyt, B.; Bartlett, S.; Lehning, M. Interplay between photovoltaic, wind energy and storage hydropower in a fully renewable Switzerland. Energy 2017, 135, 513–525. [Google Scholar] [CrossRef]
- Alfredsen, K.T.; Killingtveit, A. Utilizing hydropower for load balancing non-storable renewable energy sources—Technical and environmental challenges. 2011, 2011, H53C-1428. AGU Fall Meet. Abstr. 2011, 2011, H53C-1428. [Google Scholar]
- Gagnon, L.; van de Vate, J.F. Greenhouse gas emissions from hydropower: The state of research in 1996. Energy Policy 1997, 25, 7–13. [Google Scholar] [CrossRef]
- Sridharan, V.; Broad, O.; Shivakumar, A.; Howells, M.; Boehlert, B.; Groves, D.G.; Rogner, H.H.; Taliotis, C.; Neumann, J.E.; Strzepek, K.M.; et al. Resilience of the Eastern African electricity sector to climate driven changes in hydropower generation. Nat. Commun. 2019, 10, 302. [Google Scholar] [CrossRef] [Green Version]
- Nhamo, G. Auditing the Adequacy of NDCs. Scaling SDGs Implement. Emerg. Cases State Dev. Priv. Sect. 2020, 73. [Google Scholar]
- Howells, M.; Rogner, H.; Strachan, N.; Heaps, C.; Huntington, H.; Kypreos, S.; Hughes, A.; Silverira, S.; DeCarolis, J.; Bazillian, M.; et al. OSeMOSYS: The Open Source Energy Modeling System: An introduction to its ethos, structure and development. Energy Policy 2011, 39, 5850–5870. [Google Scholar] [CrossRef]
- Gardumi, F.; Shivakumar, A.; Morrison, R.; Taliotis, C.; Broad, O.; Beltramo, A.; Sridharan, V.; Howells, M.; Hörsch, J.; Niet, T.; et al. From the development of an open-source energy modelling tool to its application and the creation of communities of practice: The example of OSeMOSYS. Energy Strategy Rev. 2018, 20, 209–228. [Google Scholar] [CrossRef]
- Niet, T.; Shivakumar, A.; Gardumi, F.; Usher, W.; Williams, E.; Howells, M. Developing a community of practice around an open source energy modelling tool. Energy Strategy Rev. 2021, 35, 100650. [Google Scholar] [CrossRef]
- OLCreate: CCG Track 2 Energy and Flexibility Modelling: OSeMOSYS & FlexTool. Available online: https://www.open.edu/openlearncreate/course/view.php?id=6817 (accessed on 3 August 2021).
- Starter Kits. OSeMOSYS. Available online: http://www.osemosys.org/starter-kits.html (accessed on 12 April 2021).
- Löffler, K.; Hainsch, K.; Burandt, T.; Oei, P.-Y.; Kemfert, C.; Von Hirschhausen, C. Designing a Model for the Global Energy System—GENeSYS-MOD: An Application of the Open-Source Energy Modeling System (OSeMOSYS). Energies 2017, 10. [Google Scholar] [CrossRef] [Green Version]
- Development of a National Water-Energy System Model with Emphasis on the Power Sector for South Africa-Ahjum-2018-Environmental Progress & Sustainable Energy-Wiley Online Library. Available online: https://aiche.onlinelibrary.wiley.com/doi/abs/10.1002/ep.12837 (accessed on 12 April 2021).
- Sims, R.E.H.; Rogner, H.-H.; Gregory, K. Carbon emission and mitigation cost comparisons between fossil fuel, nuclear and renewable energy resources for electricity generation. Energy Policy 2003, 31, 1315–1326. [Google Scholar] [CrossRef]
- Bungane, B. Zimbabwe: ZPC Test Run Unit 8 of Kariba South Project. 2018. Available online: https://www.esi-africa.com/industry-sectors/business-and-markets/zimbabwean-power-utility-test-run-kariba-south-extension-project/ (accessed on 12 April 2021).
- Choga, H. The Reform of the Electricity Supply Industry in Zimbabwe and Its Impact on Power Sector Investments Since 2002. 2018. Available online: https://open.uct.ac.za/handle/11427/29084 (accessed on 12 April 2021).
- Construction Review Online. Zimbabwe’s Gwanda Solar Plant Project Receives US $14m. Available online: https://constructionreviewonline.com/news/zimbabwe/zimbabwes-gwanda-solar-plant-project-receives-us-14m/ (accessed on 12 April 2021).
- Bloomberg. GE, PowerChina Set to Build $4 Billion Zambia-Zimbabwe Plant. 2021. Available online: https://www.industryweek.com/leadership/article/22027792/ge-powerchina-set-to-build-4-billion-zambiazimbabwe-plant (accessed on 12 April 2021).
- Moyo, J. Zimbabwe’s Famed Forests Could Soon Be Desert. 2015. Available online: http://www.ipsnews.net/2015/02/zimbabwes-famed-forests-could-soon-be-desert/ (accessed on 12 August 2021).
- Reliefweb. Southern Africa: Drought—2018–2021. Available online: https://reliefweb.int/disaster/dr-2018-000429-zwe (accessed on 12 April 2021).
- Silverstein, K. For Southern Africa, Climate Change Is Real as Prolonged Droughts Are Creating Food Shortages. 2019. Available online: https://www.forbes.com/sites/kensilverstein/2019/11/07/for-southern-africa-climate-change-is-real-as-prolonged-droughts-are-creating-food-shortages/?sh=74fd06a143f7 (accessed on 12 April 2021).
- Cervigni, R.; Liden, R.; Neumann, J.E.; Strzepek, K.M. Enhancing the Climate Resilience of Africa’s Infrastructure: The Power and Water Sectors; World Bank Publications: Washington, DC, USA, 2015. [Google Scholar]
- World Climate Research Programme. CMIP Phase 5 (CMIP5). Available online: https://www.wcrp-climate.org/wgcm-cmip/wgcm-cmip5 (accessed on 12 April 2021).
- The Representative Concentration Pathways: An Overview|SpringerLink. Available online: https://link.springer.com/article/10.1007/s10584-011-0148-z (accessed on 5 August 2021).
- IEA. Market Report Series: Energy Efficiency 2018—Analysis. Available online: https://www.iea.org/reports/energy-efficiency-2018 (accessed on 12 April 2021).
- Milestones Approach. 2017. Available online: https://www.iaea.org/topics/infrastructure-development/milestones-approach (accessed on 21 May 2020).
- REEEM. Synthesis. Available online: https://reeempathways.org/synthesis (accessed on 12 April 2021).
- Moksnes, N.; Rozenberg, J.; Broad, O.; Taliotis, C.; Howells, M.; Rogner, H. “Determinants of energy futures—A scenario discovery method applied to cost and carbon emission futures for South American electricity infrastructure. Environ. Res. Commun. 2019, 1, 025001. [Google Scholar] [CrossRef] [Green Version]
- Moksnes, N.; Korkovelos, A.; Mentis, D.; Howells, M. Electrification pathways for Kenya–linking spatial electrification analysis and medium to long term energy planning. Environ. Res. Lett. 2017, 12, 095008. [Google Scholar] [CrossRef]
- GEP. Zimbabwe. Available online: https://electrifynow.energydata.info/explore/zw-1 (accessed on 12 April 2021).
- Assessing Integrated Systems|Nature Climate Change. Available online: https://www.nature.com/articles/nclimate2180 (accessed on 12 April 2021).
- Energy System Analytics and Good Governance-U4RIA Goals of Energy Modelling for Policy Support|Research Square. Available online: https://www.researchsquare.com/article/rs-311311/v1 (accessed on 26 March 2021).
Figure 1.
OSeMOSYS’ Modular Structure. Based on [42].
Figure 1.
OSeMOSYS’ Modular Structure. Based on [42].

Figure 2.
Study Results—Zimbabwe’s energy future without the threat of Climate Change. (In this simulation, there are zero emissions for some years just after the full exploitation of the Devils Gorge hydro station. Recall that this is for the electricity sector only, and, note, that in those years no fossil fuel-based power is being generated at all. Additionally, note that in the Fossil Future scenario, emissions will increase 5-fold between 2015 and 2050).

Figure 3.
Study Results—Electricity production in the NDC Scenario under selected future climates (Petajoules).
Figure 3.
Study Results—Electricity production in the NDC Scenario under selected future climates (Petajoules).

Figure 4.
Study Results: NDCs at risk due to climate change (GISS-E2-H climate future).

Figure 5.
Summary Results—Comparative description of the NDC, Coal Adaptation and Clean Adaptation.

Figure 6.
Inter-region power trade with unlimited power trade expansion in 2040. Source Taliotis et al. [22]. The ‘chord’ diagram represents an Africa-wide trade scenario, with free trade to be radically increased over current levels. Each continental African country with power trade is represented. A country is assigned a color indicated by the broadest ‘ring’ adjacent to its two-letter country code. Electricity trade between countries is indicated by ribbons connecting each country. The color of the ribbon indicates the country of origin. Total trade percentages, import percentages and export percentages are indicated by the outermost, second outermost and third outermost rings, respectively. In the source study of the diagram (undertaken without consideration of the climate constraints analyzed here, and with different underlying assumption) we see Zimbabwe (ZW) may trade 25% of its power. In the scenario, there are imports from Zambia (ZM) and Angola (NA), most of which is exported to South Africa (ZA). Future work must take cognizance of this.

Figure 7.
A full RET off-grid base electrification scenario for Zimbabwe. Source [60].
Figure 7.
A full RET off-grid base electrification scenario for Zimbabwe. Source [60].


Table 1.
A summary of the measures as reported in the NDCs are provided below. The NDC considers projects numbered from 1 to 12. Projects 1–5 have mitigation potentials and indicative costs. While 6–12 indicate total costs required.
Table 1.
A summary of the measures as reported in the NDCs are provided below. The NDC considers projects numbered from 1 to 12. Projects 1–5 have mitigation potentials and indicative costs. While 6–12 indicate total costs required.
| Project | GgCO2-eq in 2030 | Indicative Cost (USD mil) | |
|---|---|---|---|
| 1 | Ethanol blending | 202 | 100 |
| 2 | Solar water heaters | 179 | 1230 |
| 3 | Energy efficiency improvement | 1286 | 60 |
| 4 | Increasing hydro in our energy mix | 15,316 | 5000 |
| 5 | Refurbishment and electrification of rail system | 341 | 1106 |
| Sub Total 1 | 17,316 | 7246 | |
| 6 | Coalbed methane (CBM) power | 1000 | |
| 7 | Solar powered off-grid | 3000 | |
| 8 | Integrated waste management | 500 | |
| 9 | Changing thermal power station technologies | 5000 | |
| 10 | Reviewing the transport system | 37,000 | |
| 11 | REDD+ implementation | 1000 | |
| 12 | Sustainable energy alternatives curing tobacco | 1050 | |
| Sub Total 2 | 48,550 | ||
| Total for Mitigation | 55,796 |
Table 2.
Existing power plants installed and dependable capacity as reported by the System Development Plan (Source: ZETDC, 2017 [3]). The power plant names are given in the first column, the total capacity in the second and the capacity that can be depended upon is in the third column.
Table 2.
Existing power plants installed and dependable capacity as reported by the System Development Plan (Source: ZETDC, 2017 [3]). The power plant names are given in the first column, the total capacity in the second and the capacity that can be depended upon is in the third column.
| Plant | Installed Capacity (MW) | Capacity (MW) |
|---|---|---|
| Hwange (1–6) | 880 | 300 |
| Harare | 120 | 30 |
| Bulawayo | 120 | 20 |
| Munyati | 100 | 20 |
| Chisumbanje | 18.3 | 4 |
| Dema | 100 | 100 |
| Total Thermal | 1378 | 674 |
| Duru | 2.2 | 2.2 |
| Nhamingura | 1.1 | 1.1 |
| Pungwe A | 2.7 | 2.7 |
| Pungwe B | 15.3 | 15.3 |
| Pungwe C | 3.75 | 3.75 |
| Kariba | 750 | 385 |
| Total Hydro | 775 | 410 |
| Total Local Capacity | 2153 | 884 |
Table 3.
Preferred System Development Plan (SDP) of Zimbabwe. Column one indicates the preferred sequence in which the power plants are built. Column two provides the power plant name. Columns three and four indicate the capacity and year in which they come online. While column five indicates the anticipated cost of the plant.
| Development Sequence No. | Plant | Capacity/MW | Year | Investment Costs (Inclusive of Transmission Connection)/USD Million |
|---|---|---|---|---|
| 1. | Average Power Imports (2017–2020) | 470 | Ending 2020 | 0 |
| 2. | Kariba South Extension | 300 | 2018 | 412 |
| 3. | Shilands Power | 210 | 2019 | 270 |
| 4. | Gwanda Solar | 10 | 2019 | 18 |
| 5. | Hwange 7 and 8 | 600 | 2021 | 1439 |
| 6. | Hwange Stage 1 and 2 Live Extension | 880 | 2022 | 500 |
| 7. | Batoka | 1200 | 2024 | 2600 |
| 8. | Devil’s Gorge | 1000 | 2031 | 2250 |
| NPV (Scenario Objective Function) | 6541 | |||
Table 4.
Selected climate scenarios. With column one indicating the specific model run as quoted in Cervigni et al. [10]. The second column indicates the Representative Concentration Pathway (RCP) emissions scenario to which the model run corresponds. While the remaining columns indicate precipitation, temperature and potential evapotranspiration (PET) changes.
| Global Circulation Model (GCM) | Emissions Scenario | Change through 2031–2040 | ||
|---|---|---|---|---|
| Precip | T (°C) | PET | ||
| GISS-E2-H_run1 | RCP 4.5 | −32.5% | +2.13 | +11.3% |
| MIROC-ESM-CHEM, run1 | RCP 8.5 | −17.3% | +2.06 | +9.9% |
| bcc-csm1-1 | RCP 8.5 | +2.9% | +2.60 | +8.3% |
Publisher’s Note: MDPI stays neutral with regard to jurisdictional claims in published maps and institutional affiliations. |
© 2021 by the authors. Licensee MDPI, Basel, Switzerland. This article is an open access article distributed under the terms and conditions of the Creative Commons Attribution (CC BY) license (https://creativecommons.org/licenses/by/4.0/).
Share and Cite
MDPI and ACS Style
Howells, M.; Boehlert, B.; Benitez, P.C. Potential Climate Change Risks to Meeting Zimbabwe’s NDC Goals and How to Become Resilient. Energies 2021, 14, 5827. https://doi.org/10.3390/en14185827
AMA Style
Howells M, Boehlert B, Benitez PC. Potential Climate Change Risks to Meeting Zimbabwe’s NDC Goals and How to Become Resilient. Energies. 2021; 14(18):5827. https://doi.org/10.3390/en14185827
Chicago/Turabian StyleHowells, Mark, Brent Boehlert, and Pablo César Benitez. 2021. "Potential Climate Change Risks to Meeting Zimbabwe’s NDC Goals and How to Become Resilient" Energies 14, no. 18: 5827. https://doi.org/10.3390/en14185827
Note that from the first issue of 2016, this journal uses article numbers instead of page numbers. See further details here.