
Thrust Vector Observation for Force Feedback-Controlled UAVs


Department of Aerospace Information Technology, Julius-Maximilians-Universität Würzburg, 97074 Würzburg, Germany
*
Author to whom correspondence should be addressed.
Drones 2022, 6(2), 49; https://doi.org/10.3390/drones6020049
Submission received: 5 January 2022
/
Revised: 14 February 2022
/
Accepted: 15 February 2022
/
Published: 17 February 2022
(This article belongs to the Special Issue Conceptual Design, Modeling, and Control Strategies of Drones)
Abstract
:This paper presents a novel approach to Thrust Vector Control (TVC) for small Unmanned Aerial Vehicles (UAVs). The difficulties associated with conventional feed-forward TVC are outlined, and a practical solution to conquer these challenges is derived. The solution relies on observing boom deformations that are created by different thrust vector directions and high-velocity air inflow. The paper describes the required measurement electronics as well as the implementation of a dedicated testbed that allows the evaluation of mid-flight force measurements. Wind-tunnel tests show that the presented method for active thrust vector determination is able to quantify the disturbances due to the incoming air flow.
1. Introduction
With rapidly decreasing cost and size of microelectronics and globally rising interest in aerial robotics, micro UAVs have become increasingly embedded into various solutions. Tasks including autonomous transportation, cooperative UAVs or aerial manipulation and interaction require highly agile platforms that can perform very precise movements. For example, reference [1] describes a system for aerial picking and delivery, in which precise localization and maneuverability must be ensured for mission success. A similar accuracy is required by the concept presented in [2] where cooperative drones are used as a counter-measure against small hostile UAVs in the urban environment. In the field of aerial manipulation, precise traversing of aerial robots is mandatory, too; for example, when manipulating an unknown drawer with a UAV as described in [3].
As reported in [4], stable hover capabilities have been identified as a key component for aerial manipulation tasks, leading to an increased deployment of traditional quadcopters despite their low payload capacity. However, the mission concepts mentioned above could benefit greatly from attitude-decoupled translational maneuvers, reinforcing the demand for a different, more versatile approach. According to [5], aerial tasks involving robotic arms in particular suffer from the dependence between attitude and translational acceleration of quadcopters, which could be addressed using TVC micro UAVs.
Although TVC micro UAVs are suitable for the above applications, state-of-the-art control loops for micro UAVs are typically limited to the UAV kinematics only, hence neglecting effects such as thrust vector degradation due to incoming air flow. However, for example during the transition and forward flight phase of convertible UAVs, the rotors experience inflow different from zero degrees, which has a significant impact on aerodynamic characteristics [6]. In order to include the thrust vector degradation due to incoming airflow into a TVC micro UAV control loop, the respective thrust vectors need to be observed first. This paper contributes to this as follows:
- Measurement setup for in-flight thrust vector observation
- Evaluation of the proposed setup at different inflow speeds
- Confirmation of the fundamental problem and validity of our approach
2. State of the Art
TVC micro UAVs are a popular research topic; however, they typically neglect the impact of incoming airflow. A fully holonomic aerial robot using tilt rotor technology is presented in [7]. A similar example demonstrates the common approach of modeling the forces and torques excited by each individual motor for independent attitude and position control [8]. Typically, the model , where F is the force, excited by a rotor, k, a positive constant, and , the rotational velocity of the rotor, is applied. This approach is also taken when using the tilt rotor concept for fast airfoil-supported flight as, for example, in [9,10,11]. A further improvement of using tilting rotors in comparison to traditionally fixed mounted rotors is shown in [12], overcoming the difficulties of controlling a UAV with a propeller failure. A model-based control approach for tilt-rotor UAVs is shown in [13].
In contrast, references [14,15] emphasize that the thrust of a multicopter rotor is strongly dependent on the inflow velocity and direction. References [16,17] present a special testbed to investigate the effects when combining multiple angled motors in an inflow situation. With this kind of testbed, a better understanding of the aerodynamic forces present in such complex inflow situations can be achieved. The interaction of the different rotors on a UAV is examined in [18]. It is found that depending on the distance of the rotors, the performance can be affected strongly.
In-flight thrust vector observation methods are described in [19,20,21] for fixed wing UAVs as well as traditional quadcopters, respectively. The described methods are limited to single-axis observations. To the authors’ knowledge, no work has been published towards in-flight thrust vector observation for TVC micro UAVs previously.
3. Concept
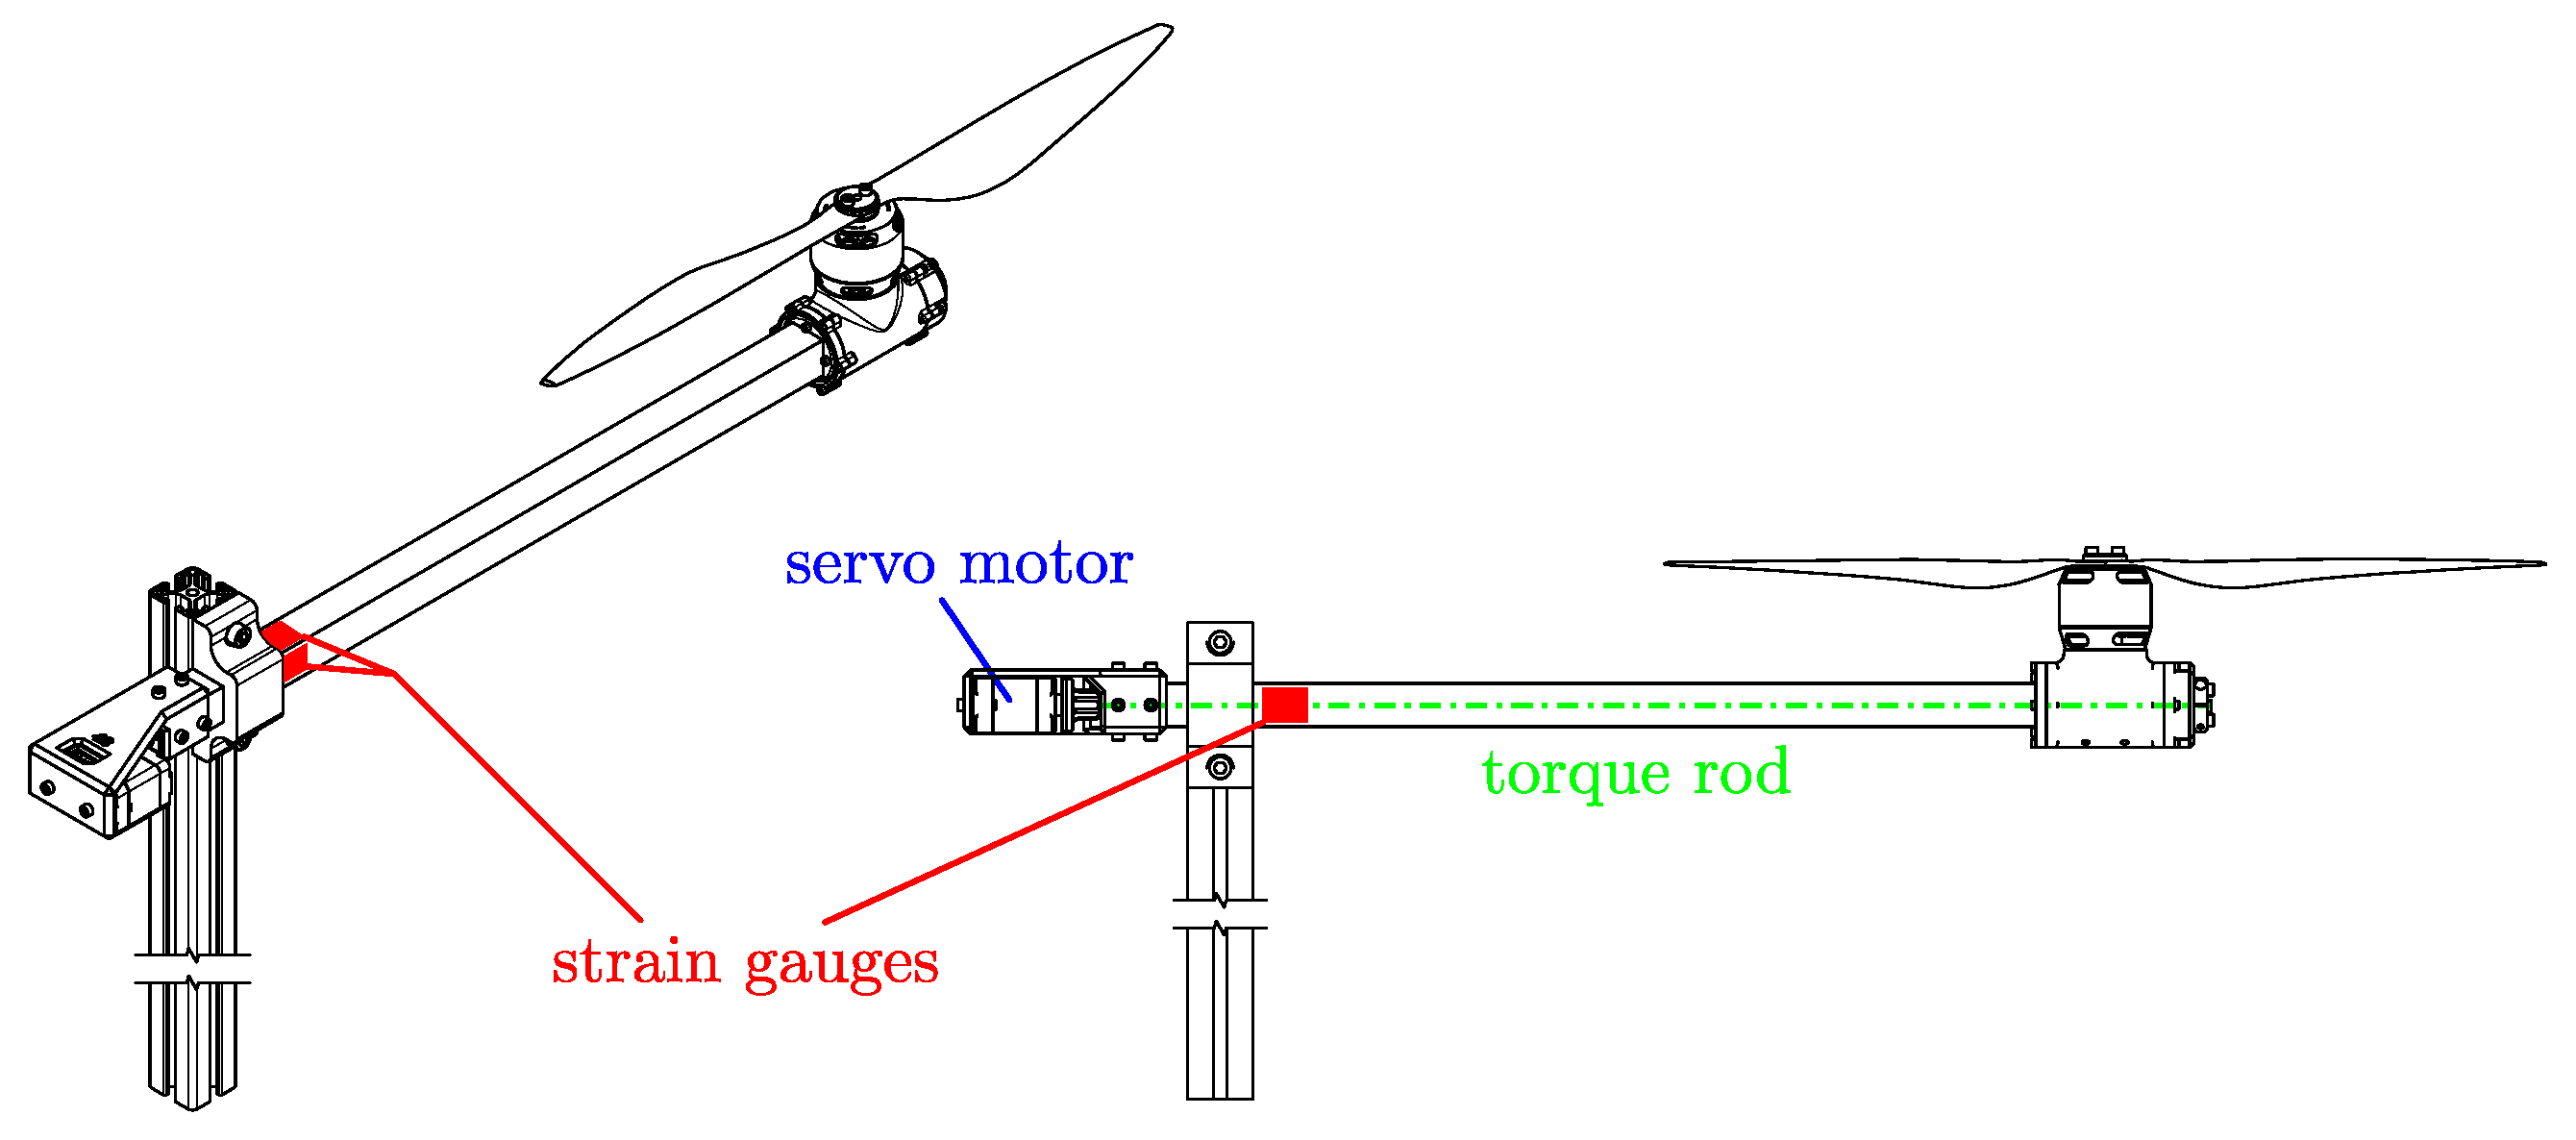
We propose a method to measure the true forces on the motor beams for each tilt motor using dedicated hardware. These measurements can then be used in future work by incorporating them in a force feedback loop controller to solve the problem of an externally influenced thrust vector. The conceptual buildup of a motor boom with added tilting hardware and strain gauges is depicted in Figure 1.
Within the proposed control scheme, the commanded thrust and direction are used as set points, while the actual thrust components are observed in the horizontal and vertical directions. In this way, either existing position and attitude control structures can be extended for tracking performance, or the collected force information can be used directly, e.g., in a model predictive control system.
Both force components in the horizontal and vertical directions with respect to the vehicle frame are determined by observing the deformation of the motor booms. Therefore, this approach can be applied to many existing multicopters. The deformation is captured by measuring the strain of the boom on both sides with strain gauges. For booms with a basic square shape, this can be easily done for the two principle directions. To obtain the actual force values in flight, the strain gauges must be calibrated with known loads beforehand.
4. Implementation
This section presents the implemented structure of the previously described concept. The implementation is divided into the general test setup, the underlying mechanics and the electronics. Despite the presented setup being solely designed for wind-tunnel tests, its main purpose is to prove the feasibility of in-flight measurements of the true thrust vector acting on a UAV. Thus, implementation and execution of a force feedback control loop based on the measurements done with our concept can be done in future work. Design choices were made on the assumption that a custom flight controller such as that presented in [22] will be used as the future target platform. This controller provides the necessary interfaces, plenty of computational power, and is conveniently integrated into our eco system, enabling easy integration for future flight tests.
4.1. Test Setup
In preparation for the evaluation of the proposed concept, a test environment at microdrone scale was implemented. Since this project was intended to demonstrate the feasibility of the technology in a micro UAV, the requirements for the test environment were designed to match those of flight-capable hardware.
- The testbed will use actual UAV components for motor, speed controller and propeller
- The applied thrust and torque should match those expected in real flight
- TVC measurement updates should be made at a minimum frequency of 1 kHz
4.2. Mechanics
4.2.1. Main Structure and Servo
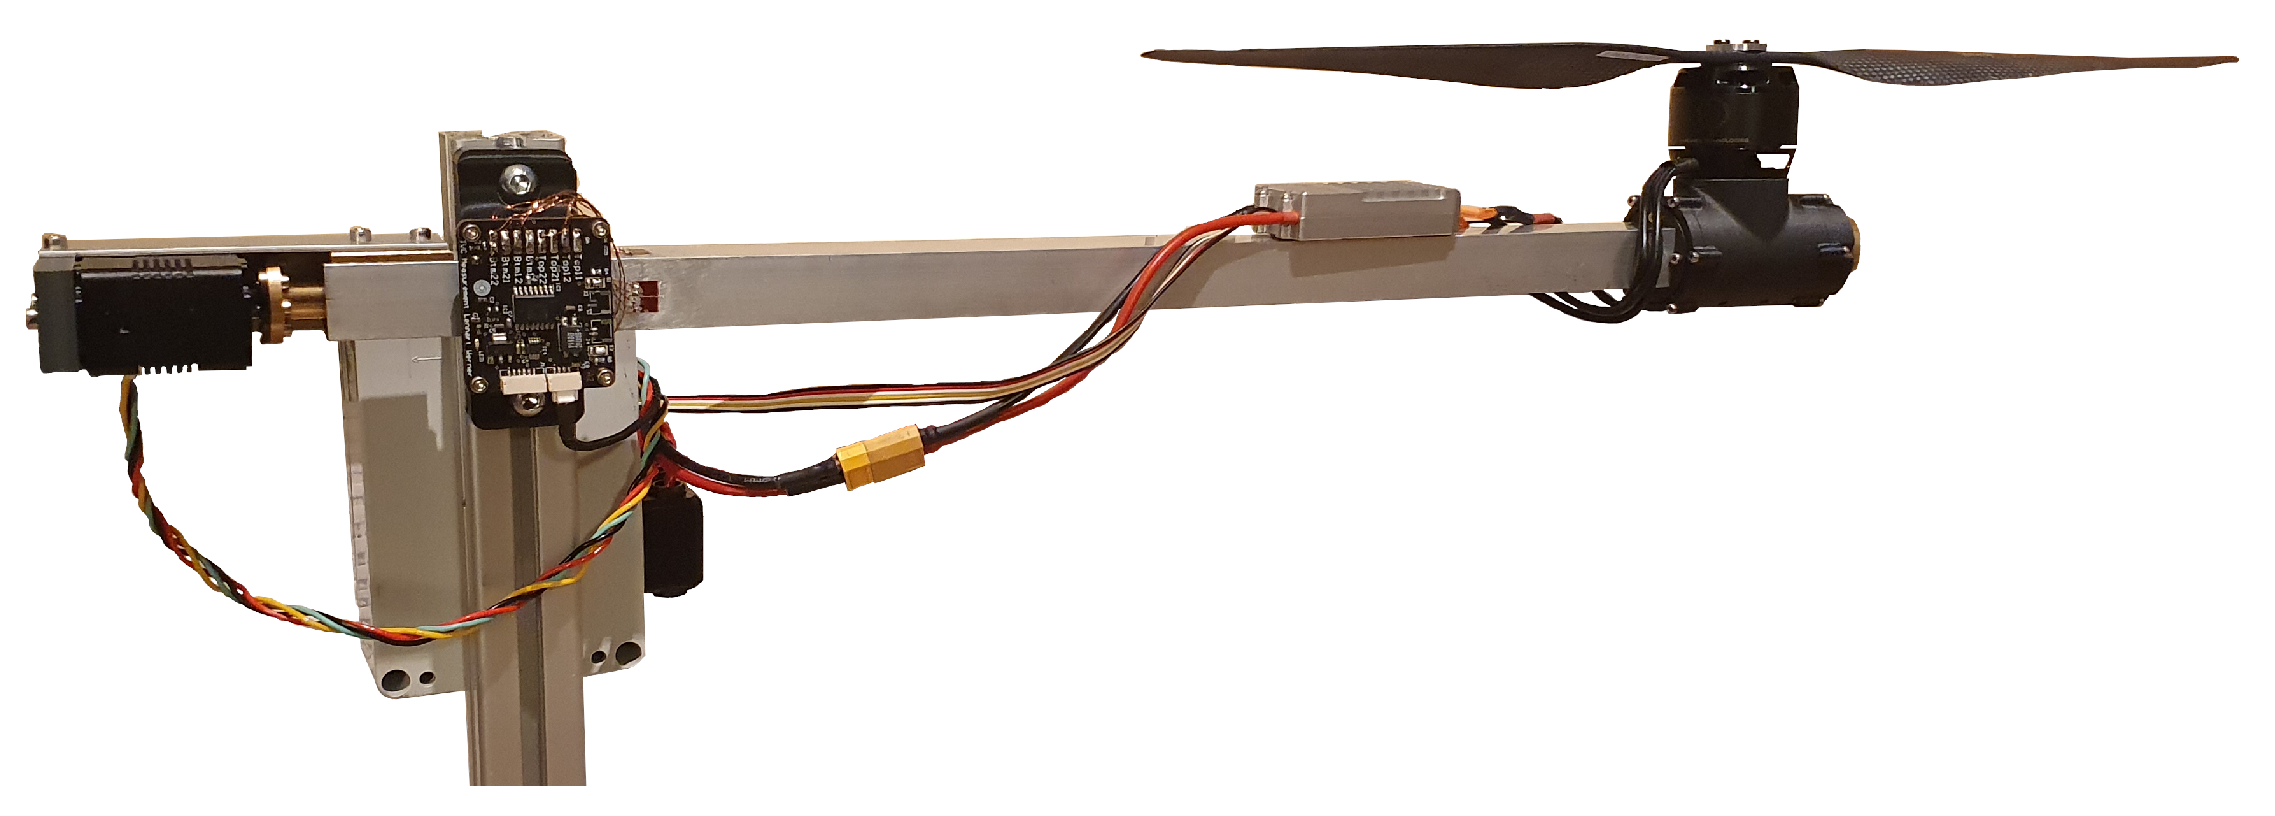
The main structure of the test rig is a 20 × 20 × 500 aluminum boom. Similar to various UAV designs, all major components are attached directly to this central element. The drone-facing boom side, which is attached to the rig, mounts the rotor tilting servo motor. This placement makes the rig less sensitive to potential crashes and shifts the weight of the servo closer to the center of the vehicle, reducing the overall moment of inertia. A Lynxmotion Smart Servo–High Torque (HT1) is used as the actuating servo. This servo provides a torque of and a rotation speed of 60 (RPM) at 12 . Providing a standard UART interface, the servo can be configured in many aspects, including critical performance parameters such as its maximum torque, rotation speed and acceleration. Additionally, the servo allows the programming of the time to reach a specific position as well as dedicated velocity profiles. An appropriate configuration allows a smooth tilting motion of the rotor. The angular momentum of the rapidly tilting rotor would otherwise place an unnecessarily high load on the rotary axis and the actuator servo.
4.2.2. Motor Nacelle
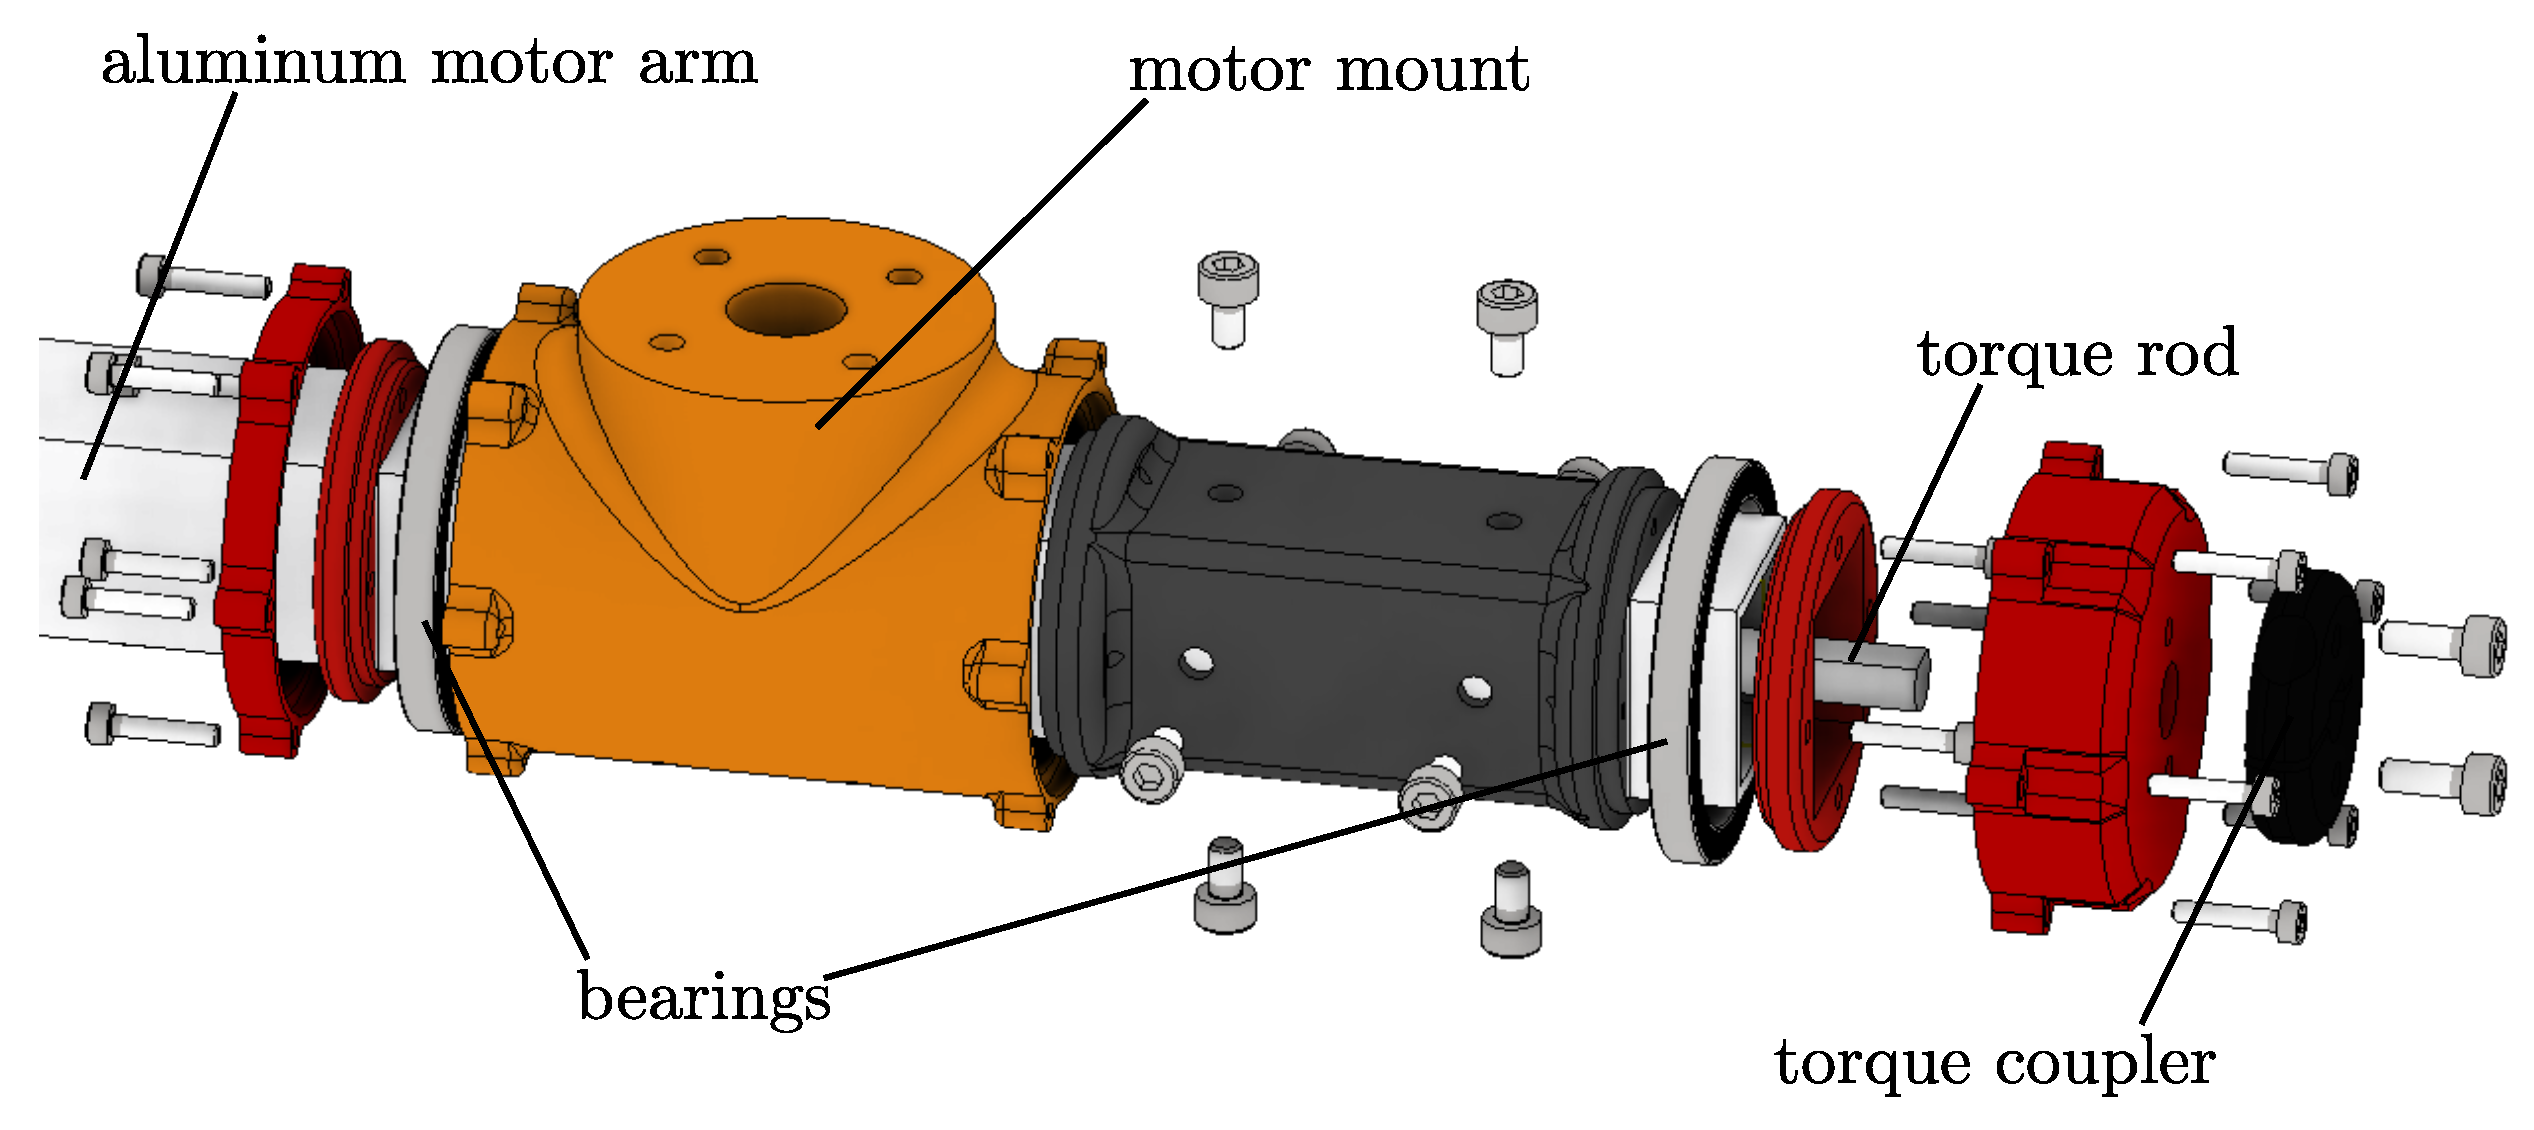
To tilt the motor nacelle on the other end of the boom, a torque rod connects the nacelle’s hull with the servo. It is made of 6 mm aluminum and connected on both ends with a brass flange. The motor nacelle itself is shown for closer inspection in Figure 4 and Figure 5.
All custom parts are 3D printed on a Markforged Mark Two and reinforced with carbon fiber inlays. The internal carbon reinforcement provided by the Markforged printer has shown significant improvements in flexural modulus and impact strength, as studied in [23]. The nacelle itself consists of an outer and inner layer. The inner core, which is directly connected to the aluminum carrier, has the task of fixing the structure at the end of the boom. It also secures the two 61706 2RS deep groove ball bearings that allow the outer shell to rotate freely. The four end caps ensure proper clamping of the bearings to the inner and outer layers. The outer shell, which is connected to the torque rod running through the boom, accommodates a U5 KV400 T-motor as an exemplary micro UAV part. The motor is paired with a 17-inch T-motor P17x5.8 propeller.
4.2.3. Load Cell
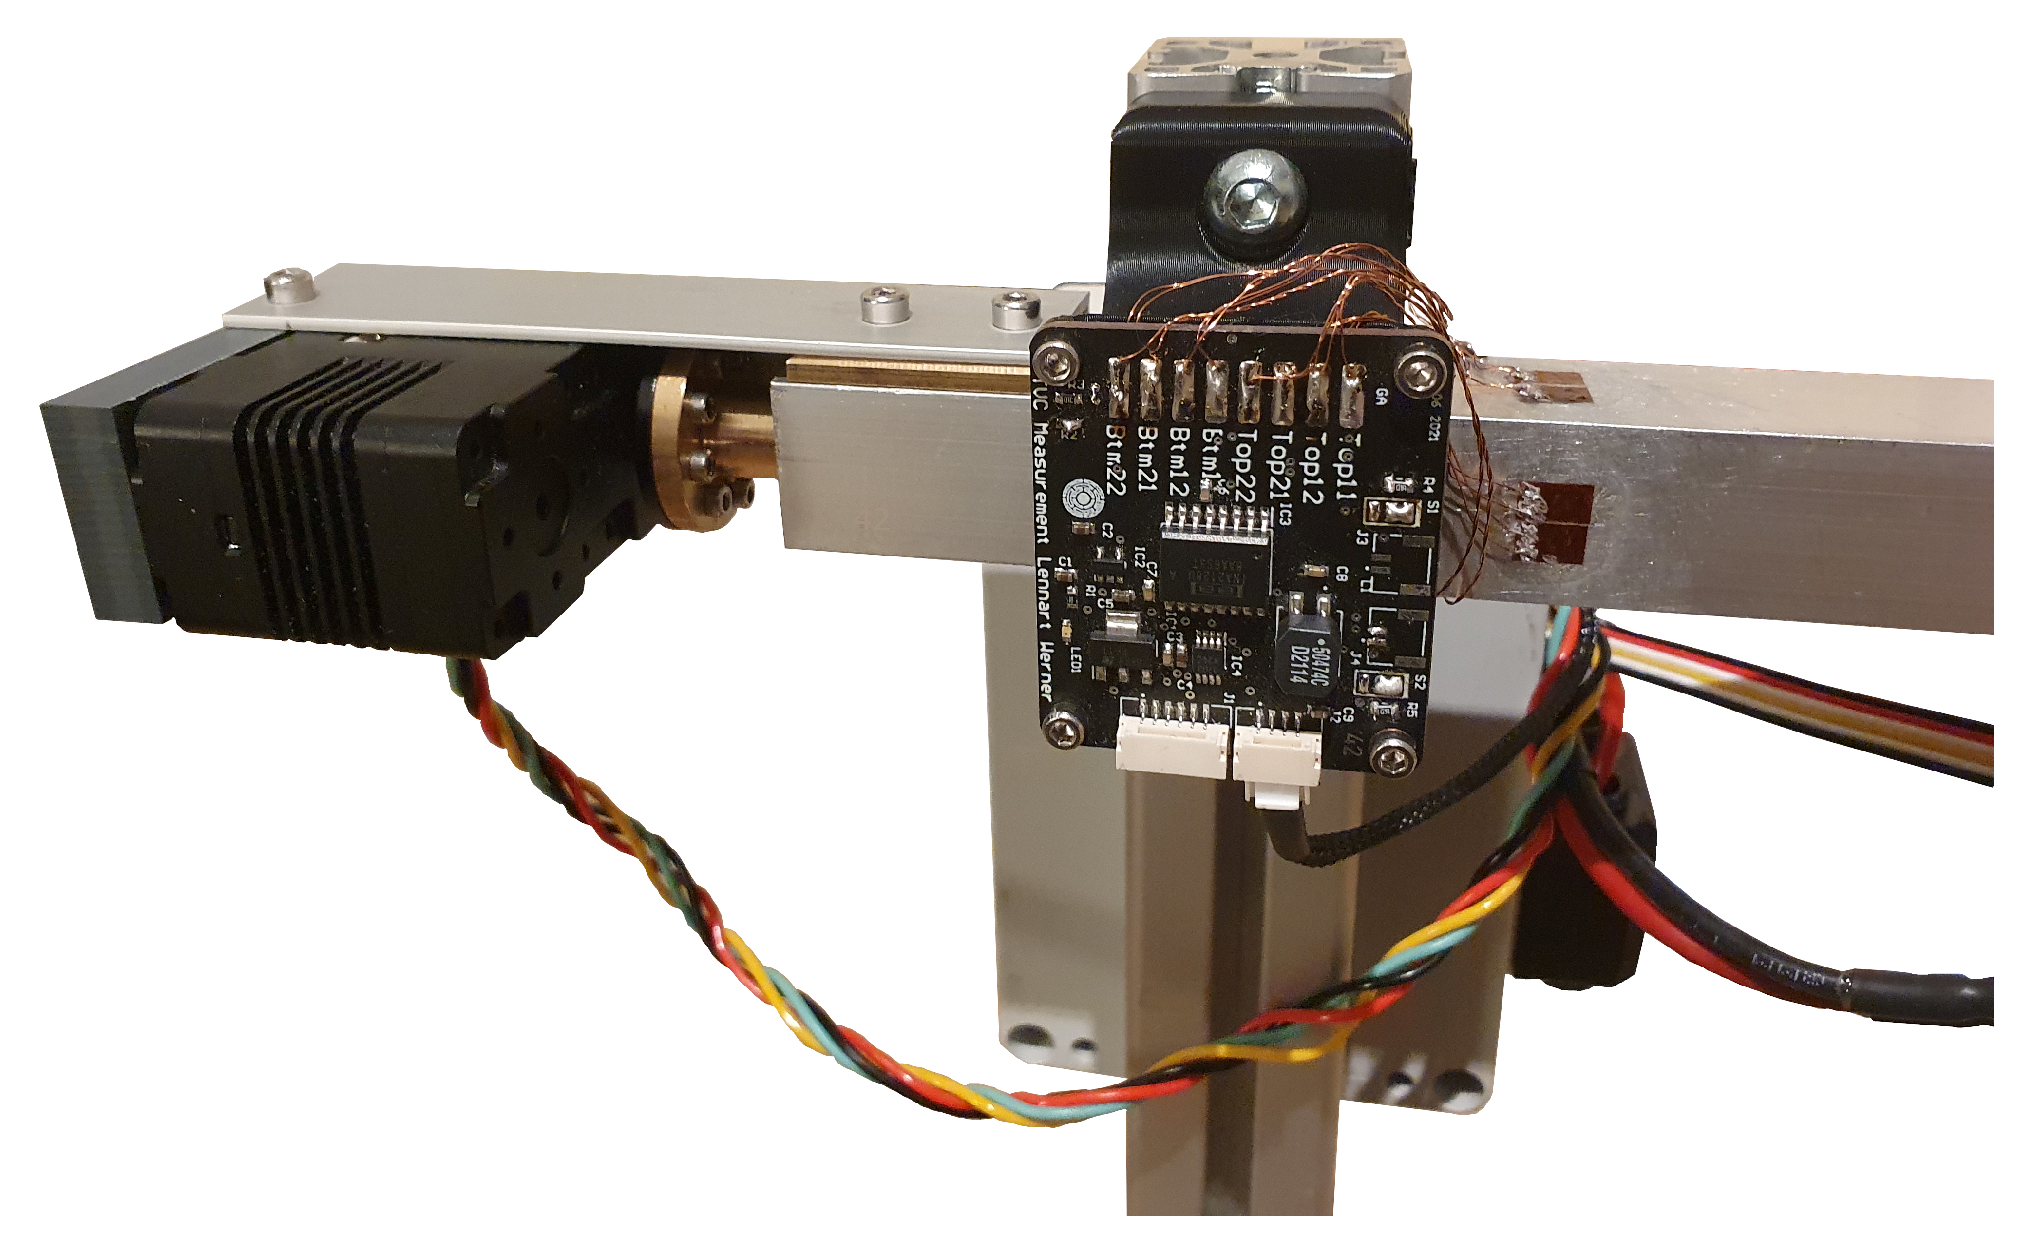
Four strain gauge pairs implement the two-dimensional load cell for thrust vector reconstruction. The pairs are placed near the fixation, where the highest amount of strain per applied force is expected. For each load cell dimension, two complementary strain gauge pairs form a full Wheatstone bridge, which is described in detail in Section 4.3. The complementary strain gauge pairs are mounted on opposite beam sides to capture both the beam stretch and its compression. At a thrust of 30 , Finite Element Method (FEM) simulations predict a strain factor of at the position of the gauges. The gauges are mounted 5 away from the fixation clamp to avoid clamping-induced disturbances. The placement of the strain gauges is indicated in Figure 1, too.
4.3. Electronics
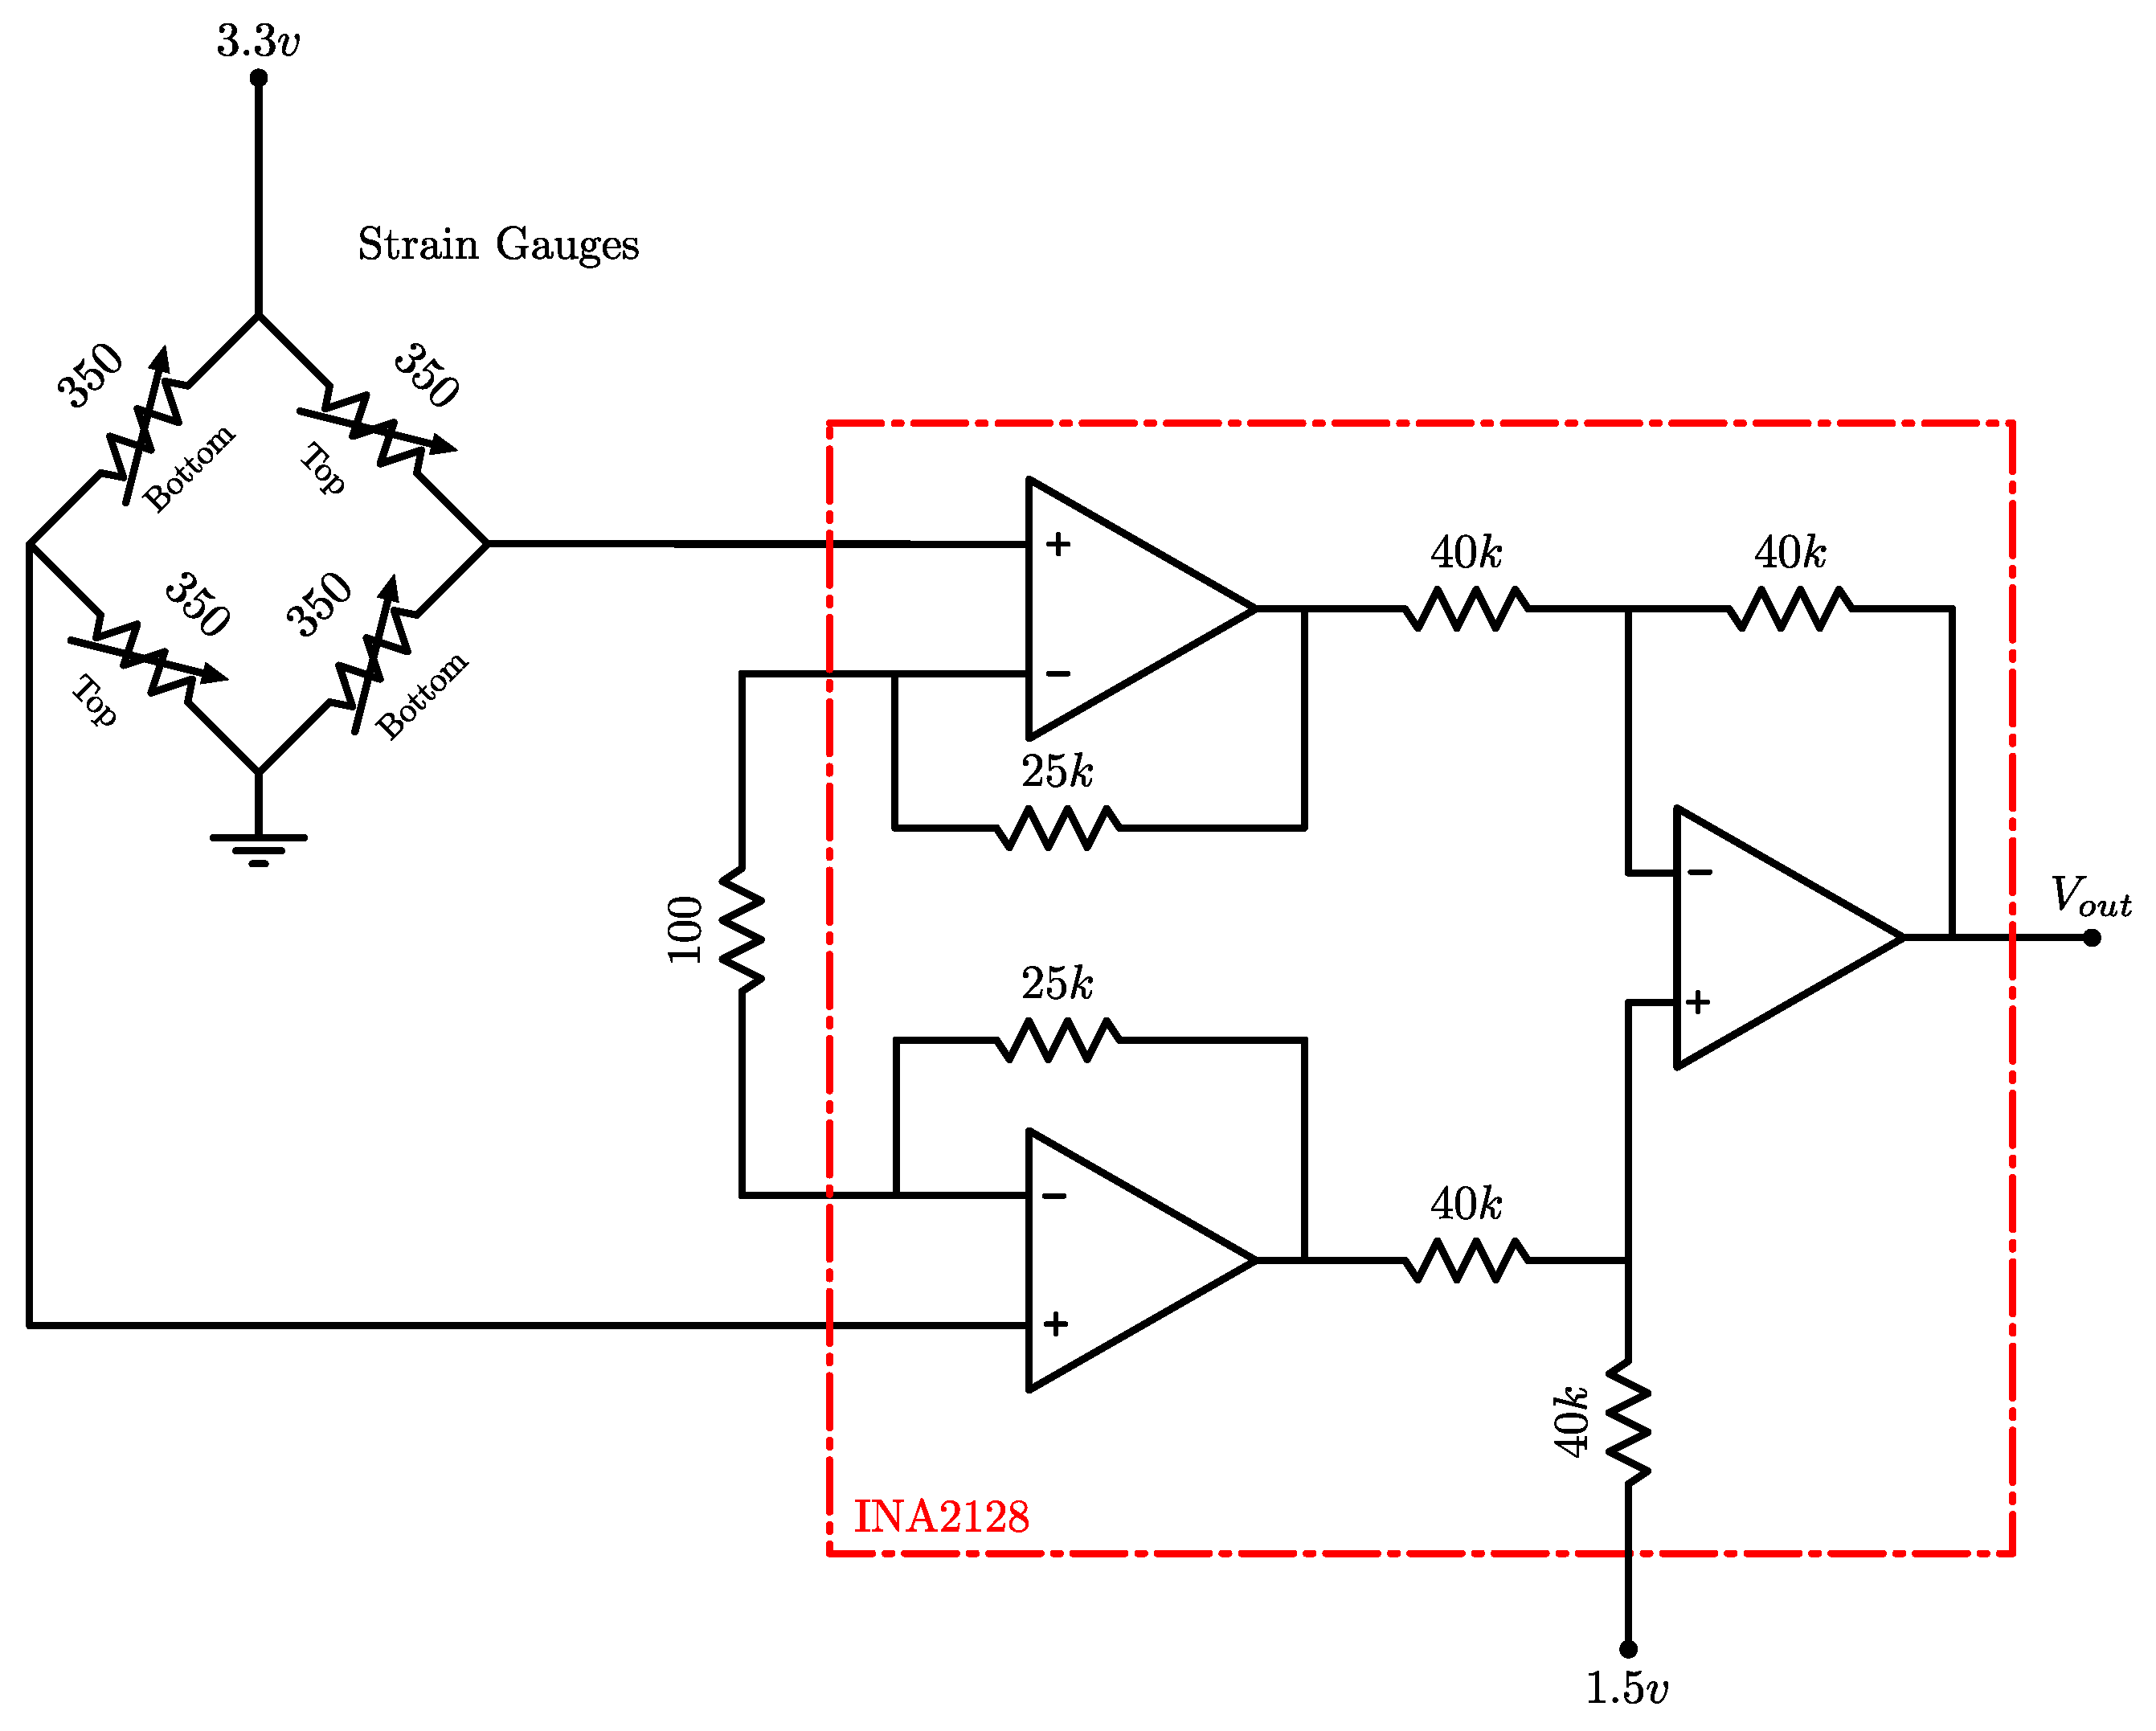
The purpose of the developed electronics is to measure the strain gauge values and digitize them for processing. For each thrust vector axis, the two complementary pairs of strain gauges are connected as a full Wheatstone bridge [24]. The two equally actuated strain gauges are arranged on opposite sides of the full bridge. This configuration does not suffer from temperature dependencies or the need to match the resistance of the gauges with compensation resistors, as would be the case with half or quarter bridges. Since the gauges are closely spaced, temperature changes affect all elements of the bridge in the same way. Therefore, no external temperature compensation is required.
4.3.1. Gauges
The selected strain gauges have a small carrier footprint and the technical specifications are listed in Table 1.
4.3.2. Wheatstone Bridge
The Wheatstone bridge is powered using an LDL1117S33R Low-Dropout Regulator (LDO). Since the maximum change in resistance per gauge is in the range of to , a low noise voltage source with good input filtering has been implemented. This is achieved by placing all noise sensitive components close to each other, paying attention to the return paths, filling empty space with a ground plane, and twisting external wires. For the circuit implementation, a custom Printed Circuit Board (PCB) has been designed and manufactured. Input filtering is done with a Murata 50474C Common Mode Choke. For the lane, which is later used as a reference voltage, an ON Semiconductor NCP115ASN150T2G LDO is used.
4.3.3. Instrumentation Amplifier
The differential voltage of the Wheatstone bridge depends on the direction and magnitude of the force applied to the boom. In our application, a TI INA2128 instrumentation amplifier is used to measure this differential voltage. The INA2128 has two channels, one used for the horizontal direction and the other for the vertical direction. A gain of 1 to 10,000 can be set with an external resistor, while a reference voltage can be provided for the output. The implemented setup for amplifying the Wheatstone output is shown in Figure 6. The output reference is set to avoiding negative output voltages, which allows an easier digitization using standard Analog to Digital Converter (ADC). The actual voltage offset is calibrated in the software.
The instrumentation amplifier gain is based on a FEM simulation. Since the selected motor/propeller combination has a maximum rated thrust of 30 , the predicted strain at the gauge position () is determined under this load scenario. The predicted relative resistance change () is linearly dependent on the strain and the sensitivity coefficient k of the strain gauge from Table 1. The total resistance change is thus given by Equation (1), where R is the nominal resistance of the strain gauge:
Using the equation for a simple voltage divider and the circuit shown in Figure 6, the maximum differential voltage across the Wheatstone bridge can be expressed by Equation (2) where is the supply voltage of the bridge:
Since the bridge can be excited in both ways, the absolute signal range is:
With a simulated strain of , a bridge voltage of and the gauge parameters from Table 1, a of was determined for our setup.
Since our ADC has a reference voltage of 3 , a gain less than 900 must be chosen. To be prepared for unforeseen events and to apply a comfortable safety margin to the 30 from the datasheet, a gain of 500 was selected for this implementation, resulting in a theoretical resolution of per bit.
The gain of the INA2128 can be adjusted with an external tuning resistor according to Equation (4).
Thus, a 100 resistor is used.
4.3.4. Digitalization
For evaluation purposes, the internal 12-bit ADC of a STM32F407 was used for sampling in this work. The target update rate of 1 is easily achieved by the ADC. Since the STM has a reference voltage of 3 , the instrumentation amplifier output is centered in the measurement range with the applied reference. For reference, the final-evaluation PCB which is connected to a STM32F407 discovery breakout board is shown in Figure 3.
5. Evaluation
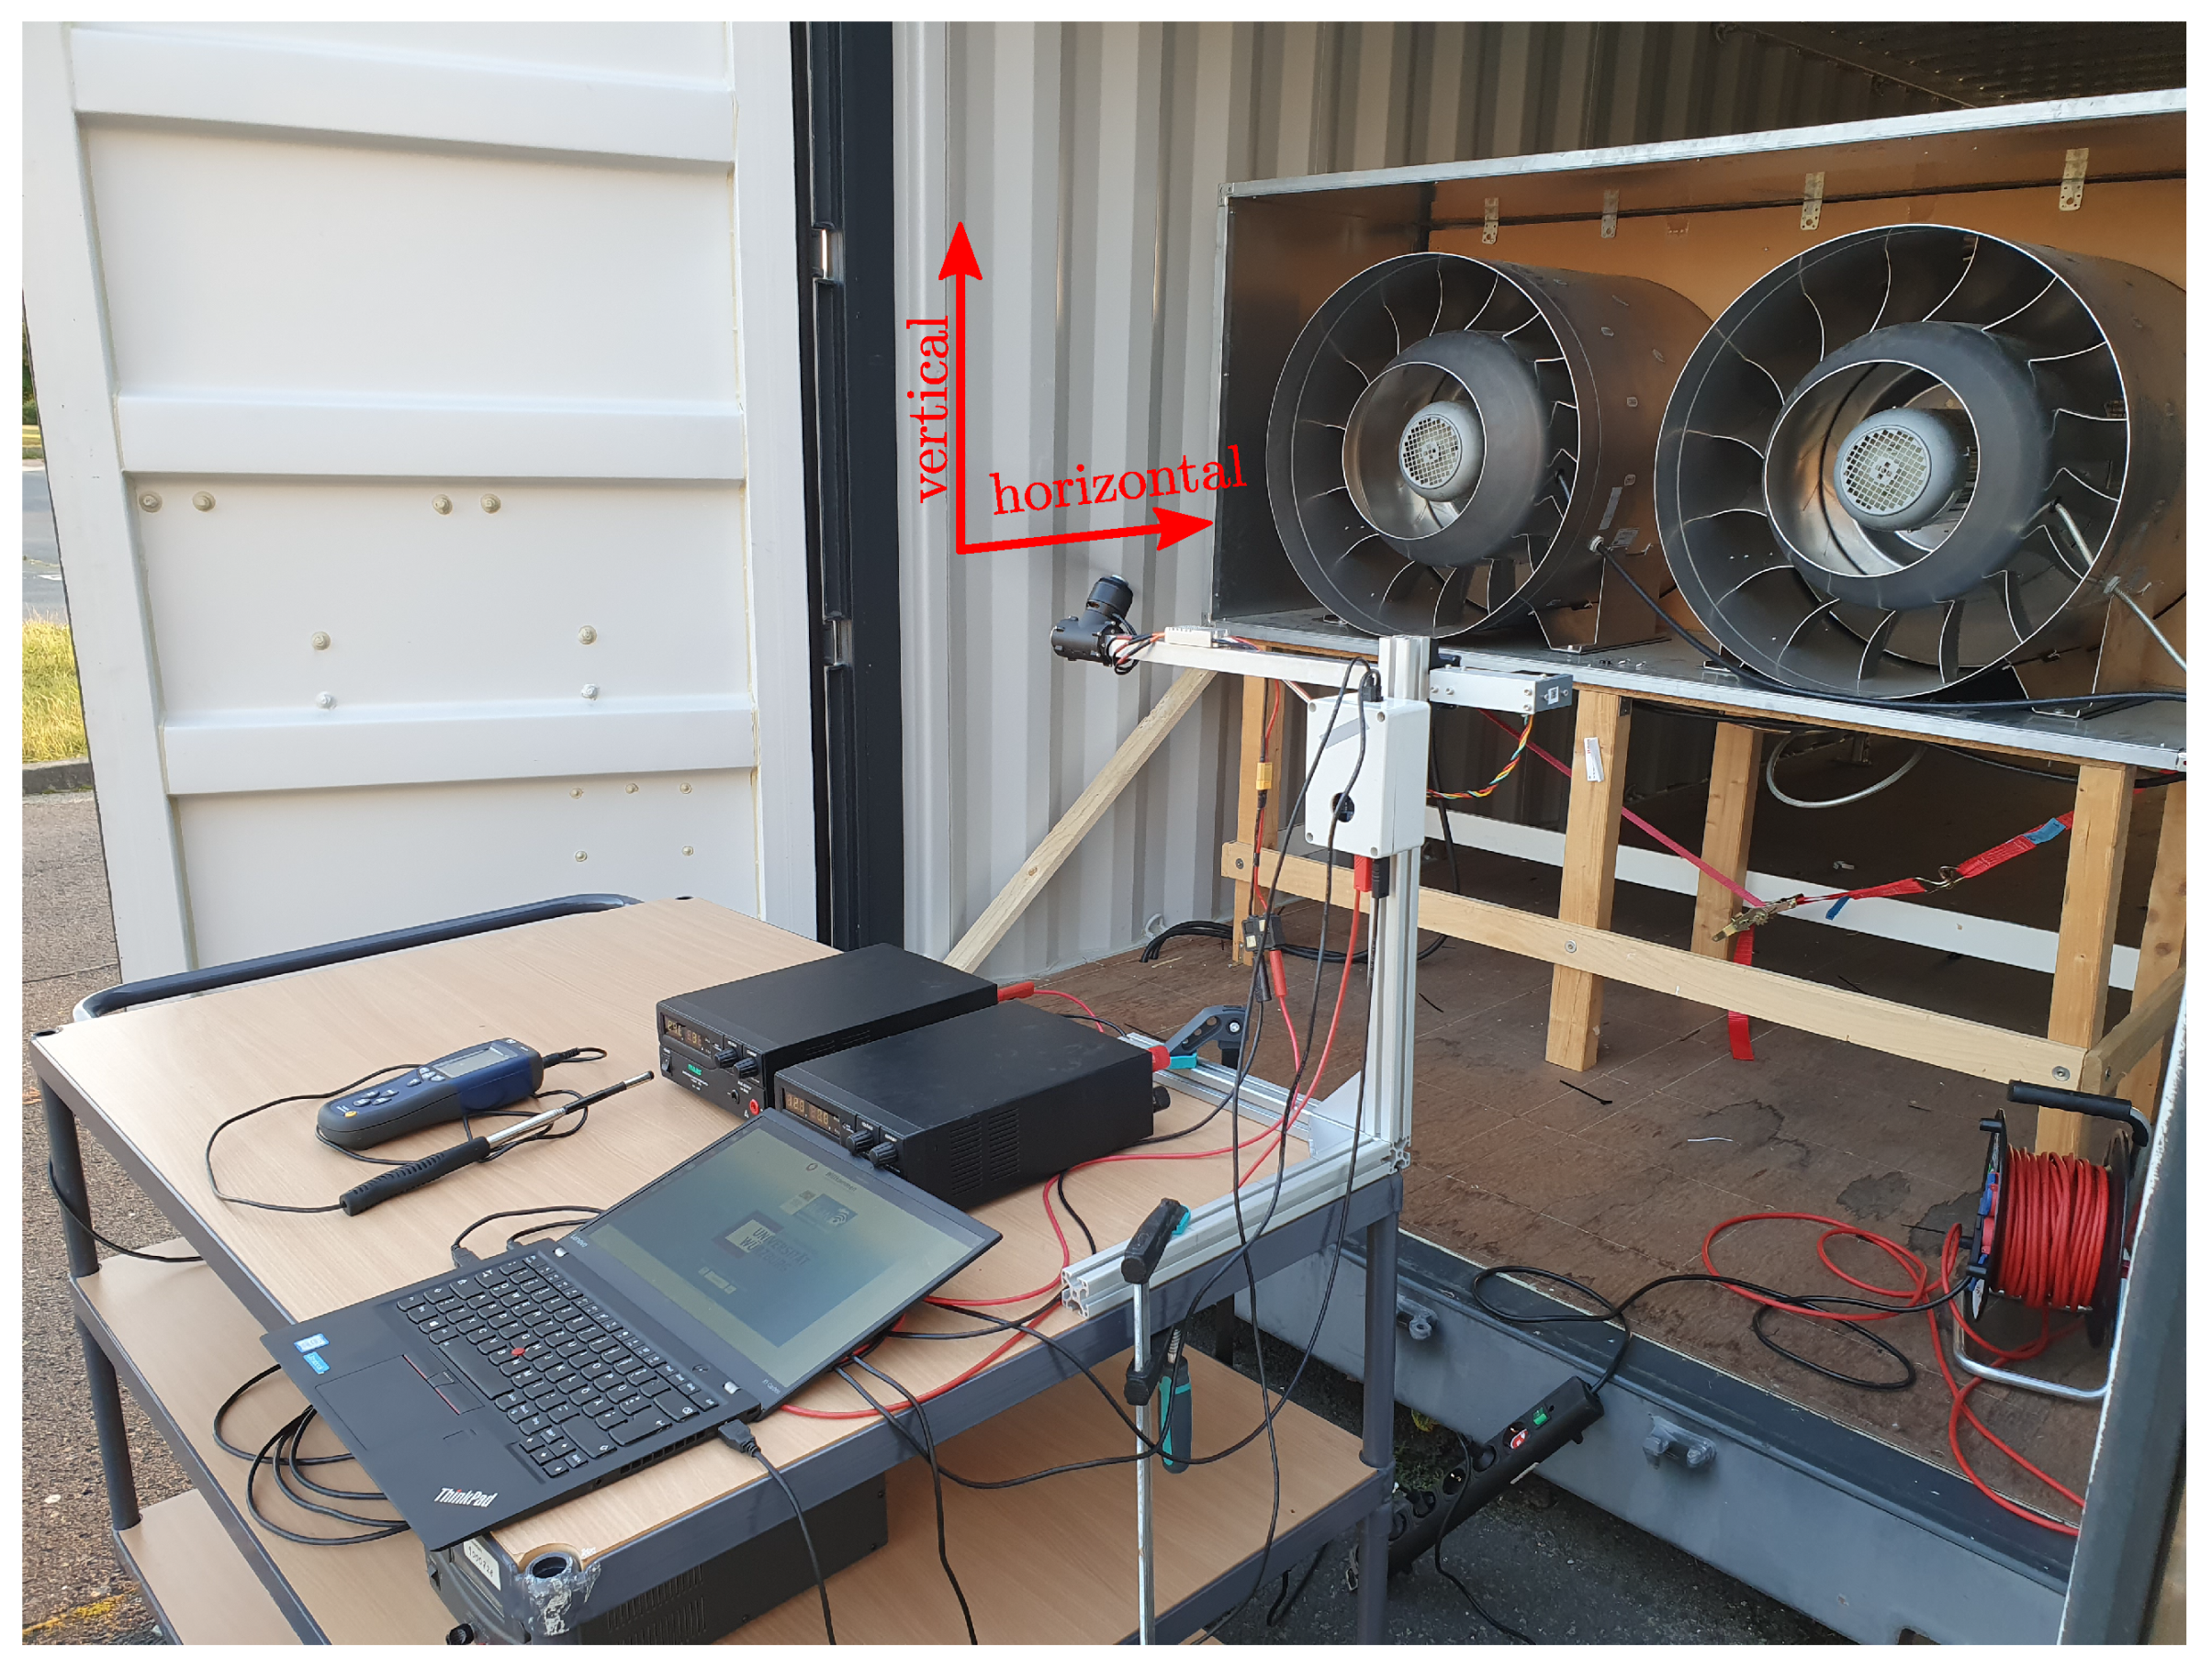
This section evaluates the proposed TVC measurement configuration. The complete test setup is shown in Figure 7.
5.1. Prerequisites
To validate our approach, the strain gauges must be calibrated first. This was done with different static loads hanging from the motor nacelle. To calibrate both axes, the calibration was performed once in the upright position and another time tilted at 90. This technique ensured that the calibration force vector directly matched the measurement vector. The calibration also showed that there was no interdependence between the two axes. A force applied outright in either the vertical or horizontal axis will only produce a measurement deflection in that axis. For each axis, seven calibration loads ranging from to 30 were applied in 10 steps. A linear function was fitted to the sampled points and used as the transfer function from the ADC readings to force output.
5.2. Test Setup
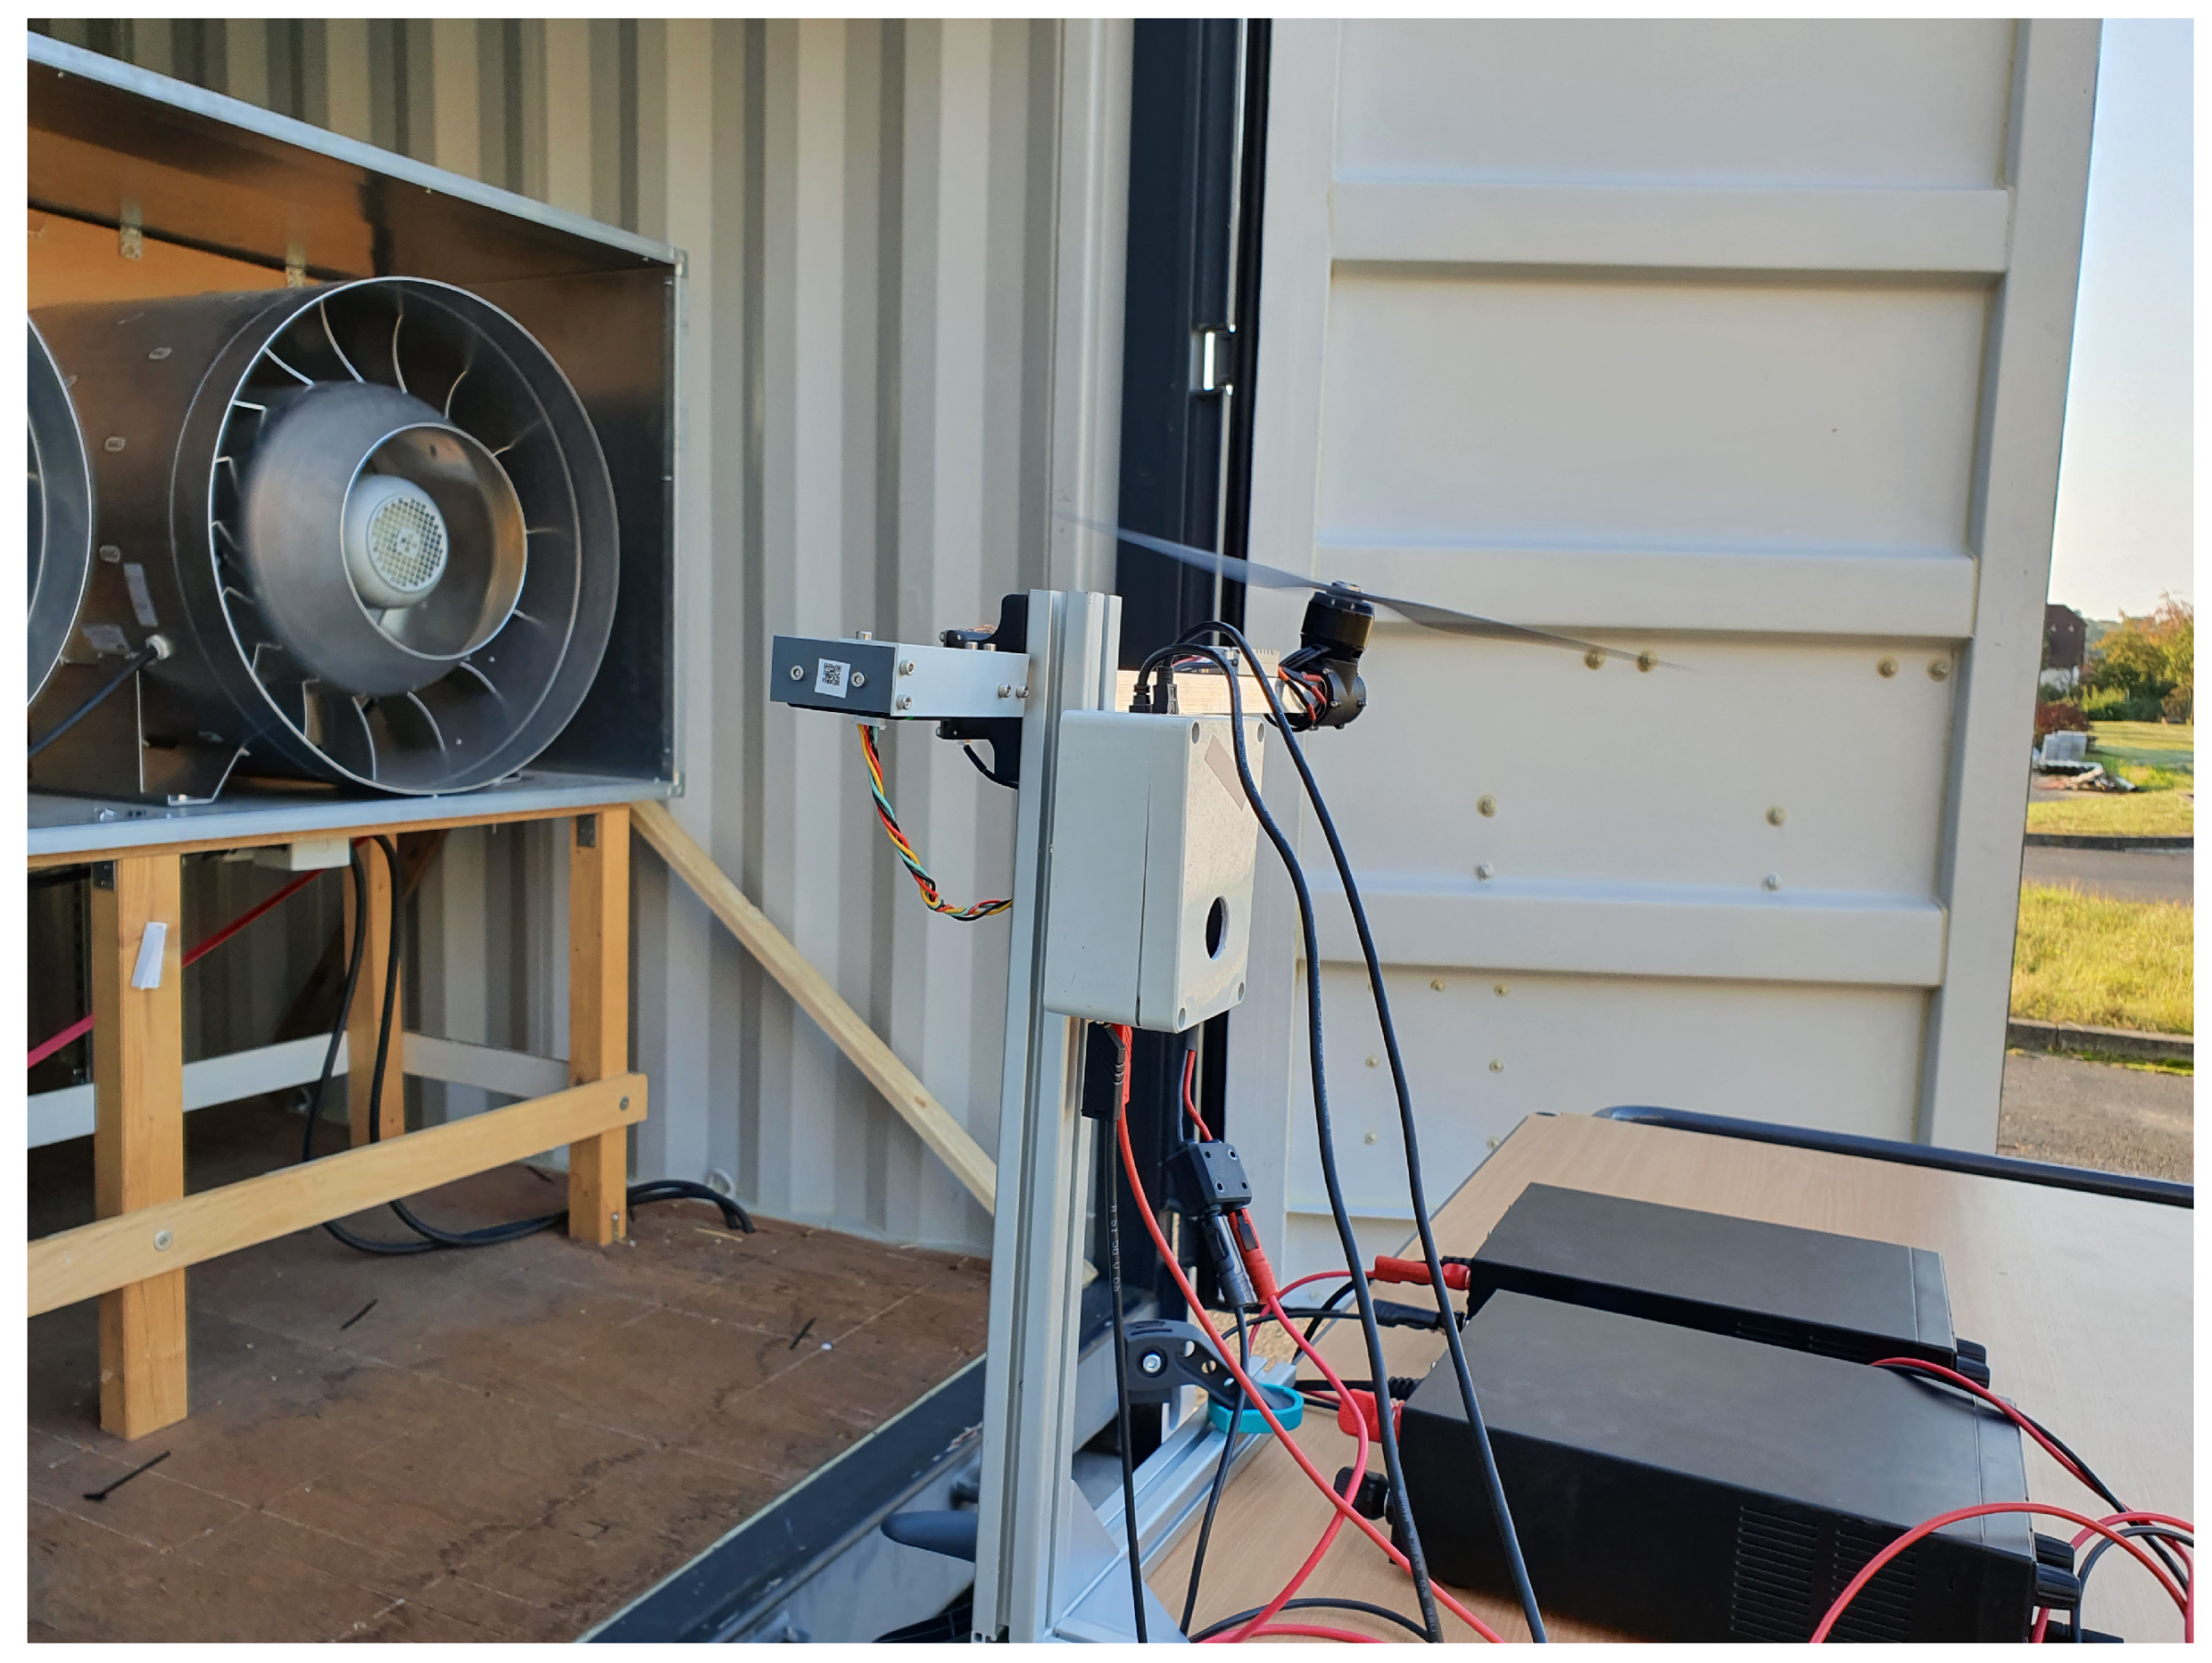
With the proposed test setup, we want to show that the inflow-induced thrust vector error is observable and thus can be mitigated with an appropriate controller. The test rig described in Section 4 is therefore mounted behind the wind tunnel of the department. Unfortunately, the test chamber of the wind tunnel is not large enough for our setup. Consequently, we carried out our tests at the outlet of the fan unit. In the interpretation of the following data, it should be noted that the airflow emanating from the fans is rather turbulent. Hence, it is unfortunately not feasible to make a quantitatively accurate statement about the force vector divergence. The displayed inflow speed measurements were taken right next to the rotor assembly with a handheld hot-wire anemometer. Due to the described turbulent conditions, the indicated wind speeds are only used as a reference for low, medium, and high inflow speeds. They should not be used for a quantitative analysis. The outlets visible in Figure 7 have a diameter of 50 .
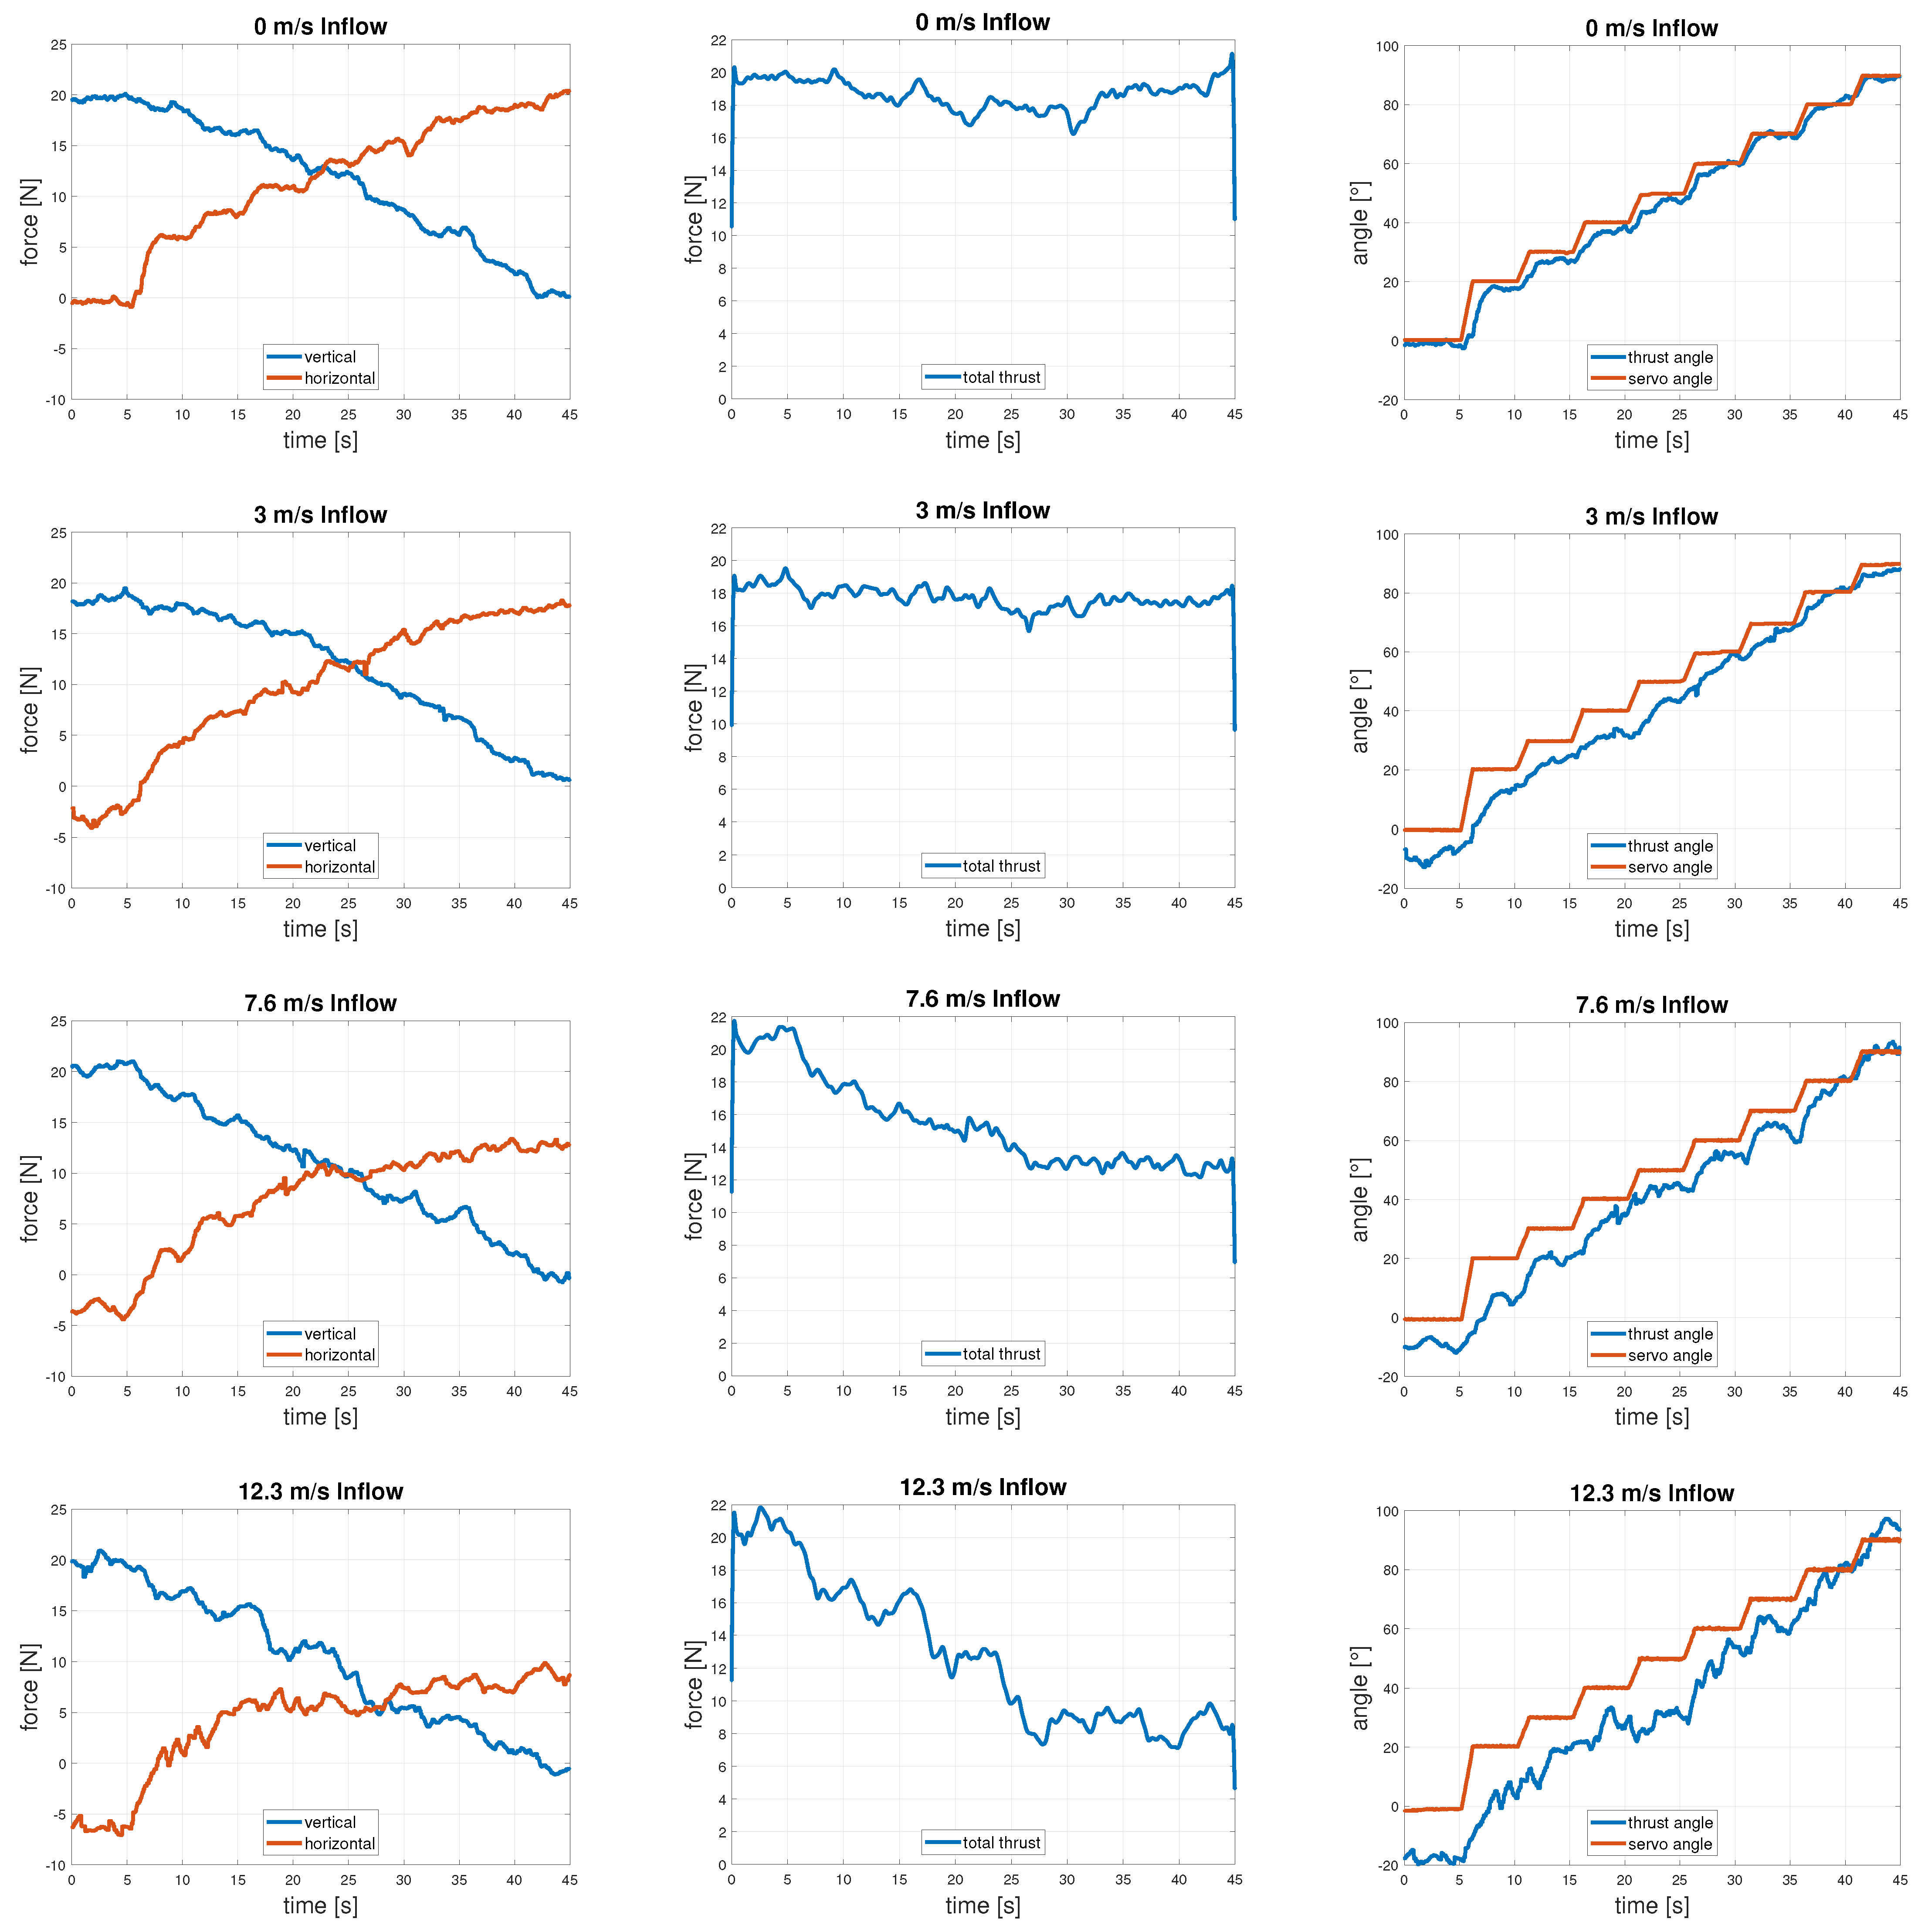
A single test run consists of a tilt angle sweep from 0 (vertical) to 90 (horizontal) with the angle profile shown in the thrust angle plots (right column) of Figure 8. Several of these test runs were performed at inflow velocities ranging from 0 to with fixed 60% throttle and 30 supply.
5.3. Results
Four experiments at different inflow speeds are shown in Figure 8. For each experiment, of a full 90 stepwise sweep into the incoming flow was conducted, capturing the typical flight mode transition of a TVC micro UAV. Each row depicts an experiment for a specific air inflow ranging from 0 to . The observed thrust vector, its magnitude and the respective tilt angle are plotted for each experiment in the first, second and third column, respectively. Here, the tilt angle is calculated based on the observed horizontal and vertical thrust vector components, and , as follows:
5.4. Discussion
Analyzing the various test runs in Figure 8, the feasibility of our concept and its implementation can be clearly identified. Closer inspection of the reference run at 0 shows the absence of disturbing effects unrelated to the incoming flow. The two thrust components are equal at the 45 mark while the magnitude of the force vector only little disturbances. The calculated thrust angle and the commanded servo position are in close agreement, proofing the reliability of our measurement setup in an undisturbed scenario.
All other scenarios with inflow rates different from zero show significant deviations from the reference run in both magnitude and angle of the acting force vector. Even at low inflow velocities such as 3 the magnitude of the force vector is significantly lower at high angles of attack compared to the reference run. Equally, the angle of the force vector deviates from the servo position at low angles of attack and tends to be tilted away from the direction of flow.
In particular, the higher inflow velocities 7 and 12 show a high amount of noise on the acquired data. The strong noise is likely to be caused by the inferior flow quality described earlier. Effects regarding magnitude and angle deviation described for the 3 run occur in an amplified manner. The 12 run shows a reduction in forward thrust of more than and an angle deviation of 20. The major impact observed in the runs especially at higher inflow rates are a strong indicator of the potential of improvement using the presented technique in a future convertible UAV.
Despite the overall feasibility, two minor problems can be observed, which are addressed in the following section. First, there is a total decrease in the observed thrust vector magnitude of approximately 2 in the first experiment, with an inflow of 0 . Second, a negative-force offset in the horizontal direction is visible for the remaining test runs with a non-zero inflow.
5.4.1. Gauge Placement Flaw
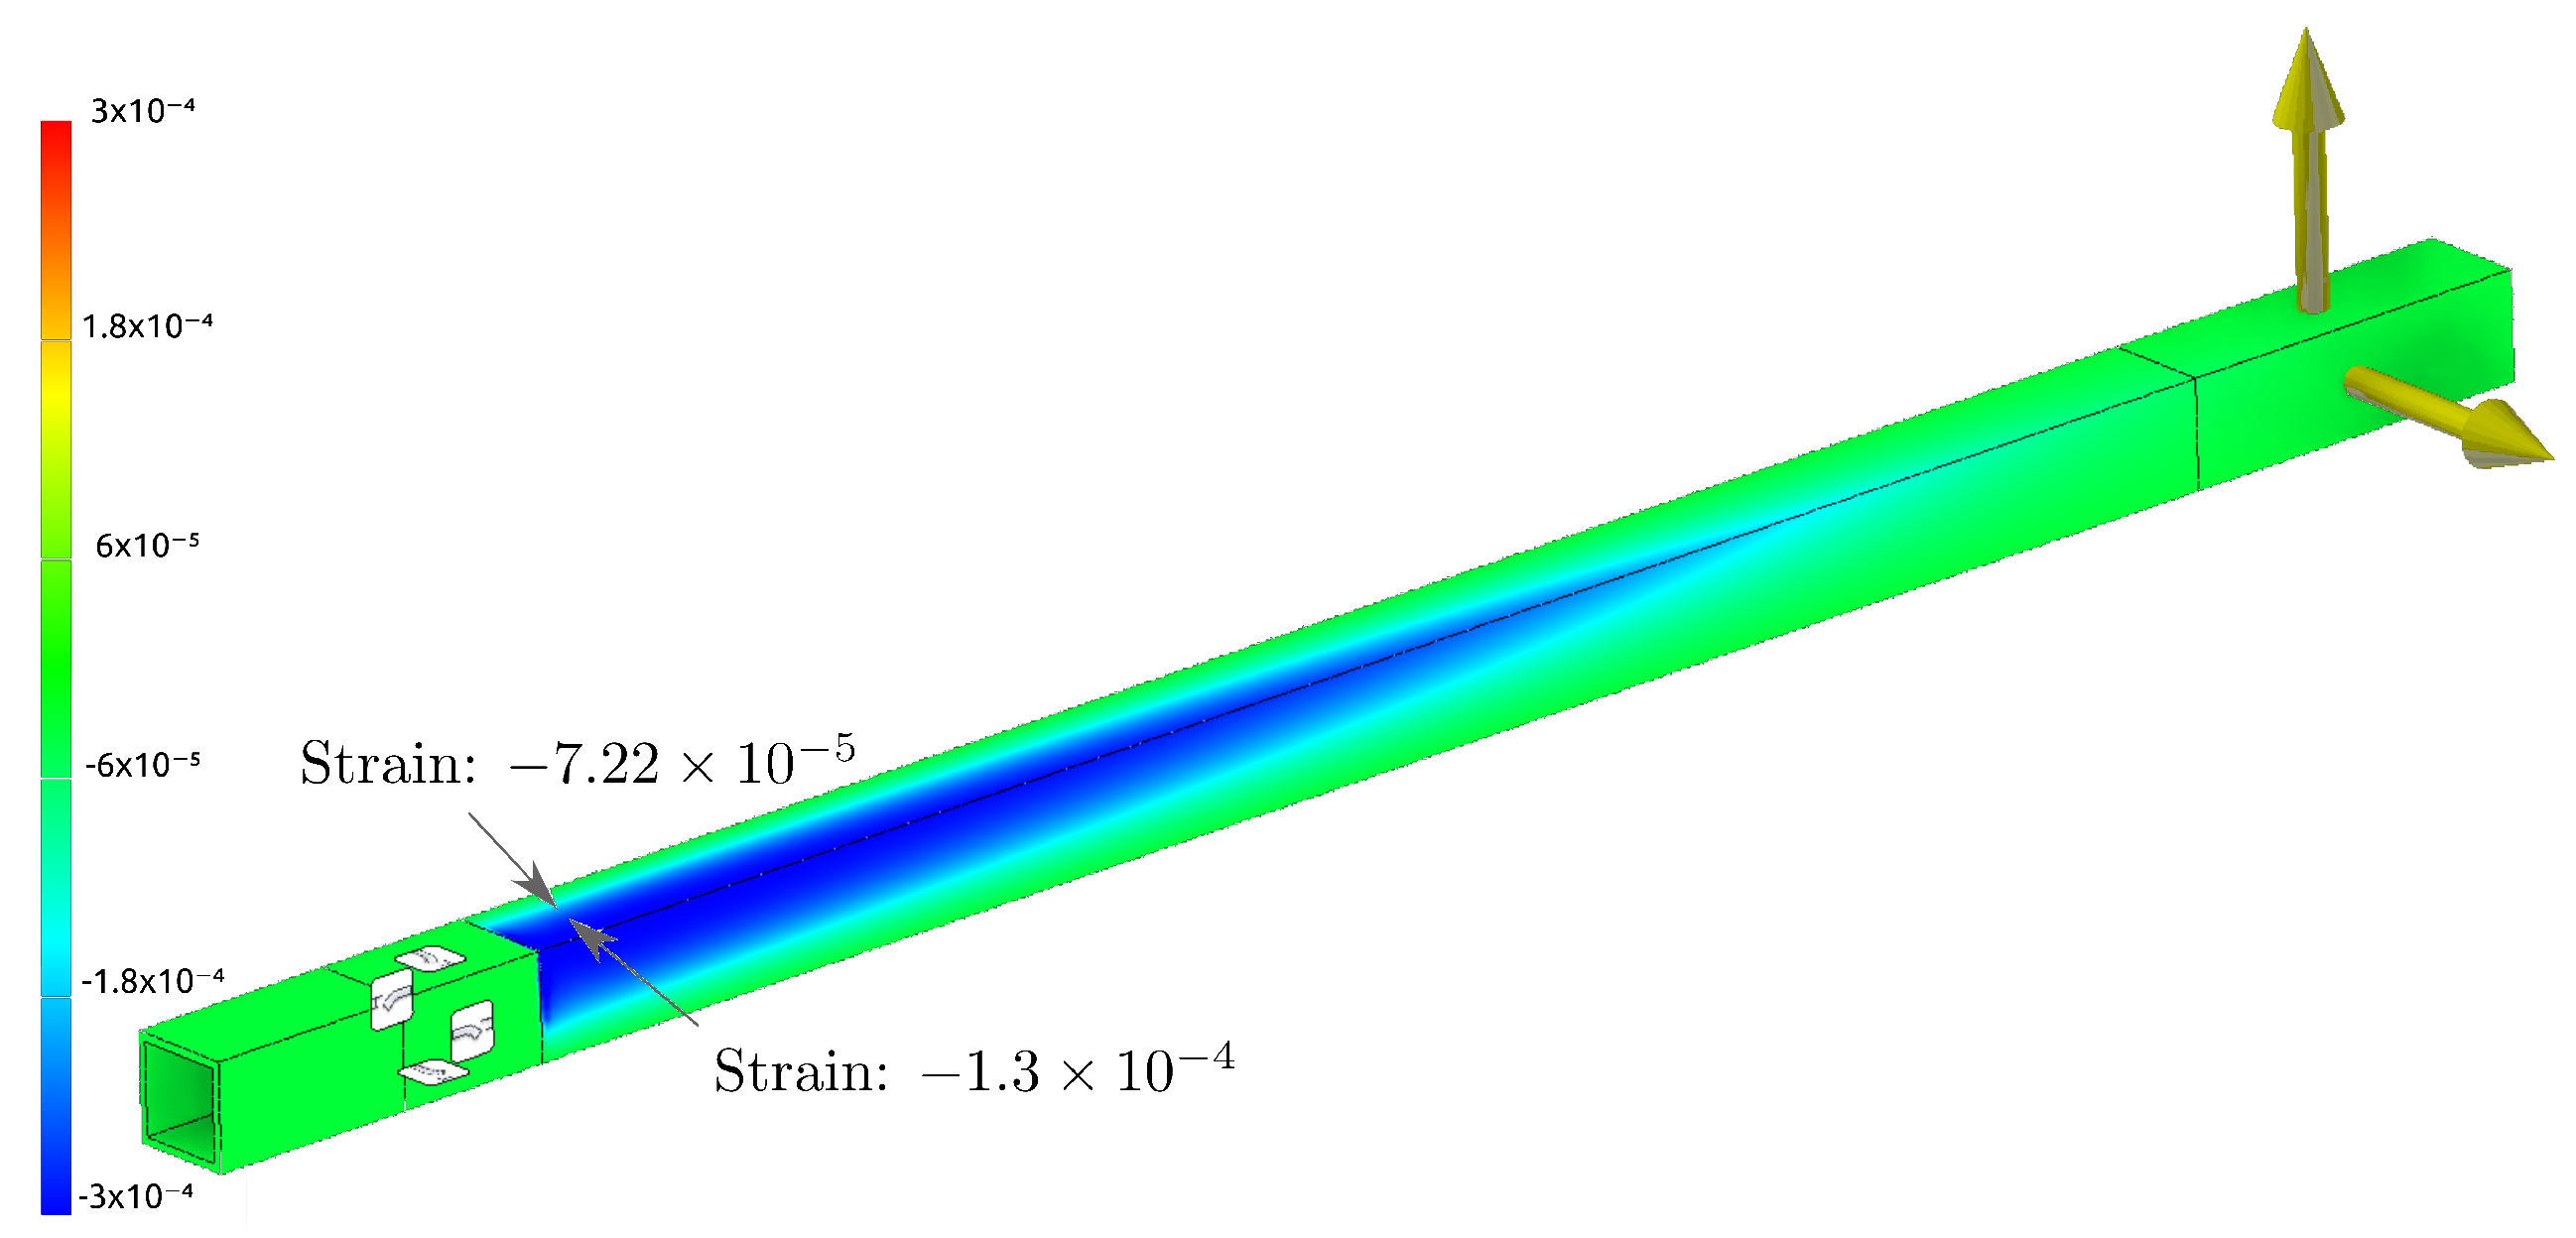
The decrease in the measured total thrust of 2 in Figure 8 Plot 0 , magnitude is identified as an effect of strain gauge placement. In a no-inflow situation, one would expect a constant total thrust throughout the transition. In cases where the thrust vector is not aligned with one of the principal axes, the strain is not uniformly distributed over the surfaces of the beam, but varies in intensity in the direction of the edges, as shown in Figure 9. Since the gauges are of significant size to the width of the beam and are adjacent to each other, they are excited unequally. Although the gauges are placed as close as possible to the center of the beam, this effect is visible in the analysis. The effecet can be mitigated by using either a wider beam, smaller strain gauges, or angle-dependent calibration.
5.4.2. Thrust Vector Angle Offset at Zero Degree
The deviation of the thrust angle from the servo angle at 0, which is visible in all thrust angle diagrams despite the running of 0 , may have several causes. First, the obvious reason is the incoming air pushing on the nacelle and boom, which results in an aerodynamic force vector in the direction of the inflow. Second, it was observed during the experiments that the spinning rotor was inclined backward by the incoming air. This effect is shown in Figure 10. It can be mitigated either using a more torsion-resistant material for the torque rod or by a control algorithm that compensates for the angular error.
6. Conclusions and Future Research
This paper demonstrates the feasibility of in-flight measurements of the thrust vector of a micro UAV, which can be used in active thrust vector control with force feedback. A test implementation is presented, and a series of wind-tunnel tests were performed. The implemented design can identify thrust vector misalignment in real time.
In terms of future research, the author proposes to take action to address the two identified errors. In addition, a flying prototype that implements the presented technology should be investigated. Regarding the identification of the thrust vector, an additional measurement of the torques induced by the motor and the tilting motion could be considered. Additionally, quantitatively correct measurements in a better wind-tunnel facility could be performed to improve the understanding of the underlying effects.
Supplementary Materials
The following are available at https://www.mdpi.com/article/10.3390/drones6020049/s1.
Author Contributions
Conceptualization, L.W. and M.S.; methodology, L.W.; software, L.W.; validation, L.W.; writing—original draft preparation, L.W. and M.S.; writing—review and editing, J.R.; visualization, L.W. and M.S.; supervision, M.S. and S.M.; project administration, S.M.; funding acquisition, S.M. All authors have read and agreed to the published version of the manuscript.
Funding
This research was funded in part by the German Research Foundation, and in part by the University of Würzburg through the Open Access Publish Funding Program.
Institutional Review Board Statement
Not applicable.
Informed Consent Statement
Not applicable.
Data Availability Statement
The data presented in this study are available in the Supplementary Material.
Conflicts of Interest
The authors declare no conflict of interest.
Abbreviations
| ADC | Analog to Digital Converter |
| FEM | Finite Element Method |
| LDO | Low-Dropout Regulator |
| LSB | Least Significant Bit |
| PCB | Printed Circuit Board |
| SPI | Serial Peripheral Interface |
| TVC | Thrust Vector Control |
| UAV | Unmanned Aerial Vehicle |
References
- Gawel, A.; Kamel, M.; Novkovic, T.; Widauer, J.; Schindler, D.; von Altishofen, B.P.; Siegwart, R.; Nieto, J. Aerial picking and delivery of magnetic objects with MAVs. In Proceedings of the 2017 IEEE International Conference on Robotics and Automation (ICRA), Singapore, 29 May–3 June 2017; pp. 5746–5752. [Google Scholar] [CrossRef] [Green Version]
- Rothe, J.; Strohmeier, M.; Montenegro, S. A concept for catching drones with a net carried by cooperative UAVs. In Proceedings of the 2019 IEEE International Symposium on Safety, Security, and Rescue Robotics (SSRR), Würzburg, Germany, 2–4 September 2019; pp. 126–132. [Google Scholar] [CrossRef]
- Kim, S.; Seo, H.; Kim, H.J. Operating an unknown drawer using an aerial manipulator. In Proceedings of the 2015 IEEE International Conference on Robotics and Automation (ICRA), Seattle, WA, USA, 26–30 May 2015; pp. 5503–5508. [Google Scholar] [CrossRef]
- Khamseh, H.B.; Janabi-Sharifi, F.; Abdessameud, A. Aerial manipulation—A literature survey. Robot. Auton. Syst. 2018, 107, 221–235. [Google Scholar] [CrossRef]
- Ruggiero, F.; Trujillo, M.; Cano, R.; Ascorbe, H.; Viguria, A.; Peréz, C.; Lippiello, V.; Ollero, A.; Siciliano, B. A multilayer control for multirotor UAVs equipped with a servo robot arm. In Proceedings of the 2015 IEEE International Conference on Robotics and Automation (ICRA), Seattle, WA, USA, 26–30 May 2015; pp. 4014–4020. [Google Scholar] [CrossRef]
- Kolaei, A.; Barcelos, D.; Bramesfeld, G. Experimental analysis of a small-scale rotor at various inflow angles. Int. J. Aerosp. Eng. 2018, 2018, 2560370. [Google Scholar] [CrossRef] [Green Version]
- Kamel, M.; Verling, S.; Elkhatib, O.; Sprecher, C.; Wulkop, P.; Taylor, Z.; Siegwart, R.; Gilitschenski, I. The Voliro Omniorientational Hexacopter: An Agile and Maneuverable Tiltable-Rotor Aerial Vehicle. IEEE Robot. Autom. Mag. 2018, 25, 34–44. [Google Scholar] [CrossRef] [Green Version]
- Shimizu, T.; Suzuki, S.; Kawamura, T.; Ueno, H.; Murakami, H. Proposal of 6DOF multi-copter and verification of its controllability. In Proceedings of the 2015 54th Annual Conference of the Society of Instrument and Control Engineers of Japan (SICE), Hangzhou, China, 28–30 July 2015; pp. 810–815. [Google Scholar] [CrossRef]
- Flores, G.; Lozano, R. Transition flight control of the quad-tilting rotor convertible MAV. In Proceedings of the 2013 International Conference on Unmanned Aircraft Systems (ICUAS), Atlanta, GA, USA, 28–31 May 2013; pp. 789–794. [Google Scholar] [CrossRef] [Green Version]
- Lin, Q.; Cai, Z.; Yang, J.; Sang, Y.; Wang, Y. Trajectory tracking control for hovering and acceleration maneuver of Quad Tilt Rotor UAV. In Proceedings of the 33rd Chinese Control Conference, Nanjing, China, 28–30 July 2014; pp. 2052–2057. [Google Scholar] [CrossRef]
- Benkhoud, K.; Bouallègue, S. Model Predictive Control design for a convertible Quad Tilt-Wing UAV. In Proceedings of the 2016 4th International Conference on Control Engineering Information Technology (CEIT), Hammamet, Tunisia, 16–18 December 2016; pp. 1–6. [Google Scholar] [CrossRef]
- Kumar, R.; Sridhar, S.; Cazaurang, F.; Cohen, K.; Kumar, M. Reconfigurable fault-tolerant tilt-rotor quadcopter system. In Proceedings of the Dynamic Systems and Control Conference. American Society of Mechanical Engineers, Atlanta, GA, USA, 30 September–3 October 2018; Volume 51913, p. V003T37A008. [Google Scholar]
- Scholz, G.; Trommer, G. Model based control of a quadrotor with tiltable rotors. Gyroscopy Navig. 2016, 7, 72–81. [Google Scholar] [CrossRef]
- Russell, C.; Jung, J.; Willink, G.; Glasner, B. Wind tunnel and hover performance test results for multicopter UAS vehicles. In Proceedings of the AHS 72nd Annual Forum, West Palm Beach, FL, USA, 16–19 May 2016; pp. 16–19. [Google Scholar]
- Baris, E.; Britcher, C.P.; Altamirano, G. Wind Tunnel Testing of Static and Dynamic Aerodynamic Characteristics of a Quadcopter. In Proceedings of the AIAA Aviation 2019 Forum, Dallas, TX, USA, 17–21 June 2019; p. 2973. [Google Scholar]
- Conley, S.; Russell, C. Mechanical Design of the Multirotor Test Bed. In Proceedings of the Vertical Flight Society Aeromechanics for Advanced Vertical Flight Technical Meeting, San Jose, CA, USA, 21–23 January 2020. [Google Scholar]
- Russell, C.; Conley, S. The Multirotor Test Bed–A New NASA Test Capability for Advanced VTOL Rotorcraft Configurations. In Proceedings of the VFS 76th Annual Forum and Technology Display, Montréal, QC, Canada, 6–8 October 2020. [Google Scholar]
- Shukla, D.; Komerath, N. Multirotor drone aerodynamic interaction investigation. Drones 2018, 2, 43. [Google Scholar] [CrossRef] [Green Version]
- Gong, A.; Maunder, H.; Verstraete, D. Development of an in-flight thrust measurement system for UAVs. In Proceedings of the 53rd AIAA/SAE/ASEE Joint Propulsion Conference, Atlanta, GA, USA, 10–12 July 2017; p. 5092. [Google Scholar]
- Bronz, M.; Garcia de Marina, H.; Hattenberger, G. In-flight thrust measurement using on-board force sensor. In Proceedings of the AIAA Atmospheric Flight Mechanics Conference, Grapevine, TX, USA, 9–13 January 2017; p. 0698. [Google Scholar]
- Bazin, J.; Fields, T.; Smith, A.J. Feasibility of in-flight quadrotor individual motor thrust measurements. In Proceedings of the AIAA Atmospheric Flight Mechanics Conference, San Diego, CA, USA, 4–8 January 2016; p. 1760. [Google Scholar]
- Strohmeier, M. FARN—A Novel UAV Flight Controller for Highly Accurate and Reliable Navigation. Ph.D. Thesis, Universität Würzburg, Würzburg, Germany, 2021. [Google Scholar] [CrossRef]
- Morgan, R.V.; McReynolds, B.; Husmann, K.; McCoy, J.; Maki, R.N.; Holguin, R.M.; Bernardin, J.D.; Siranosian, A.A. Markforged Continuous Fiber Composite Material Testing; Technical Report; Los Alamos National Lab. (LANL): Los Alamos, NM, USA, 2020.
- Hoffmann, K. Applying the Wheatstone Bridge Circuit; HBM: Darmstadt, Germany, 1974. [Google Scholar]
Figure 1.
Test rig concept with strain gauge placement.

Figure 2.
Complete arm.

Figure 3.
Closeup of the gauges.

Figure 4.
Assembled nacelle.

Figure 5.
Exploded view of nacelle.

Figure 6.
Schematic of the strain gauge measurement setup.

Figure 7.
Setup of the evaluation tests: the red arrows indicate the positive direction of the horizontal and vertical axes of the stationary coordinate frame.
Figure 7.
Setup of the evaluation tests: the red arrows indicate the positive direction of the horizontal and vertical axes of the stationary coordinate frame.

Figure 8.
Evaluation test data at different inflow speeds.

Figure 9.
Strain distribution at 45 thrust scenario with strain gauge placement.

Figure 10.
Backward tilting due to incoming flow.


Table 1.
Parameters of the selected strain gauges.
| Parameter | Value | Unit |
|---|---|---|
| carrier size | 7.2 × 4.1 | mm |
| grid size | 3.2 × 3.1 | mm |
| basal material | phenolic epoxy | |
| grid material | constantan | |
| nominal resistance | 350 | |
| sensitivity coefficient | 2.1 ± 1% | |
| transverse effect coefficient | 0.40% |
Publisher’s Note: MDPI stays neutral with regard to jurisdictional claims in published maps and institutional affiliations. |
© 2022 by the authors. Licensee MDPI, Basel, Switzerland. This article is an open access article distributed under the terms and conditions of the Creative Commons Attribution (CC BY) license (https://creativecommons.org/licenses/by/4.0/).
Share and Cite
MDPI and ACS Style
Werner, L.; Strohmeier, M.; Rothe, J.; Montenegro, S. Thrust Vector Observation for Force Feedback-Controlled UAVs. Drones 2022, 6, 49. https://doi.org/10.3390/drones6020049
AMA Style
Werner L, Strohmeier M, Rothe J, Montenegro S. Thrust Vector Observation for Force Feedback-Controlled UAVs. Drones. 2022; 6(2):49. https://doi.org/10.3390/drones6020049
Chicago/Turabian StyleWerner, Lennart, Michael Strohmeier, Julian Rothe, and Sergio Montenegro. 2022. "Thrust Vector Observation for Force Feedback-Controlled UAVs" Drones 6, no. 2: 49. https://doi.org/10.3390/drones6020049