3. Experiment Design for Brightness Loss Measurement
In general, commercially available 3D LCD televisions are adjusted by standard measurement methods when the products are manufactured to leave factories [
12]. Moreover, the screen image brightness in average can be obtained by a light meter. The measurement method of local block-by-block does not need accurately to acquire precise brightness because human eyes can discern average brightness of the screen image. Hence, the 3D LCD televisions are adopted in the study to compare the brightness difference between 2D and 3D films. When comparing 2D and 3D films with the same base brightness, viewers tend to find that 2D images are brighter than 3D images. The adjustments necessary to ensure similar image brightness perception by both eyes are mainly decided based on experimental results. Then, the increases and decreases in brightness are controlled by tuning the filming aperture setting and the shutter speed. This can reduce the overall filming cost and time.
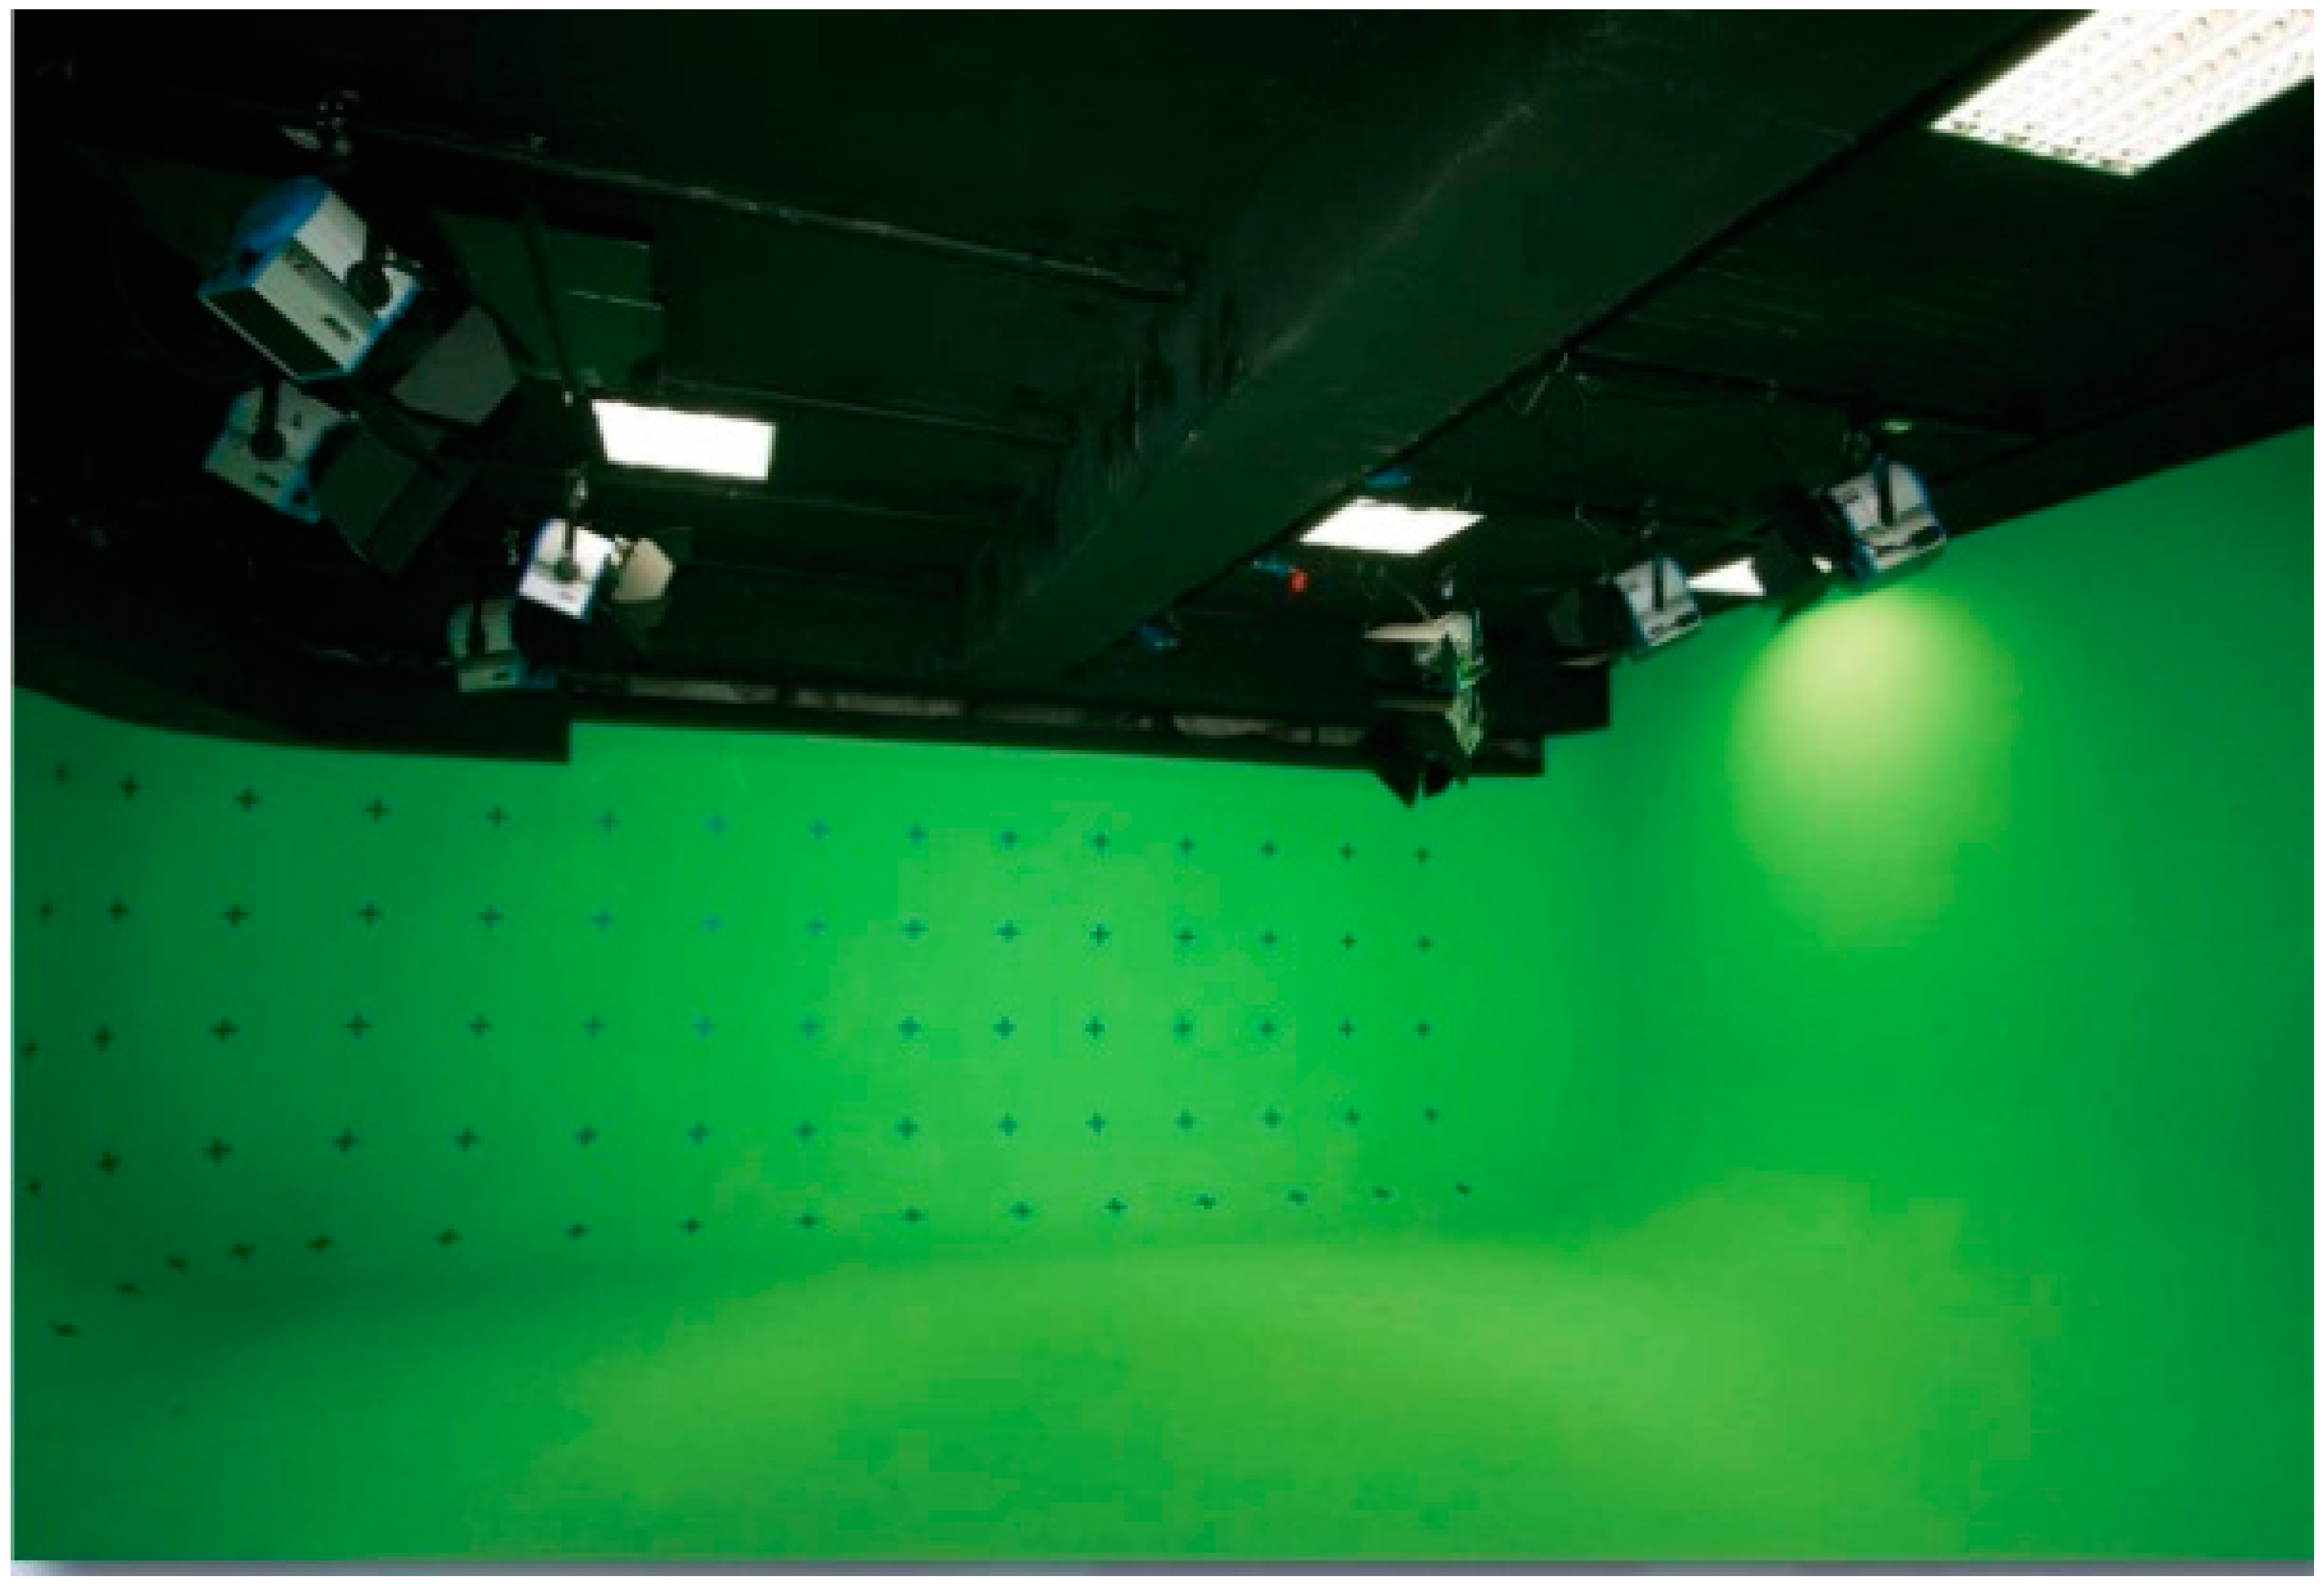
In this study, the ambient brightness was first set for the filming of a scene. Two lighting groups, with 3200 and 7500 lumens (lx) were used as spatial lighting. Then, test images were recorded in an indoor studio, as shown in
Figure 5. The experimental and hardware conditions are listed in detail in
Table 1. In the experiment, the normal ambient exposure value (EV) was set to ISO 400, which is the most commonly used value. Five aperture values (F4, F5.6, F8, F11, and F16) were selected, which were selected depending on the experiment. The shutter speed (4–1/3200 s) employed in conjunction with each of the five aperture values was used as a cross-aperture experimental variable.
Figure 5.
Recording environment.
Figure 5.
Recording environment.
Table 1.
Detailed environmental and hardware parameters.
Table 1.
Detailed environmental and hardware parameters.
| Aperture | EV | Shutter Speed (s) | ISO | Scene Recording Brightness (lx) |
|---|
| F4 | −2–+2 | 1/50–1/3200 | 400 | 3200 and 7500 |
| F5.6 | −2–+2 | 1/6–1/500 | 400 | 3200 and 7500 |
| F7.1 | −2–+2 | 1/6–1/500 | 400 | 3200 and 7500 |
| F9 | −2–+2 | 3–1/500 | 400 | 3200 and 7500 |
| F10 | −2–+2 | 4–1/500 | 400 | 3200 and 7500 |
The experimental equipment included an illuminometer (
i.e. CL200A, Konica Minolta, Tokyo, Japan), Canon 400D camera (Canon, Fukushima Prefecture, Japan), Vizio 32- and 47-inch television screens (WUSH, Irvine, CA, USA), polarized glasses, a Sony 52-inch television screen (Sony, Tokyo, Japan), and flash glasses are shown in
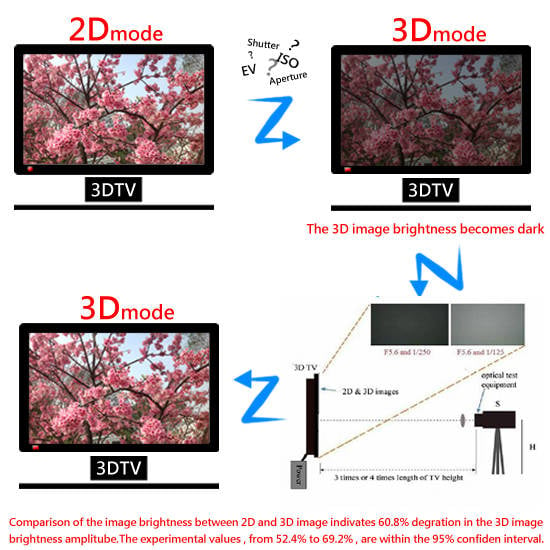
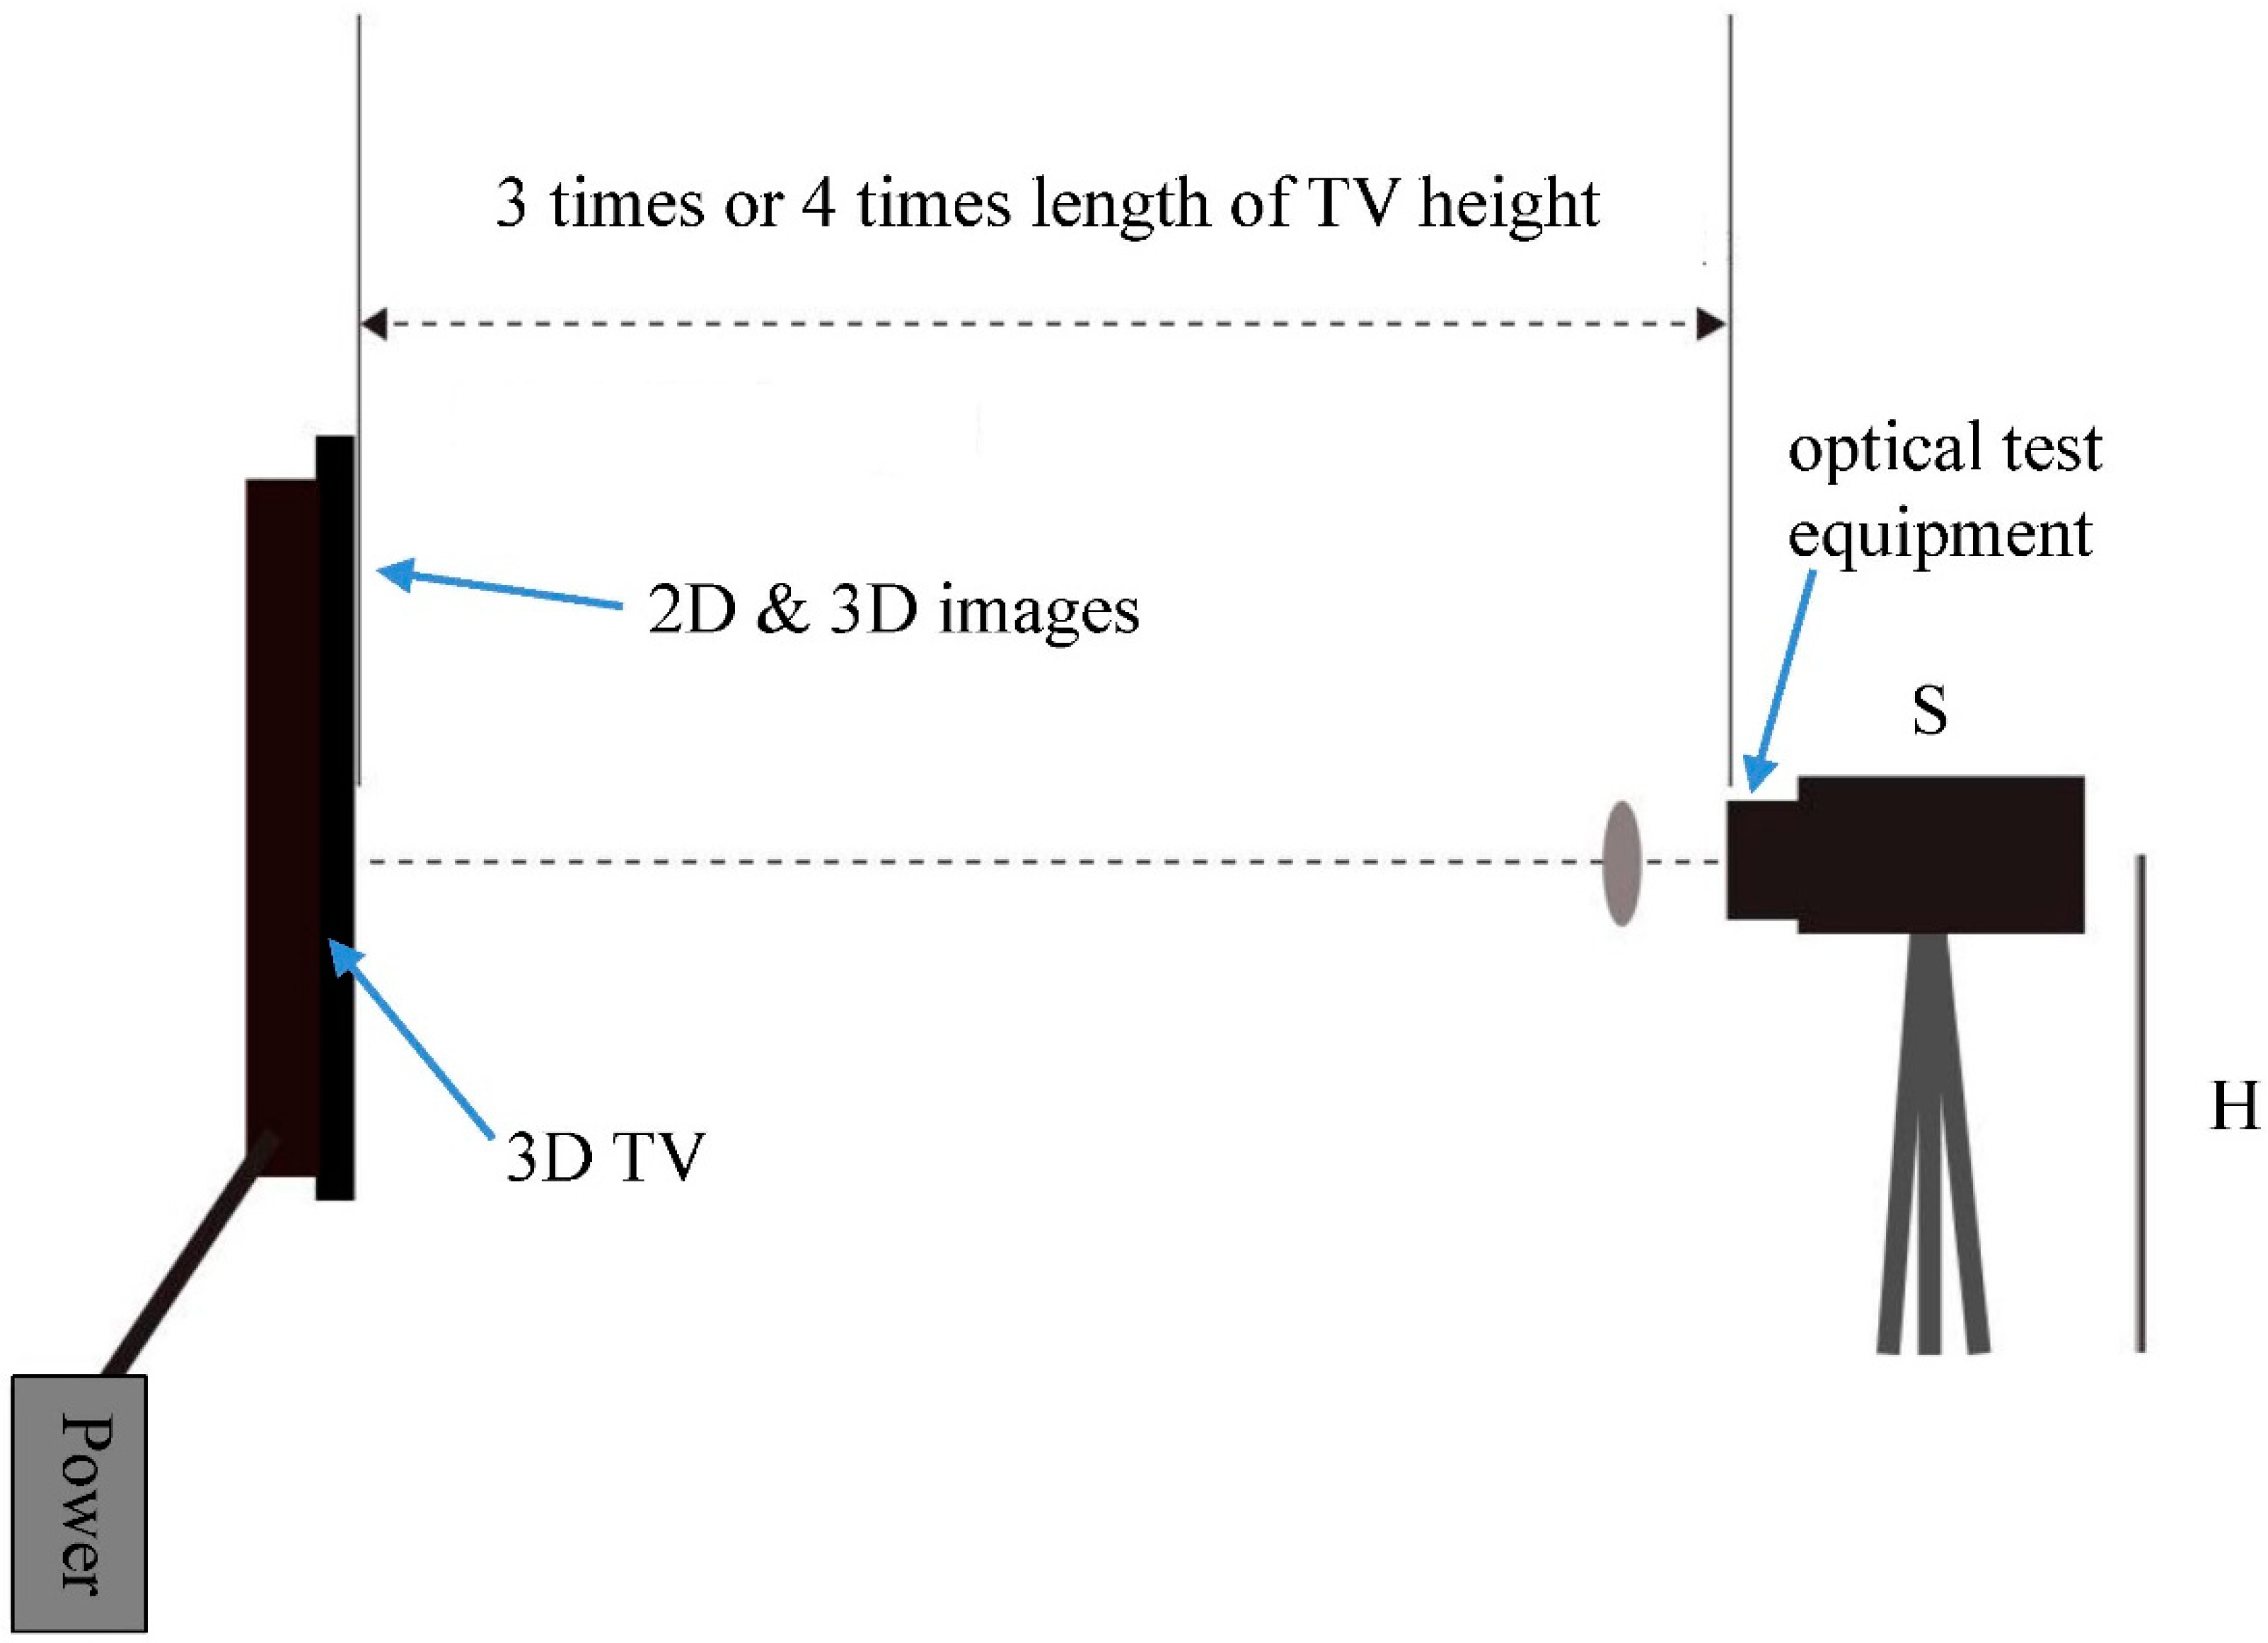
Table 2, respectively. The illuminometer is a brightness measuring tool, which produces readings in lx. The height of the darkroom was equivalent to three televisions, and the optical axis of the optical test equipment was oriented vertically to the center of the display screen, at a distance of three (high-definition television (HDTV)) and four (standard-definition television (SDTV)) times the display screen height. This was so that all of the light was received as the average light of a single image [
13], as shown in
Figure 6. A test image is displayed with both 2D and 3D mode on a 3D TV, and luminance measurements are performed for each mode. In this way, the range of luminance for 2D mode and 3D mode can be found. In addition, there are only grayscale images but color image are not need in this experiment to enhance actual measurement images. Furthermore, the grayscale images have been added, as shown in
Figure 7 and
Figure 8, respectively.
Figure 6.
Schematic of darkroom for display brightness measurement [
13].
Figure 6.
Schematic of darkroom for display brightness measurement [
13].
Table 2.
3D TV vendors.
| Vendor | Model | 3D Glasses | Used Time (h) | Year |
|---|
| Vizio | VL320M 32-inch | Polarized Glasses | 50 | 2012 |
| Vizio | M420KD 42-inch | Polarized Glasses | 45 | 2012 |
| Sony | KDL-52XBR7 52-inch | Flash Glasses | 70 | 2011 |
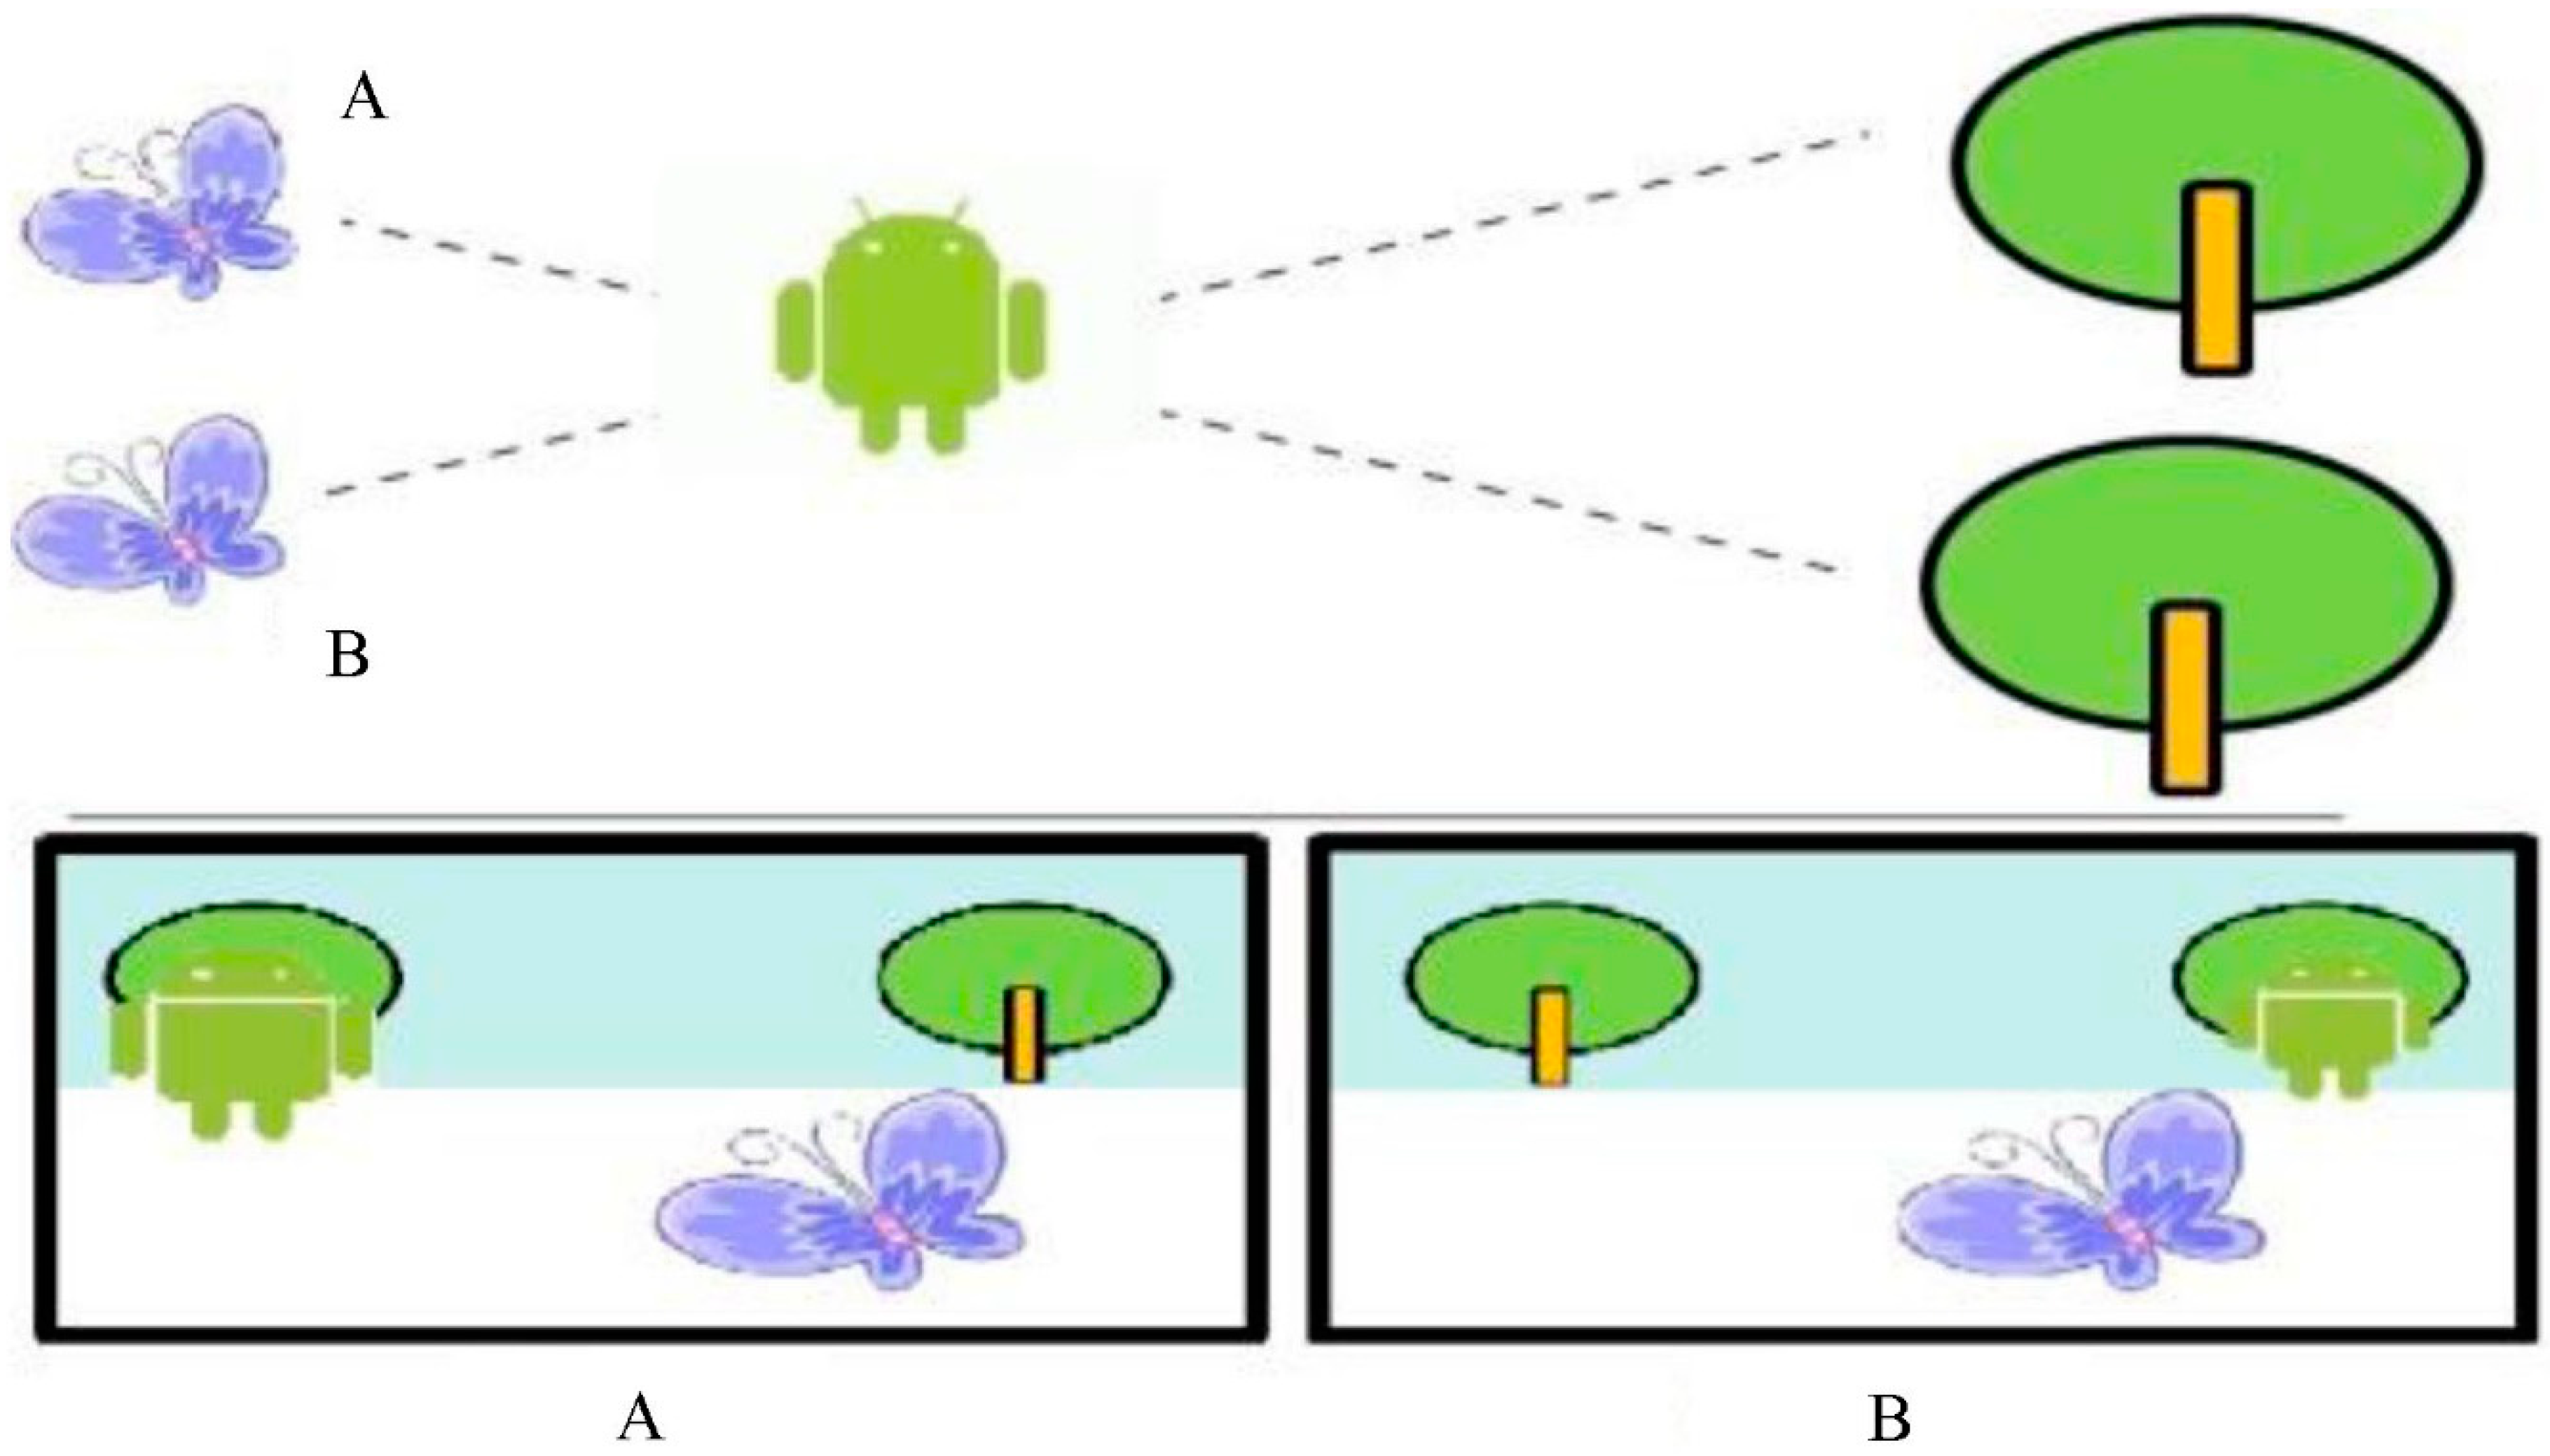
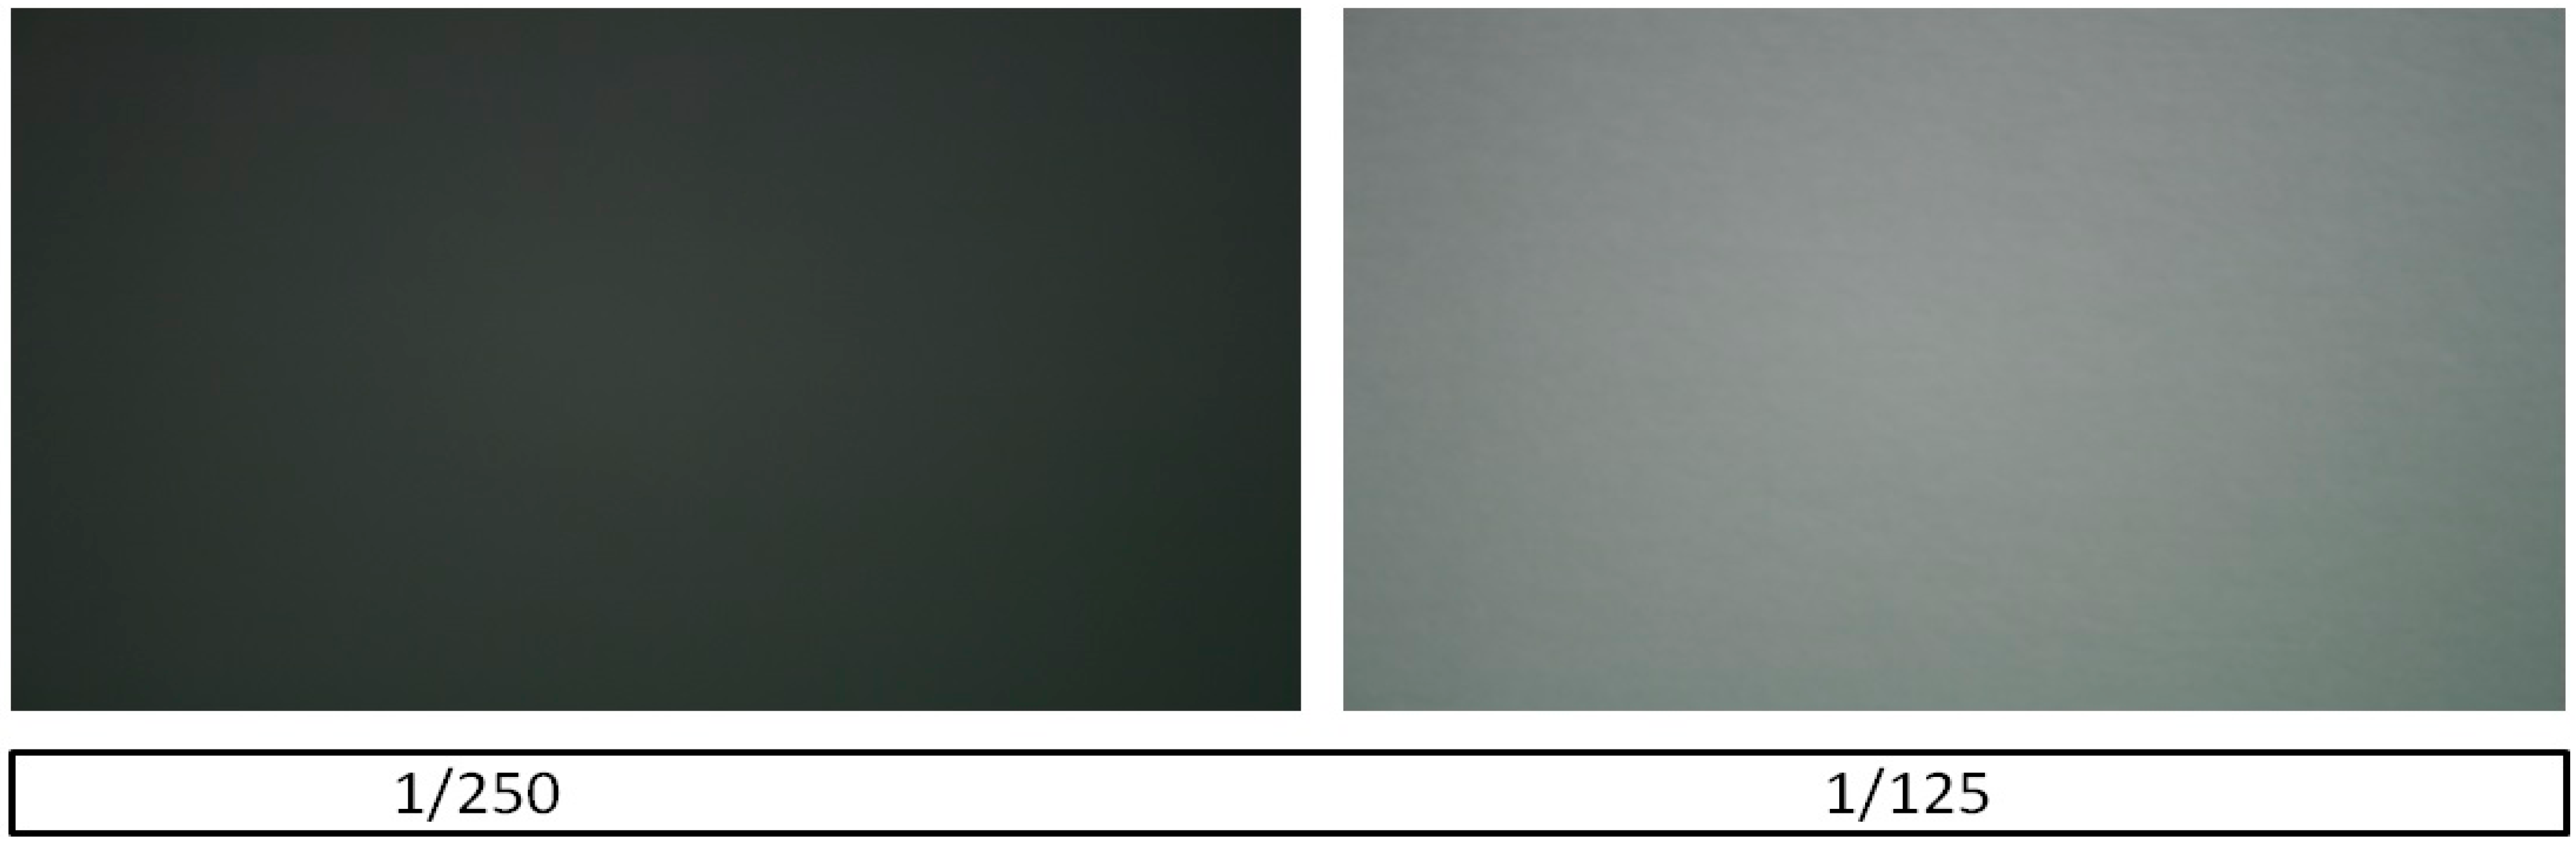
Figure 7.
F5.6 aperture 2D/3D test images.
Figure 7.
F5.6 aperture 2D/3D test images.
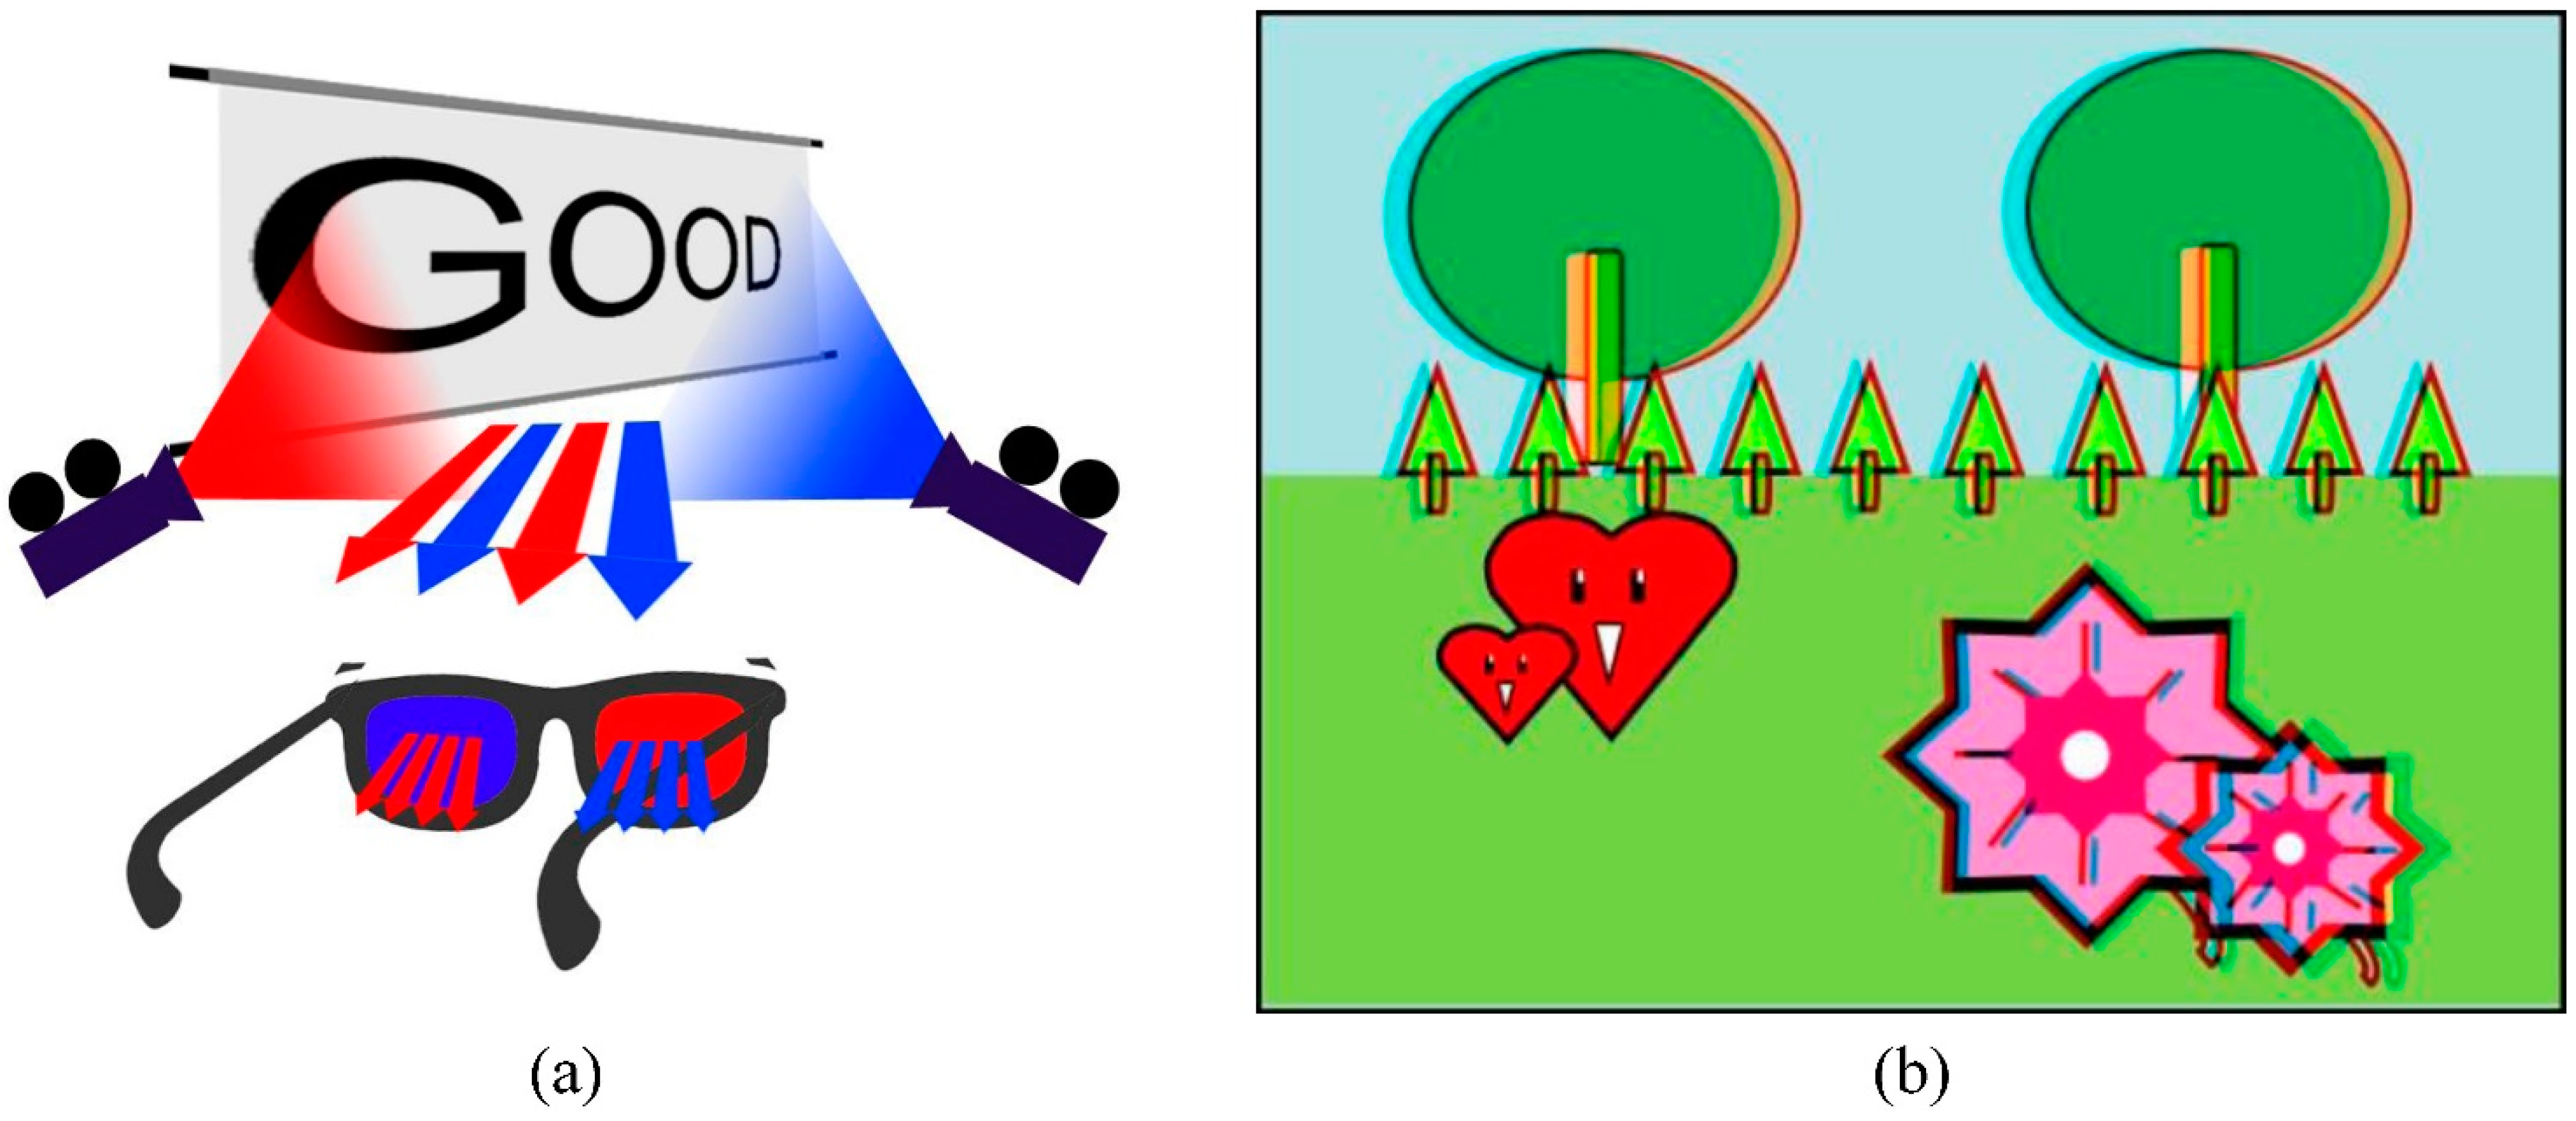
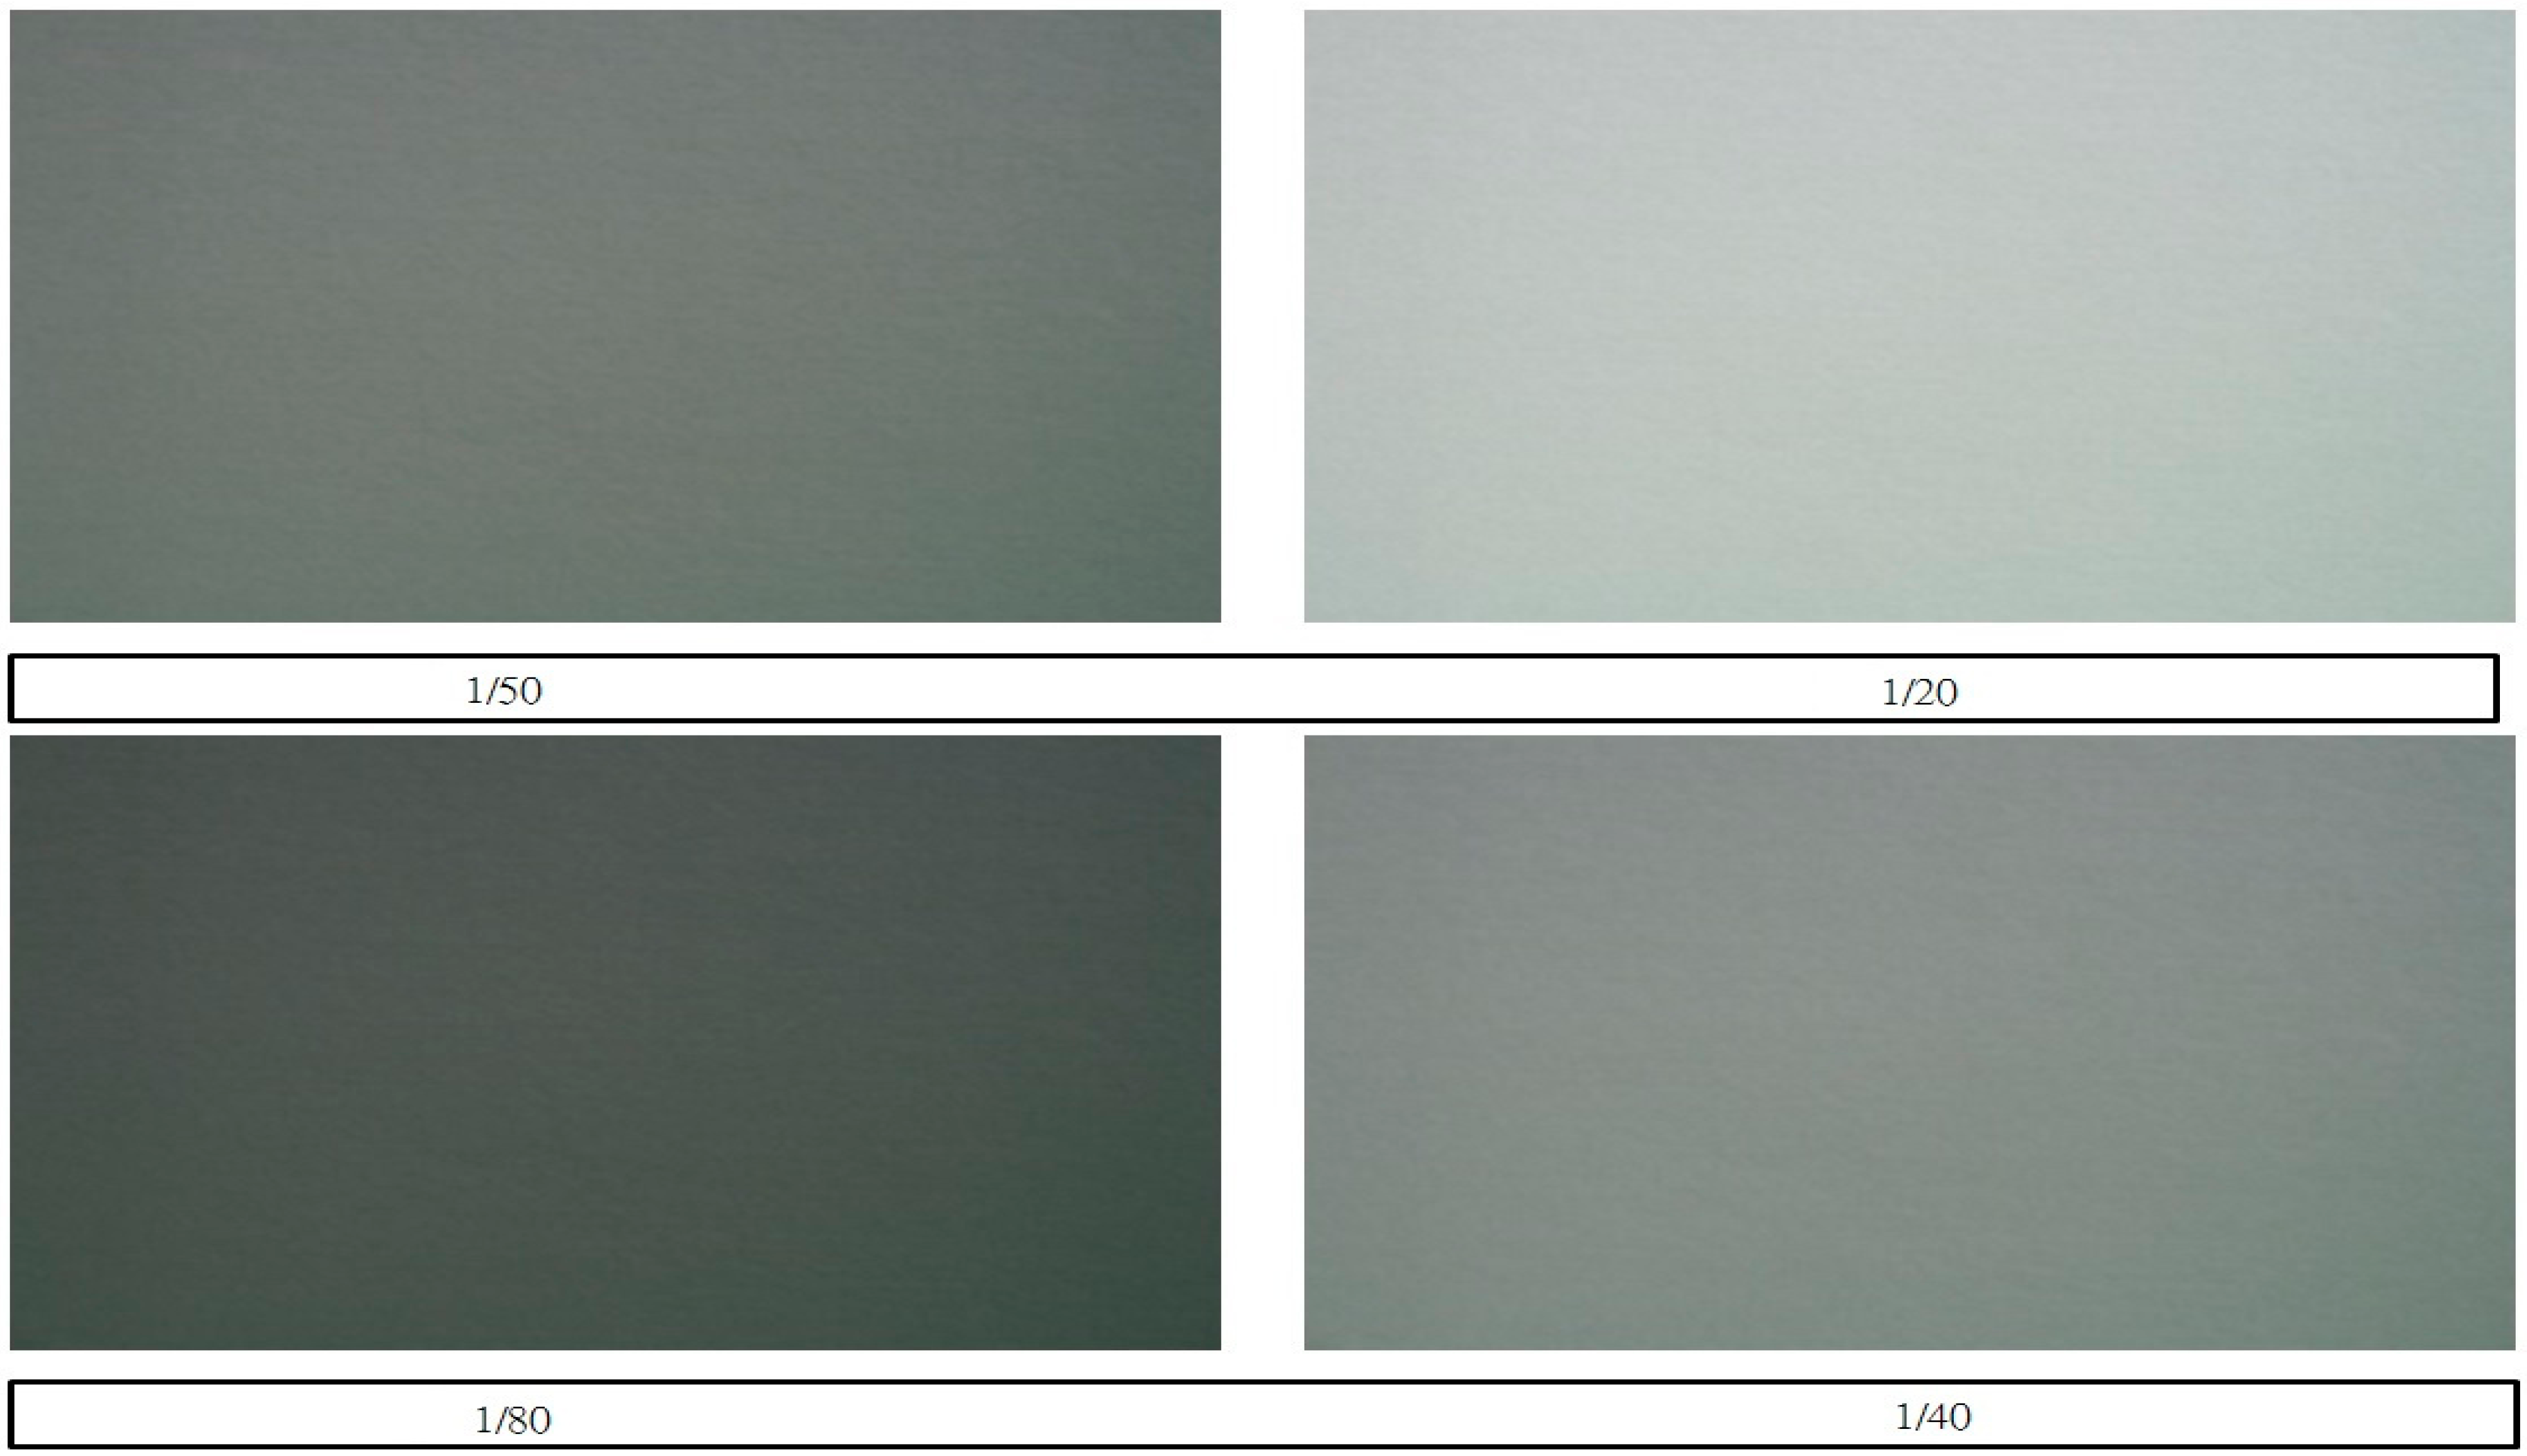
Figure 8.
F10 aperture 2D/3D test images.
Figure 8.
F10 aperture 2D/3D test images.
Note that the CL200A illuminometer is one of the commonly used models in the industry and is also relatively easy to obtain. According to statistical-method-aided analysis, the results of such experiments can be applied to the industrial sector. Furthermore, the specifications of this device conform to Japanese Industrial Standards (JIS) C1609-1:2006 Class AA, and are extremely consistent with the International Commission on Illumination (CIE) standard observer curves [
14].
After fixing the ISO and aperture conditions, images were recorded for different shutter conditions. To avoid obtaining different results for the same ambient light, the parameters were typically only adjusted after the last shooting iteration for a given setup. The camera was turned to aperture priority (AV) mode, and the camera function key “*” was pressed after the aperture adjustment. Then, the following steps were performed in order to obtain the optimal shutter value:
The camera was turned to M mode and images were recorded at the given shutter value, ensuring that the EV was 0.
The images were recorded within the EV −2 and EV +2 ranges. As a result, each group had 19 datasets.
The obtained images were presented on the television screen, and the image brightness was measured in the 2D and 3D modes.
The data was collected for analysis using statistical product and service solutions (SPSS) software (IBM, Chicago, IL, USA).
4. Experimental Results
An image brightness regression model was used to analyze the screen image brightness relationship with the following variables:
- ■
Dependent variable (Y): Screen image brightness;
- ■
Independent variables (
X):
- (1)
Screen size;
- (2)
Screen recording brightness;
- (3)
Mode (2D or 3D);
- (4)
Photographic equipment EV;
- (5)
Interactions between variables, as shown in
Table 3.
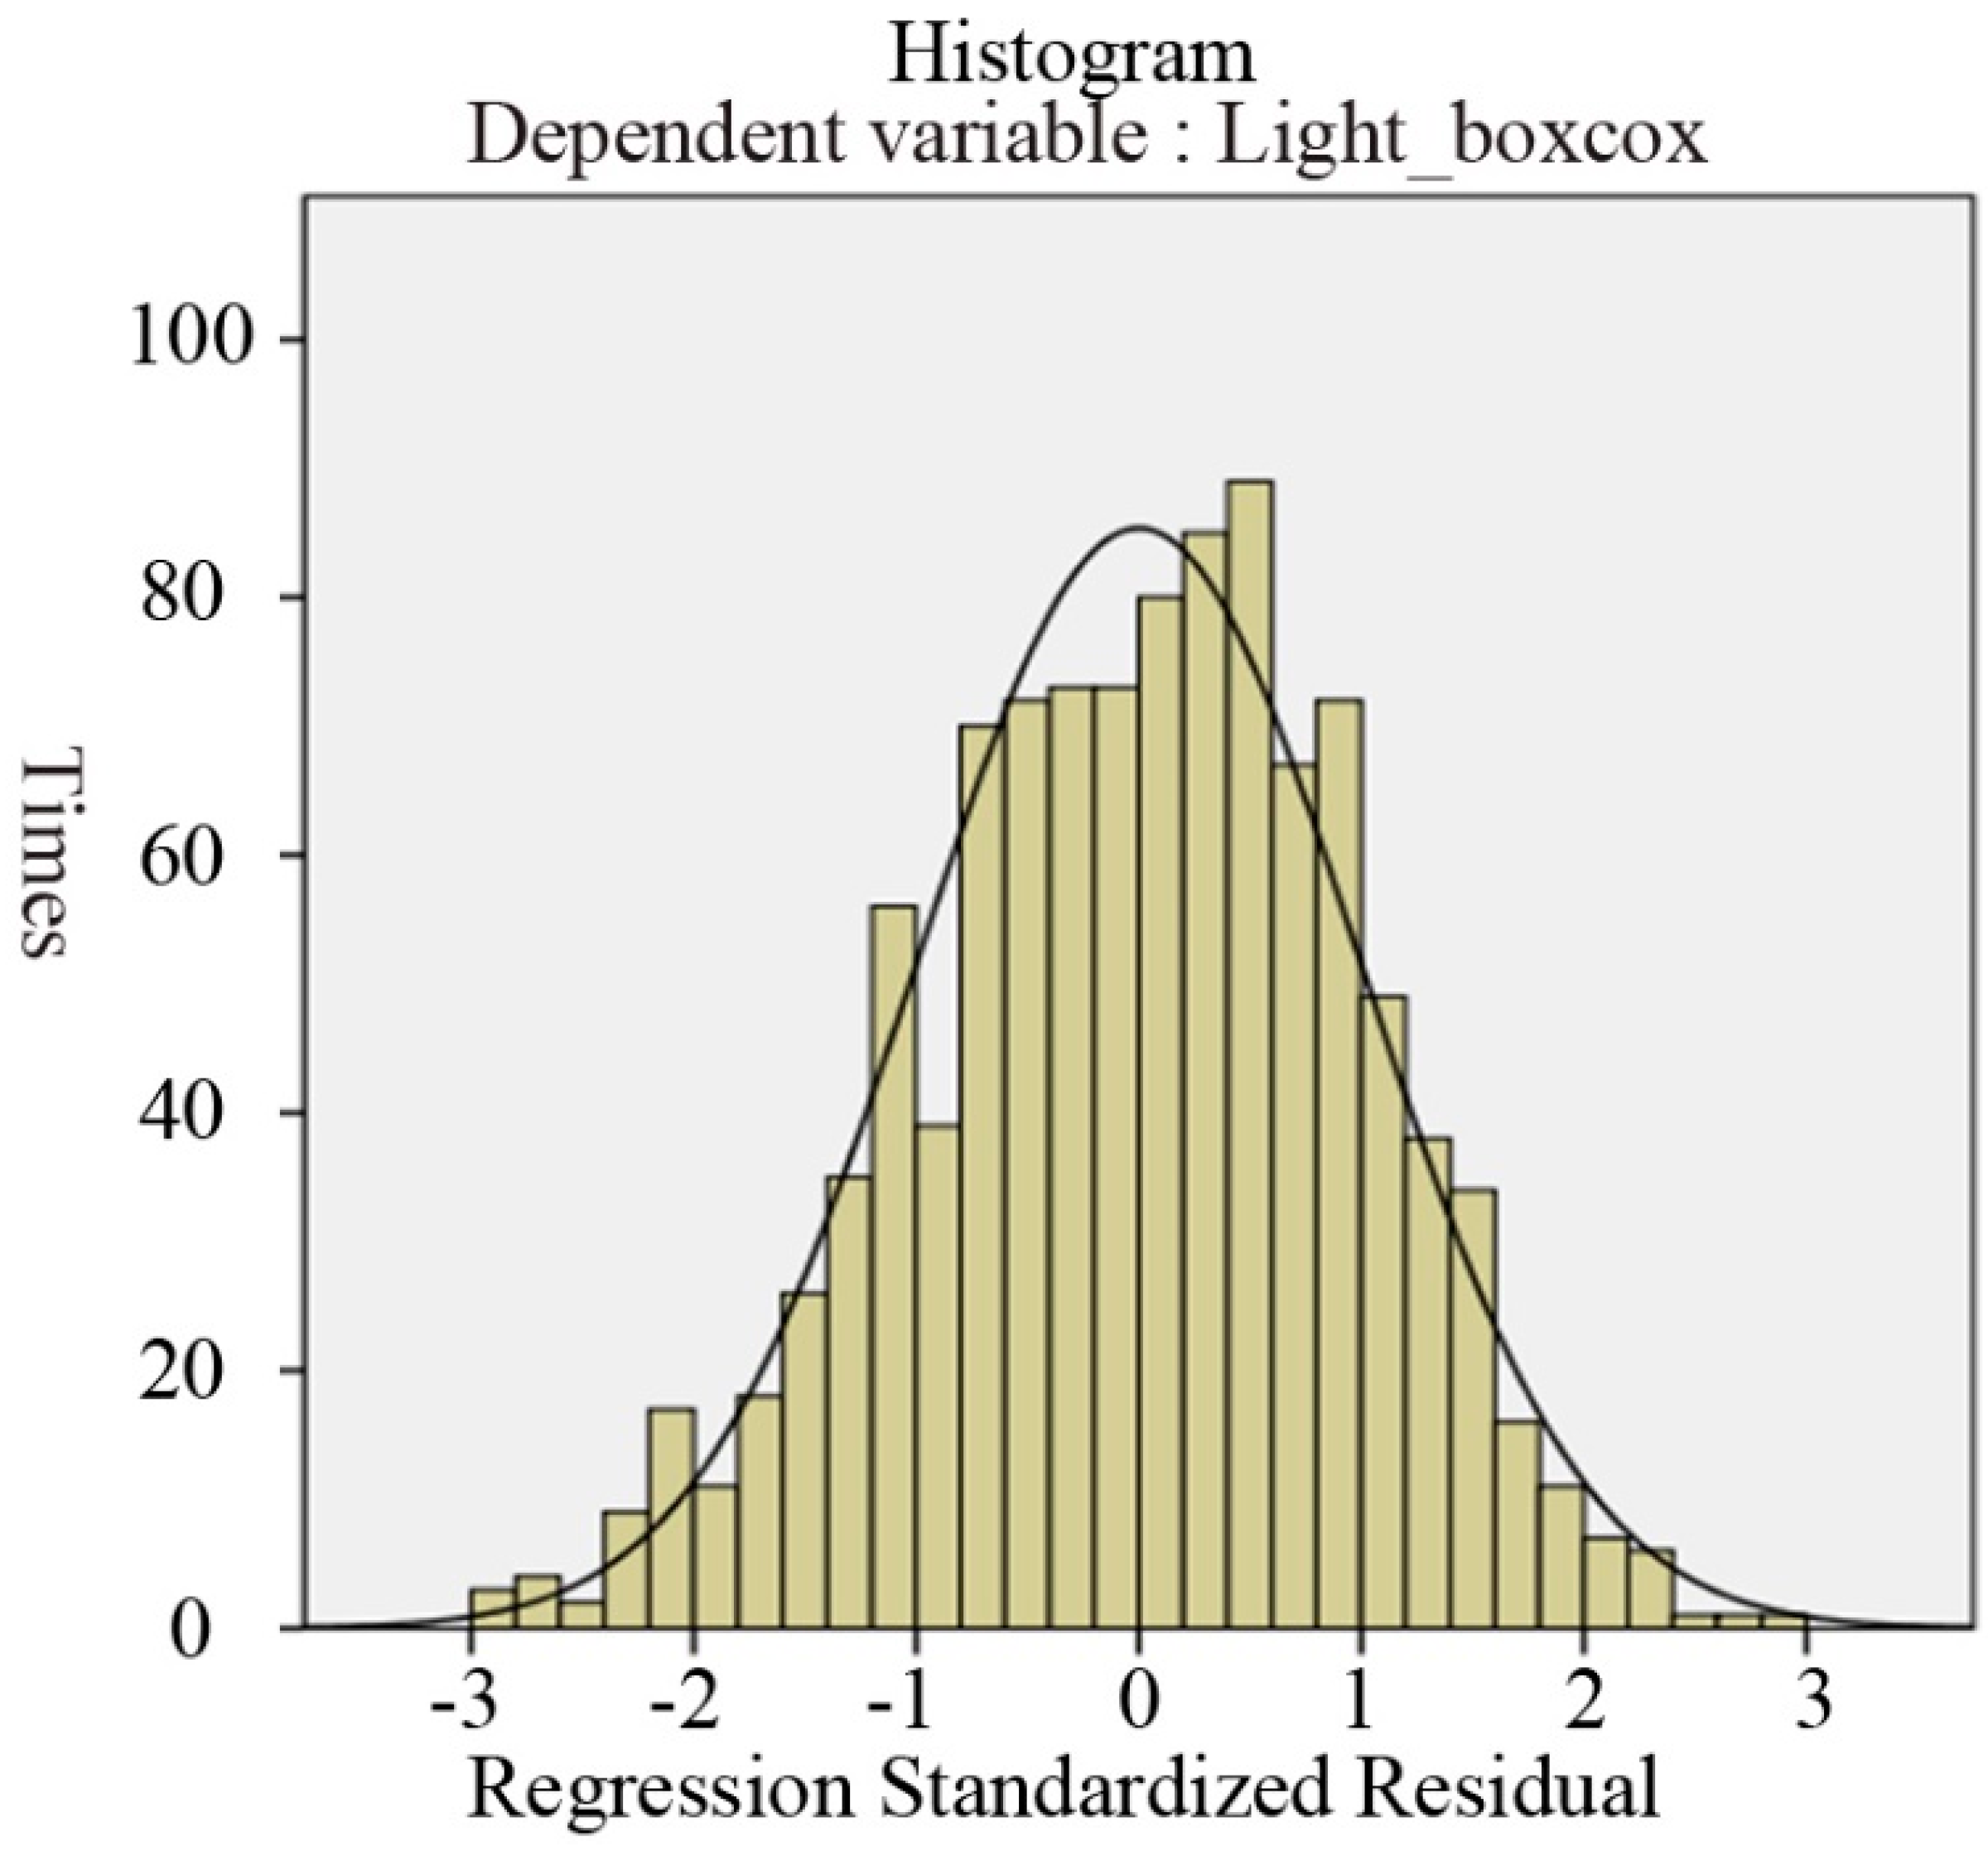
Depending on the variables’ regression standardized residuals, it was determined whether the distribution of the sample was normal, for which the bell curve is called a completely normal distribution curve. Because of sampling errors, there was a gap between the actual observed-value histogram and the normal distribution curve (
i.e.,
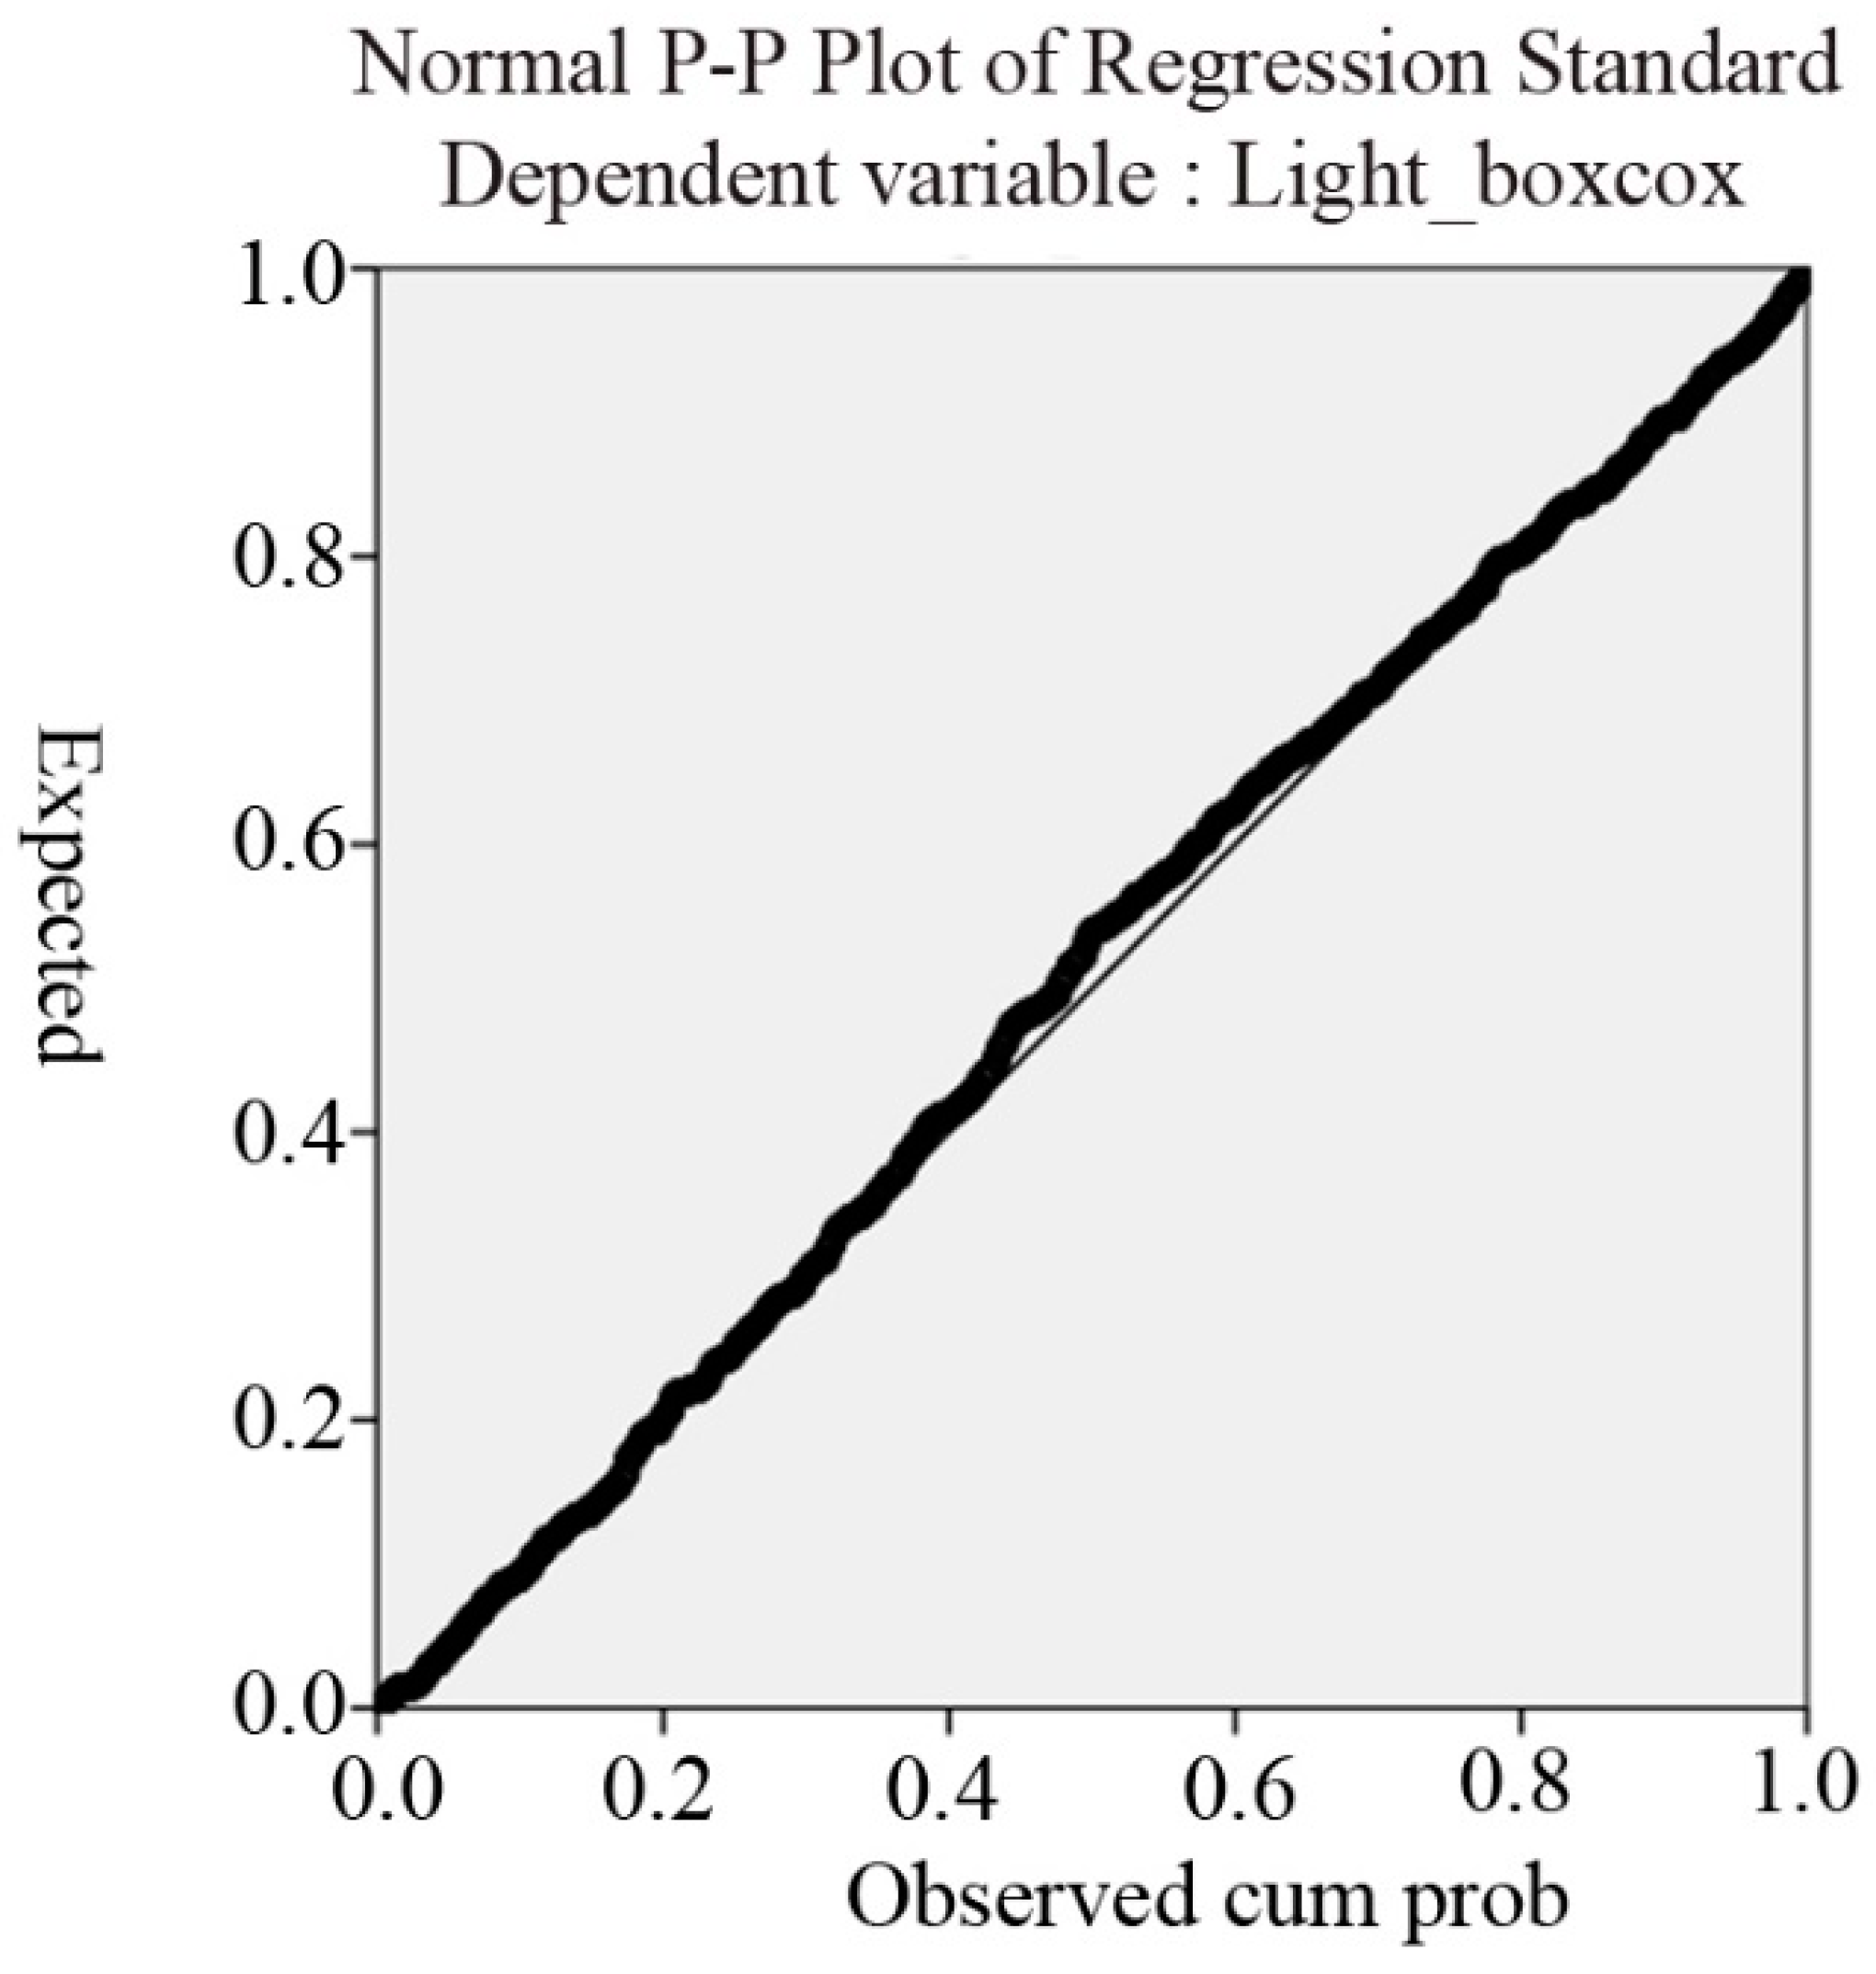
Figure 9). However, no extreme values beyond three standard deviations were found in this experiment. As a result, the sample values corresponded naturally with the normal distribution. The study then examined the variables’ standardized regression residual error on the normal P-P diagram, which exhibits a 45° line from lower left to upper right (
i.e.,
Figure 10). Therefore, the sample observations are approximately in line with the basic assumption, as shown in
Table 4,
Table 5 and
Table 6.
Table 3.
Dependent and independent variables.
Table 3.
Dependent and independent variables.
| Variable Type | Name | Values |
|---|
| Dependent Variable (Y) | Screen Image Brightness | Because of the nature of the luminance variables, there is no normal distribution, so a Box-Cox transform is used to convert the variable (λ = 0.3), so that ε (Note 1) has a normal distribution. |
| Independent Variables (X) | (1) Screen Size | 32, 47, and 52 inch |
| (2) Field Brightness | 3200 and 7500 lx |
| (3) 2D or 3D mode | 2D and 3D modes |
| (4) Photographic Equipment
EV | Converted using the camera’s shutter aperture combination.
Conversion Formula: EV = log2 (N2/t), where N is the aperture (F value), and t is the shutter speed (s). |
| (5) Interactions between Variables | The interactions between each variable. |
Figure 9.
Standardized residuals histogram.
Figure 9.
Standardized residuals histogram.
Figure 10.
Standardized regression residuals of normal P-P diagram.
Figure 10.
Standardized regression residuals of normal P-P diagram.
Table 4 shows the measures used in the brightness regression model. In this model,
R2 is used to illustrate the explanatory power of the entire pattern. However, this measure tends to overestimate phenomena depending on the sample size; the smaller the sample, the more prone the model is towards overestimation. Therefore, the majority of researchers use
, which is the error variance and variable (
Y) divided by the degree of freedom.
Table 4.
Brightness regression model summary.
Table 4.
Brightness regression model summary.
| Brightness Regression Model | Correlation Coefficient (R) | Coefficient of Determination (R2) | Adjusted Coefficient of Determination () |
| 0.995 | 0.990 | 0.990 |
Analysis of variance (ANOVA) is a particular form of statistical hypothesis testing that is widely applied in the analysis of experimental data (
i.e.,
Table 5). Statistical hypothesis testing is a method of decision-making based on data. If the test results (calculated by the null hypothesis) fall within a certain likelihood of not being accidental, they are deemed to be statistically significant. For example, when the “
p value”, which is calculated from the data, is less than the defined critical significance level, the original hypothesis can be deemed invalid. A regression coefficient of 0 can indicate that the variable has no effect on the model.
Table 5.
Analysis of variance (ANOVA).
Table 5.
Analysis of variance (ANOVA).
| Source | Sum of Squares | Degrees of Freedom | Mean Square | F Value |
|---|
| Return | 5382.379 | 10 | 538.238 | 10200.217 |
| Residual | 55.617 | 1054 | 0.053 | |
| Total | 5437.996 | 1064 | | |
The statistical coefficients of the linear regression model are presented in
Table 6. Note that mode switching between 2D and 3D images has the most significant impact on the screen image brightness. That is, once the screen is switched from the 2D to 3D mode, the image brightness on the screen exhibits a very significant decline.
Table 6.
Statistical coefficients of linear regression model.
Table 6.
Statistical coefficients of linear regression model.
| Brightness Regression Variables | Non-Standardized Coefficients | Standardized Coefficients | T |
|---|
| B | Standard Error | β |
|---|
| (A) Constant | 21.259 | 0.115 | | 184.892 |
| (1) Screen Size 1 | 1.905 | 0.145 | 0.399 | 13.180 |
| (2) Screen Size 2 | 0.707 | 0.145 | 0.147 | 4.890 |
| (B) Shooting Scene Brightness | 0.690 | 0.020 | 0.153 | 35.235 |
| (C) 2D or 3D Mode | −5.749 | 0.119 | −1.270 | −48.340 |
| (D) Photographic Equipment EV | −1.342 | 0.008 | −1.037 | −169.750 |
| (E) Interaction Value of Variables |
| (1) and (C) | −0.314 | 0.030 | −0.051 | −10.499 |
| (1) and (D) | −0.096 | 0.010 | −0.293 | −9.753 |
| (2) and (D) | −0.045 | 0.010 | −0.137 | −4.549 |
| (B) and (C) | −0.137 | 0.029 | −0.026 | −4.809 |
| (C) and (D) | 0.311 | 0.008 | 0.991 | 37.541 |
Each of the independent variables is explained and analyzed below.
(1) Screen size
After the 2D/3D mode variable, the screen size is the most important environmental variable when measuring brightness in the darkroom. The linear regression model assumes three screen sizes as separate dummy variables. The statistical results show a significant impact on the brightness, and larger screens have a positive effect on the brightness value, falling within the range of reasonable consideration. Therefore, the screen size and interactions between other factors significantly affect the brightness.
(2) Scene recording brightness
Only two brightness values were used in this study: 3200 and 7500 lx. The statistical results show that these two variables are within the range of reasonable consideration.
(3) Mode (2D or 3D)
This variable is the core consideration of the experiment, and its significance is apparent in the results of the statistical analyses. Thus, this statistical coefficient affects the screen image brightness very significantly. The experimental measurements and the linear regression model prove that the 3D image brightness is lower than that of the 2D images. To estimate the screen image brightness value, the linear regression model takes the 2D and 3D modes as dummy variables. The expected screen display mode is set in the linear regression model so that the estimated image brightness value can be obtained.
(4) Photographic equipment EV
In the experiment with different aperture and shutter conditions, this setting has a direct impact upon the image brightness. A larger EV indicates less exposure, and the statistical results are also consistent with this finding.
(5) Interaction values of variables
Each of the variables interacts with the others to a greater or lesser degree, but the coefficients of a given variable have a lesser effect on the screen brightness than interactions with all other major independent variables.
Figure 9 is a standardized residuals histogram that shows the regression distribution of the standardized residuals.
Figure 10 is a normal probability plot diagram (P-P diagram). In statistical analysis, it is often necessary to determine whether a dataset is from a normal population using regression analysis or multivariate analysis. Of all the analysis methods, the use of statistical graphics to make such a judgment is relatively easy and convenient. With a P-P diagram and a least-squares line, the user can easily determine whether or not the entered data are from a normal population. Another function is to aid researchers in interpreting the meaning of the P-P plot. The least-squares line is obtained from the linear equation derived from the method of least squares, which is a linear equation that obtains the sum of the squared residuals between the least-squares line and the data minimal.
The regression equations adopted in this study are primarily based on concepts from reference [
15], which is used as a mathematical model for derivation of the basic theory. After transforming the variables of the regression model via Box-Cox to λ = 0.3, ε matches the normal distribution, as does the
R model. The linear regression model parameters are expressed in terms of
where
Yi is a random variable,
Xi is a known fixed constant, ε
i is an unobservable, and
i = 1, … ,
nx (
i-th test;
Yi is the reaction value corresponding to
Xi). Expressing the main variables in the experimental linear model formula yields
where
X1 is the size of screen 1,
X2 is the size of screen 2,
XB is the scene recording brightness,
XC indicates the mode (2D or 3D),
XD is the photographic equipment
EV, and μ is the interaction value of the variables.
From analysis of the image brightness using this linear regression model, different variables affect the screen brightness by different degrees, although the interactions between variables affect the screen brightness only minimally. However, changing from the 2D to 3D mode has the most significant effect on the brightness. Once the screen changes from the 2D to 3D mode, the screen brightness declines noticeably.
As detailed above, the linear regression model attempts to consider the effects of the main environment and hardware when estimating the screen brightness value. The brightness values are affected by numerous external factors; however, conversion from 2D to 3D mode has the largest impact. In fact, 3D image professionals require a certain amount of time to adjust the 3D image brightness in such scenarios. Therefore, the linear regression model can help to estimate image brightness if other environmental factors or hardware conditions are controlled. The faster the shutter speed, the lower the screen image brightness, and low-brightness value images that are difficult to observe can even be obtained. The 3D image brightness degradation in response to increased shutter speed is clearly shown in
Table 7; further, the 3D image brightness values are significantly lower than the 2D image brightness values for specific shutter conditions.
Table 7.
F5.6 aperture experimental results.
Table 7.
F5.6 aperture experimental results.
| Shutter Speed (s) | 2D Mode Brightness Value (lx) | RGB Values | 3D Mode Brightness Value (lx) |
|---|
| 1/125 | 6.6 | R:125, G:131, B:126 | 2.2 |
| 1/250 | 2.2 | R:74, G:79, B:74 | 0.7 |
The experimental results show that, when the aperture is F5.6 (
i.e.,
Table 7), the image brightness value is the same in 2D mode with a shutter speed of 1/250 s as it is in 3D mode with 1/125-s shutter speed. Therefore, the 3D display exhibits approximately 50% image brightness degradation. The experimental results for the F10 aperture are listed in
Table 8. For this aperture setting, the image brightness value is the same in 2D mode with a shutter speed of 1/40 s as it is in 3D mode with 1/10-s shutter speed. Thus, the 3D display has only 50% of the 2D image brightness.
Table 8.
F10 aperture experimental results.
Table 8.
F10 aperture experimental results.
| Shutter Speed (s) | 2D Mode Brightness Value (lx) | RGB Values | 3D Mode Brightness Value (lx) |
|---|
| 1/20 | 19.8 | R:193, G:198, B:194 | 6.6 |
| 1/40 | 9.4 | R:138, G:144, B:139 | 3.2 |
| 1/50 | 6.6 | R:117, G:123, B:117 | 2.2 |
| 1/80 | 3.2 | R:81, G:87, B:82 | 1.1 |
If the low-brightness (value 0) data are removed from the experimental dataset, the 3D image brightness average value can be increased to approximately 39.2% of the 2D image brightness value. This means that, in comparing the polarizing 3D and 2D image brightness values, the 3D image brightness decreases by approximately 60.8%. For a 95% confidence interval, degradation values of 52.4%–69.2% are within the reasonable range of consideration, as shown in
Table 9. Because the polarized 3D image brightness is approximately 60% less than that of the corresponding 2D image, in order to achieve the same image brightness as the 2D image, the 3D image brightness must be increased.
Table 9.
Comparison of 2D and 3D image experimental results.
Table 9.
Comparison of 2D and 3D image experimental results.
| Experimental Item | Values |
|---|
| 3D Image Brightness Degradation | 60.8% |
| 3D Image Brightness Degradation within 95% Confidence Level | 52.4%–69.2% |
The above reference data is applicable to the production of 3D stereoscopic displays, and shows that the 3D image brightness must be increased in order to achieve the same image brightness as a 2D image on a screen. The use of this data can reduce the time period required for setting adjustments. Complementary adjustments taking the various environmental factors into consideration are recommended for practical imaging designs, so that the gap in display brightness between 2D and 3D images can be reduced. As a result, the main idea of this study is trying to measure the brightness loss (or difference) between filming 3D movie and watching 3D movie. The results show 60.8% brightness loss, which means we have to increase 2.5 times lighting intensity while filming to reach the standard brightness. This modification elevates the watching 3D movie to proper brightness.


