
Vulnerability Management Models Using a Common Vulnerability Scoring System


Department of Telecommunications and Teleinformatics, Wroclaw University of Science and Technology, 50-370 Wroclaw, Poland
*
Author to whom correspondence should be addressed.
†
These authors contributed equally to this work.
Appl. Sci. 2021, 11(18), 8735; https://doi.org/10.3390/app11188735
Submission received: 20 August 2021
/
Revised: 14 September 2021
/
Accepted: 17 September 2021
/
Published: 19 September 2021
(This article belongs to the Special Issue Novel Algorithms and Protocols for Networks, Volume II)
Abstract
:Featured Application
The Vulnerability Management Center allows for the improvement of the quality and efficiency of operation for security operation centers.
Abstract
Vulnerability prioritization is an essential element of the vulnerability management process in data communication networks. Accurate prioritization allows the attention to be focused on the most critical vulnerabilities and their timely elimination; otherwise, organizations may face severe financial consequences or damage to their reputations. In addition, the large amounts of data generated by various components of security systems further impede the process of prioritizing the detected vulnerabilities. Therefore, the detection and elimination of critical vulnerabilities are challenging tasks. The solutions proposed for this problem in the scientific literature so far—e.g., PatchRank, SecureRank, Vulcon, CMS, VDNF, or VEST—are not sufficient because they do not consider the context of the organization. On the other hand, commercial solutions, such as Nessus, F-Secure, or Qualys, do not provide detailed information regarding the prioritization procedure, except for the scale. Therefore, in this paper, the authors present an open-source solution called the Vulnerability Management Center (VMC) in order to assist organizations with the vulnerability prioritization process. The VMC presents all calculated results in a standardized way by using a Common Vulnerability Scoring System (CVSS), which allows security analysts to fully understand environmental components’ influences on the criticality of detected vulnerabilities. In order to demonstrate the benefits of using the the open-source VMC software developed here, selected models of a vulnerability management process using CVSS are studied and compared by using three different, real testing environments. The open-source VMC suite developed here, which integrates information collected from an asset database, is shown to accelerate the process of removal for the critical vulnerabilities that are detected. The results show the practicability and efficacy of the selected models and the open-source VMC software, which can thus reduce organizations’ exposure to potential threats.
1. Introduction
According to a company report by Skybox, which examined, among other things, the threat levels in cybersecurity, 2020 was the record year in terms of the new types of threats that were detected [1]. Twice as many malware types were detected and increases of 106% in ransomware types and 128% in Trojans were recorded in comparison with the previous year. According to the report, only some of the 18,341 new vulnerabilities reported in 2020 will be actively exploited. All of the previously gathered information resulted in an excessive increase in data on new vulnerabilities and attack vectors. Consequently, the tasks of detecting the most crucial issues and directing efforts to the most demanding fields are immensely difficult. However, it is not only in the field of computer science that the fast detection of vulnerabilities and correct prioritization are constantly discussed; for example, in [2,3,4], the vulnerability of buildings to seismic activity was investigated through combinations of the buildings’ geometric features, social vulnerabilities, as a result of the impact of the COVID-19 pandemic, were detected [5], and impacts on areas such as critical infrastructure were assessed [6].
In order to address the issues mentioned above, Asset Management (AM) and Vulnerability Management (VM) were developed. Both of these processes have been discussed in the literature [7,8]. However, their implementation is still a challenge for a large number of organizations [9,10], since most of them follow a gradual risk mitigation philosophy, which is focused on mitigating and fixing vulnerabilities within a specified time interval. Consequently, such organizations focus mainly on repairing 90% of the most critical vulnerabilities within two weeks from detection; thus, the vulnerability management process is limited solely tasks of metrics. However, in most cases, a potential attacker will not focus on the vulnerabilities that have been fixed, but on the remaining 10%. Studies such as [11] have discussed and highlighted the importance of the response time for new threats and the significance of a prompt and accurate vulnerability prioritization.
In this contribution, the authors have developed a distributed system—the Vulnerability Management Center (VMC) 1.1-RC-2 [12]—which is a fully scalable software that operates in a container environment and is prepared to support the efficient handling of an increasing amount of data. The VMC performs an automatic calculation of the CVSS environmental score [13]. The VMC collects information regarding vulnerabilities from publicly accessible sources and on vulnerabilities occurring in data communication networks detected with scanners such as Nessus [14], and it integrates this information with data obtained from an inventory database. In this way, the VMC performs environmental calculations while considering, among other things, variables such as Target Distribution (TD), Confidentiality (C), Integrity (I), and Availability (A).
A novel contribution of this work consists in the performance of automatic calculations of the CVSS environmental assessment by combining data obtained from the vulnerability scanner with the data retrieved from the inventory database. An additional new aspect of this paper is the presentation and examination of models of the vulnerability management process with the developed software with the aim of improving the quality of vulnerability repair prioritization in the vulnerability management process. The transparency of the re-prioritization process implemented here and the open standard implementation of CVSS enable the end user to understand rationale behind the automatic decisions made by the VMC software developed in this paper. Consequently, the communication quality between people involved in the vulnerability management process is improved. According to the best of the authors’ knowledge, such an approach has not been presented in the publicly available literature before. This paper is divided into the following subsections:
- Background—describes the research basics and presents problems, processes, and compromises that occur in the vulnerability management research.
- Related Work—discusses other works related to the current topic. A brief description of the management of work-related vulnerabilities is covered.
- Methods—highlights the effectiveness evaluation models for vulnerability management in the identified VM models by using the CVSS standard.
- Experimental Design—covers the design of an experiment for the research conducted.
- Results—provides a discussion of the results, shows the advantages of the proposed VMC system, and examines the behavior of the models presented and the results obtained.
- Conclusions—summarizes the results obtained and introduces topics for further research.
2. Background
It is noted first that, in what follows, the reader is expected to be familiar with such terms as CVE and CVSS, which are essential to understanding the vulnerability management process; cf., for instance, [9]. Current corporate networks consist of thousands of devices and applications with a variety of entities, such as office networks, financial and HR systems, and specialized configurations, which include control over production processes, telecommunication systems, or environmental controls [15]. If any of these entities do not work properly or are temporary unavailable, a company may suffer potentially high losses [8]. An illustrative example is the vulnerability CVE-2017-0143 [16], which is referred to by researchers as ETERNALBLUE. This vulnerability was a basis for hackers to create the ransomware WannaCry. This malware irretrievably encrypted thousands of terabytes of data in a short period of time and caused financial losses in corporations such as Nissan and FedEx [17,18], thus highlighting the importance of the proper implementation of vulnerability management process.
In experienced organizations, the vulnerability management process enables the risk associated with the use of known vulnerabilities to be kept at the lowest possible level [19]. The main purpose is to monitor and identify new threats (for hardware or software) that may have an impact on the confidentiality, integrity, or accessibility of an IT organization’s assets. The vulnerability management process is also a central point for collecting and approving exceptions regarding a vulnerability fix.
The vulnerability management process is continuous and is repeated each time that the previous cycle ends. The process is cyclical, since new threats occur every day. This is because the infrastructure is dynamic, and hence, new configurations introduced in a network device may cause a new vulnerability. Thus, one or even several completed cycles may not be enough for a company to ascertain that the process of vulnerability elimination was successfully completed.
In order to increase effectiveness of the vulnerability management process, the authors of [10] suggested the introduction of the following positions and responsibilities in an organization:
- Head of security—a person responsible for, among other things, the vulnerability management process in the organization;
- Security engineer—a person responsible for conducting scans according to the process;
- Asset owner—a person responsible for IT assets that are scanned in the process; moreover, the asset owner decides whether the vulnerability will be fixed or the corresponding risk will be accepted. This is frequently a businessperson;
- Asset administrator—a person responsible for implementing recommendations, which are the results of scans and the vulnerability management process.
Specifying the scope of responsibilities for all people involved in the vulnerability management process is important. The number of people involved in the process depends on the size and context of an organization. In a small organization, the scope of responsibilities will be increased. For example, the owner of a company may also be the head of security and the asset owner, while an employee can be the security engineer and asset administrator. Nevertheless, the vulnerability management process will be unchanged. One person should never hold all four positions, as the decisions made regarding a risk or vulnerability fix will never be sufficiently objective. Analogically, for a large organization with a greater number of employees available, the number of people involved in the process will accordingly increase; thus, the scope of responsibilities should be strictly defined.
3. Related Work
The authors of [20,21] highlighted the fact that, in order to prioritize vulnerability effectively, organizations should consider the value assets and the importance of vulnerabilities in a standardized way. The obstacles regarding vulnerability prioritization have been extensively discussed in the available literature [22,23,24,25]. Most established companies that understand the importance of cybersecurity have implemented vulnerability management processes to large extent [10,20,22]. However, as indicated in [10,22,23,24,25], each organization uses a different approach to this problem. The commercial solutions listed in [26]—e.g., F-Secure [27], Qualys [28], Rapid7 [29], and Tenable [30]—help organizations to overcome the problem of vulnerability management, but also have some drawbacks. Namely, these solutions are very expensive for users and do not provide detailed information regarding the prioritization procedure, except for the scale. For example, Qualys uses a seven-point scale [28], Rapid7 prioritizes between 1 and 1000 [29], and Tenable uses its VPR prioritization method in which the levels are given between 1 and 10 [30].
Aside from the commercial solutions, in the literature, one can find references to other software tools, e.g., PatchRank [31], SecureRank [32], Vulcon [33], CMS [34], VDNF [35], and VEST [36]. The aim of PatchRank is to focus entirely on prioritizing updates for SCADA systems [31]. SecureRank uses a network topology and the potential interactions between servers to estimate risk [32]. Vulcon’s strategy is based on two elementary metrics: Time to Vulnerability Remediation (TVR) and Total Vulnerability Exposure (TVE) [33], which occur in monthly cycles. CMS is responsible for detecting vulnerabilities by considering the correlation of an asset database with the NVD database. Therefore, there is a high probability that the tool will report vulnerabilities that do not exist or will ignore those that are present in the environment [34]. VDNF normalizes the data from various vulnerability databases and removes relevant vulnerability information about vectors corresponding to the base score, thus making it difficult for security engineers to communicate about the impacts and exploitation of vulnerabilities [35]. VEST, on the other hand, predicts how quickly a vulnerability can be exploited by an attacker [36]. Other solutions, such as those in [31,32,33,35,36], do not take into account the value of assets and have not been adjusted for the increasing amount of data in the cloud computing environment. Thus, they cannot be applied to every network infrastructure. Additionally, the presented solutions do not offer priorities for either CVSS 2.0 or CVSS 3.x, since not all vulnerabilities have been converted from CVSS 2.0 to CVSS 3.x, even though CVSS 3.x assesses the essence of vulnerabilities and estimates threats more effectively [37,38,39].
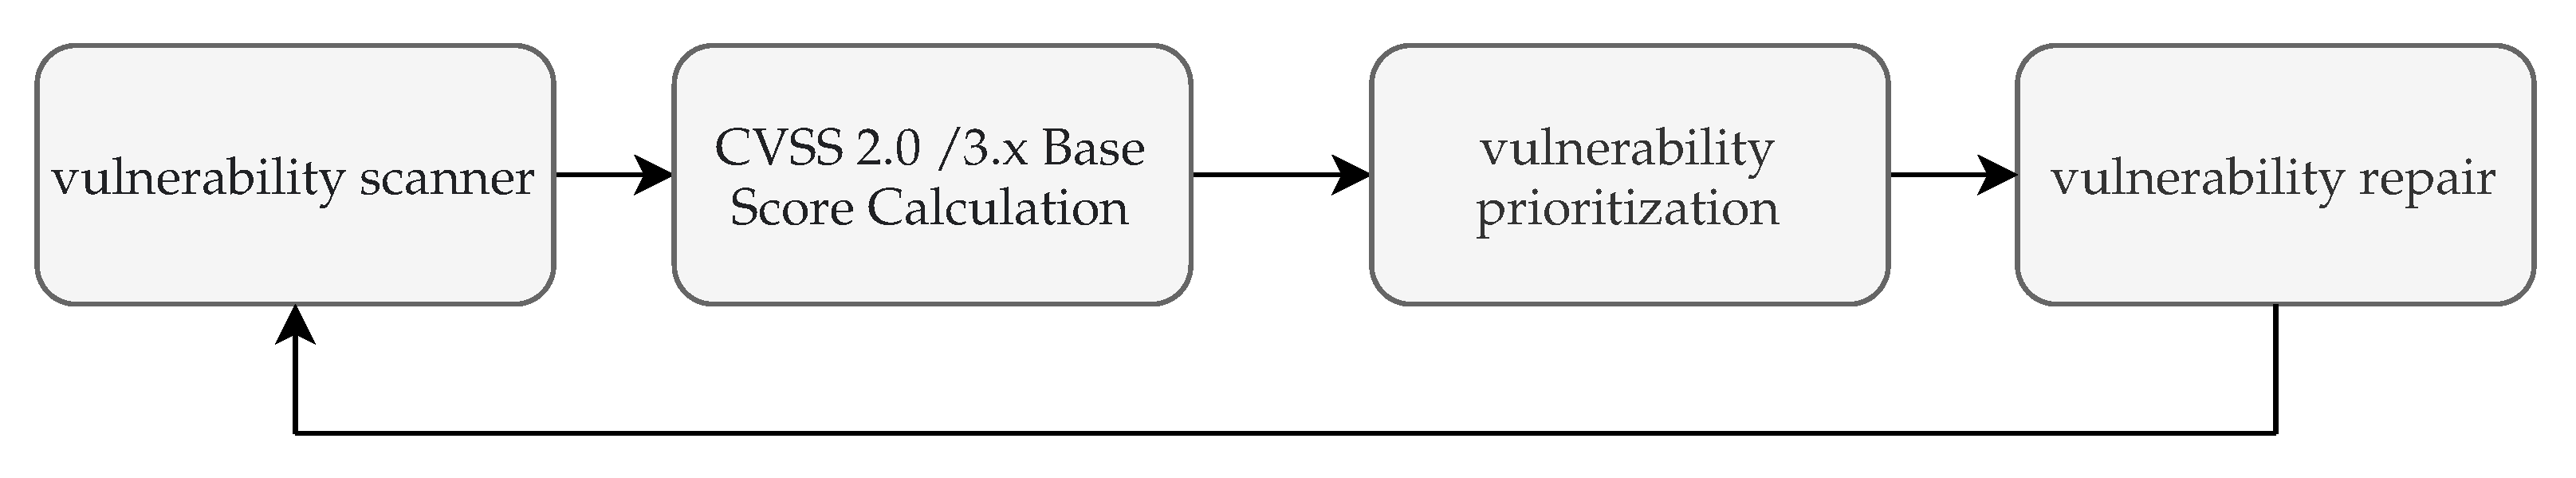
None of the discussed solutions prioritize the vulnerabilities detected by scanners according to an environmental assessment; thus, vulnerability management processes are performed according to the models presented in Figure 1, whereby a vulnerability scanner generates a list of detected vulnerabilities. Then, for all of the list items, base CVSS scores are calculated. Next, by using the CVSS scoring, a prioritization is performed, and finally, a team of IT technicians eliminates the detected vulnerabilities in an order congruent with the prioritization. One should also emphasize that companies use the metrics proposed by the Center for Internet Security (CIS), which were created in 2010 [40,41] in order to measure the security of ICT infrastructures. Organizations most frequently choose a standard based on the base CVSS score of 2.0 (Figure 1) in order to meet the requirements of the CIS metrics.
The authors of [20,42,43] showed that the base CVSS metrics alone are insufficient in the process of vulnerability prioritization and that the context of an organization should also be taken into consideration. Therefore, another two models of the vulnerability management process are considered here. The first model (Figure 2) implements the CVSS 2.0 environmental score assessment, but it cannot be considered as independent, since the influence of the TD factor, which determines the number of systems that are sensitive to a given vulnerability, significantly decreases the criticality of many detected vulnerabilities. Therefore, a false perception regarding the security of the monitored ICT infrastructure will, in effect, increase the vulnerability to hacker attacks. The second model (Figure 2) implements the CVSS 3.x environmental assessment. When compared with the previous two models, these two new models require more effort when performing vulnerability prioritization, but may lead to a more effective and faster elimination of critical vulnerabilities. The comparison of these models is the subject of the subsequent sections of this paper.
By using the CVSS metrics, two more vulnerability management models available—namely, CVSS 2.0 and CVSS 3.x Temporal—which, in addition to the base score, take into account factors such as the existence of an official patch from the vendor and the availability of a public exploit. However, to the best of the authors’ knowledge, it is only the environmental assessment that has not been automated [36].
4. Methods
In order to evaluate the vulnerability management models presented here, the newly developed VMC software was used [12]. The VMC consists of four core modules: a Knowledge Collector, Asset Collector, Vulnerability Collector, and Processing Module. Figure 3 depicts the architecture of the VMC. The first three modules are responsible for downloading data from different parts of a corporate network.
The fourth module, which is also known as the calculative module, provides results as they become available. All modules work independently, communicating asynchronously by using a queue system. Due to this, the VMC is vertically scalable, leaving no damage for the remaining components. The system is configured from the administrator panel. The Module Scheduler controls the sequence and the time of synchronization of the data download from the particular sources. The Task Monitor, on the other hand, gives the opportunity to preview the current state of the system. The entire solution was prepared with the aim of cooperation in the cloud computing environment and is based on the Docker Container technology [19,44]. All data are stored in Elasticsearch [45], which enables processing of the data in full-text mode, while the Kibana tool [46] is used to present the results. In order to implement the components described below, Python was used due to its flexibility and efficient data processing ability on the server side. The whole project includes multitenancy support, which allows for comprehensive separation of data between the documents. Additionally, the VMC functions in two modes: operational and historical. Due to this, the analyst is able to see all changes on an ongoing basis. In addition, this enables one to preview data and historical calculations, thus facilitating, at the same time, the analysis of the events in system. Detailed descriptions of each of the module were presented in [9,41].
In order to quantitatively assess the performance of the models proposed above, the number of work hours required to remove a vulnerability within a cycle of the vulnerability management process [33] is estimated. In order to obtain the number of work hours, the vulnerabilities are divided into one of three possible categories:
- From 1 to 3 h (vulnerabilities such as weak encryption methods, default password change, or configuration change);
- From 3 to 6 h (vulnerabilities such as software updates);
- From 6 to 9 h (vulnerabilities such as operating system updates).
Using the work hour ranges mentioned above, the vulnerability repair time () was divided into three subcategories in consideration of the number of hours required for repair: represents the maximum number of work hours required to fix one vulnerability and was assumed to be equal to 9 h; is the average number of work hours required to fix one vulnerability and was assumed equal to 4.5 h; is the minimum number of work hours and is assumed equal to 1 h. Then, the equations that were used to estimate the number of work hours required to improve the security of ICT infrastructure were derived by implementing the models discussed in the Related Work section. Assuming that all vulnerabilities of a critical (), high (), and medium () severity must be fixed by administrators, the number of work hours required to improve security with the suggested models can be expressed as the sum of the constituent time spans required to fix each type of vulnerability complemented by the time needed for information processing and other operations, e.g., scan duration () [43,47]. Therefore, the equation used for the calculation of the time needed to eliminate all vulnerabilities with high and medium criticality with the first model (Figure 1) is expressed as follows:
where is the number of work hours required to fix one vulnerability, and , , and are the numbers of vulnerabilities with high, medium, and low severity, respectively, according to the base CVSS 2.0 score.
For the vulnerability management model based on the base CVSS 3.x score (Figure 1), the number of critical vulnerabilities () was added to the equation discussed above. Consequently, the equation for the calculation of the time needed to eliminate all vulnerabilities with high and medium criticality is as follows:
where , , , and are the numbers of vulnerabilities with critical, high, medium, and low severity, respectively, according to the base CVSS 3.x score.
In the case of the models that use the environmental assessment, the time taken for re-prioritization with the newly developed VMC software () should additionally be taken into consideration. Furthermore, the part of the equation that is responsible for the number of work hours required to fix low vulnerabilities does not have to be included, as the environmental assessment is assumed to perform the prioritization accurately and, thus, removes the risk of classifying a vulnerability with medium criticallity as a vulnerability with low criticality, which is possible when considering only the base score and not including the environmental variables. Thus, considering CVSS 2.0 environmental score (Figure 2), the following equation is obtained:
where is the time taken to perform the re-prioritization with the VMC software, and and are, respectively, the number of vulnerabilities with high and medium severity according to the CVSS 2.0 environmental score.
Similarly, in the case of the model with the CVSS 3.x environmental score (Figure 2), the following equation is obtained:
where , , and are, respectively, the numbers of vulnerabilities with critical, high, and medium criticality according to the CVSS 3.x environmental score.
To investigate the impact of the environmental factors on the base CVSS score, the following equation was used:
where d is the difference between the received scores, is the base score obtained from the Nessus scanner, and is the environmental score calculated with the VMC software. If a negative value is obtained for d, this indicates that the environmental score has been lowered with respect to the base score; likewise, a positive value of d indicates that the environmental score is higher than the base score. In order to determine the number of changes in the vulnerability prioritization for the CVSS 2.0 and CVSS 3.x scores, all unique occurrences of the d values received were counted.
5. Experimental Design
In order to compare the selected VMC models, three independent research environments were used; all IP addresses were anonymized because all of the data received contained sensitive information about vulnerabilities in real companies’ environments. Additionally, the percentage scale was implemented for all of the graphs in order to facilitate the interpretation of the results.
The Nessus scanning reports were received for all environments. In addition, for environment A, the administrator provided information regarding assets and CIA flags; for environment B, no guidelines were contributed, and environment C contained only general information and asset marks, such as critical, medium, and low. After the models and the ways of estimating their performance are explained, the testing environment is discussed in the next section.
5.1. Description Environment A
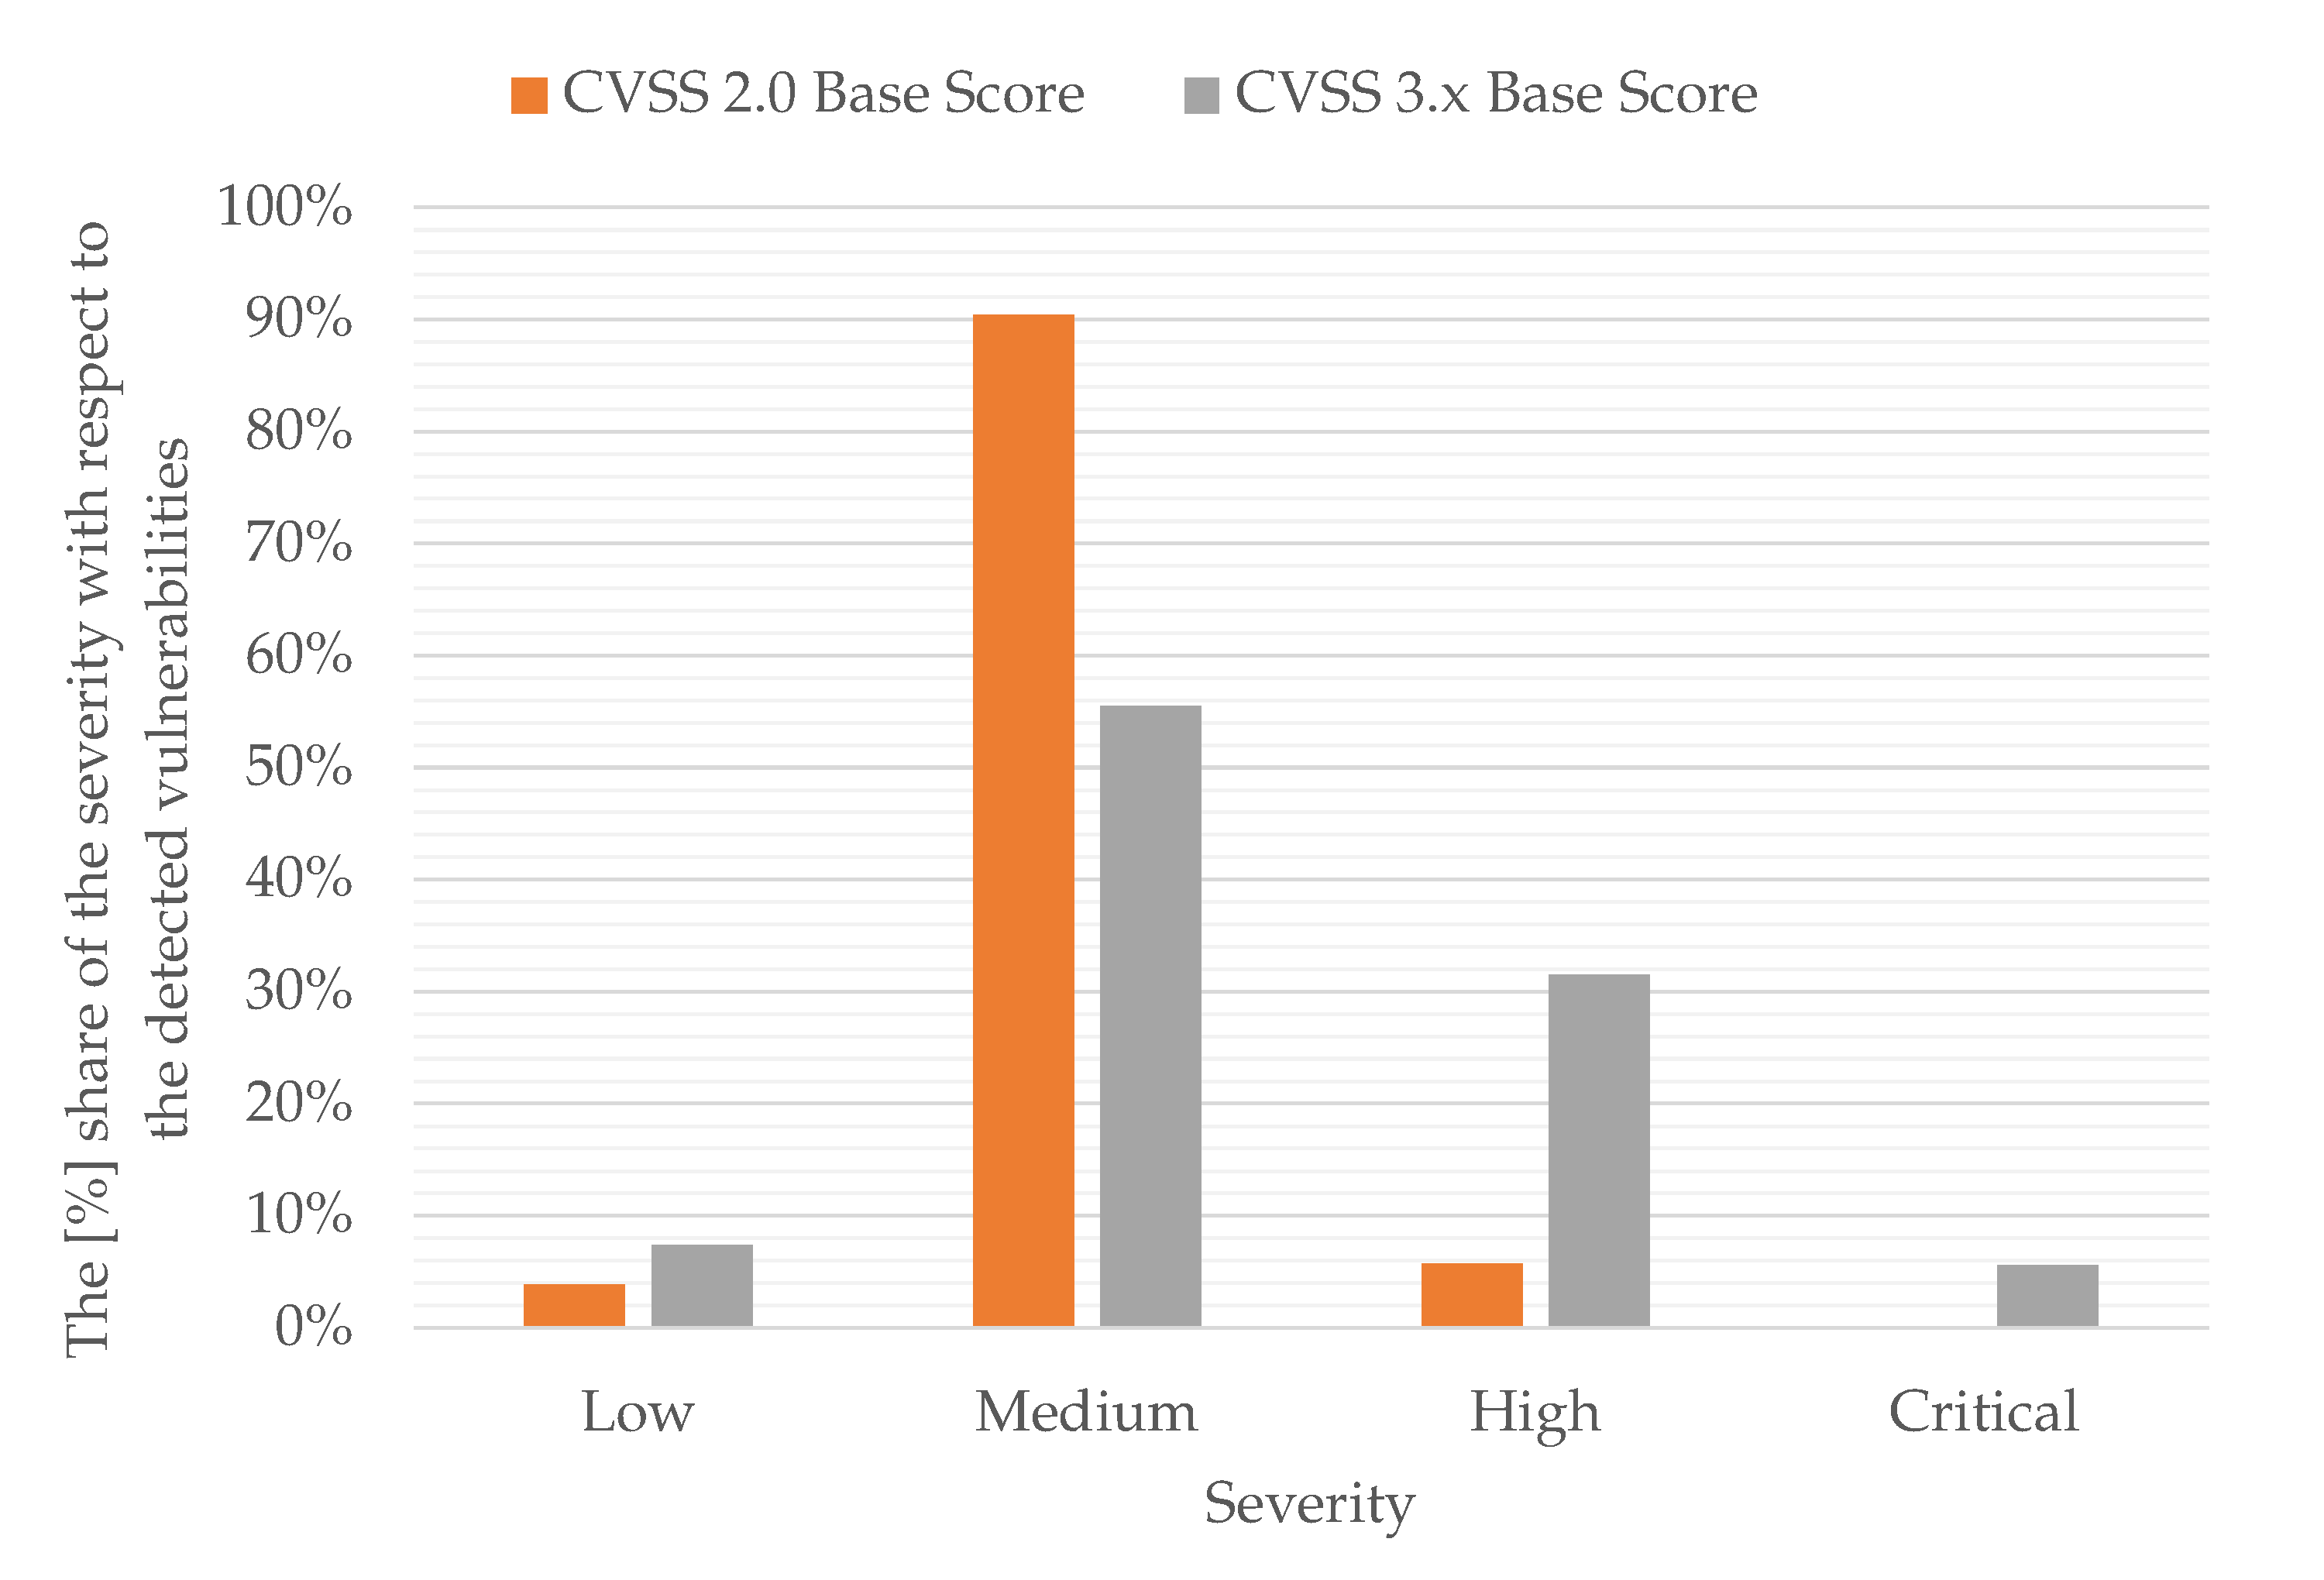
In environment A, there were 23 servers, which were responsible for providing services such as www for the internal requirements of the company. These servers contained 36 vulnerabilities that were detected by the Nessus scanner. Additionally, the scanner reported 322 vulnerabilities of the info type. The scan was performed with no authorization, i.e., there was no logging into the scanned assets. Table 1 shows the number of operating systems recognized in environment A as detected by the Nessus scanner, which was able to detect only 13 operating systems. Figure 4 presents a vulnerability severity histogram according to CVSS 2.0 and 3.x after detection with the Nessus scanner. Table 2 shows the number of vulnerabilities detected by the Nessus scanner, and both standards are distinguished. The difference between the numbers indicated by the Nessus report and the numbers of vulnerabilities calculated according to the base score stems from the fact that Nessus groups some CVEs into one category. For example, the reported vulnerability “134944-PHP 7.3.x < 7.3.16 Multiple Vulnerabilities” had three CVEs assigned—namely, CVE-2020-7064, CVE-2020-7065, and CVE-2020-7066. The difference between the numbers of base CVSS 2.0 and base CVSS 3.x vulnerabilities was due to the lack of both assessments for some vulnerabilities [37,38,39]. Finally, it is noted that the scan was performed on 2 November 2021 and lasted 3 h.
Considering the information received from the administrators, the developed assets contained the CIA flag configurations with the distribution shown in Table 3. Low, medium, and high CIA flags were set for only five resources, which corresponded to 21.74% of all resources in the tested environment. Thus, the CIA flag was “Not Defined” for 78.26% of the resources in environment A. The availability requirement flag was high for three network elements and medium for two network elements, corresponding, respectively, to 13.04% and 8.7%, while the integrity requirement flag was high for one network element and medium for one network element, which corresponded to 4.35%.
5.2. Description of Environment B
Environment B had 36 servers with various unspecified services available to users. All hosts were available on the internet, and this fact explains, among other things, the detection of a Virtual Private Network (VPN) server. Environment B did not have defined values for the CIA triad; therefore, the algorithm implemented for all values was “Not Defined” [13]. The lack of CIA settings did not allow the assets to be indicated as critical for this environment.
For environment B, the Nessus scanner detected 85 vulnerabilities and 615 vulnerabilities of the info type. The scan was performed with no authorization. Table 4 shows the number of recognized operating systems in environment B detected by the Nessus scanner, which was able to detect only 16 operating systems. Figure 5 indicates a histogram of the vulnerability severity according to the Nessus Scanner with the CVSS 2.0 and 3.x scores. Table 5 demonstrates the number of vulnerabilities detected by the Nessus scanner, and both standards are distinguished. As in the case of environment A, a difference between the numbers indicated by the Nessus report and the numbers of vulnerabilities according to the base scores was a result of grouping the CVEs into one category. On the other hand, the difference in the numbers from the base CVSS 2.0 and base CVSS 3.x scores was due to the lack of vulnerability assessments for both standards in some cases. This scan was performed from 4 May 2021 to 5 May 2021 and lasted 19 h.
5.3. Description of Environment C
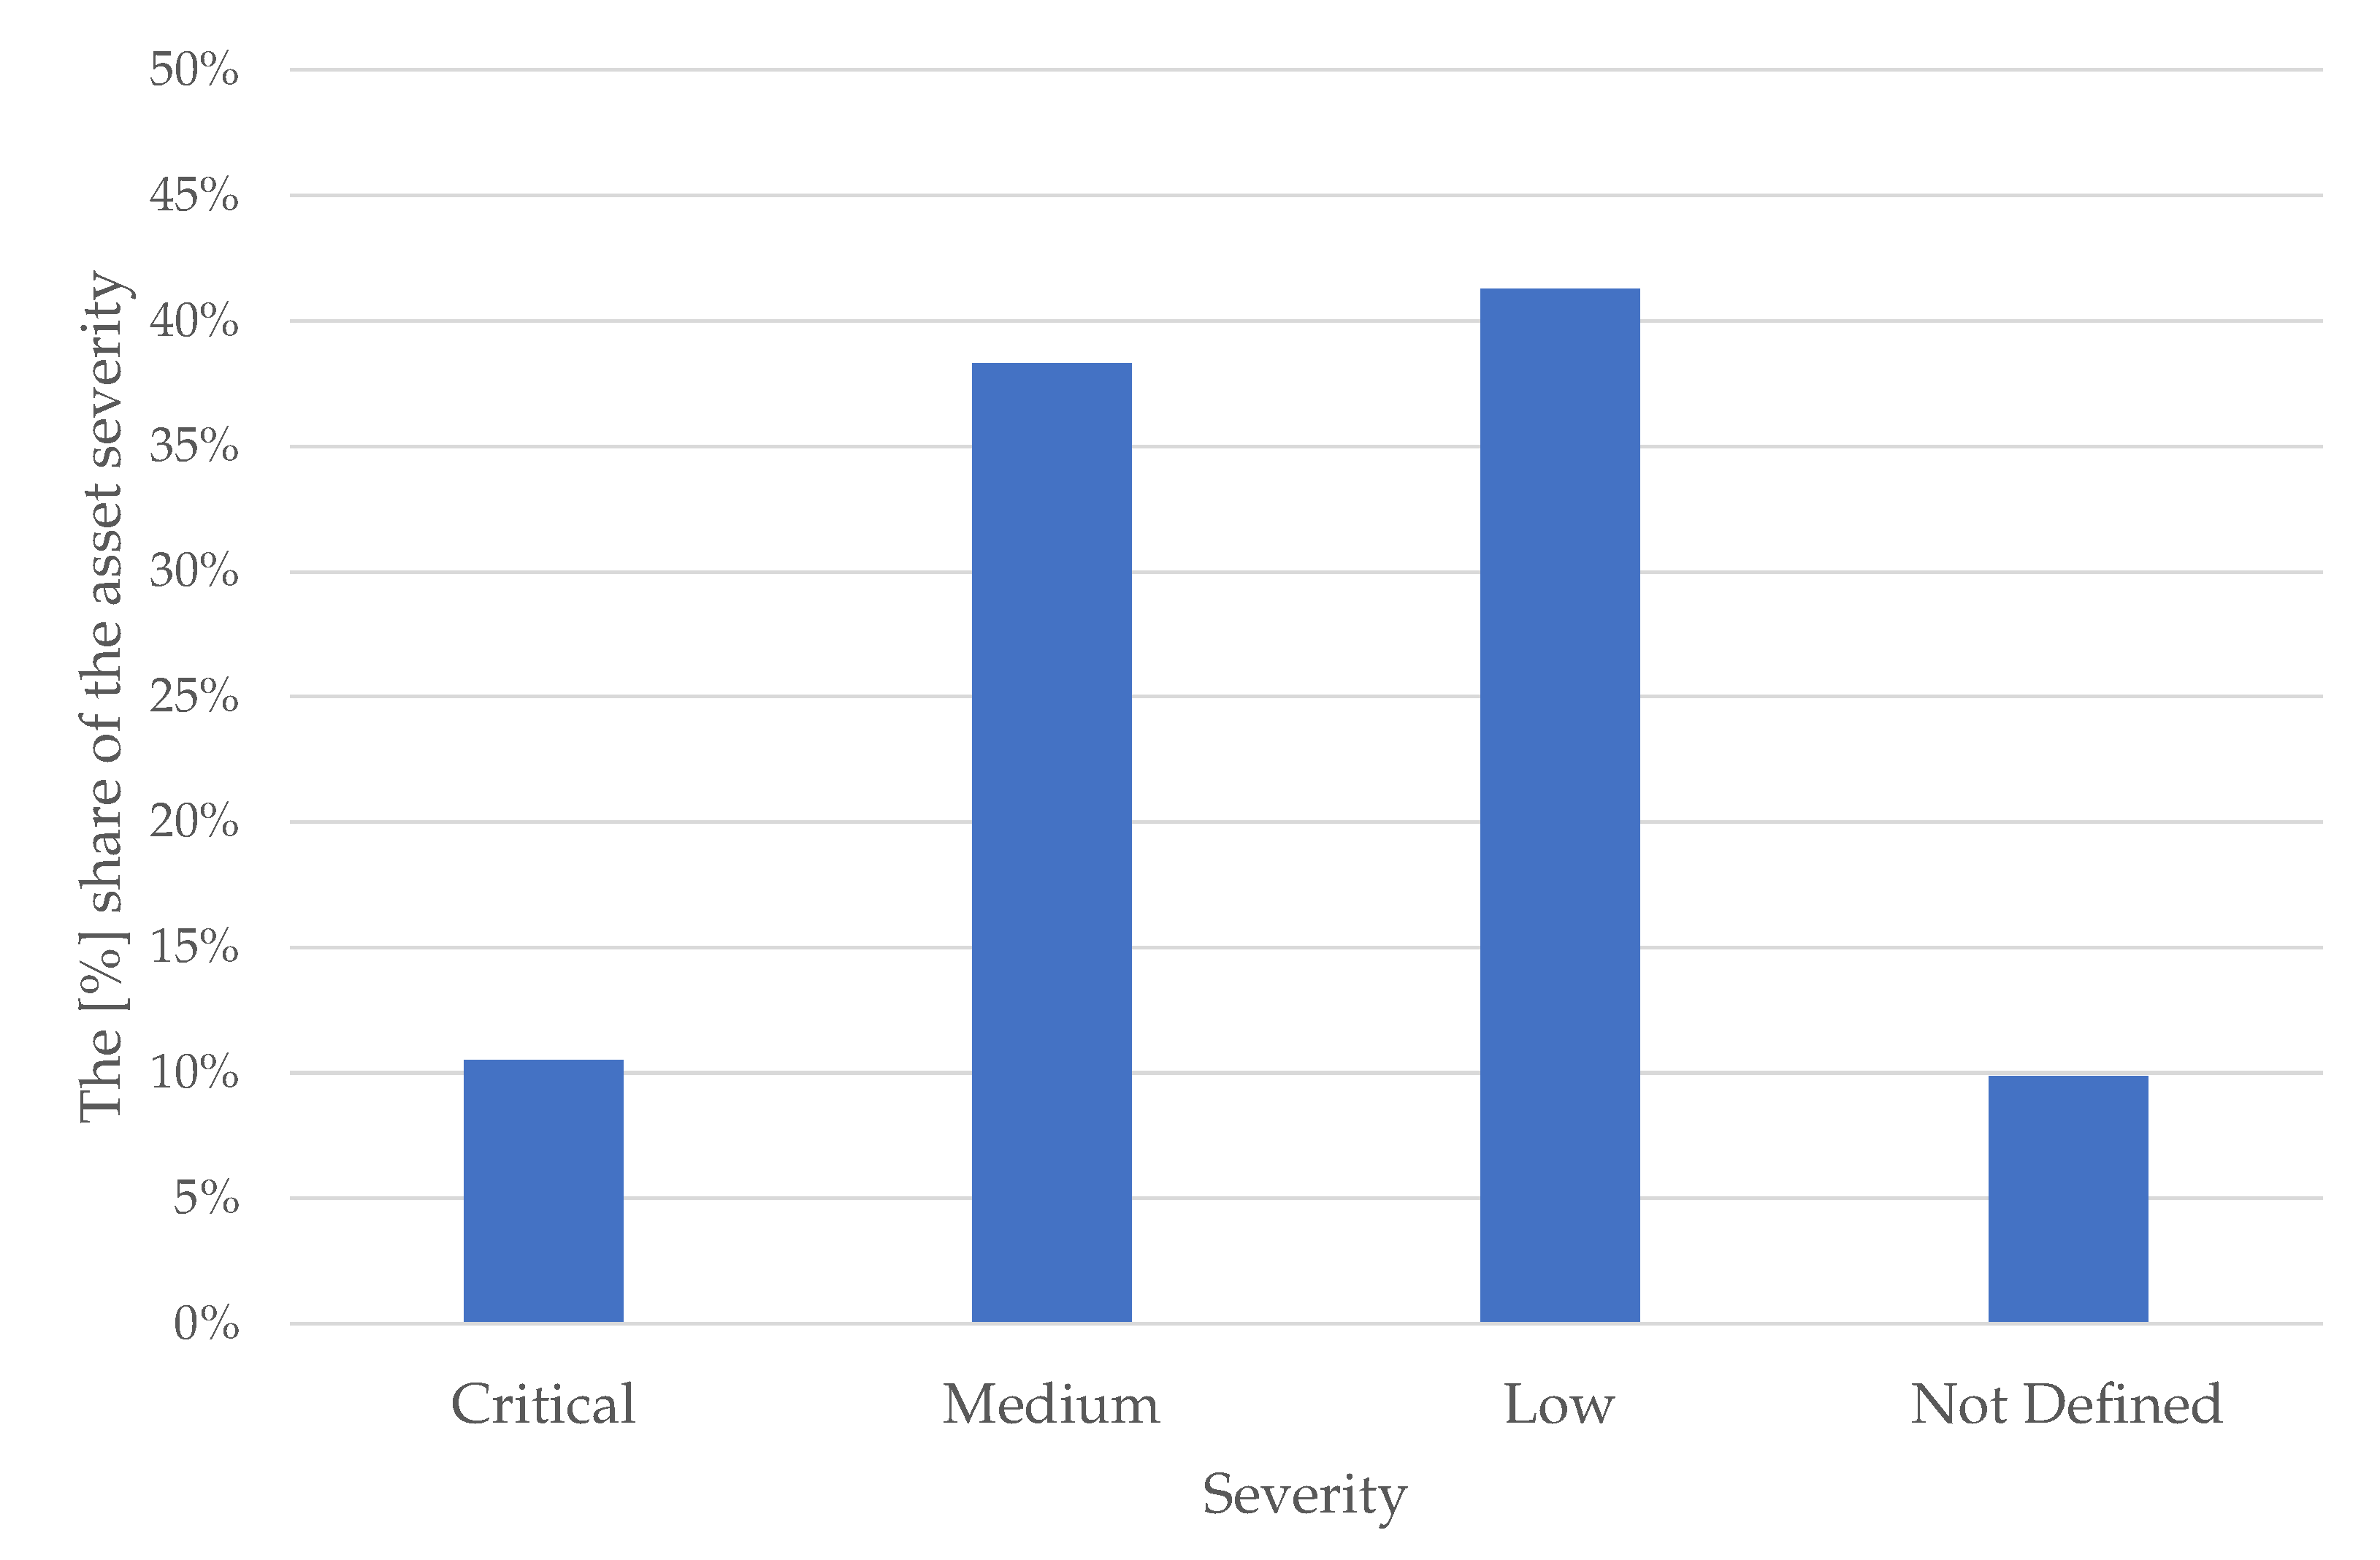
In environment C, 2062 network devices were available, constituting the entire internal infrastructure of one of the partner companies; the Nessus scanner detected 2949 vulnerabilities. Additionally, the scanner reported 16,640 vulnerabilities of the info type. The scan was partially performed with authorization, i.e., the scanner was able to log into 41 hosts. Table 6 shows the number of recognized operating systems in environment C detected by the Nessus scanner, which was able to detect only 84 operating systems. Figure 6 indicates a histogram of the vulnerability severity according to CVSS 2.0 and 3.x. Table 7 shows the number of vulnerabilities detected by the Nessus scanner, distinguishing between both standards. The environment had 217 assets that were defined as “critical”. Thus, for further discussion, all CIA flag values were analogously set to high. The exact distribution of the asset weight severity is shown in Figure 7. Severe weights were set for network devices that participated in infrastructure maintenance, e.g., domain controllers.
Like in the other environments, the difference between the numbers indicated by the Nessus report and the number vulnerabilities according to the base score was a result of grouping CVEs into one category, while the difference in the quantities from the base CVSS 2.0 and CVSS 3.x scores was due to the lack of vulnerability assessments for both standards. The scan was performed from 26 April 2021 to 27 April 2021 and lasted 23 h.
5.4. A Research Environment for Measuring the Impact of Re-Prioritization
Since the companies that accessed the vulnerability scanning data did not agree to process data in an external infrastructure (in the cloud), in order to conduct research on the prioritization of vulnerabilities in the context of an environmental assessment, the software was launched on a 2018 MacBook Pro computer with a 2.6 GHz Intel Core i7 processor with 32 GB 2400 MHz DDR4 while using Docker technologies [48] in the following configuration:
- Processing module—VMC,
- Task monitor—VMC,
- Admin Panel—VMC,
- Collector—VMC,
- PostgreSQL database [49]—VMC configuration storage,
- MariaDB database [50]—CMDB information storage,
- Ralph [51]—CMDB administration panel,
- Rabbitmq [52]—a queuing system used for communication between VMC modules,
- Redis database [53]—in-memory used to store partial calculations and synchronization of VMC modules,
- Elasticsearch [45]—a text database that stores information regarding all vulnerabilities,
- Kibana [46]—a graphical interface that enables one to easily search for results and create metrics.
6. Results
In this section, the results obtained for all three testing environments and all four models are discussed.
6.1. Analysis of the Results for Environment A
Figure 8 shows a comparison between base CVSS 2.0 and CVSS 2.0 environmental scores for all vulnerabilities detected for environment A. According to this histogram, after the calculation of the environmental score, all vulnerabilities were assigned to the “Low” category. This is due to the large variety of detected vulnerabilities, which resulted in a low value of the TD factor (Figure 9). The environment contained five assets that were defined as “Medium-High” (MH) from the point of view of the CDP [41]. A “High” value was assigned to at least one of the CIA flags (Table 8), and the remaining assets are labeled as “Low” (L) and “Low–Medium” (LM).
In the case of the CVSS 3.x environmental assessment (Figure 10), a significant change with respect to the base CVSS 3.x score was observed. There was an increase in the number of critical vulnerabilities and a reduction in the number of vulnerabilities with high scores as a result of the CIA settings. The CVSS 3.x environmental assessment pointed out 10 critical vulnerabilities, i.e., four critical vulnerabilities more than the base score.
Figure 11 shows the impacts of the CIA, TD, and CDP environmental factors on the base CVSS 2.0 and CVSS 3.x scores calculated according to formulae 5. For CVSS 2.0, the CIA, CDP, and TD environmental factors caused all of the base scores to decrease, and the range of the changes was from −6.9 to −1.1 (Figure 11). For CVSS 3.x, the CIA environmental factor resulted in changes in the base assessment ranging from −1.8 to 1.9 (Figure 11), and these concerned 14 detected vulnerabilities.
Table 9 lists the vulnerabilities with critical and high scores according to the CVSS 3.x environmental score. Almost all of the critical vulnerabilities were related to an old version of PHP software. Furthermore, the table indicates the differences in the vulnerability markings with prefixes such as CVE and Nessus. This is due to the fact that not all of the vulnerabilities detected by the Nessus scanner had a publicly known identifier. In such cases, the VMC software used the prefix Nessus as the identifier of the detected vulnerability, which corresponded to the name of the scanning software. As a result, the vulnerability and the plugin identifier (plugin id) responsible for the request were detected.
In order to compare the changes in vulnerability prioritization, Table 10 lists the vulnerabilities obtained from the Nessus scanner with critical and high scores according to the base CVSS 3.x score. The white color in Table 10 indicates the vulnerabilities with no changes in the assessment, and yellow indicates the vulnerabilities for which the environmental assessment resulted in an increased rating. Red corresponds to a vulnerability for which the rating was changed from medium to critical, while green denotes vulnerabilities that, after the environmental assessment, had reduced ratings. The most significant changes in the vulnerability assessment were determined to be in asset because the asset weight for the organization was marked as .
Table 11 and Table 12 show the results obtained for the number of work hours required to eliminate vulnerabilities with critical, high, and medium ratings for environment A, which were calculated according to Formulae (1) and (2) for the base scores and according to Formulae (3) and (4) for the environmental scores. Because the re-prioritization process lasted less than a minute, it had a minor impact on the overall duration of the process.
When analyzing the results obtained for environment A, the estimated work hours for CVSS 2.0 (, , and ) were reduced to the scanning time () only, thereby showing a profit of over 93%. For CVSS 3.x, the number of estimated work hours decreased proportionally by approximately 7% for each investigated case.
6.2. Analysis of the Results for Environment B
Figure 12 shows a comparison between the base CVSS 2.0 scores and the CVSS 2.0 environmental scores for environment B. According to these results, 18 vulnerabilities were classified in the medium category after the calculation of the environmental score. Taking the analyzed case into account, this was due to the presence of the same vulnerability in a larger number of assets. All vulnerabilities mentioned in the report concerned the use of the unsupported TLS 1.0 protocol, weak encryption methods, and self-signed certificates. The indicated vulnerabilities were identified in nine scanned assets, which made up 25% of the tested environment (Figure 13).
Despite the lack of the CIA value in environment B, an administrator should consider the indicated vulnerabilities, since these vulnerabilities can be exploited by an attacker and may potentially cause significant damage to the analyzed infrastructure. An adversary may try to attack users by using the man-in-the-middle technique [54] in order to intercept critical data, such as login credentials or personal data. Consequently, the environment’s integrity may be disrupted or the organization may be exposed to potentially large financial damages.
Since the administrator did not have the CIA requirements for environment B, the VMC software had default values (Not Defined) for all CIA flags; thus, the severities for CVSS 3.x remained unchanged (Figure 14). As a result, the histograms (Figure 10 and Figure 14) highlight the significance of the inventory database that was developed, thus determining the severity of the resources with respect to the business while considering the vulnerability management process. The aim was to repair all vulnerabilities that were critical for the monitored infrastructure.
Figure 15 shows the numbers of changes in the CVSS 2.0 and CVSS 3.x scores in the vulnerability assessment when using the environmental assessment. For CVSS 3.x, the results indicate that there were no changes, which was in accordance with the previous results. For CVSS 2.0, an adjustment was made in all of the vulnerabilities after the assessment, and this ranged from −7.5 to −1.2.
Table 13 and Table 14 show the results obtained for the work hours required in order to eliminate vulnerabilities with critical, high, and medium ratings in environment B; these were calculated according to Formulae (1) and (2) for the base scores and according to Formulae (3) and (4) for the environmental scores. As in environment A, the re-prioritization process lasted less than a minute and had a minor impact on the overall duration of the process.
Comparing the results of the ranges of work hours estimated when using the CVSS 2.0 score in environment B, one may observe that these numbers did not decrease with the scanning time (), as in environment A. This is due to the fact that the CVSS 2.0 environmental score indicated the vulnerabilities with the medium classification, which occurred identically in 25% of the monitored assets. Ultimately, the profit in the decrease in work hours when using the CVSS 2.0 environmental score was approximately equal to 69% for the minimum number of work hours (). In the case of the average number of work hours (), the profit was equal to 78%, and for the maximum (), the profit was greater than 80%. Due to the lack of CIA flags, the range of the work hours remained unchanged for the CVSS 3.x environmental score.
6.3. Analysis of the Results for Environment C
Figure 16 shows the comparison between base CVSS 2.0 scores and the CVSS 2.0 environmental scores for all of the vulnerabilities detected in environment C. According to this histogram, after the calculation of the environmental score, all vulnerabilities were assigned to the low category, meaning that none of the detected vulnerabilities were repeated in a minimum of 25% of the tested assets (Figure 17).
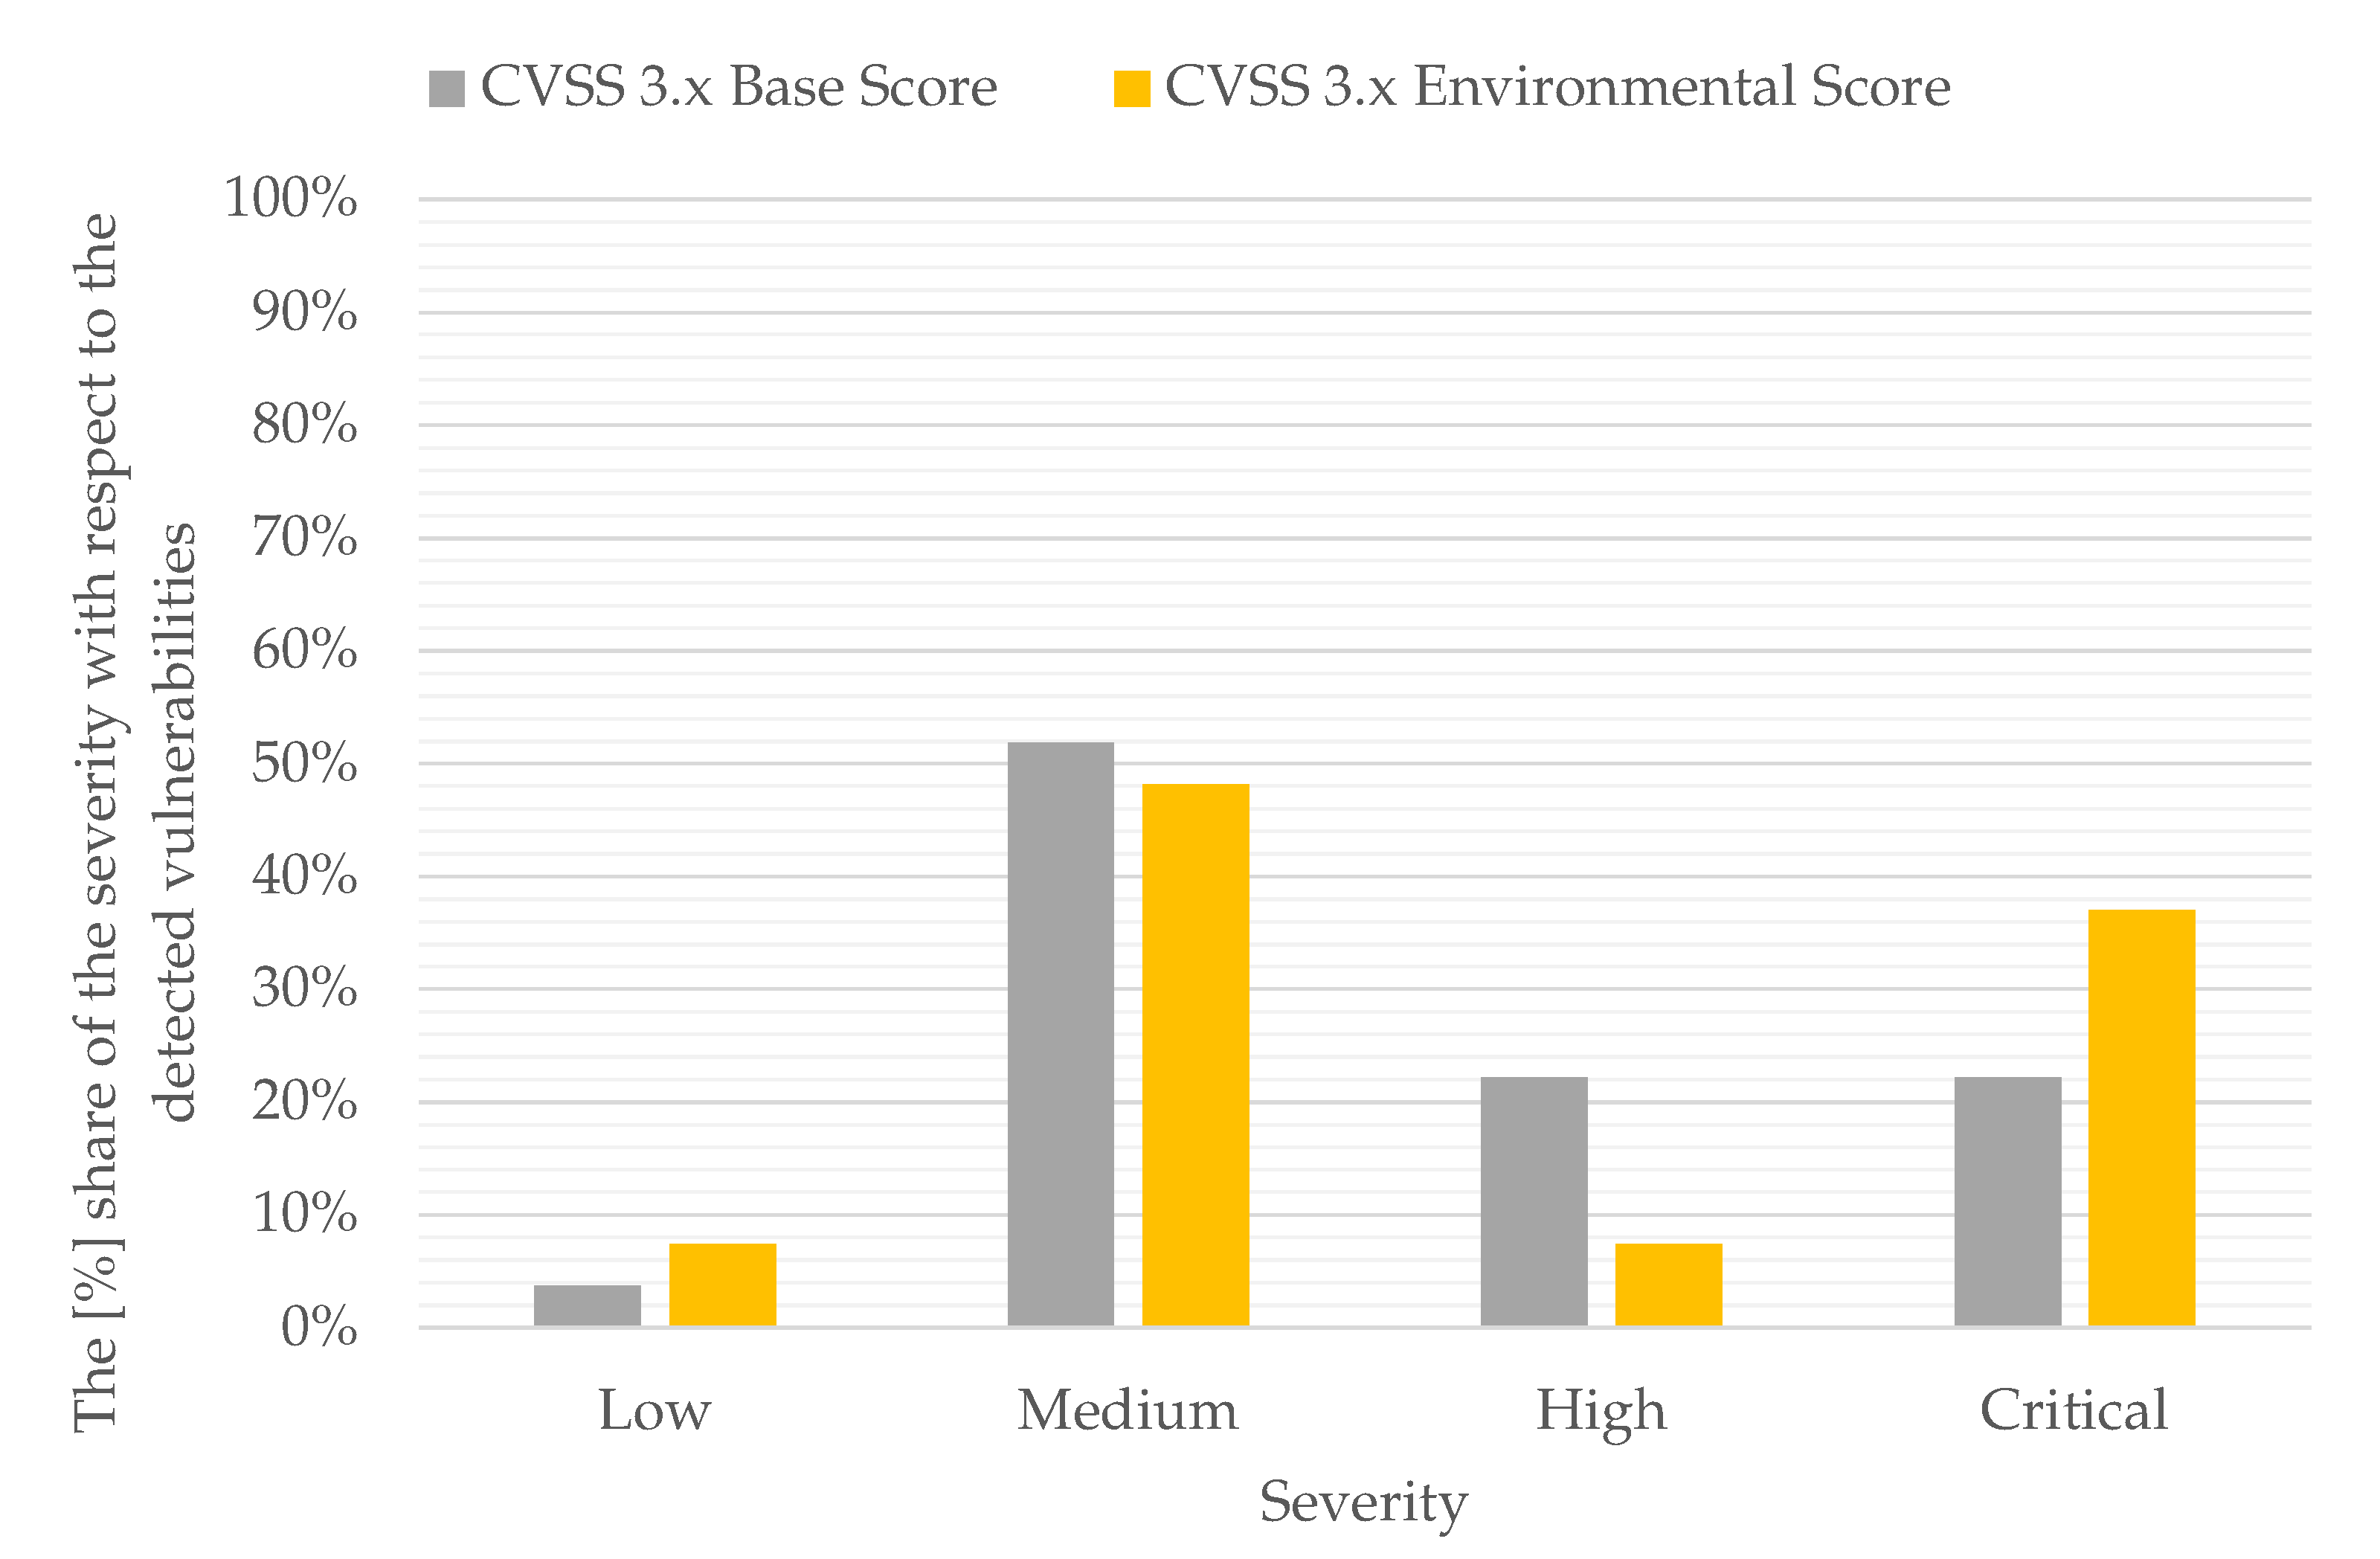
In the case of the CVSS 3.x environmental assessment (Figure 18), a slight change with respect to the base CVSS 3.x score was observed. There was a decrease in the number of high and critical vulnerabilities. Table 15 demonstrates a precise change that describes the number of prioritization changes more effectively.
Table 16 and Table 17 show the results obtained for the number of work hours required in order to eliminate vulnerabilities with critical, high, and medium ratings in environment C; these were calculated according to Formulae (1) and (2) for the base scores and according to Formulae (3) and (4) for the environmental scores. As in environments A and B, the re-prioritization process lasted less a minute and had a minor impact on the overall duration of the process.
Analyzing the results obtained for environment C, it can be seen that, for the CVSS 2.0 environmental score, the estimated number of work hours decreased with the scanning time (). As in environment A, no vulnerabilities that existed identically on a large number of monitored assets were detected in environment C. Considering the CVSS 3.x environmental score, the total range of the estimated work hours was reduced by approximately 17%.
6.4. Summary of the Obtained Results
The results obtained here show the possibility of using vulnerability management models that consider environmental factors (Figure 2) while using the VMC software developed in this paper. In the first phase of the experiment, for each investigated environment (environments A, B, and C), the use of the CVSS 2.0 environmental assessment was discussed. This discussion provided useful insights into the vulnerability management process with respect to vulnerabilities that affect a large numbers of resources. In the second phase of the experiment, for each environment, the use of the CVSS 3.x environmental assessment was discussed; despite receiving CIA flags only for 23% of the monitored infrastructure resources in environment A, this assessment changed the base CVSS 3.x scores for 51.85% of the detected vulnerabilities. Consequently, the criticality category changed for 37% of the detected vulnerabilities. The changes in the criticality categories when using the CVSS 3.x environmental assessment for environment A caused a reduction in the estimated work hours by 7%. For environment B, the administrator did not provide the CIA values; therefore, the CVSS 3.x environmental assessment did not show any changes in prioritization. This fact confirms the importance of information from an inventory database in the determination of the triad of confidentiality, integrity, and availability according to an organization’s business requirements. For environment C, the administrator had only general information on the resources, which resulted in changes in the criticality categories in about 20% of the detected vulnerabilities. This translated into a reduction of the work hours required for environment C by more than 17%.
7. Conclusions
The paper presents a fully automatic platform that supports the vulnerability management process. The results obtained here show the advantages of the inclusion of a module that collects information about assets, which allows the calculation of the CVSS environmental scores. This enables the detection of the vulnerabilities for which the scoring has been either undervalued or overvalued by the base CVSS score [20]. This leads to changes in the vulnerability prioritization sequence and in the ranges of the estimated work hours required to improve the ICT infrastructure’s overall security. For all of the environments, the CVSS 2.0 environmental score allowed the detection of a vulnerability that affected a significant number of resources. The inclusion of the CVSS 3.x environmental score for environment A allowed for a 7% reduction in the number of work hours. For environment B, the CVSS 3.x environmental score resulted in no changes, as the administrator did not provide information on the values of the CIA flags. For environment C, the inclusion of the CVSS 3.x environmental score resulted in a reduction of the work hours by more than 17%.
Compared with the solutions presented in the literature [31,32,33,36], the VMC software package developed in this paper takes into consideration the value of assets and is capable of handling increasing amounts of data in a cloud computing environment due its implementation of container technology. Therefore, the VMC is suitable for every network infrastructure. Additionally, unlike in the present work, none of the solutions proposed so far [27,28,29,30,31,32,33,36] have offered simultaneous prioritization for CVSS 2.0 and CVSS 3.1.
Future work will focus on the development of machine learning algorithms that can predict each CVSS 3.1 vector component that is derived from public CVE databases. This issue is very important because not all vulnerabilities have been evaluated with the CVSS 3.1 metric, and most of the available scores are based only on the CVSS 2.0 metric [38,39]. However, the prediction of the vector components of CVSS 3.1 allows the calculation of the environmental score for all vulnerabilities found with scanning software. This may further reduce time to vulnerability remediation and the total vulnerability exposure and could facilitate network administration by bringing focus to genuine deficiencies present within the analyzed network infrastructure.
Author Contributions
Conceptualization, M.W.; methodology, M.W.; software, M.W.; validation, J.O. and S.S.; formal analysis, M.W.; investigation, M.W.; resources, M.W.; data curation, J.O. writing—original draft preparation, M.W.; writing—review and editing, S.S.; visualization, M.W.; supervision, S.S.; project administration, J.O. All authors have read and agreed to the published version of the manuscript.
Funding
Wrocław University for Science and Technology.
Institutional Review Board Statement
Not applicable.
Informed Consent Statement
Not applicable.
Data Availability Statement
Not applicable.
Acknowledgments
The authors wish to thank Wroclaw University of Science and Technology (statutory activity) for the financial support and Agata Szewczyk for the proofreading and translation. This publication was created as a part of the Regional Security Operations Center (RegSOC) project (Regionalne Centrum Bezpieczeństwa Cybernetycznego), cofinanced by the National Center for Research and Development as part of the CyberSecIdent-Cybersecurity and e-Identity program.
Conflicts of Interest
The authors declare no conflict of interest.
Abbreviations
The following abbreviations are used in this manuscript:
| AM | Asset Management |
| CDP | Collateral Damage Potential |
| CIA | Confidentiality, Integrity, and Accessibility |
| CIS | Center for Internet Security |
| CMS | Continuous Monitoring Systems |
| CVE | Common Vulnerabilities and Exposures |
| CVSS | Common Vulnerability Scoring System |
| ID | Identifier |
| ICT | Information and Communications Technology |
| IT | Information Technology |
| NVD | National Vulnerabilities Database |
| TD | Target Distribution |
| TVE | Total Vulnerability Exposure |
| TVR | Time to Vulnerability Remediation |
| VEST | Vulnerability Exploit Scoring and Timing |
| VM | Vulnerability Management |
| VMC | Vulnerability Management Center |
| VPN | Virtual Private Network |
| VPR | Vulnerability Priority Rating |
References
- Lab, S.R. Vulnerability and Threat Trends; Technical Report 2021. 2021. Available online: https://lp.skyboxsecurity.com/rs/440-MPQ-510/images/Skybox-Security-vulnerability-and-threat-trends-report-2021.pdf (accessed on 10 June 2021).
- Harirchian, E.; Jadhav, K.; Kumari, V.; Lahmer, T. ML-EHSAPP: A prototype for machine learning-based earthquake hazard safety assessment of structures by using a smartphone app. Eur. J. Environ. Civ. Eng. 2021, 1–21. [Google Scholar] [CrossRef]
- Harirchian, E.; Jadhav, K.; Mohammad, K.; Aghakouchaki Hosseini, S.E.; Lahmer, T. A comparative study of MCDM methods integrated with rapid visual seismic vulnerability assessment of existing RC structures. Appl. Sci. 2020, 10, 6411. [Google Scholar] [CrossRef]
- Harirchian, E.; Kumari, V.; Jadhav, K.; Rasulzade, S.; Lahmer, T.; Raj Das, R. A Synthesized Study Based on Machine Learning Approaches for Rapid Classifying Earthquake Damage Grades to RC Buildings. Appl. Sci. 2021, 11, 7540. [Google Scholar] [CrossRef]
- Biggs, E.N.; Maloney, P.M.; Rung, A.L.; Peters, E.S.; Robinson, W.T. The relationship between social vulnerability and COVID-19 incidence among louisiana census tracts. Front. Public Health 2021, 8, 1048. [Google Scholar] [CrossRef] [PubMed]
- Lau, P.; Wang, L.; Liu, Z.; Wei, W.; Ten, C.W. A Coalitional Cyber-Insurance Design Considering Power System Reliability and Cyber Vulnerability. IEEE Trans. Power Syst. 2021. [Google Scholar] [CrossRef]
- Rochford, O.T. Threat-Centric Vulnerability Remediation Prioritization. J. Abbr. 2008, 10, 142–149. [Google Scholar]
- Nyanchama, M. Enterprise Vulnerability Management and Its Role in Information Security Management. Inf. Secur. J. A Glob. Perspect. 2005, 14, 29–56. [Google Scholar] [CrossRef]
- Walkowski, M.; Krakowiak, M.; Oko, J.; Sujecki, S. Efficient algorithm for providing live vulnerability assessment in corporate network environment. Appl. Sci. 2020, 10, 7926. [Google Scholar] [CrossRef]
- Gartner. A Guidance Framework for Developing and Implementing Vulnerability Management. 2020. Available online: https://www.gartner.com/en/documents/3747620 (accessed on 17 June 2021).
- Haldar, K.; Mishra, B.K. Mathematical model on vulnerability characterization and its impact on network epidemics. Int. J. Syst. Assur. Eng. Manag. 2017, 8, 378–392. [Google Scholar] [CrossRef]
- DSecure.me. VMC: Vulnerability Management Center. 2021. Available online: https://github.com/DSecureMe/vmc (accessed on 10 June 2021).
- FIRST. Common Vulnerability Scoring System: Specification Document. Available online: http://www.first.org/cvss (accessed on 17 June 2021).
- Beale, J.; Meer, H.; van der Walt, C.; Deraison, R. Nessus Network Auditing: Jay Beale Open Source Security Series; Elsevier: Rockland, MA, USA, 2004. [Google Scholar]
- Al Fikri, M.; Putra, F.A.; Suryanto, Y.; Ramli, K. Risk assessment using NIST SP 800-30 revision 1 and ISO 27005 combination technique in profit-based organization: Case study of ZZZ information system application in ABC agency. Procedia Comput. Sci. 2019, 161, 1206–1215. [Google Scholar] [CrossRef]
- NVD. cve-2017-0143. Available online: https://nvd.nist.gov/vuln/detail/cve-2017-0143 (accessed on 17 June 2021).
- Mohurle, S.; Patil, M. A brief study of wannacry threat: Ransomware attack 2017. Int. J. Adv. Res. Comput. Sci. 2017, 8, 1938–1940. [Google Scholar]
- Chen, Q.; Bridges, R.A. Automated behavioral analysis of malware: A case study of wannacry ransomware. In Proceedings of the 2017 16th IEEE International Conference on Machine Learning and Applications (ICMLA), Cancun, Mexico, 18–21 December 2017; pp. 454–460. [Google Scholar]
- Walkowski, M.; Biskup, M.; Szewczyk, A.; Oko, J.; Sujecki, S. Container Based Analysis Tool for Vulnerability Prioritization in Cyber Security Systems. In Proceedings of the 2019 21st International Conference on Transparent Optical Networks (ICTON), Angers, France, 9–13 July 2019; pp. 1–4. [Google Scholar]
- Fruhwirth, C.; Mannisto, T. Improving CVSS-based vulnerability prioritization and response with context information. In Proceedings of the 2009 3rd International Symposium on Empirical Software Engineering and Measurement, Lake Buena Vista, FL, USA, 15–16 October 2009; pp. 535–544. [Google Scholar]
- Ali, A.; Zavarsky, P.; Lindskog, D.; Ruhl, R. A software application to analyze the effects of temporal and environmental metrics on overall CVSS v2 score. In Proceedings of the 2011 World Congress on Internet Security (WorldCIS-2011), London, UK, 21–23 February 2011; pp. 109–113. [Google Scholar]
- Chen, Y.; Boehm, B. Stakeholder value driven threat modeling for off the shelf based systems. In Proceedings of the 29th International Conference on Software Engineering (ICSE’07 Companion), Minneapolis, MN, USA, 20–26 May 2007; pp. 91–92. [Google Scholar]
- Eschelbeck, G. The Laws of Vulnerabilities: Which security vulnerabilities really matter? Inf. Secur. Tech. Rep. 2005, 10, 213–219. [Google Scholar] [CrossRef]
- Lai, Y.P.; Hsia, P.L. Using the vulnerability information of computer systems to improve the network security. Comput. Commun. 2007, 30, 2032–2047. [Google Scholar] [CrossRef]
- Rieke, R. Modelling and analysing network security policies in a given vulnerability setting. In International Workshop on Critical Information Infrastructures Security; Springer: Berlin/Heidelberg, Germany, 2006; pp. 67–78. [Google Scholar]
- Research, G. Gartner Peer Insights ‘Voice of the Customer’: Vulnerability Assessment. 2020. Available online: https://www.gartner.com/doc/reprints?id=1-1Z87ZU8K&ct=200611&st=sb (accessed on 17 June 2021).
- F-Secure. Vulnerability Management Tool. 2021. Available online: https://www.f-secure.com/us-en/business/solutions/vulnerability-management/radar (accessed on 10 June 2021).
- Qualys. Vulnerability Management Tool. 2021. Available online: https://www.qualys.com/apps/vulnerability-management/ (accessed on 10 June 2021).
- Rapid7. Vulnerability Management Tool. 2021. Available online: https://www.rapid7.com/products/nexpose/ (accessed on 10 June 2021).
- Tenable. Vulnerability Management Tool. 2021. Available online: https://www.tenable.com/products/tenable-io (accessed on 10 June 2021).
- Yadav, G.; Paul, K. PatchRank: Ordering updates for SCADA systems. In Proceedings of the 2019 24th IEEE International Conference on Emerging Technologies and Factory Automation (ETFA), Zaragoza, Spain, 10–13 September 2019; pp. 110–117. [Google Scholar]
- Miura-Ko, R.A.; Bambos, N. SecureRank: A risk-based vulnerability management scheme for computing infrastructures. In Proceedings of the 2007 IEEE International Conference on Communications, Glasgow, UK, 24–28 June 2007; pp. 1455–1460. [Google Scholar]
- Farris, K.A.; Shah, A.; Cybenko, G.; Ganesan, R.; Jajodia, S. Vulcon: A system for vulnerability prioritization, mitigation, and management. ACM Trans. Priv. Secur. (TOPS) 2018, 21, 1–28. [Google Scholar] [CrossRef] [Green Version]
- Weintraub, E. Security Risk Scoring Incorporating Computers’ Environment. (IJACSA) Int. J. Adv. Comput. Sci. Appl. 2016, 7, 183–189. [Google Scholar] [CrossRef] [Green Version]
- Ahmadi Mehri, V.; Arlos, P.; Casalicchio, E. Normalization Framework for Vulnerability Risk Management in Cloud. In Proceedings of the IEEE International Conference on Future Internet of Things and Cloud (FiCloud), Rome, Italy, 24–26 August 2021. [Google Scholar]
- Chen, H.; Liu, J.; Liu, R.; Park, N.; Subrahmanian, V. VEST: A System for Vulnerability Exploit Scoring & Timing. In Proceedings of the Twenty-Eighth International Joint Conference on Artificial Intelligence IJCAI-19, Macao, China, 10–16 August 2019; pp. 6503–6505. [Google Scholar]
- Fall, D.; Kadobayashi, Y. The Common Vulnerability Scoring System vs. Rock Star Vulnerabilities: Why the Discrepancy? In Proceedings of the 5th International Conference on Information Systems Security and Privacy (ICISSP 2019), Prague, Czech Republic, 23–25 February 2019; pp. 405–411. [Google Scholar]
- Nowak, M.; Walkowski, M.; Sujecki, S. Machine Learning Algorithms for Conversion of CVSS Base Score from 2.0 to 3.x. In International Conference on Computational Science; Springer: Cham, Switzerland, 2021; pp. 255–269. [Google Scholar]
- Nowak, M.R.; Walkowski, M.; Sujecki, S. Conversion of CVSS Base Score from 2.0 to 3.1. In Proceedings of the 29th International Conference on Software, Telecommunications and Computer Networks (SoftCOM 2021), Havar, Croatia, 23–25 September 2021. [Google Scholar]
- For Internet Security, T.C. The CIS Security Metrics. 2010. Available online: https://www.itsecure.hu/library/image/CIS_Security_Metrics-Quick_Start_Guide_v1.0.0.pdf (accessed on 10 June 2021).
- Walkowski, M.; Oko, J.; Krakowiak, M.; Sujecki, S.; Jaroszewski, M. Automatic CVSS-based vulnerability prioritization and response with context information. In Proceedings of the 29th International Conference on Software, Telecommunications and Computer Networks (SoftCOM 2021), Havar, Croatia, 23–25 September 2021. [Google Scholar]
- Wang, S.; Xia, C.; Gao, J.; Jia, Q. Vulnerability evaluation based on CVSS and environmental information statistics. In Proceedings of the 2015 4th International Conference on Computer Science and Network Technology (ICCSNT), Harbin, China, 19–20 December 2015; Volume 1, pp. 1249–1252. [Google Scholar]
- Gallon, L. On the impact of environmental metrics on CVSS scores. In Proceedings of the 2010 IEEE Second International Conference on Social Computing, Minneapolis, MN, USA, 20–22 August 2010; pp. 987–992. [Google Scholar]
- Walkowski, M.; Oko, J.; Sujecki, S.; Kozdrowski, S. The impact of cyber security on the quality of service in optical networks. In Proceedings of the 10th International Conferences on Advanced Service Computing, Barcelona, Spain, 18–22 February 2018; pp. 53–56. [Google Scholar]
- Dixit, B. Elasticsearch Essentials; Packt Publishing Ltd.: Birmingham, UK, 2016. [Google Scholar]
- Gupta, Y. Kibana Essentials; Packt Publishing Ltd.: Birmingham, UK, 2015. [Google Scholar]
- Li, H.; Xi, R.; Zhao, L. Study on the distribution of CVSS environmental score. In Proceedings of the 2015 IEEE 5th International Conference on Electronics Information and Emergency Communication, Beijing, China, 14–16 May 2015; pp. 122–125. [Google Scholar]
- Anderson, C. Docker [software engineering]. IEEE Softw. 2015, 32, 102-c3. [Google Scholar] [CrossRef]
- PostgreSQL. 1996. Available online: http://www.PostgreSQL.org/about (accessed on 10 June 2021).
- Bartholomew, D. Mariadb vs. mysql. Dostopano 2012, 7, 2014. [Google Scholar]
- Allegro. Ralph 3-Asset Management. 2021. Available online: https://ralph-ng.readthedocs.io/en/stable/ (accessed on 10 June 2021).
- Johansson, L.; Dossot, D. RabbitMQ Essentials: Build Distributed and Scalable Applications with Message Queuing Using RabbitMQ; Packt Publishing Ltd.: Birmingham, UK, 2020. [Google Scholar]
- Chen, S.; Tang, X.; Wang, H.; Zhao, H.; Guo, M. Towards scalable and reliable in-memory storage system: A case study with Redis. In Proceedings of the 2016 IEEE Trustcom/BigDataSE/ISPA, Tianjin, China, 23–26 August 2016; pp. 1660–1667. [Google Scholar]
- Callegati, F.; Cerroni, W.; Ramilli, M. Man-in-the-Middle Attack to the HTTPS Protocol. IEEE Secur. Priv. 2009, 7, 78–81. [Google Scholar] [CrossRef]
Figure 1.
Model of the flow of information in the vulnerability management process with the base CVSS 2.0/3.x score.
Figure 1.
Model of the flow of information in the vulnerability management process with the base CVSS 2.0/3.x score.

Figure 2.
Model of the flow of information in the vulnerability management process with the CVSS 2.0 environmental score.
Figure 2.
Model of the flow of information in the vulnerability management process with the CVSS 2.0 environmental score.

Figure 3.
Simplified architecture of the newly developed VMC software.

Figure 4.
Vulnerability severity histogram divided into the base CVSS 2.0 and 3.x scores for environment A.
Figure 4.
Vulnerability severity histogram divided into the base CVSS 2.0 and 3.x scores for environment A.

Figure 5.
Vulnerability severity histogram divided into the base CVSS 2.0 and 3.x scores for environment B.
Figure 5.
Vulnerability severity histogram divided into the base CVSS 2.0 and 3.x scores for environment B.

Figure 6.
Vulnerability severity histogram divided into the base CVSS 2.0 and 3.x scores for environment C.
Figure 6.
Vulnerability severity histogram divided into the base CVSS 2.0 and 3.x scores for environment C.

Figure 7.
Asset criticality histogram for environment C.

Figure 8.
Comparing the severity of the vulnerabilities for CVSS 2.0 in environment A.

Figure 9.
Characteristics of the TD factor in environment A.

Figure 10.
Comparing the severity of the vulnerabilities for CVSS 3.x in environment A.

Figure 11.
Changes in the CVSS scores after the application of context information for environment A.
Figure 11.
Changes in the CVSS scores after the application of context information for environment A.

Figure 12.
Comparing the severity of the vulnerabilities for CVSS 2.0 in environment B.

Figure 13.
Characteristics of the TD factor in environment B.

Figure 14.
Comparing the severity of the vulnerabilities for CVSS 3.x in environment B.

Figure 15.
Changes in CVSS scores after the application of context information for environment B.

Figure 16.
Comparing the severity of the vulnerabilities for CVSS 2.0 in environment C.

Figure 17.
Characteristics of the TD factor in environment C.

Figure 18.
Comparing the severity of the vulnerabilities for CVSS 3.x in environment C.


Table 1.
Numbers and types of operating systems detected in environment A.
| No. | Operating System | Quantity |
|---|---|---|
| 1. | Other (the scanner was unable to recognize the system) | 10 |
| 2. | Linux Kernel 2.6 | 7 |
| 3. | CentOS Linux 7 Linux Kernel 3.10 | 3 |
| 4. | Linux Kernel 4.15 on Ubuntu 18.04 (bionic) | 2 |
| 5. | Darwin | 1 |
| In total | 23 |
Table 2.
Comparison of the number of vulnerabilities detected according to the selected standard for environment A.
Table 2.
Comparison of the number of vulnerabilities detected according to the selected standard for environment A.
| Base CVSS 2.0 Score | Base CVSS 3.x Score | |
|---|---|---|
| Number of Vulnerabilities | 41 | 27 |
Table 3.
The CIA flag distribution for environment A.
| Low | Medium | High | Not Defined | |
|---|---|---|---|---|
| Confidentiality | 13.04% | 4.35% | 4.35% | 78.26% |
| Integrity | 13.04% | 4.35% | 4.35% | 78.26% |
| Availability | 0% | 8.7% | 13.04% | 78.26% |
Table 4.
Numbers and types of operating systems detected for environment B.
| No. | Operating System | Quantity |
|---|---|---|
| 1. | Other (the scanner was unable to recognize the system) | 20 |
| 2. | Linux Kernel 2.6 | 5 |
| 3. | Dell EMC VMX | 2 |
| 4. | Linux Kernel 3.16 on Debian 8.0 (jessie) | 1 |
| 5. | Microsoft Windows Embedded Standard 7 | 1 |
| 6. | Microsoft Windows Server 2008 | 1 |
| 7. | Microsoft Windows Server 2008 R2 | 1 |
| 8. | Microsoft Windows 7 | 1 |
| 9. | Microsoft Windows 10 | 1 |
| 10. | Microsoft Windows Server 2003 Service Pack 2 | 1 |
| 11. | Microsoft Windows Embedded Standard 7 | 1 |
| 12. | Ubuntu 14.04 Linux Kernel 3.13 | 1 |
| In total | 36 |
Table 5.
Comparison of the number of vulnerabilities detected according to the selected standard for environment B.
Table 5.
Comparison of the number of vulnerabilities detected according to the selected standard for environment B.
| Base CVSS 2.0 | Base CVSS 3.x | |
|---|---|---|
| Number of Vulnerabilities | 104 | 54 |
Table 6.
Numbers and types of operating systems detected for environment C.
| No. | Operating System | Quantity |
|---|---|---|
| 1. | Other (the scanner was unable to recognize the system) | 1978 |
| 2. | Check Point GAiA | 22 |
| 3. | Cisco NX-OS | 12 |
| 4. | Linux Kernel 4.19 Debian 10.4 | 11 |
| 5. | Microsoft Windows Server 2012 R2 Standard | 7 |
| 6. | Linux Kernel 3.16 Debian 8.8 | 7 |
| 7. | Linux Kernel 4.9 Debian 9.13 | 6 |
| 8. | Linux Kernel 4.9 Debian 9.7 | 6 |
| 9. | Linux Kernel 4.9 Debian 9.11 | 5 |
| 10. | Linux Kernel 4.19 Debian 10.5 | 3 |
| 11. | Linux Kernel 4.9 Debian 9.6 | 2 |
| 12. | Linux Kernel 4.1.16 | 1 |
| 13. | Linux Kernel 4.9 Debian 9.9. | 1 |
| 14. | Microsoft Windows 10 Enterprise | 1 |
| In total | 2062 |
Table 7.
Comparison of the number of vulnerabilities detected according to the selected standard for environment C.
Table 7.
Comparison of the number of vulnerabilities detected according to the selected standard for environment C.
| Base CVSS 2.0 | Base CVSS 3.x | |
|---|---|---|
| Number of Vulnerabilities | 10,078 | 9730 |
Table 8.
The asset list with the “Medium-High” (MH) flag for the CDP and the number of CVEs detected for environment A.
Table 8.
The asset list with the “Medium-High” (MH) flag for the CDP and the number of CVEs detected for environment A.
| No. | Asset | Confidentiality Requirement (CR) | Integrity Requirement (IR) | Availability Requirement (AR) | CVE Count |
|---|---|---|---|---|---|
| 1. | Low | Medium | High | 19 | |
| 2. | High | Low. | Medium | 4 | |
| 3. | Low | Low | High | 1 | |
| 4. | Low | High | Medium | 1 | |
| 5. | Medium | Low | High | 1 | |
| In total | 29 |
Table 9.
Critical and high vulnerabilities according to the CVSS 3.x environmental assessment for environment A.
Table 9.
Critical and high vulnerabilities according to the CVSS 3.x environmental assessment for environment A.
| No. | Asset | CVE Id | Type | CVSS 3.x Env |
|---|---|---|---|---|
| 1. | CVE-2019-13224 | Use After Free | 9.8 | |
| 2. | Nessus-143449 | PHP 7.3.x < 7.3.25/7.4.x < 7.4.13 | 9.8 | |
| 3. | CVE-2019-11043 | Out-of-bounds Write Classic Buffer Overflow | 9.8 | |
| 4. | CVE-2020-7061 | Out-of-Bounds Read | 9.6 | |
| 5. | Nessus-142591 | PHP < 7.3.24 | 9.4 | |
| 6. | Nessus-140532 | PHP 7.2.x / 7.3.x < 7.3.22 | 9.4 | |
| 7. | CVE-2020-7062 | NULL Pointer Dereference | 9.4 | |
| 8. | CVE-2021-21702 | NULL Pointer Dereference | 9.4 | |
| 9. | CVE-2020-7065 | Out-of-Bounds Write Stack-based Buffer Overflow | 8.8 | |
| 10. | Nessus-129557 | Heap-Based Remote Code Execution Vulnerability | 8.1 | |
| 11. | Nessus-104743 | TLS Version 1.0 Protocol Detection | 7.8 | |
| 12. | CVE-2016-2183 | SWEET32 | 7.5 |
Table 10.
Critical and high vulnerabilities according to the base CVSS 3.x score for environment A.
| No. | Asset | CVE Id | Type | CVSS 3.x Base |
|---|---|---|---|---|
| 1. | CVE-2019-13224 | Use After Free | 9.8 | |
| 2. | Nessus-143449 | PHP 7.3.x < 7.3.25/7.4.x < 7.4.13 | 9.8 | |
| 3. | CVE-2019-11043 | Out-of-bounds Write Classic Buffer Overflow | 9.8 | |
| 4. | CVE-2020-7061 | Out-of-Bounds Read | 9.1 | |
| 5. | CVE-2020-7065 | PHP 7.3.x < 7.3.16 | 8.8 | |
| 6. | Nessus-129557 | Heap-Based Remote Code Execution Vulnerability | 8.1 | |
| 7. | Nessus-142591 | PHP < 7.3.24 | 7.5 | |
| 8. | Nessus-140532 | PHP 7.2.x / 7.3.x < 7.3.22 | 7.5 | |
| 9. | CVE-2020-7062 | NULL Pointer Dereference | 7.5 | |
| 10. | CVE-2021-21702 | NULL Pointer Dereference | 7.5 | |
| 11. | CVE-2020-7067 | PHP Out-of-Bounds Read Vulnerability | 7.5 | |
| 12. | CVE-2016-2183 | SWEET32 | 7.5 |
Table 11.
The estimated work hours required to improve the security of environment A by prioritizing CVSS 2.0.
Table 11.
The estimated work hours required to improve the security of environment A by prioritizing CVSS 2.0.
| 44 h | 187.5 h | 372 h | |
| 3 h | 3 h | 3 h | |
| percentage profit | 93.18% | 98.4% | 99.19% |
Table 12.
The estimated work hours required to improve the security of environment A by prioritizing CVSS 3.x.
Table 12.
The estimated work hours required to improve the security of environment A by prioritizing CVSS 3.x.
| 30 h | 124.5 h | 246 h | |
| 28 h | 115.5 h | 228 h | |
| percentage profit | 6.67% | 7.23% | 7.32% |
Table 13.
The estimated work hours required to improve the security of environment B by prioritizing CVSS 2.0.
Table 13.
The estimated work hours required to improve the security of environment B by prioritizing CVSS 2.0.
| 123 h | 487 h | 955 h | |
| 38 h | 104.5 h | 190 h | |
| percentage profit | 69.105% | 78.54% | 80.10% |
Table 14.
The estimated work hours required to improve the security of environment B by prioritizing CVSS 3.x.
Table 14.
The estimated work hours required to improve the security of environment B by prioritizing CVSS 3.x.
| 73 h | 262 h | 505 h | |
| 73 h | 262 h | 505 h | |
| percentage profit | 0% | 0% | 0% |
Table 15.
Differences in the vulnerabilities’ severity according to the base CVSS 3.x scores and CVSS 3.x environmental scores in environment C.
Table 15.
Differences in the vulnerabilities’ severity according to the base CVSS 3.x scores and CVSS 3.x environmental scores in environment C.
| Low | Medium | High | Critical | |
|---|---|---|---|---|
| Base CVSS 3.x | 802 | 4453 | 2651 | 1824 |
| CVSS 3.x Environmental | 1725 | 4537 | 1981 | 1487 |
| Change | 923 | 84 | −670 | −337 |
Table 16.
The estimated work hours required to improve the security of environment C by prioritizing CVSS 2.0.
Table 16.
The estimated work hours required to improve the security of environment C by prioritizing CVSS 2.0.
| 9846 h | 44,226.5 h | 88,430 h | |
| 23 h | 23 h | 23 h | |
| percentage profit | 99.77% | 99.94% | 99.97% |
Table 17.
The estimated work hours required to improve the security of environment C by prioritizing CVSS 3.x.
Table 17.
The estimated work hours required to improve the security of environment C by prioritizing CVSS 3.x.
| 9753 h | 43,808 h | 87,593 h | |
| 8028 h | 36,045.5 h | 72,068 h | |
| percentage profit | 17.69% | 17.72% | 17.72% |
Publisher’s Note: MDPI stays neutral with regard to jurisdictional claims in published maps and institutional affiliations. |
© 2021 by the authors. Licensee MDPI, Basel, Switzerland. This article is an open access article distributed under the terms and conditions of the Creative Commons Attribution (CC BY) license (https://creativecommons.org/licenses/by/4.0/).
Share and Cite
MDPI and ACS Style
Walkowski, M.; Oko, J.; Sujecki, S. Vulnerability Management Models Using a Common Vulnerability Scoring System. Appl. Sci. 2021, 11, 8735. https://doi.org/10.3390/app11188735
AMA Style
Walkowski M, Oko J, Sujecki S. Vulnerability Management Models Using a Common Vulnerability Scoring System. Applied Sciences. 2021; 11(18):8735. https://doi.org/10.3390/app11188735
Chicago/Turabian StyleWalkowski, Michał, Jacek Oko, and Sławomir Sujecki. 2021. "Vulnerability Management Models Using a Common Vulnerability Scoring System" Applied Sciences 11, no. 18: 8735. https://doi.org/10.3390/app11188735
Note that from the first issue of 2016, this journal uses article numbers instead of page numbers. See further details here.